A Convolutional Neural Network for Anterior Intra-Arterial Thrombus Detection and Segmentation on Non-Contrast Computed Tomography of Patients with Acute Ischemic Stroke

 ,
,  ,
, 
Abstract
1. Introduction
2. Materials and Methods
2.1. Patient Selection and Data Sets
2.2. Pre-Processing
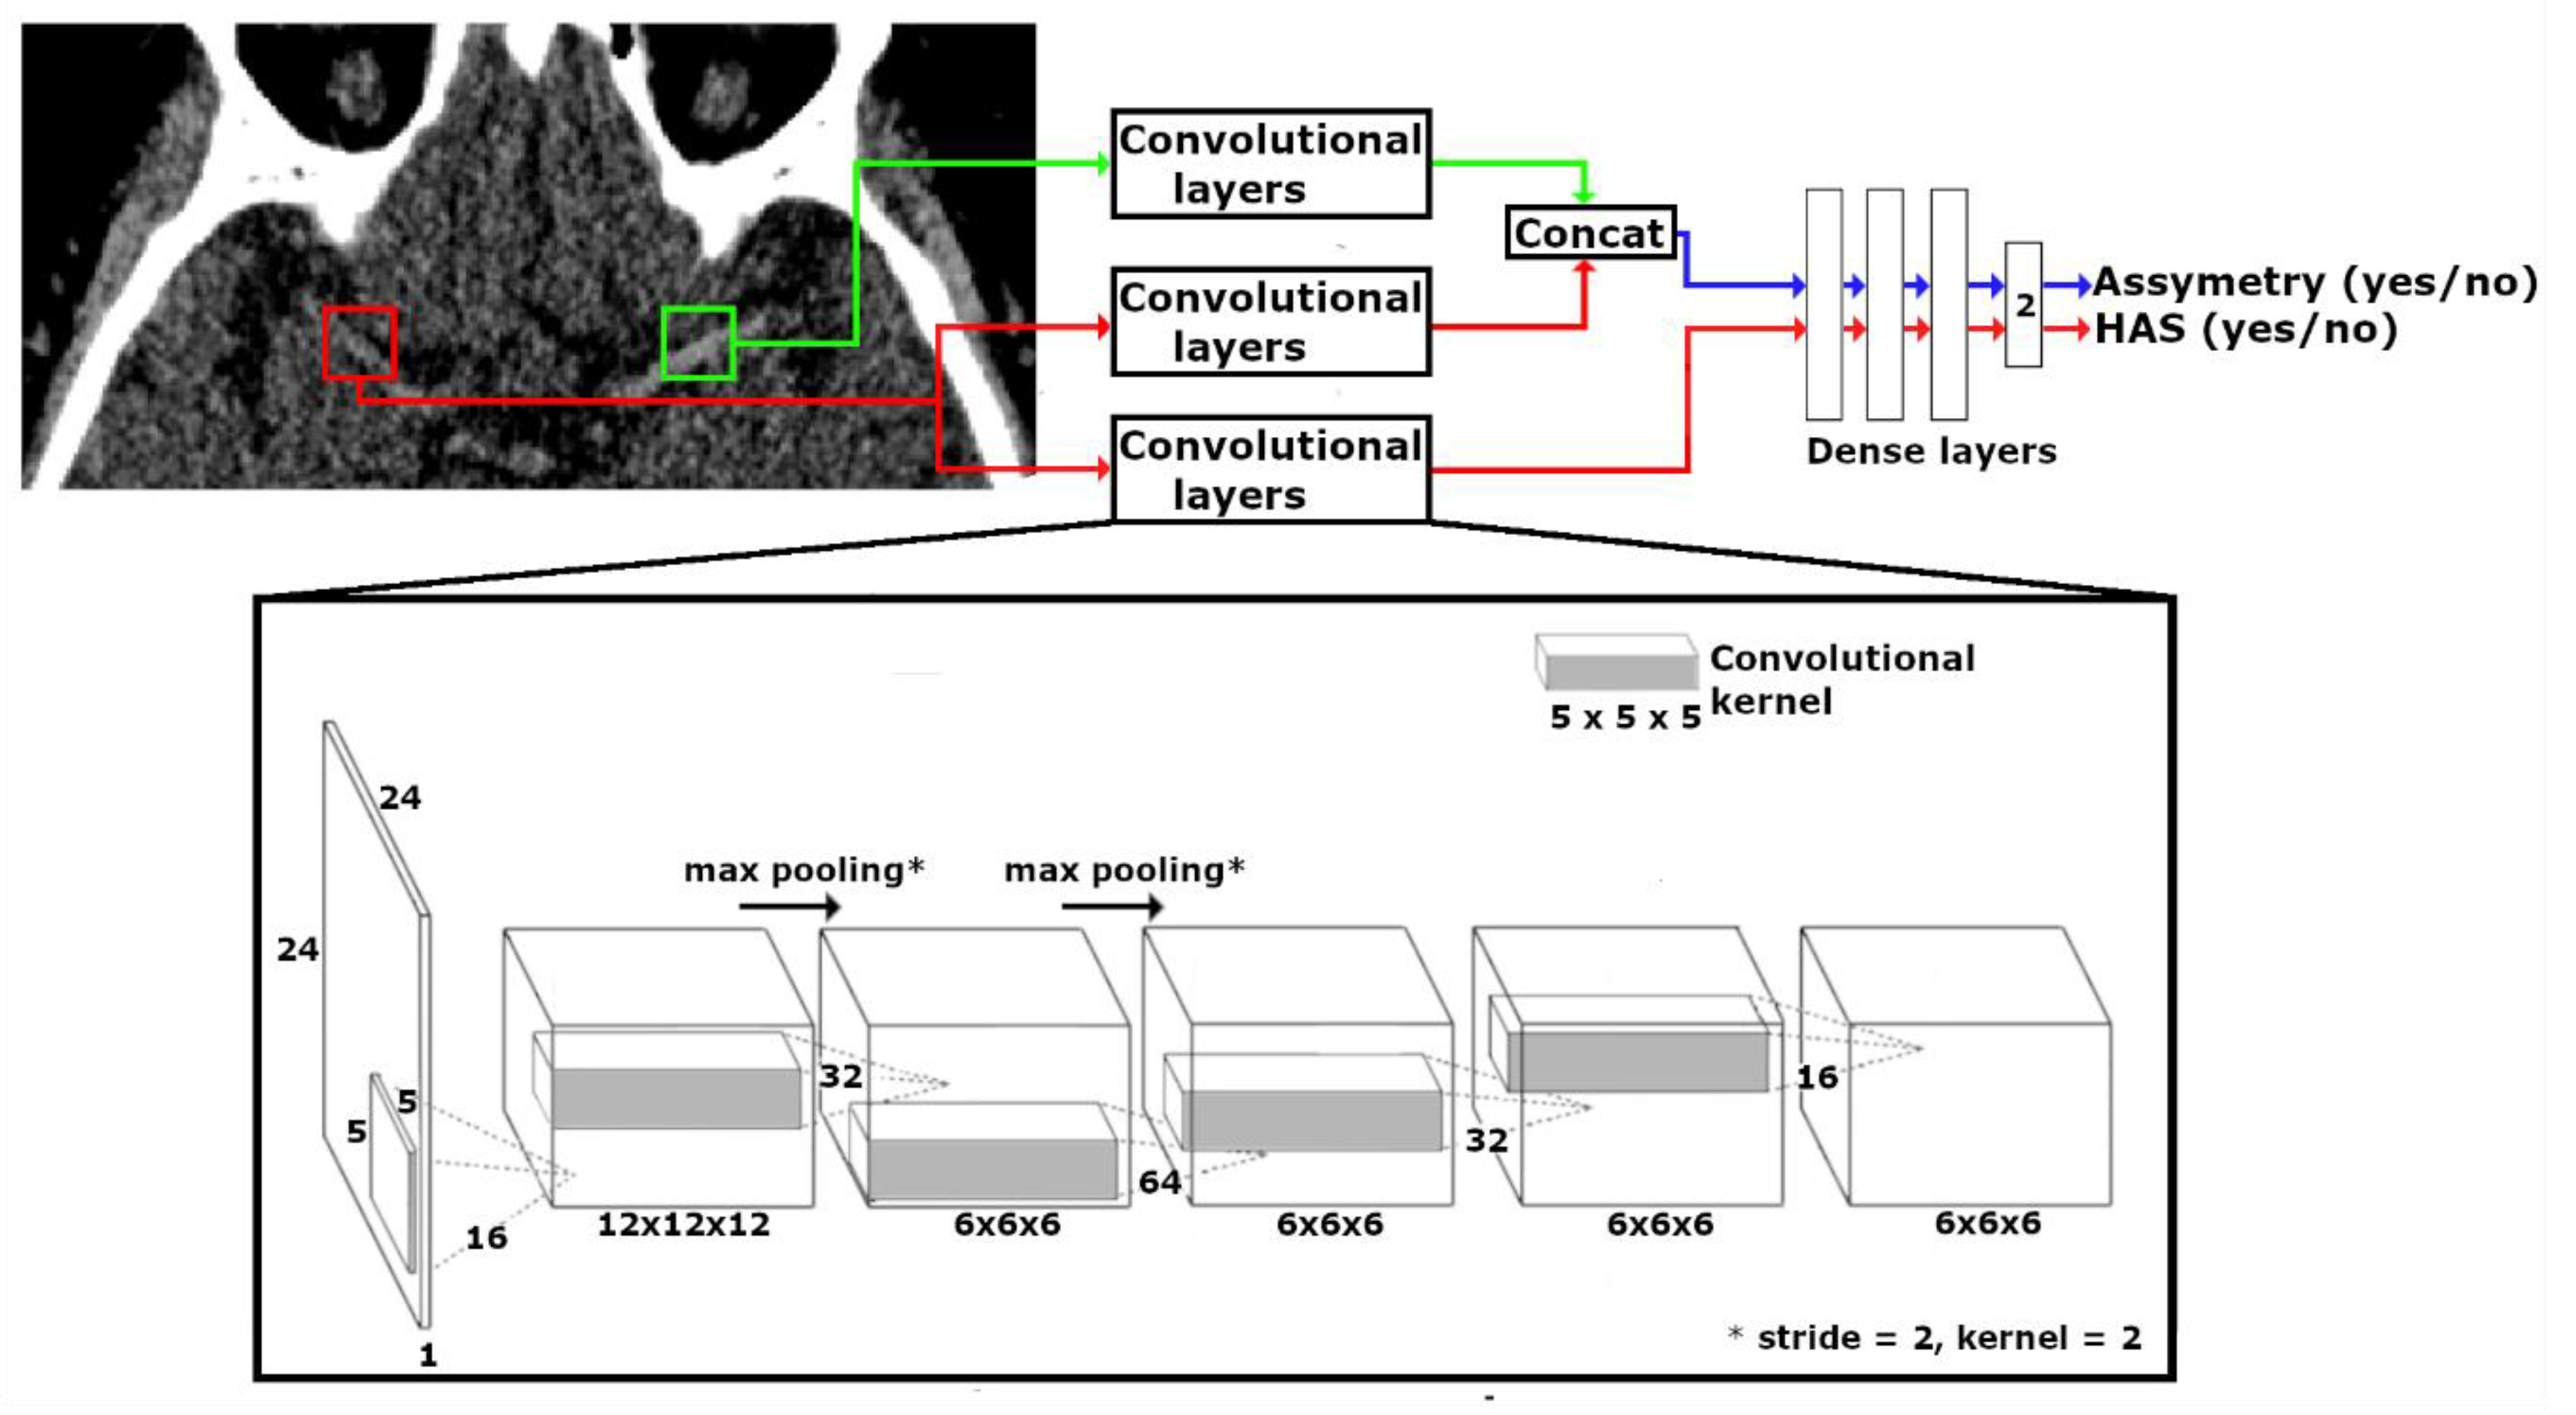
2.3. CNN Design
2.4. Ground Truth
2.5. Classification Pipeline
2.6. Network Evaluation
3. Results
4. Discussion
5. Conclusions
Supplementary Materials
Author Contributions
Funding
Conflicts of Interest
References
- Goyal, M.; Menon, B.K.; van Zwam, W.H.; Dippel, D.W.; Mitchell, P.J.; Demchuk, A.M.; Dávalos, A.; Majoie, C.B.; van der Lugt, A.; De Miquel, M.A.; et al. Endovascular thrombectomy after large-vessel ischaemic stroke: A meta-analysis of individual patient data from five randomised trials. Lancet 2016, 387, 1723–1731. [Google Scholar] [CrossRef]
- Jansen, I.G.H.; Mulder, M.J.H.L.; Goldhoorn, R.J.B. Endovascular treatment for acute ischaemic stroke in routine clinical practice: Prospective, observational cohort study (MR CLEAN Registry). BMJ 2018, 360, k949. [Google Scholar] [CrossRef]
- Saver, J.L. Time is brain–Quantified. Stroke 2006, 37, 263–266. [Google Scholar] [CrossRef] [PubMed]
- Yoo, A.J.; Pulli, B.; Gonzalez, R.G. Imaging-based treatment selection for intravenous and intra-arterial stroke therapies: A comprehensive review. Expert Rev. Cardiovasc. Ther. 2011, 9, 857–876. [Google Scholar] [CrossRef] [PubMed]
- Venema, E.; Mulder, M.J.H.L.; Roozenbeek, B.; Broderick, J.P.; Yeatts, S.D.; Khatri, P.; A Berkhemer, O.; Emmer, B.J.; Roos, Y.B.W.E.M.; Majoie, C.B.L.M.; et al. Selection of patients for intra-arterial treatment for acute ischaemic stroke: Development and validation of a clinical decision tool in two randomised trials. BMJ 2017, 357, j1710. [Google Scholar] [CrossRef] [PubMed]
- Ismail, M.; Armoiry, X.; Tau, N.; Zhu, F.; Sadeh-Gonik, U.; Piotin, M.; Blanc, R.; Mazighi, M.; Bracard, S.; Anxionnat, R.; et al. Mothership versus drip and ship for thrombectomy in patients who had an acute stroke: A systematic review and meta-analysis. J. NeuroInterv. Surg. 2019, 11, 11–19. [Google Scholar] [CrossRef] [PubMed]
- Milne, M.S.; Holodinsky, J.K.; Hill, M.D.; Nygren, A.; Qiu, C.; Goyal, M.; Kamal, N. Drip ‘n Ship Versus Mothership for Endovascular Treatment. Stroke 2017, 48, 791–794. [Google Scholar] [CrossRef]
- Latchaw, R.E.; Alberts, M.J.; Lev, M.H.; Connors, J.J.; Harbaugh, R.E.; Higashida, R.T.; Hobson, R.; Kidwell, C.S.; Koroshetz, W.J.; Mathews, V.; et al. Recommendations for Imaging of Acute Ischemic Stroke. Stroke 2009, 40, 3646–3678. [Google Scholar] [CrossRef]
- Koo, C.; Teasdale, E.; Muir, K.W. What constitutes a true hyperdense middle cerebral artery sign? Cerebrovasc. Dis. 2000, 10, 419–423. [Google Scholar] [CrossRef]
- Mair, G.; Boyd, E.V.; Chappell, F.M.; von Kummer, R.; Lindley, R.I.; Sandercock, P.; Wardlaw, J.M. Sensitivity and specificity of the hyperdense artery sign for arterial obstruction in acute ischemic stroke. Stroke 2015, 46, 102–107. [Google Scholar] [CrossRef]
- Niesten, J.M.; Van Der Schaaf, I.C.; Van Dam, L.; Vink, A.; Vos, J.A.; Schonewille, W.J.; De Bruin, P.C.; Mali, W.P.T.M.; Velthuis, B.K. Histopathologic composition of cerebral thrombi of acute stroke patients is correlated with stroke subtype and thrombus attenuation. PLoS ONE 2014, 9, 12–14. [Google Scholar] [CrossRef] [PubMed]
- Venema, E.; Groot, A.E.; Lingsma, H.F.; Hinsenveld, W.; Treurniet, K.M.; Chalos, V.; Zinkstok, S.M.; Mulder, M.J.; De Ridder, I.R.; Marquering, H.A.; et al. Effect of Interhospital Transfer on Endovascular Treatment for Acute Ischemic Stroke. Stroke 2019, 50, 923–930. [Google Scholar] [CrossRef] [PubMed]
- Gupta, R.; Horev, A.; Nguyen, T.; Gandhi, D.; Wisco, L.; A Glenn, B.; Tayal, A.H.; Ludwig, B.; Terry, J.B.; Gershon, R.Y.; et al. Higher volume endovascular stroke centers have faster times to treatment, higher reperfusion rates and higher rates of good clinical outcomes. J. NeuroInterv. Surg. 2013, 5, 294–297. [Google Scholar] [CrossRef] [PubMed]
- Kamal, N.; Sheng, S.; Xian, Y.; Matsouaka, R.; Hill, M.D.; Bhatt, D.L.; Saver, J.L.; Reeves, M.J.; Fonarow, G.C.; Schwamm, L.H.; et al. Delays in Door-to-Needle Times and Their Impact on Treatment Time and Outcomes in Get with the Guidelines-Stroke. Stroke 2017, 48, 946–954. [Google Scholar] [CrossRef]
- Litjens, G.; Kooi, T.; Bejnordi, B.E.; Setio, A.A.A.; Ciompi, F.; Ghafoorian, M.; Van Der Laak, J.A.; Van Ginneken, B.; Sánchez, C.I. A survey on deep learning in medical image analysis. Med. Image Anal. 2017, 42, 60–88. [Google Scholar] [CrossRef]
- Zhang, R.; Zhao, L.; Lou, W.; Abrigo, J.; Mok, V.C.T.; Chu, W.C.W.; Wang, D.; Shi, L. Automatic Segmentation of Acute Ischemic Stroke From DWI Using 3-D Fully Convolutional DenseNets. IEEE Trans. Med. Imaging 2018, 37, 2149–2160. [Google Scholar] [CrossRef]
- Tetteh, G.; Efremov, V.; Forkert, N.D.; Schneider, M.; Kirschke, J.; Weber, B.; Zimmer, C.; Piraud, M.; Menze, B.H. DeepVesselNet: Vessel Segmentation, Centerline Prediction, and Bifurcation Detection in 3-D Angiographic Volumes. arXiv 2018, arXiv:1803.09340. [Google Scholar]
- Kamnitsas, K.; Ledig, C.; Newcombe, V.F.J.; Simpson, J.P.; Kane, A.D.; Menon, D.K.; Rueckert, D.; Glocker, B. Efficient multi-scale 3D CNN with fully connected CRF for accurate brain lesion segmentation. Med. Image Anal. 2017, 36, 61–78. [Google Scholar] [CrossRef]
- Berkhemer, O.A.; Fransen, P.S.; Beumer, D.; Berg, L.A.V.D.; Lingsma, H.F.; Yoo, A.J.; Schonewille, W.J.; Vos, J.A.; Nederkoorn, P.J.; Wermer, M.J.; et al. A Randomized Trial of Intraarterial Treatment for Acute Ischemic Stroke. N. Engl. J. Med. 2014, 372, 141217070022009. [Google Scholar] [CrossRef]
- Klein, S.; Staring, M.; Murphy, K.; Viergever, M.; Pluim, J. Elastix: A toolbox for intensity-based medical image registration. IEEE Trans. Med. Imaging 2010, 29, 196–205. [Google Scholar] [CrossRef] [PubMed]
- Krizhevsky, A.; Sutskever, I.; Hinton, G.E. ImageNet Classification with Deep Conventional Neural Networks. Adv. Neural Inf. Process. Syst. 2012, 1, 1097–1105. [Google Scholar]
- Santos, E.; Niessen, W.; Yoo, A.J.; Berkhemer, O.A.; Beenen, L.F.; Majoie, C.B.L.M.; Marquering, H.A. Automated Entire Thrombus Density Measurements for Robust and Comprehensive Thrombus Characterization in Patients with Acute Ischemic Stroke. PLoS ONE 2016, 11, 1–16. [Google Scholar] [CrossRef] [PubMed][Green Version]
- Yushkevich, P.A.; Piven, J.; Hazlett, H.C.; Smith, R.G.; Ho, S.; Gee, J.C.; Gerig, G. User-guided 3D active contour segmentation of anatomical structures: Significantly improved efficiency and reliability. Neuroimage 2006, 31, 1116–1128. [Google Scholar] [CrossRef] [PubMed]
- Garner, M.; Lemon, J. _irr: Various Coefficients of Interrater Reliability and Agreement. _ R package version 0.84.1 IFPS. 2019. Available online: https://CRAN.R-project.prd/package=irr (accessed on 29 May 2020).
- Taha, A.A.; Hanbury, A. Metrics for evaluating 3D medical image segmentation: Analysis, selection, and tool. BMC Med. Imaging 2015, 15, 29. [Google Scholar] [CrossRef]
- Yoo, J.; Baek, J.-H.; Park, H.; Song, D.; Kim, K.; Hwang, I.G.; Kim, Y.D.; Kim, S.H.; Lee, H.S.; Ahn, S.H.; et al. Thrombus Volume as a Predictor of Nonrecanalization After Intravenous Thrombolysis in Acute Stroke. Stroke 2018, 49, 2108–2115. [Google Scholar] [CrossRef] [PubMed]
- Moftakhar, P.; English, J.D.; Cooke, D.L.; Kim, W.T.; Stout, C.; Smith, W.S.; Dowd, C.F.; Higashida, R.T.; Halbach, V.V.; Hetts, S. Density of Thrombus on Admission CT Predicts Revascularization Efficacy in Large Vessel Occlusion Acute Ischemic Stroke. Stroke 2013, 44, 243–246. [Google Scholar] [CrossRef]
- Murray, N.M.; Unberath, M.; Hager, G.D.; Hui, F.K. Artificial intelligence to diagnose ischemic stroke and identify large vessel occlusions: A systematic review. J. NeuroInterv. Surg. 2020, 12, 156–164. [Google Scholar] [CrossRef]
- Chatterjee, A.; Somayaji, N.R.; Kabakis, I.M. Abstract WMP16: Artificial Intelligence Detection of Cerebrovascular Large Vessel Occlusion–Nine Month, 650 Patient Evaluation of the Diagnostic Accuracy and Performance of the Viz.ai LVO Algorithm. In Proceedings of the International Stroke Conference 2019 Moderated Poster Abstracts Session Title: Acute Neuroimaging Moderated Poster Tour, Honolulu, HI, USA, 10–12 February 2019; Volume 50 (Suppl. 1). [Google Scholar]
- Barreira, C.; Bouslama, M.; Lim, J.; Al-Bayati, A.; Saleem, Y.; Devlin, T.; Haussen, D.; Froehler, M.; Grossberg, J.; Baxter, B.; et al. E-108 Aladin study: Automated large artery occlusion detection in stroke imaging study—A multicenter analysis. J. NeuroInterv. Surg. 2018, 10 (Suppl. 2). [Google Scholar] [CrossRef]
- Lisowska, A.; Beveridge, E.; Muir, K.; Poole, I. Thrombus Detection in CT Brain Scans using a Convolutional Neural Network. In Proceedings of the 10th International Joint Conference on Biomedical Engineering Systems and Technologies(BIOSTEC 2017), Porto, Portugal, 21–23 February 2017; pp. 24–33. [Google Scholar]
- Santos, E.; Dankbaar, J.; Treurniet, K.M.; Horsch, A.; Roos, Y.; Kappelle, L.J.; Niessen, W.; Majoie, C.B.; Velthuis, B.; Marquering, H.A.; et al. Permeable Thrombi Are Associated With Higher Intravenous Recombinant Tissue-Type Plasminogen Activator Treatment Success in Patients With Acute Ischemic Stroke. Stroke 2016, 47, 2058–2065. [Google Scholar] [CrossRef]
- Liebeskind, D.S.; Sanossian, N.; Yong, W.H.; Starkman, S.; Tsang, M.P.; Moya, A.L.; Zheng, D.D.; Abolian, A.M.; Kim, D.; Ali, L.K.; et al. CT and MRI early vessel signs reflect clot composition in acute stroke. Stroke 2011, 42, 1237–1243. [Google Scholar] [CrossRef]


| CNN | Neuroradiologist 1 | Neuroradiologist 2 | |
|---|---|---|---|
| Sensitivity | 0.86 | 0.93 | 0.78 |
| Specificity | 0.69 | 0.60 | 0.88 |
| Precision | 0.75 | 0.74 | 0.82 |
| Correct thrombus location | 0.79 | 0.81 | 0.77 |
| Thrombus Volume | |||
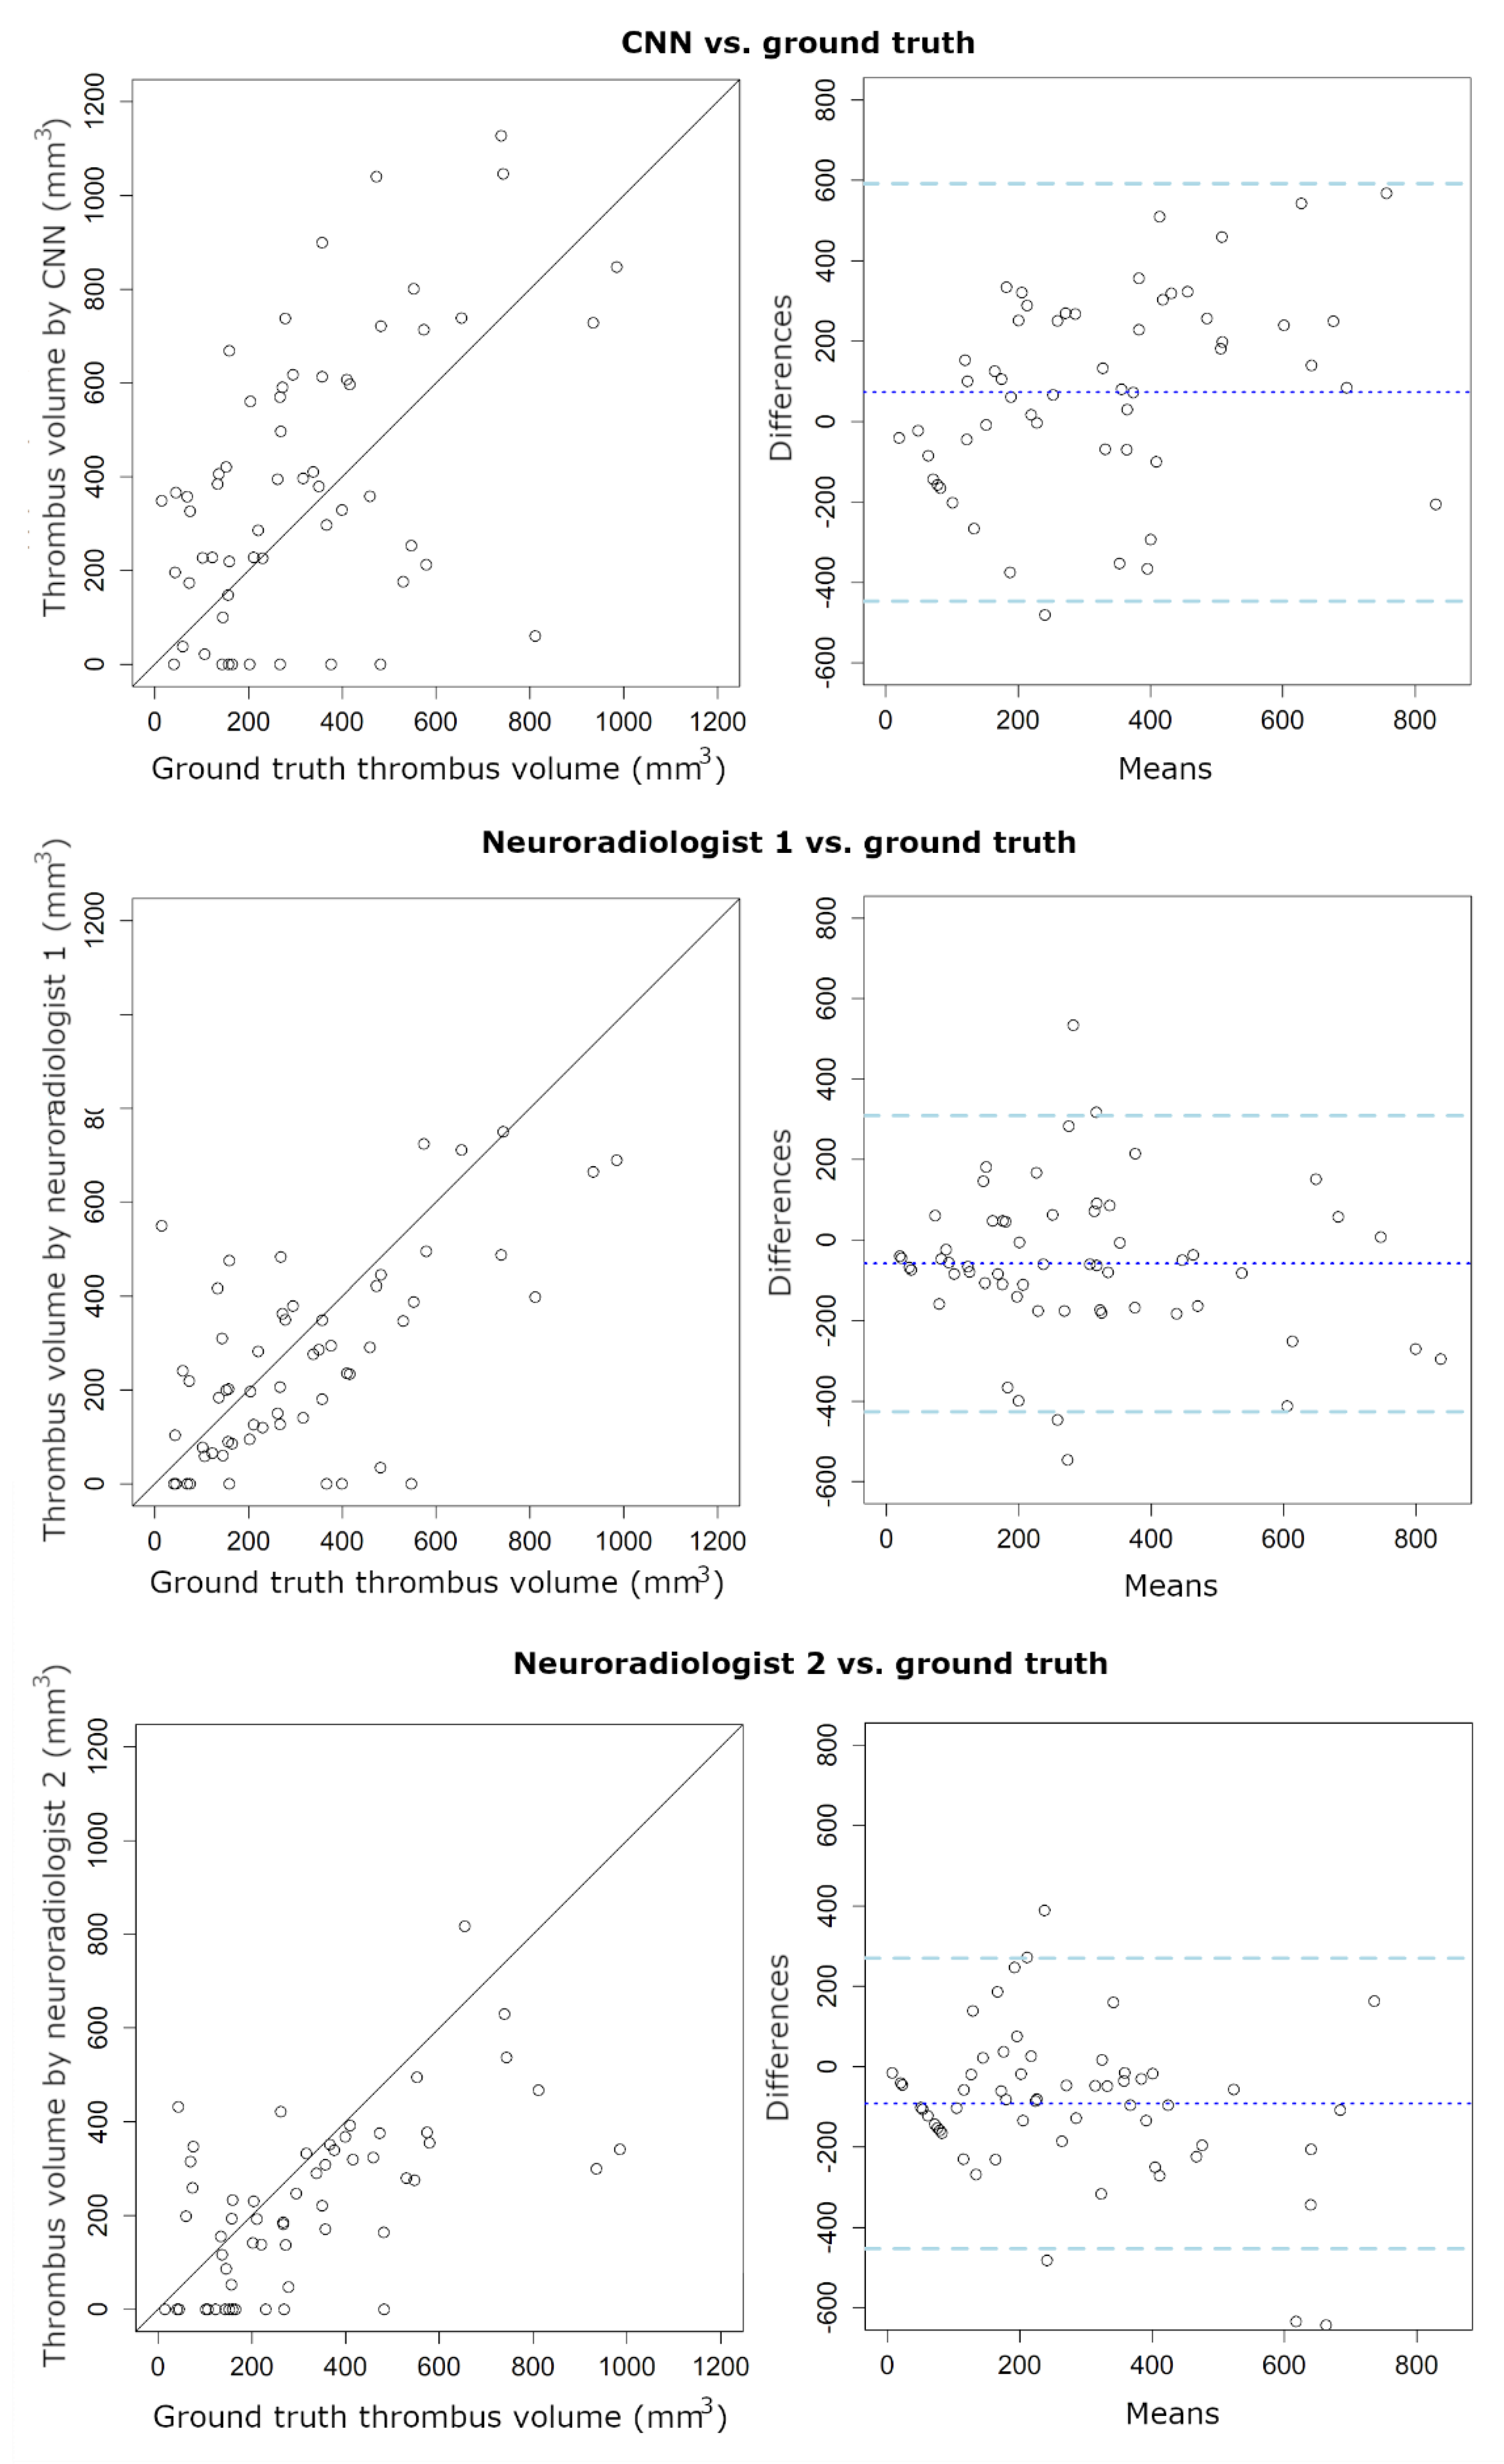
| ICC | 0.49 | 0.37 | 0.55 |
| (95% CI: 0.27 to 0.66) | (95% CI: 0.42 to 0.75) | (95% CI: 0.29 to 0.72) | |
| Bias (mm3) | 73 | −58.6 | −91.5 |
| LoA (mm3) | −447/593 | −427/309 | −453/269 |
| Thrombus Density | |||
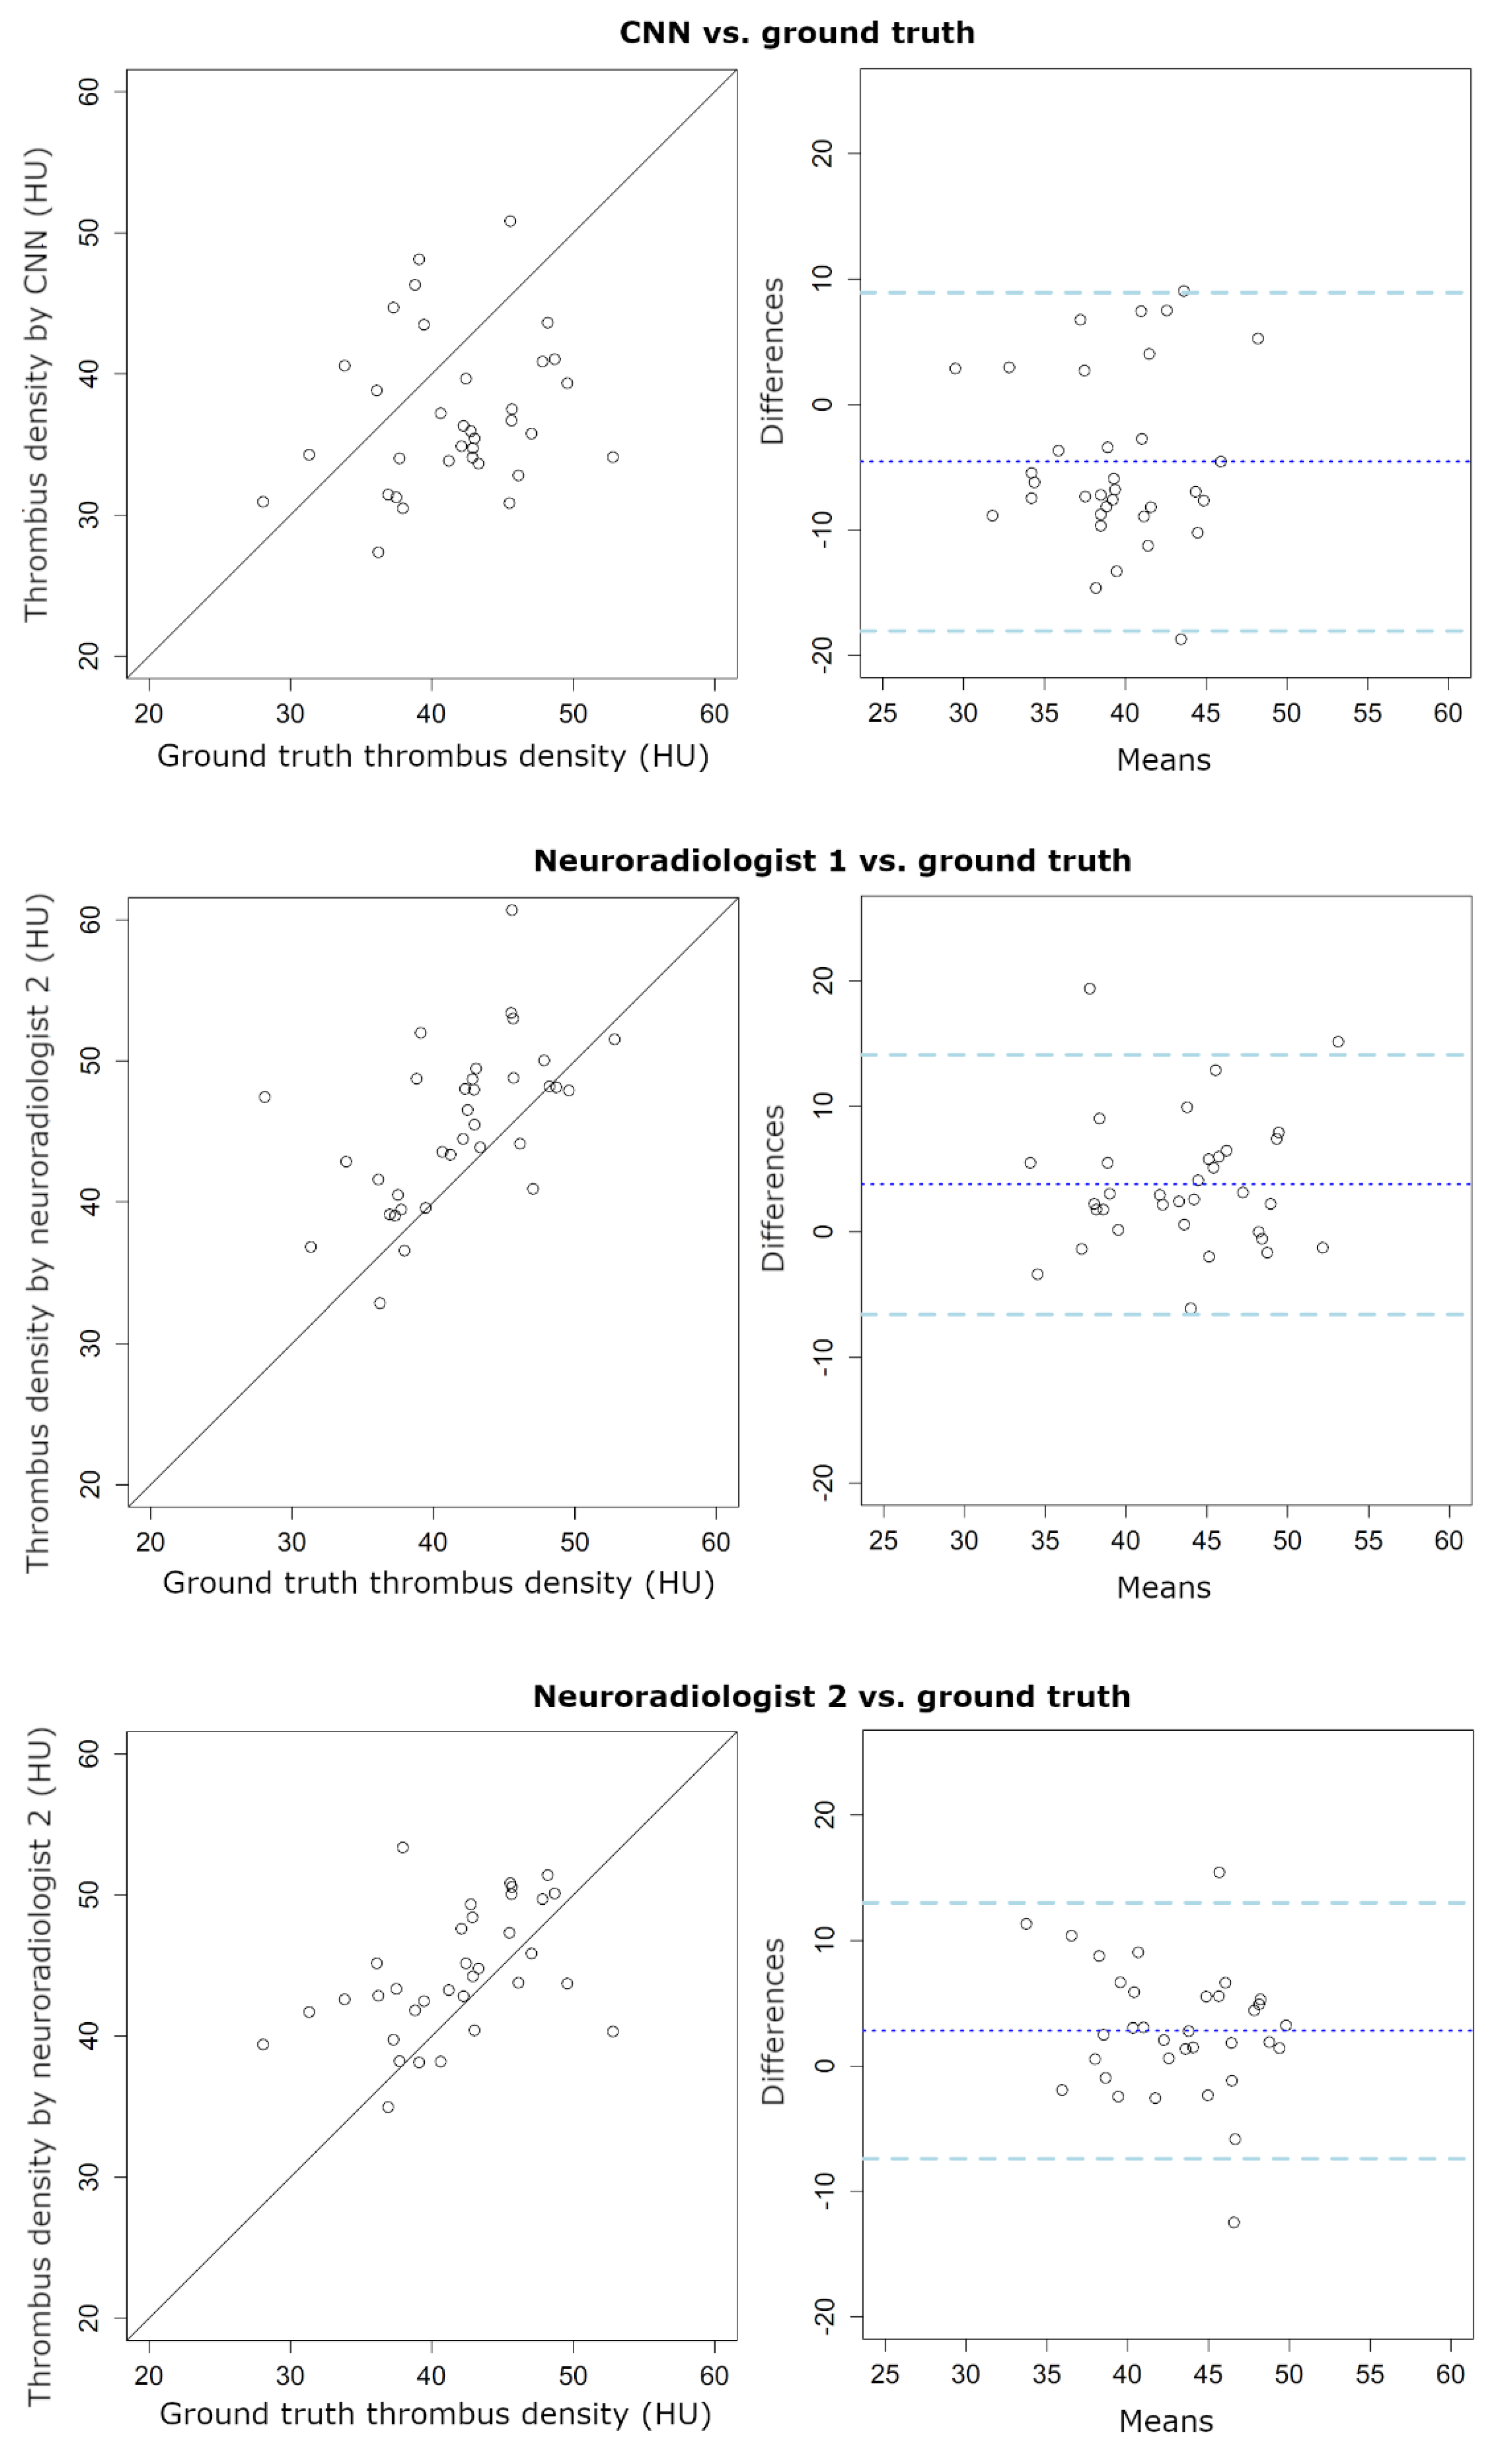
| ICC | 0.14 | 0.45 | 0.40 |
| (95% CI: -0.12 to 0.41) | (95% CI: 0.07 to 0.70) | (95% CI: 0.07 to 0.64) | |
| Bias (HU) | −4.6 | 3.8 | 2.8 |
| LoA (HU) | −18/9 | −7/14 | −7/13 |
© 2020 by the authors. Licensee MDPI, Basel, Switzerland. This article is an open access article distributed under the terms and conditions of the Creative Commons Attribution (CC BY) license (http://creativecommons.org/licenses/by/4.0/).
Share and Cite
Tolhuisen, M.L.; Ponomareva, E.; Boers, A.M.M.; Jansen, I.G.H.; Koopman, M.S.; Sales Barros, R.; Berkhemer, O.A.; van Zwam, W.H.; van der Lugt, A.; Majoie, C.B.L.M.; et al. A Convolutional Neural Network for Anterior Intra-Arterial Thrombus Detection and Segmentation on Non-Contrast Computed Tomography of Patients with Acute Ischemic Stroke. Appl. Sci. 2020, 10, 4861. https://doi.org/10.3390/app10144861
Tolhuisen ML, Ponomareva E, Boers AMM, Jansen IGH, Koopman MS, Sales Barros R, Berkhemer OA, van Zwam WH, van der Lugt A, Majoie CBLM, et al. A Convolutional Neural Network for Anterior Intra-Arterial Thrombus Detection and Segmentation on Non-Contrast Computed Tomography of Patients with Acute Ischemic Stroke. Applied Sciences. 2020; 10(14):4861. https://doi.org/10.3390/app10144861
Chicago/Turabian StyleTolhuisen, Manon L., Elena Ponomareva, Anne M. M. Boers, Ivo G. H. Jansen, Miou S. Koopman, Renan Sales Barros, Olvert A. Berkhemer, Wim H. van Zwam, Aad van der Lugt, Charles B. L. M. Majoie, and et al. 2020. "A Convolutional Neural Network for Anterior Intra-Arterial Thrombus Detection and Segmentation on Non-Contrast Computed Tomography of Patients with Acute Ischemic Stroke" Applied Sciences 10, no. 14: 4861. https://doi.org/10.3390/app10144861
APA StyleTolhuisen, M. L., Ponomareva, E., Boers, A. M. M., Jansen, I. G. H., Koopman, M. S., Sales Barros, R., Berkhemer, O. A., van Zwam, W. H., van der Lugt, A., Majoie, C. B. L. M., & Marquering, H. A. (2020). A Convolutional Neural Network for Anterior Intra-Arterial Thrombus Detection and Segmentation on Non-Contrast Computed Tomography of Patients with Acute Ischemic Stroke. Applied Sciences, 10(14), 4861. https://doi.org/10.3390/app10144861