Article

Molecular Assembling in Mixtures of Hydrophilic 1-Butyl-1-Methylpyrrolidinium Dicyanamide Ionic Liquid and Water

by
Oriele Palumbo
1,
Francesco Trequattrini
1,2,
Jean-Blaise Brubach
3,
Pascale Roy
3 and
Annalisa Paolone
1,*
1
Consiglio Nazionale delle Ricerche—Istituto dei Sistemi Complessi, U.O.S. La Sapienza, Piazzale A. Moro 5, 00185 Roma, Italy
2
Dipartimento di Fisica, Sapienza Università di Roma, Piazzale A. Moro 5, 00185 Roma, Italy
3
Synchrotron SOLEIL, L’Orme des Merisiers Saint-Aubin, BP 48 91192 Gif-sur-Yvette CEDEX, France
*
Author to whom correspondence should be addressed.
Appl. Sci. 2020, 10(14), 4837; https://doi.org/10.3390/app10144837
Submission received: 12 June 2020 / Revised: 7 July 2020 / Accepted: 11 July 2020 / Published: 14 July 2020
(This article belongs to the Special Issue Self-Assembly in Chemistry and Supramolecular Chemistry)

Abstract

:
The infrared absorbance spectrum of the ionic liquid 1-butyl-1-methylpyrrolidinium dicyanamide, mixed with water at two different concentrations, was measured between 160 and 300 K in the mid infrared range. Both mixtures do not crystallize on cooling; however, remarkably, the one with an ionic liquid (IL):water composition of 1:3 displays a cold crystallization process on heating in a restricted temperature range between 240 and 250 K. A portion of the water participates to the cold crystallization. On the contrary, with an IL:water composition of 1:6.6 no crystallization takes place. Upon water addition the vibration frequencies of the anion and of some lines of the cation are blue shifted, while the absorption lines of water are red shifted. These facts are interpreted as the evidence of the occurrence of the hydrogen bonding of water, as the hydrogen bonding acceptor with respect to the anion (anion∙∙∙O-H bonds develop) and as hydrogen donor for the cation (C-H∙∙∙O bonds can form). Microscopic inhomogeneities in the samples and their evolution with temperature are discussed.

1. Introduction

For many applications of ionic liquids (ILs), mixing them with solvents—in particular, water—is required. Among such possible utilizations one can cite the dissolution of cellulose [1], otherwise insoluble in pure water, specific treatments to recover organic pollutants [2], the storage and modulations of properties of biomolecules [3], the use as electrolytes in electrochemical devices [4] such as fuel cells [5], the production of microemulsions for synthesis, (bio-)catalysis, polymerization, (nano-)material preparation, drug delivery and separations [6]. Hence, a large amount of research was devoted to the investigation of the phase equilibria of ILs with various solvents and some predictive models were proposed [7]. However, compared to the extensive studies of the macroscopic properties, such as excess volume, viscosity or mixing enthalpy, little is known concerning the microscopic interaction of ILs and water [8].
Due to the limited amount of experimental data on the interactions of ILs and water at the molecular level [9,10,11,12,13,14,15,16,17,18,19], there is no comprehensive theory or a detailed framework for these properties. Nevertheless, some general picture slowly emerges [8,20,21]. At extreme low water concentrations [9], all water molecules are isolated in the IL and do not establish bounds. With increasing H2O concentrations, water tends to be bound more strongly to the anions than to the cations [22]. The interaction between anion and cation in ionic couples are reduced, due to the competing interaction with water. The main steps are as follows: (1) the continuum network structure of ILs is gradually transformed into ion-clusters, (2) the ion clusters are dissociated into ion-pairs surrounded by water and (3) the ion-pairs are dissociated into hydrated and separated ions [8]. Notice that the hydration is not always completed, even at extremely high concentrations of water, as the separation of ionic couples is more effective in aprotic ionic liquid than in protic ones where strong interactions between anion and cation remain.
A valuable contribution to the development of this general description has been provided by computational investigations of the mixtures of ionic liquids and water [23,24,25,26]. According to this model, the small quantity of water in ILs gives rise to separated solvent molecules, while for increasing H2O concentration a water percolation network is formed and the hydrophobicity of the anion controls the water pocket size [23]. There is a large consensus on the fact that water molecules solvated in aprotic ILs assemble in cavities inside the polar nanoregions of ILs, that progressively grow until they form a percolating network [23]. On the other hand, water more homogeneously mixes with protic ILs, that are able to form hydrogen bonds.
It must be noted that all the described properties are valid at sufficient low temperatures so that the decomposition of anions due to the interaction with water molecules is avoided. Such an effect was observed for example for the BF4 and PF6 anions [27].
Studies of mixtures of ILs with solvents were also extended to alcohols [28,29,30] and acetone [31]. In some cases, phase diagrams of these mixtures have been constructed, as in the case of choline bis(trifluoromethylsulfonyl)imide and N,N,N-trimethylpropylammonium bis(trifluoromethylsulfonyl)imide with propanol [30]. These mixtures can crystallize at low temperature in the whole concentration range, but for concentrations of propanol higher than 35 mol%, one observes also a clouding point.
Concerning the water mixtures of ILs and water, little is known about the temperature dependence of the interactions between IL and solvent or about the occurrence of crystallization or glass transition at low temperatures. Quite recently the infrared spectra of two mixtures of 1-butyl-3-methylimidazolium dicyanamide ionic liquid and water were investigated down to 140 K, with a special attention to the changes of the environment of water molecules and the interface between water and ionic liquid as a function of temperature [32]. A cold crystallization only occurred for small water concentrations absorbed from the atmosphere, while for higher concentrations (0.024 H2O molecules per ionic couple) the crystallization was not observed. The analysis of the O-H stretching bands indicated the existence of two different “liquid like” water environments. When cold crystallization took place, the water molecules, which seemed less coordinated with the other H2O molecules and mostly linked to the anions, become part of the crystallized sample. For all water concentrations, it seems that at the microscopic level the samples were not homogeneous, but more likely they were composed of separated clusters or regions of bulk water confined in the ionic liquid.
In the present paper, we extend this low temperature investigation of the infrared spectra of water-IL mixtures to the hydrophilic 1-butyl-1-methylpyrrolidinium dicyanamide ionic liquid at larger concentrations of water, in order to explore the water-rich region of the phase diagram.

2. Materials and Methods

The 1-Butyl-1-methylpyrrolidinium dicyanamide (PYR14-DCA) was purchased from Solvionic. The structure of the ions compositing this IL are displayed in Figure 1. As the purity of the IL was 99.5%, the sample was investigated as received without further purification. It must be noted that despite that the initial purity of the sample was very high and the initial water content was extremely low, during the charging of the cell, it absorbed a large quantity of water due to its hygroscopic nature, as it will be more deeply commented in the following Section “Results”.
Infrared absorbance measurements were conducted at the AILES beamline of Soleil Synchrotron, with a resolution of 1 cm−1, using a Bruker IFS125 HR spectrometer. A thin layer of liquid was placed in a vacuum sealed cell for liquids, equipped with two diamond optical windows and a 6 μm thick spacer. The temperature was varied in the range 300–160 K by means of the Cryomech cryostat available at AILES with a temperature rate of 5 K∙min−1. The spectra were recorded in the mid-infrared range by combining a KBr beamsplitter and a wide range low noise MCT [33].
Measurements were performed both on the as received sample (in the following called PYR14-DCA) and on an intentionally hydrated sample (in the following indicated as PYR14-DCA + H2O), obtained by mixing the starting materials with 57 wt% of bidistilled water, corresponding to the addition of ~6.6 water molecules for each ionic couple.
The dicyanamide anion and the 1-butyl-1-methylpyrrolidinium cation were also investigated computationally in vacuum by means of DFT calculations at the B3LYP level of theory, using the 6–31G** basis set, as reported in Reference [32,34]. After optimization of the geometry, the infrared vibrational frequencies and intensities were calculated. A simulated absorption spectrum was constructed by summing Gaussian curves centered at each calculated vibration frequency, with a 10 cm−1 linewidth and an intensity proportional to the calculated one.

3. Results

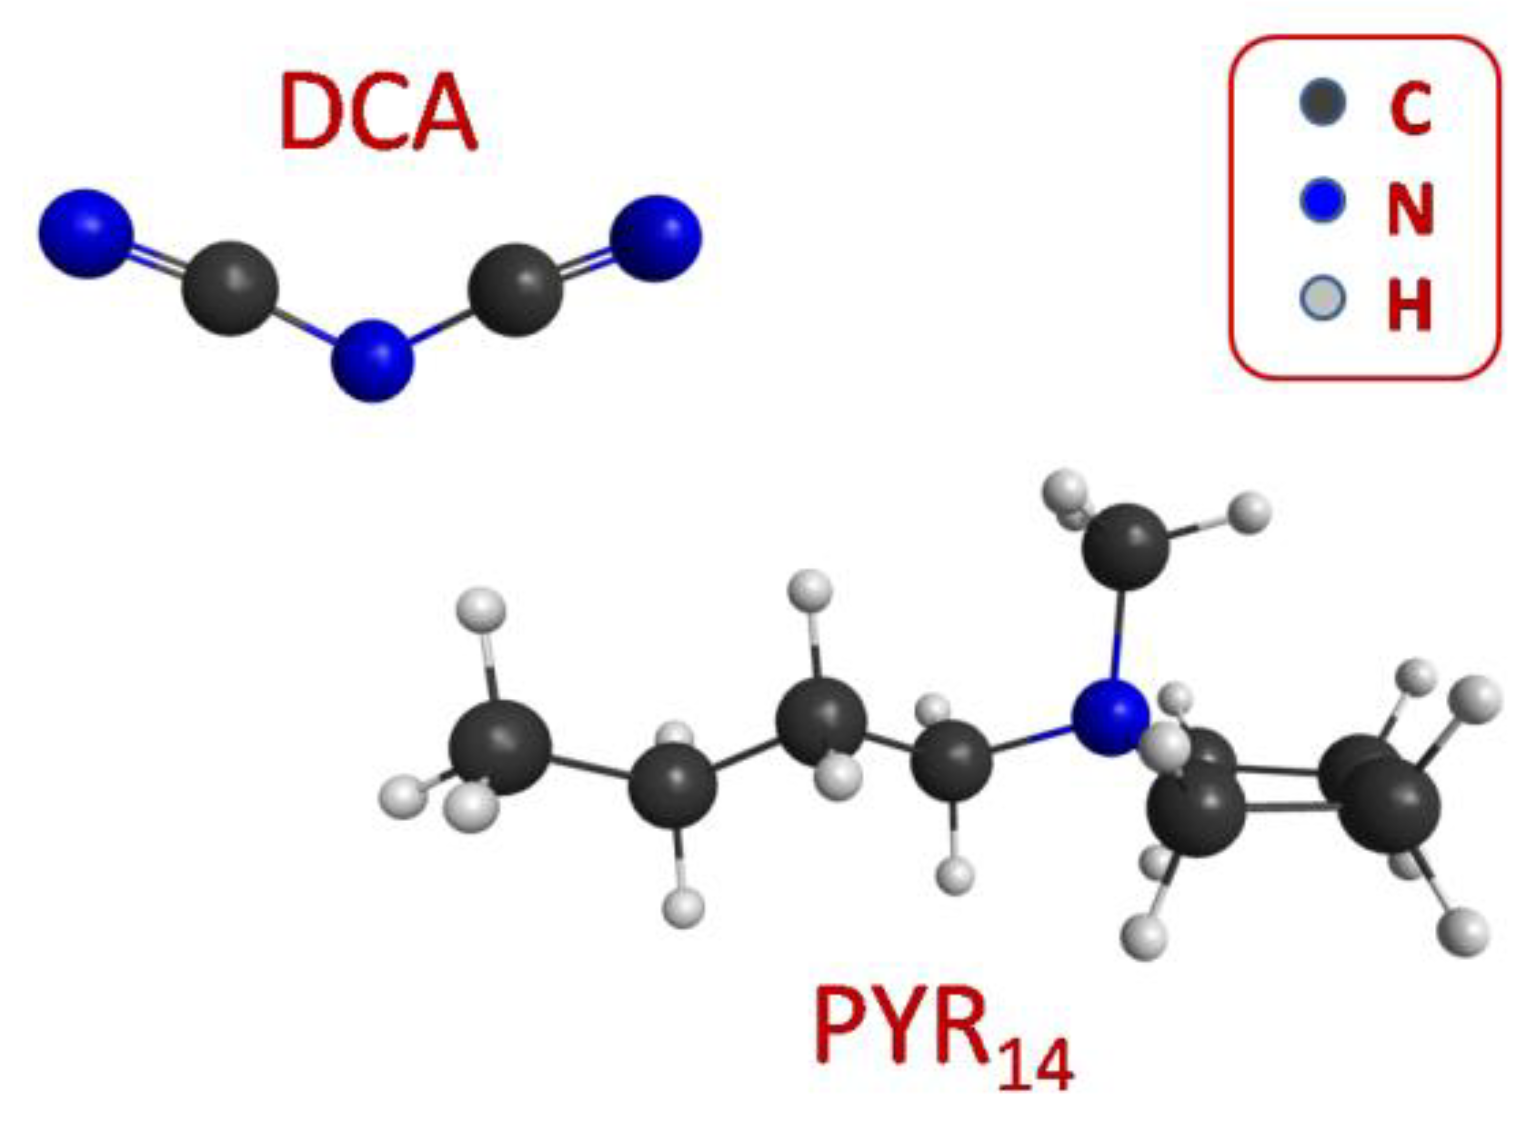
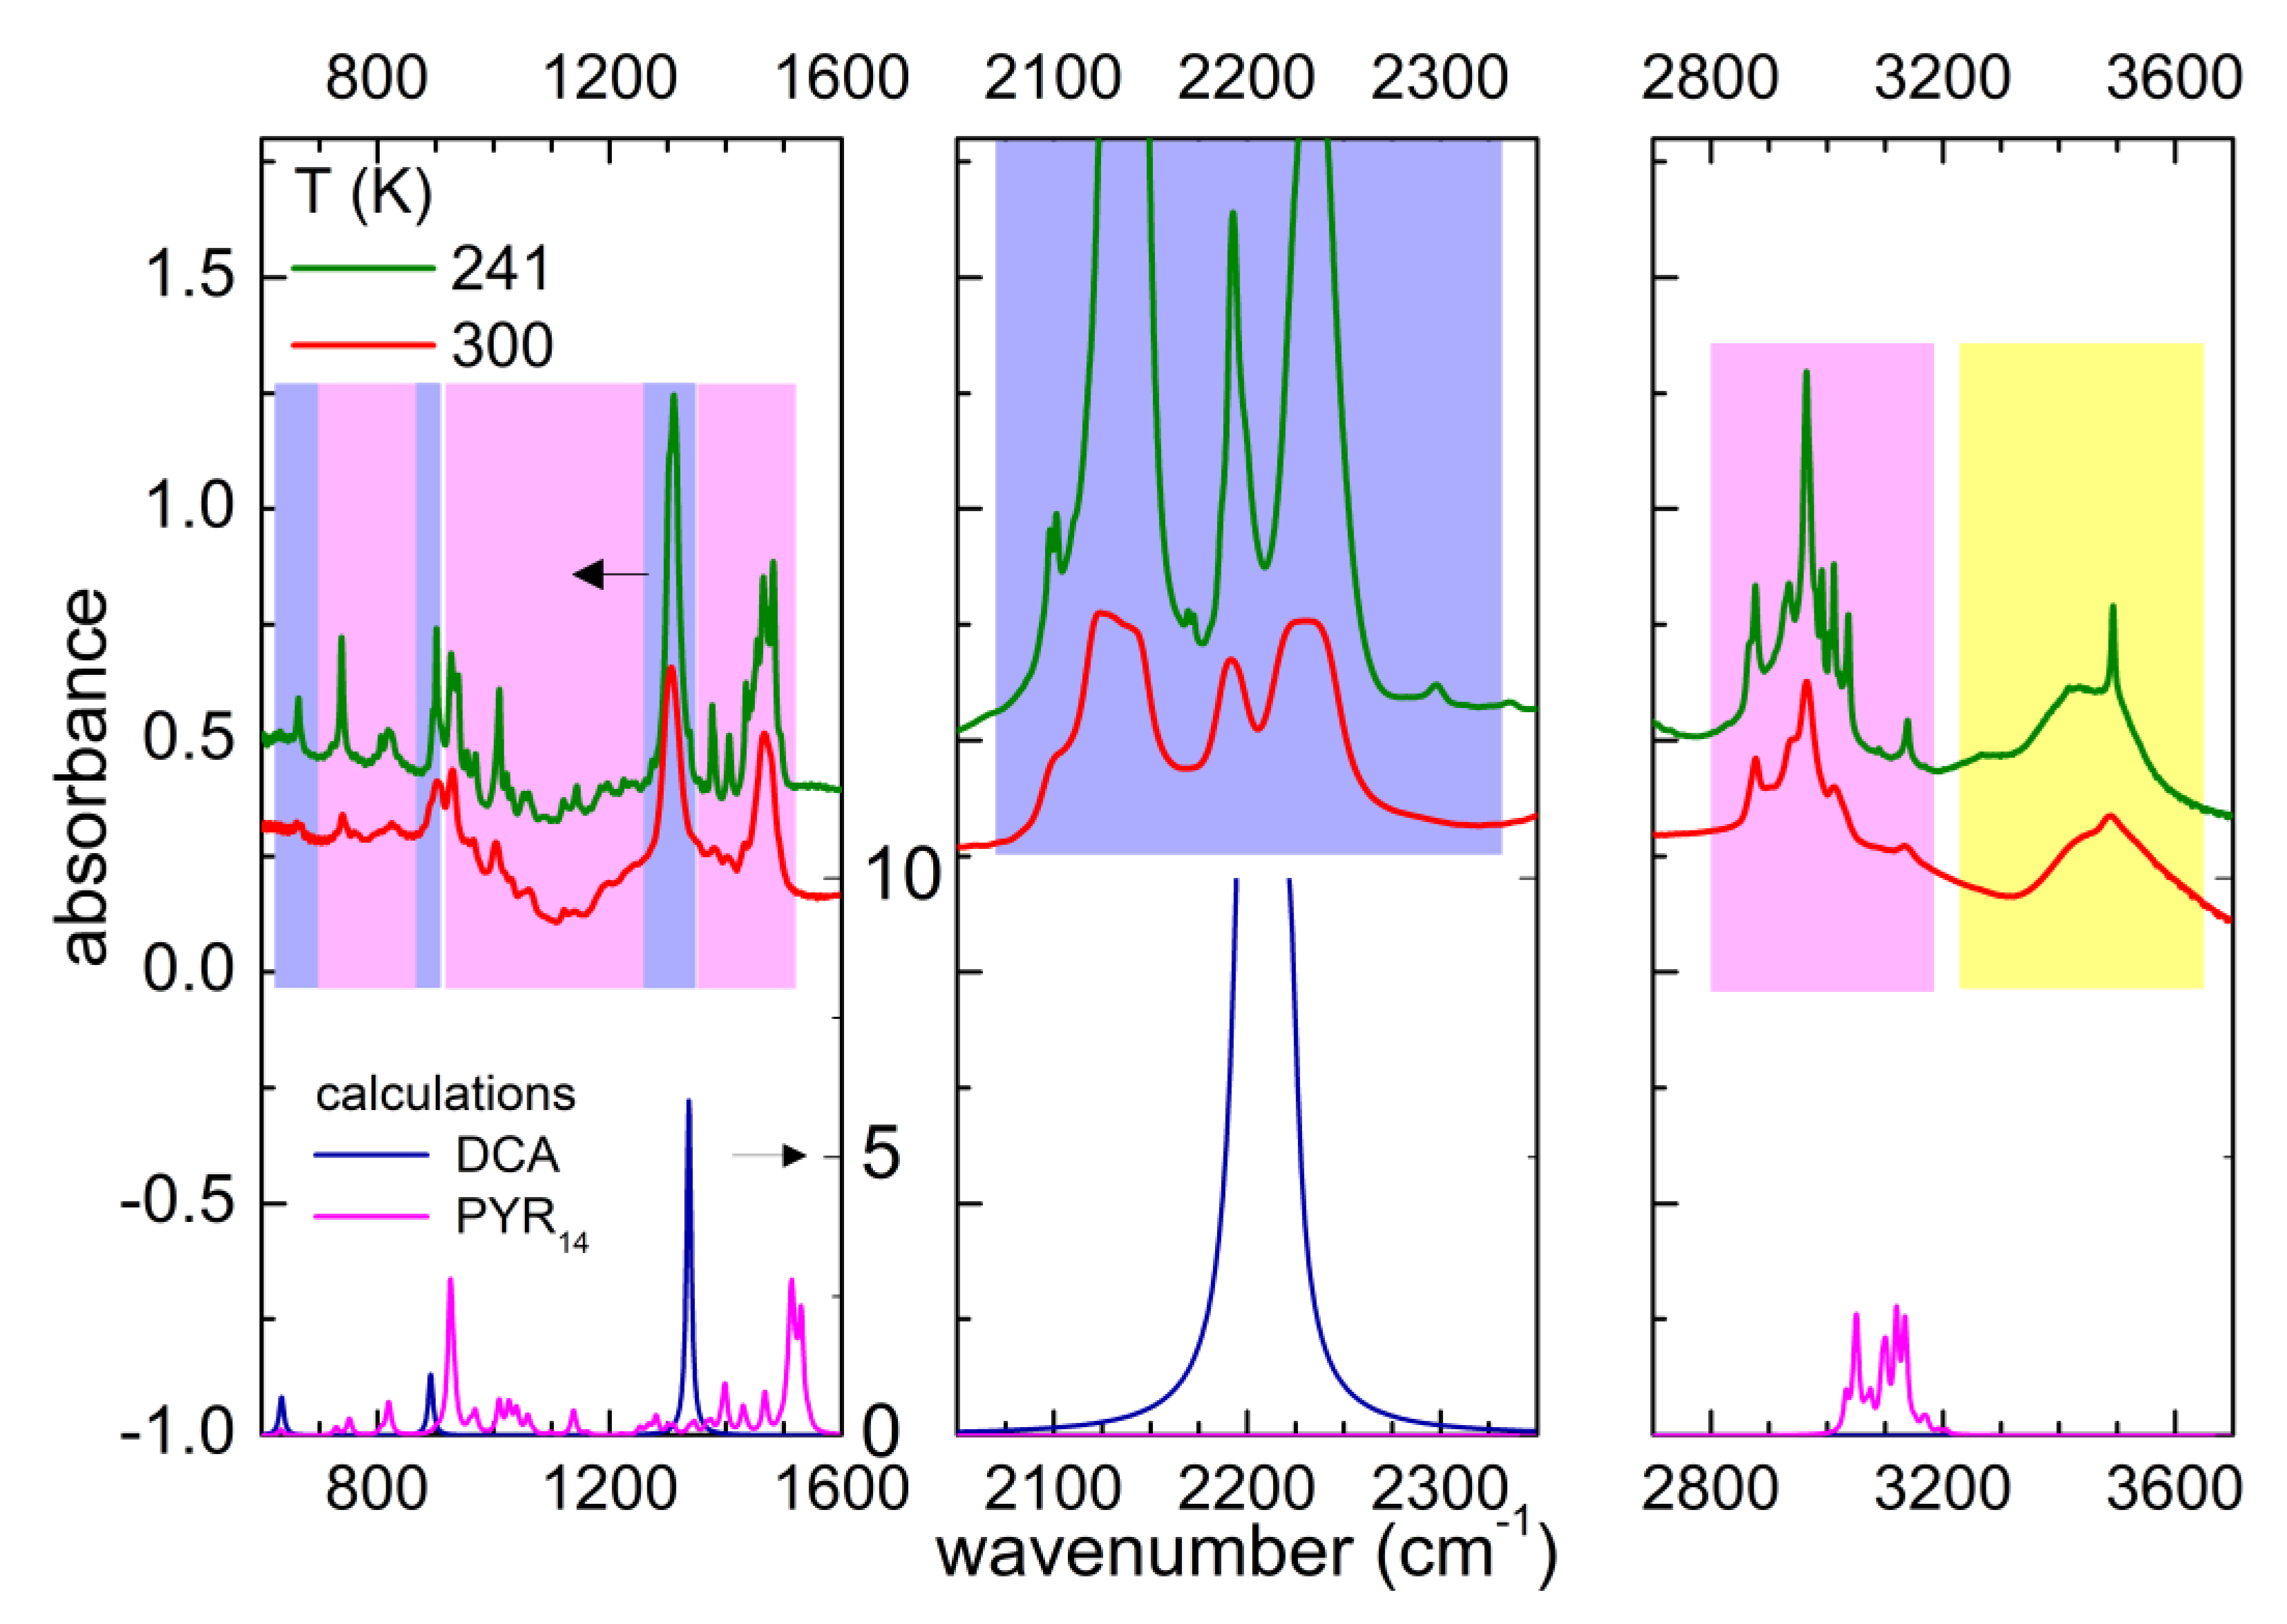
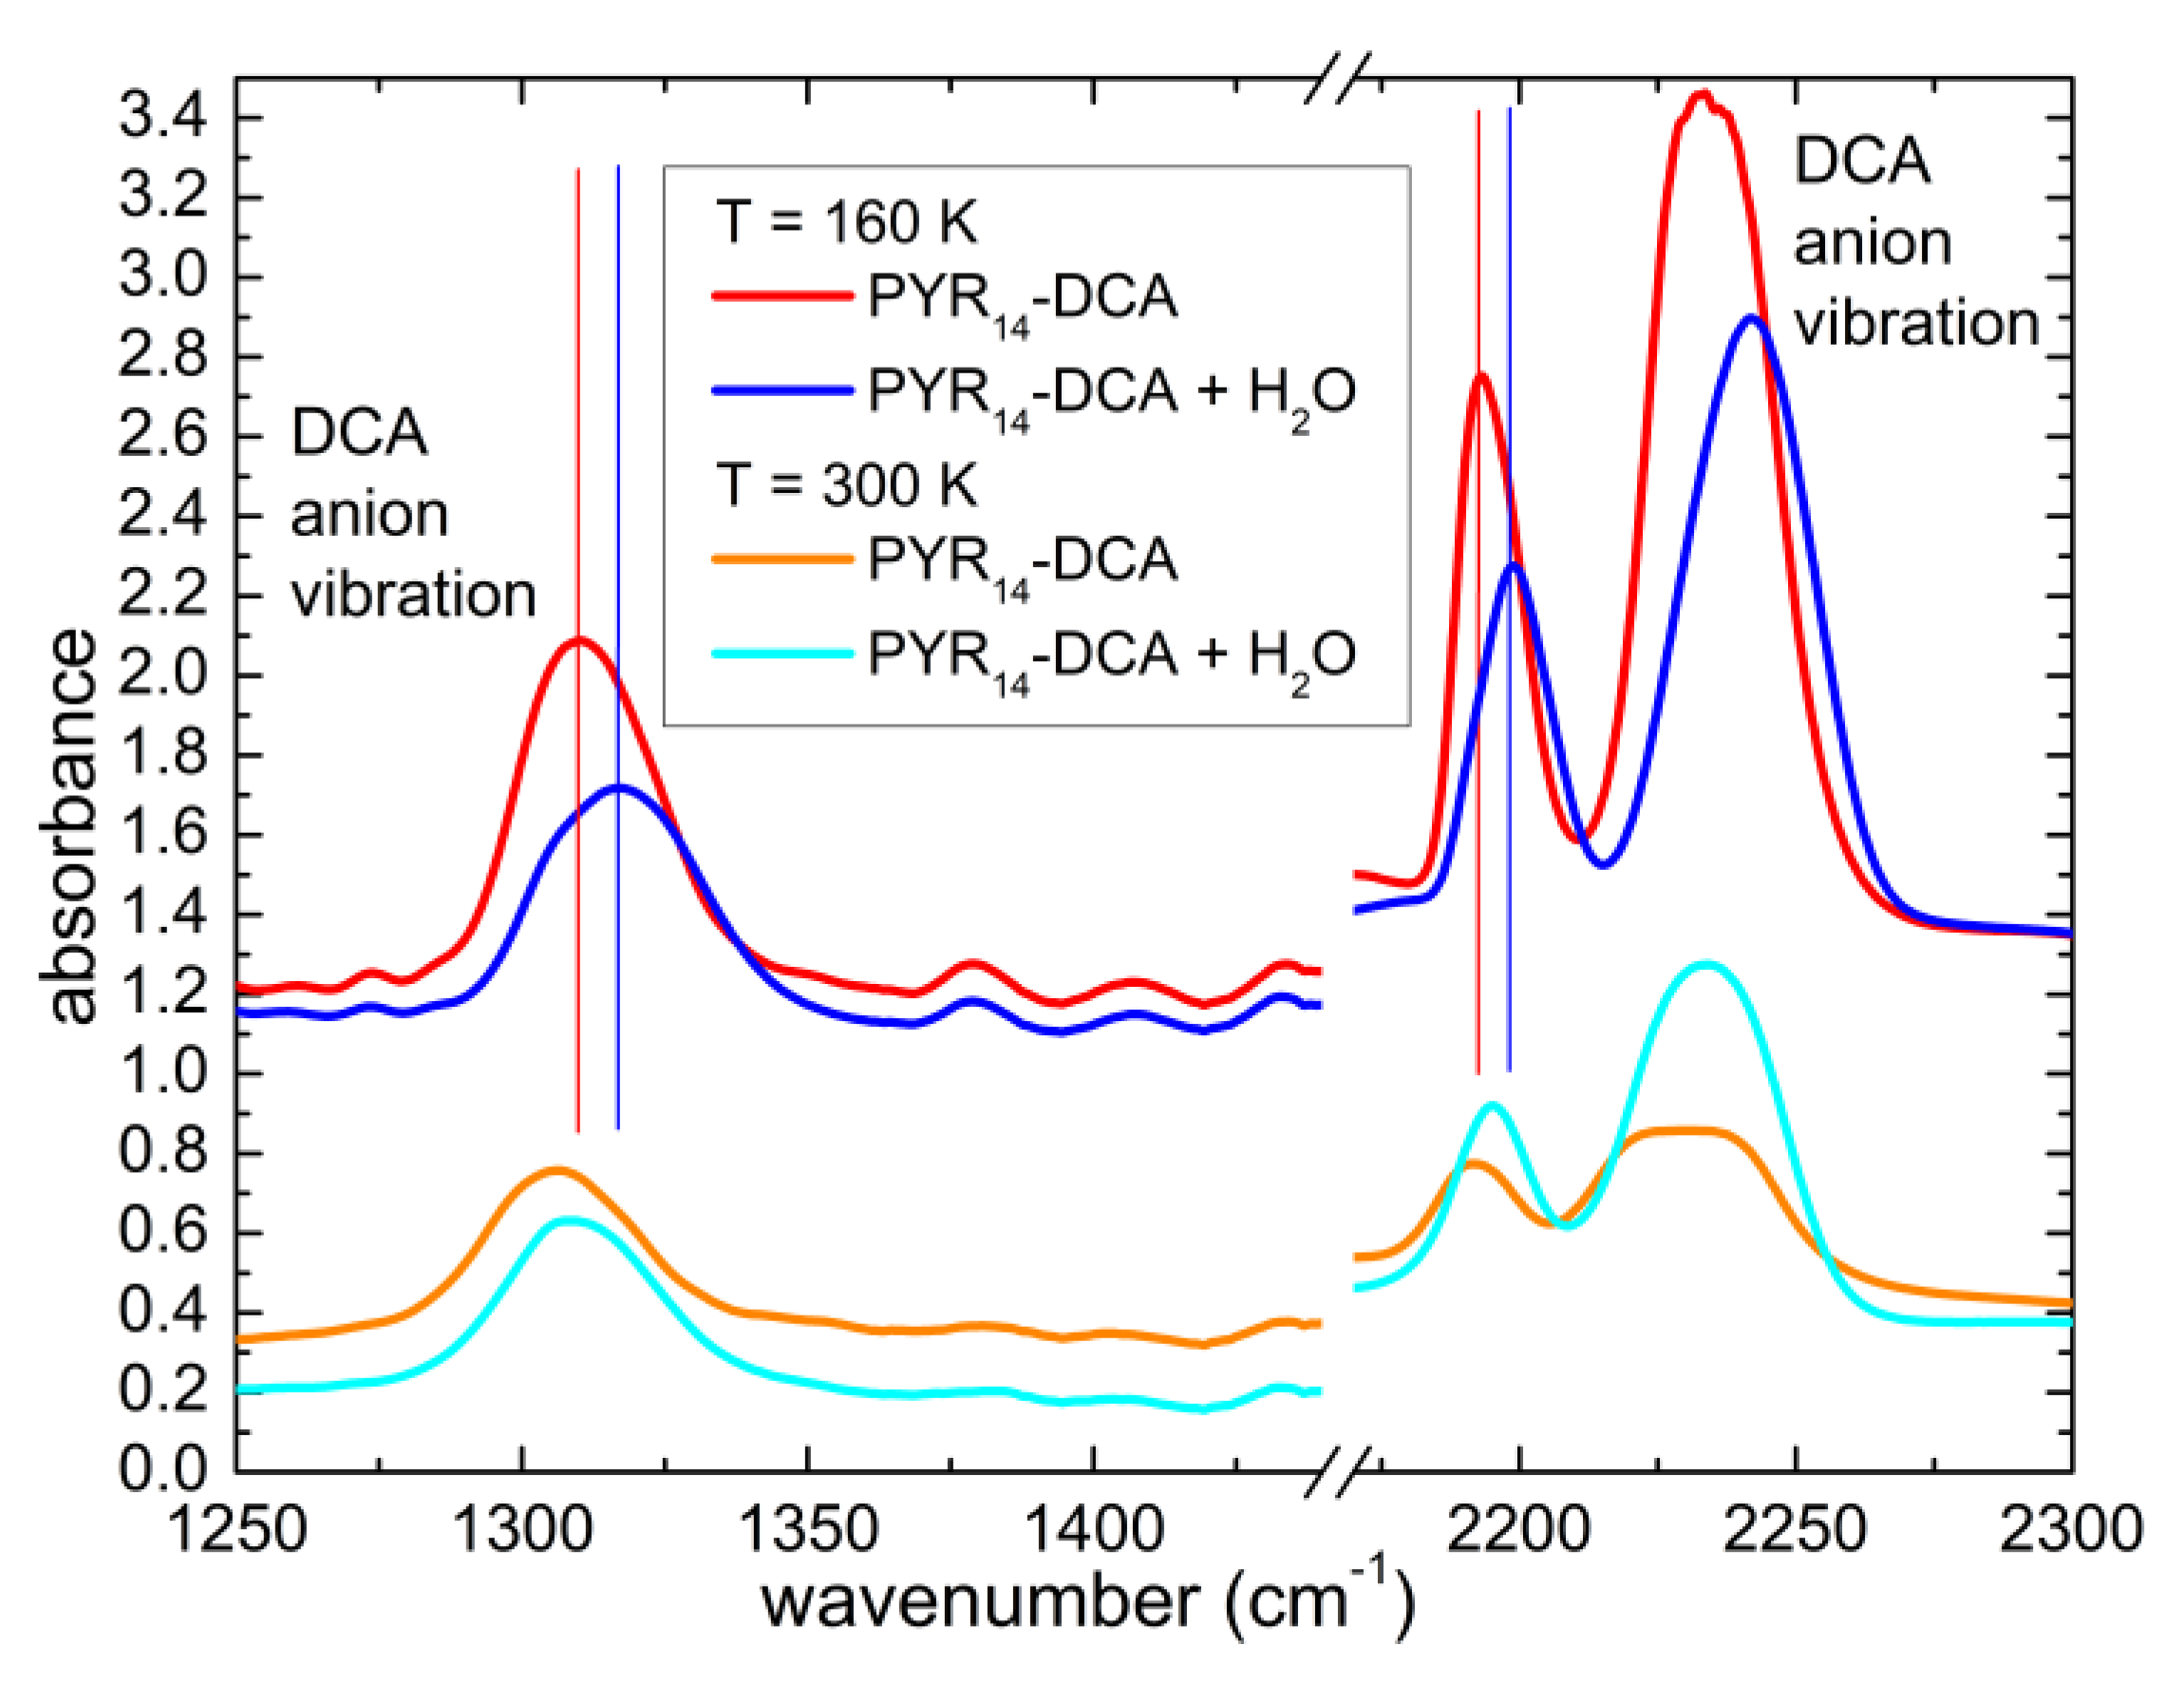
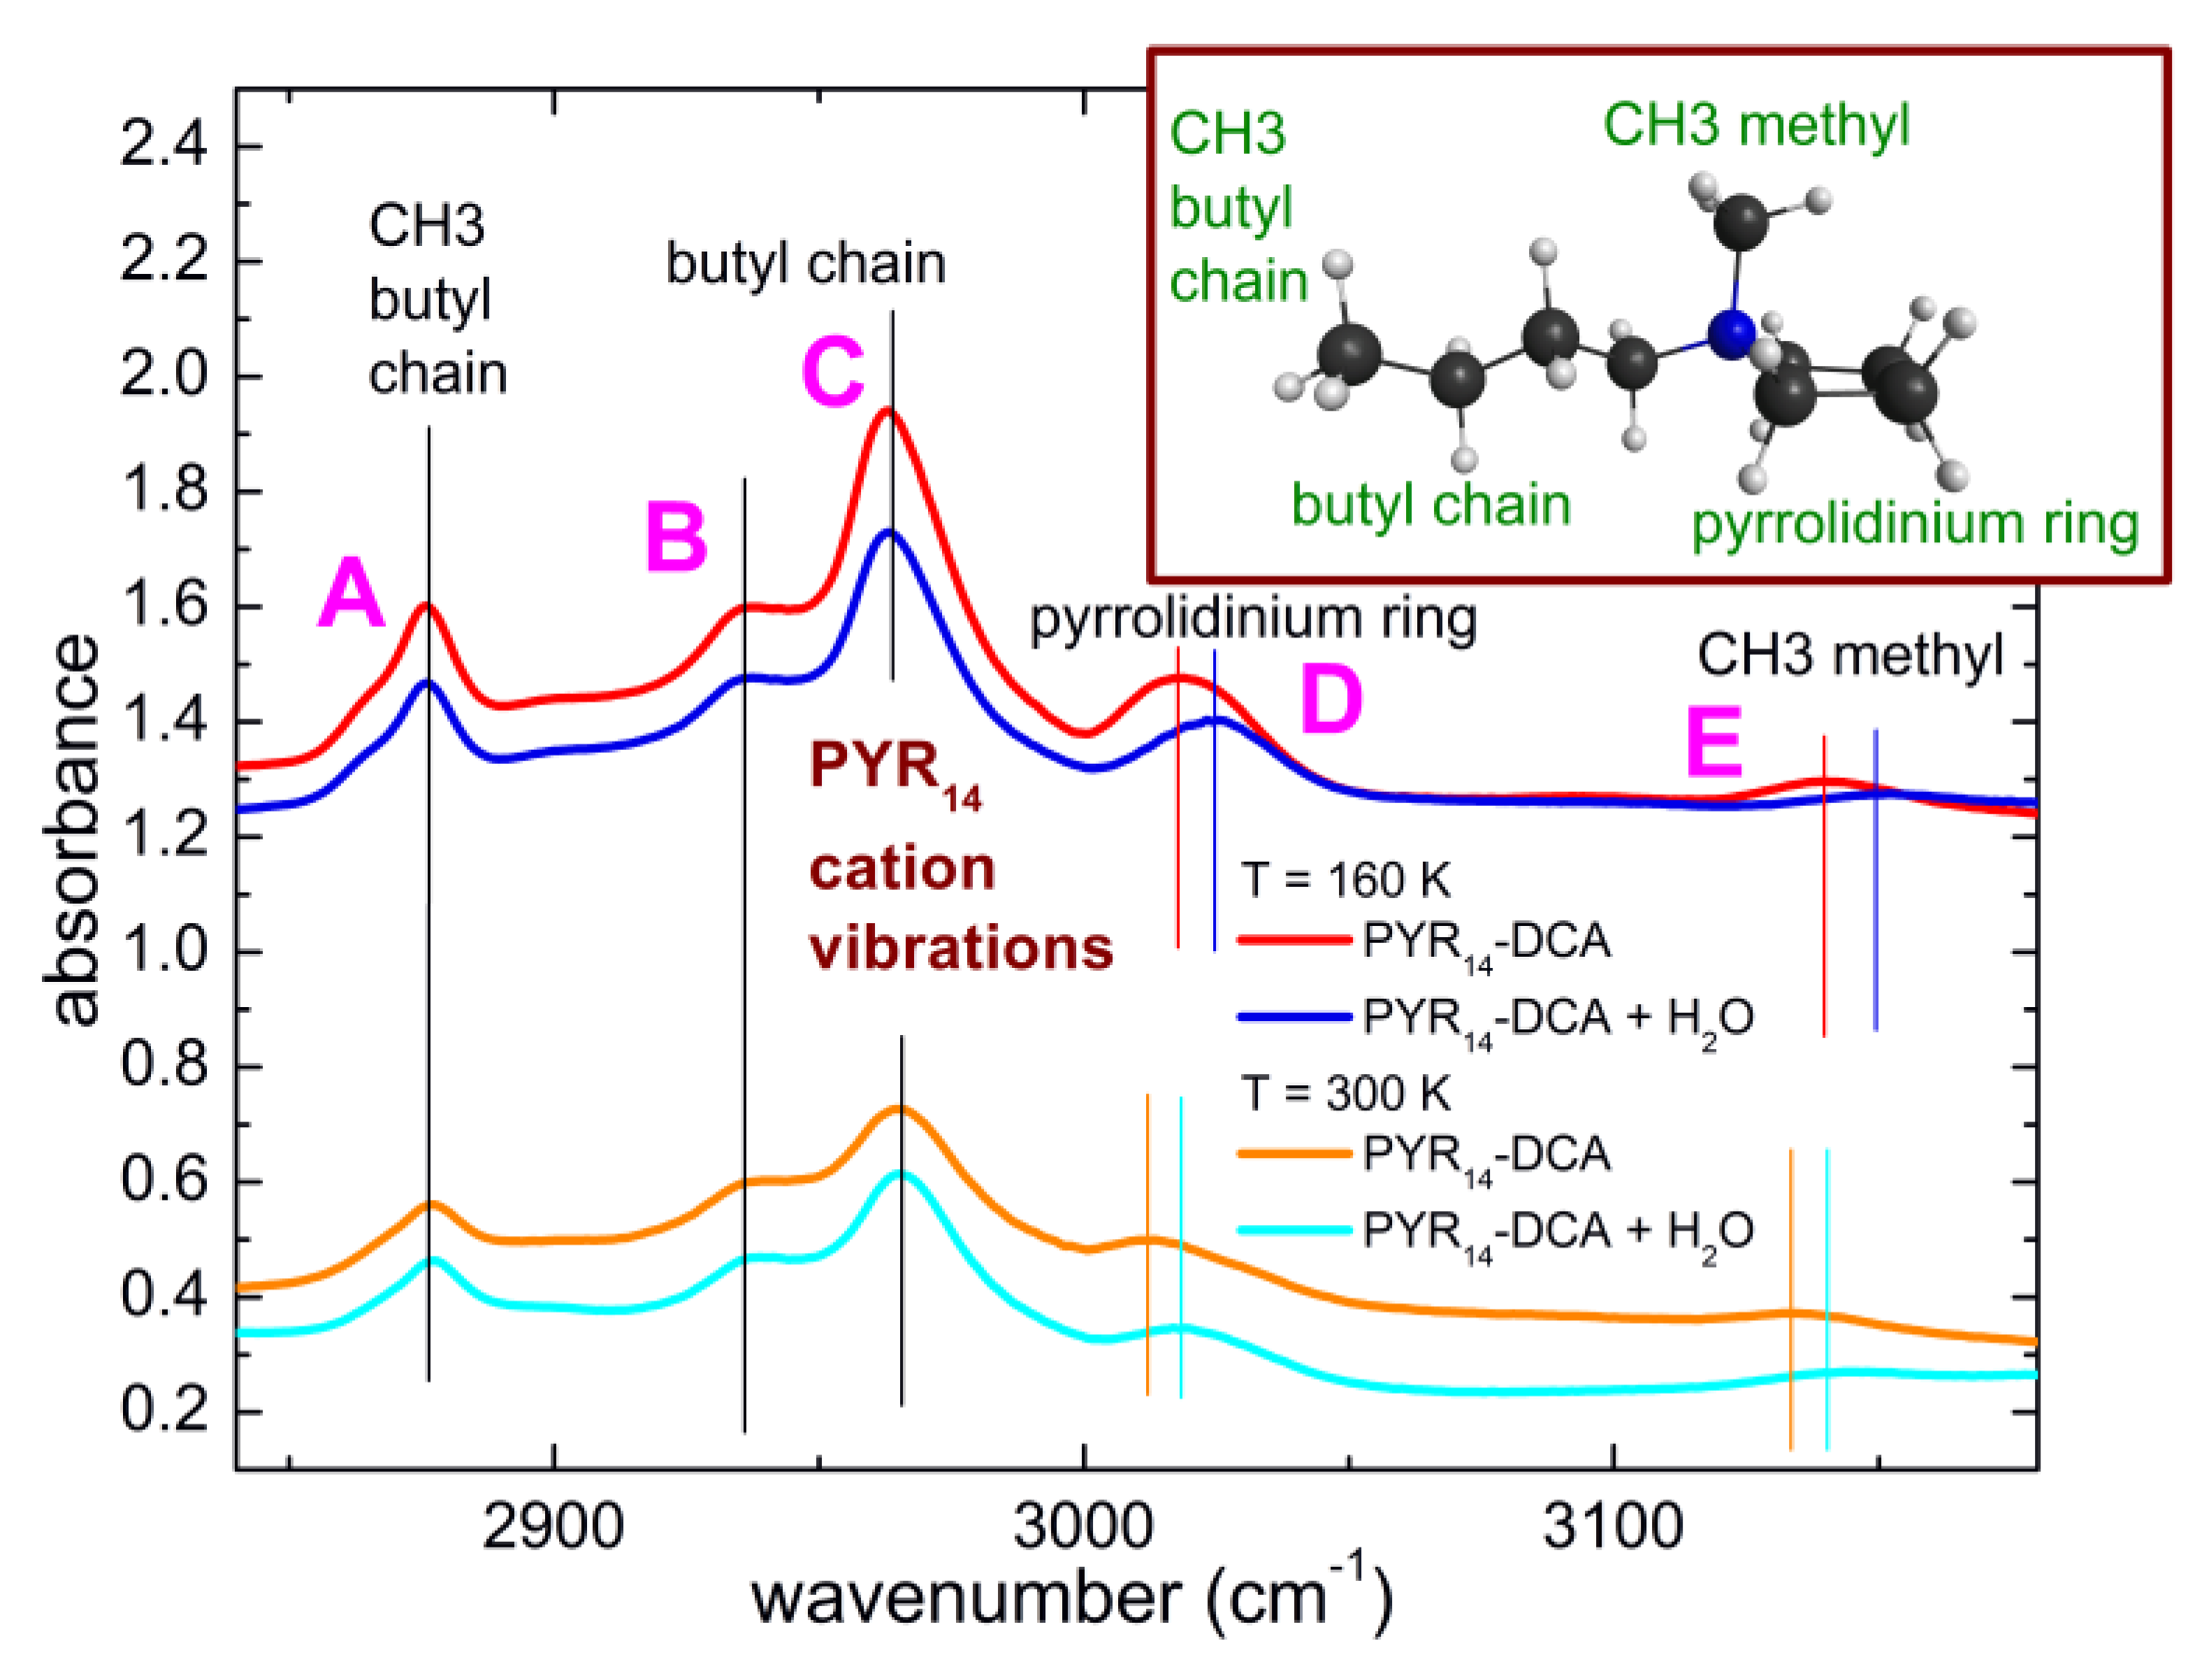
3.1. Line Attribution at Room Temperature and Estimate of the Initial Water Content of PYR14-DCA

Figure 2 displays a comparison of the experimental absorption spectrum of PYR14-DCA and the calculated ones for the single ions PYR14 and DCA. The lines centered around 664, 903 and 1307 cm−1 are attributable to the anion vibrations. Around 2200 cm−1 one would computationally expect a triply degenerate absorption band with a high intensity due to DCA. In the real ionic liquid, the triple degeneracy is removed and three strong absorption bands centered around 2130, 2190 and 2230 cm−1 are detected, similarly to the case of other ILs containing dicyanamide [34,35,36,37]. All the other absorption bands between 600 and 3200 cm−1 can be attributed to the vibrations of the PYR14 anion, in particular CH bending and stretching modes are visible in the regions 1350–1500 and 2800–3200 cm−1, respectively. The comparison of the experimental vibration frequencies with those computed for anion and cation provides evidence that below 1200 cm−1, one has to use a frequency scaling factor of 0.97 for DCA anion, while no scaling factor is needed for the PYR14 cation.
Above 3200 cm−1, one observes the typical absorption bands of water. Despite the storage of sample in an inert atmosphere, during the charging of the cell, it absorbed a significant amount of water from the atmosphere. One can roughly estimate the concentration of H2O absorbed from air comparing the area of the water absorption bands of the two sample: PYR14-DCA and PYR14-DCA + H2O. The latter was obtained by adding 57 wt% of water to the former. Figure 3 reports a comparison of the spectra of the two samples in the region of the OH stretching bands.
The area of absorption bands is proportional to the concentration of the species giving rise to it. Calling c0 and c1 the water concentration absorbed from the atmosphere and the concentration of water added intentionally, A0 and A1 the area of the OH stretching bands in the as received and in the intentionally hydrated sample, one can write the following proportion—c0:A0 = c1:A1. Solved to calculate c0, one finally obtains c0 = c1A0/A1. In the present case A1~2A0, and therefore, the concentration of water in PYR14-DCA is c0~3.3 molecules of H2O per ionic couple, while the concentration of water in PYR14-DCA + H2O is c1~6.6 molecules of H2O per ionic couple.
It must be noted that the frequency of the bands due to OH stretching is a clear mark of the coordination of water molecules: in gases, where a very low coordination is expected, OH bands are visible above 3600 cm−1 [9,38]; bands between 3400 and 3500 cm−1 are due to an intermediate coordination 2 or 3 of water molecules. Finally, the band centered around 3270 cm−1 is typical of 4-fold coordination and was largely observed in pure water in the solid state [38].

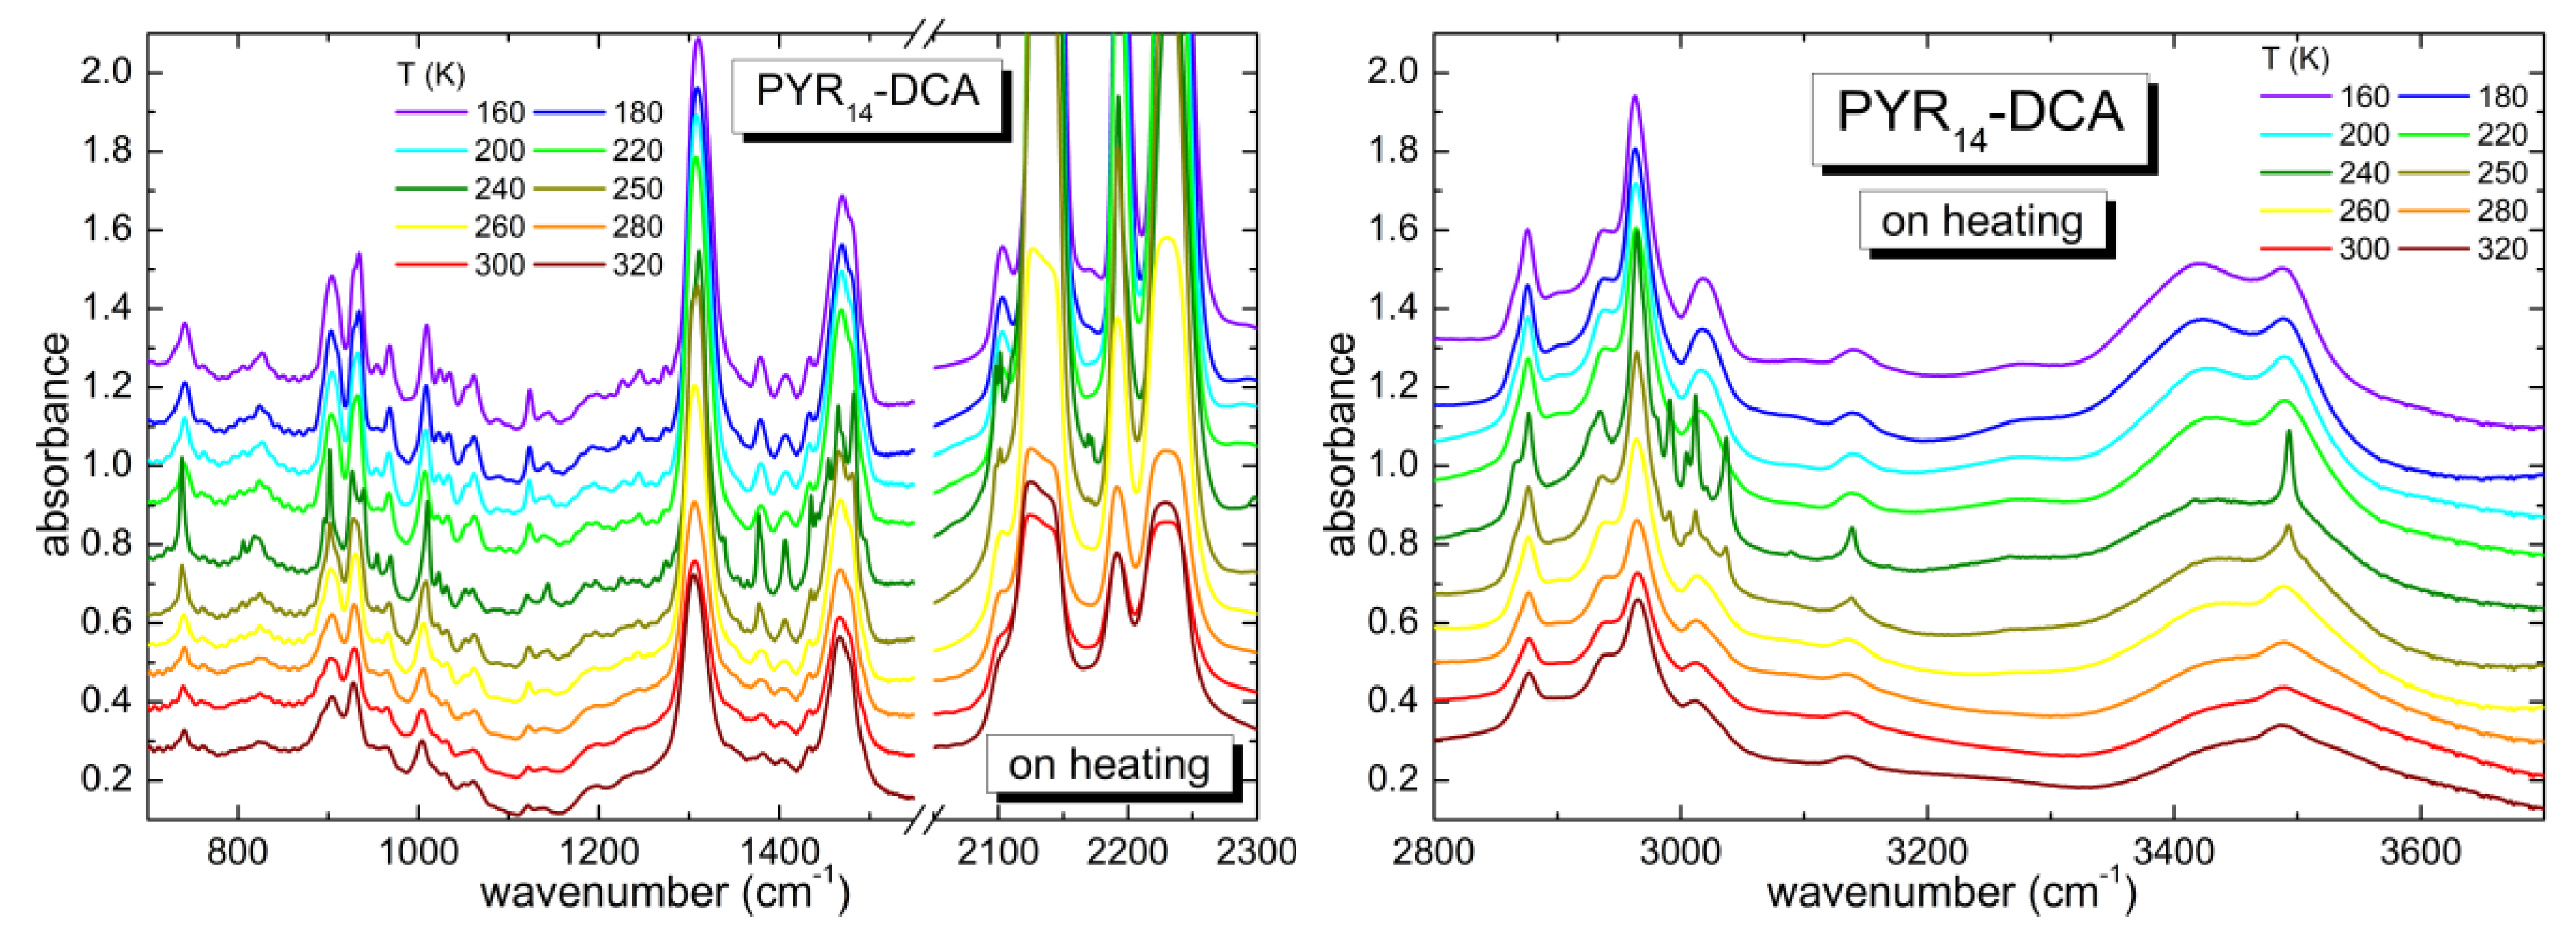
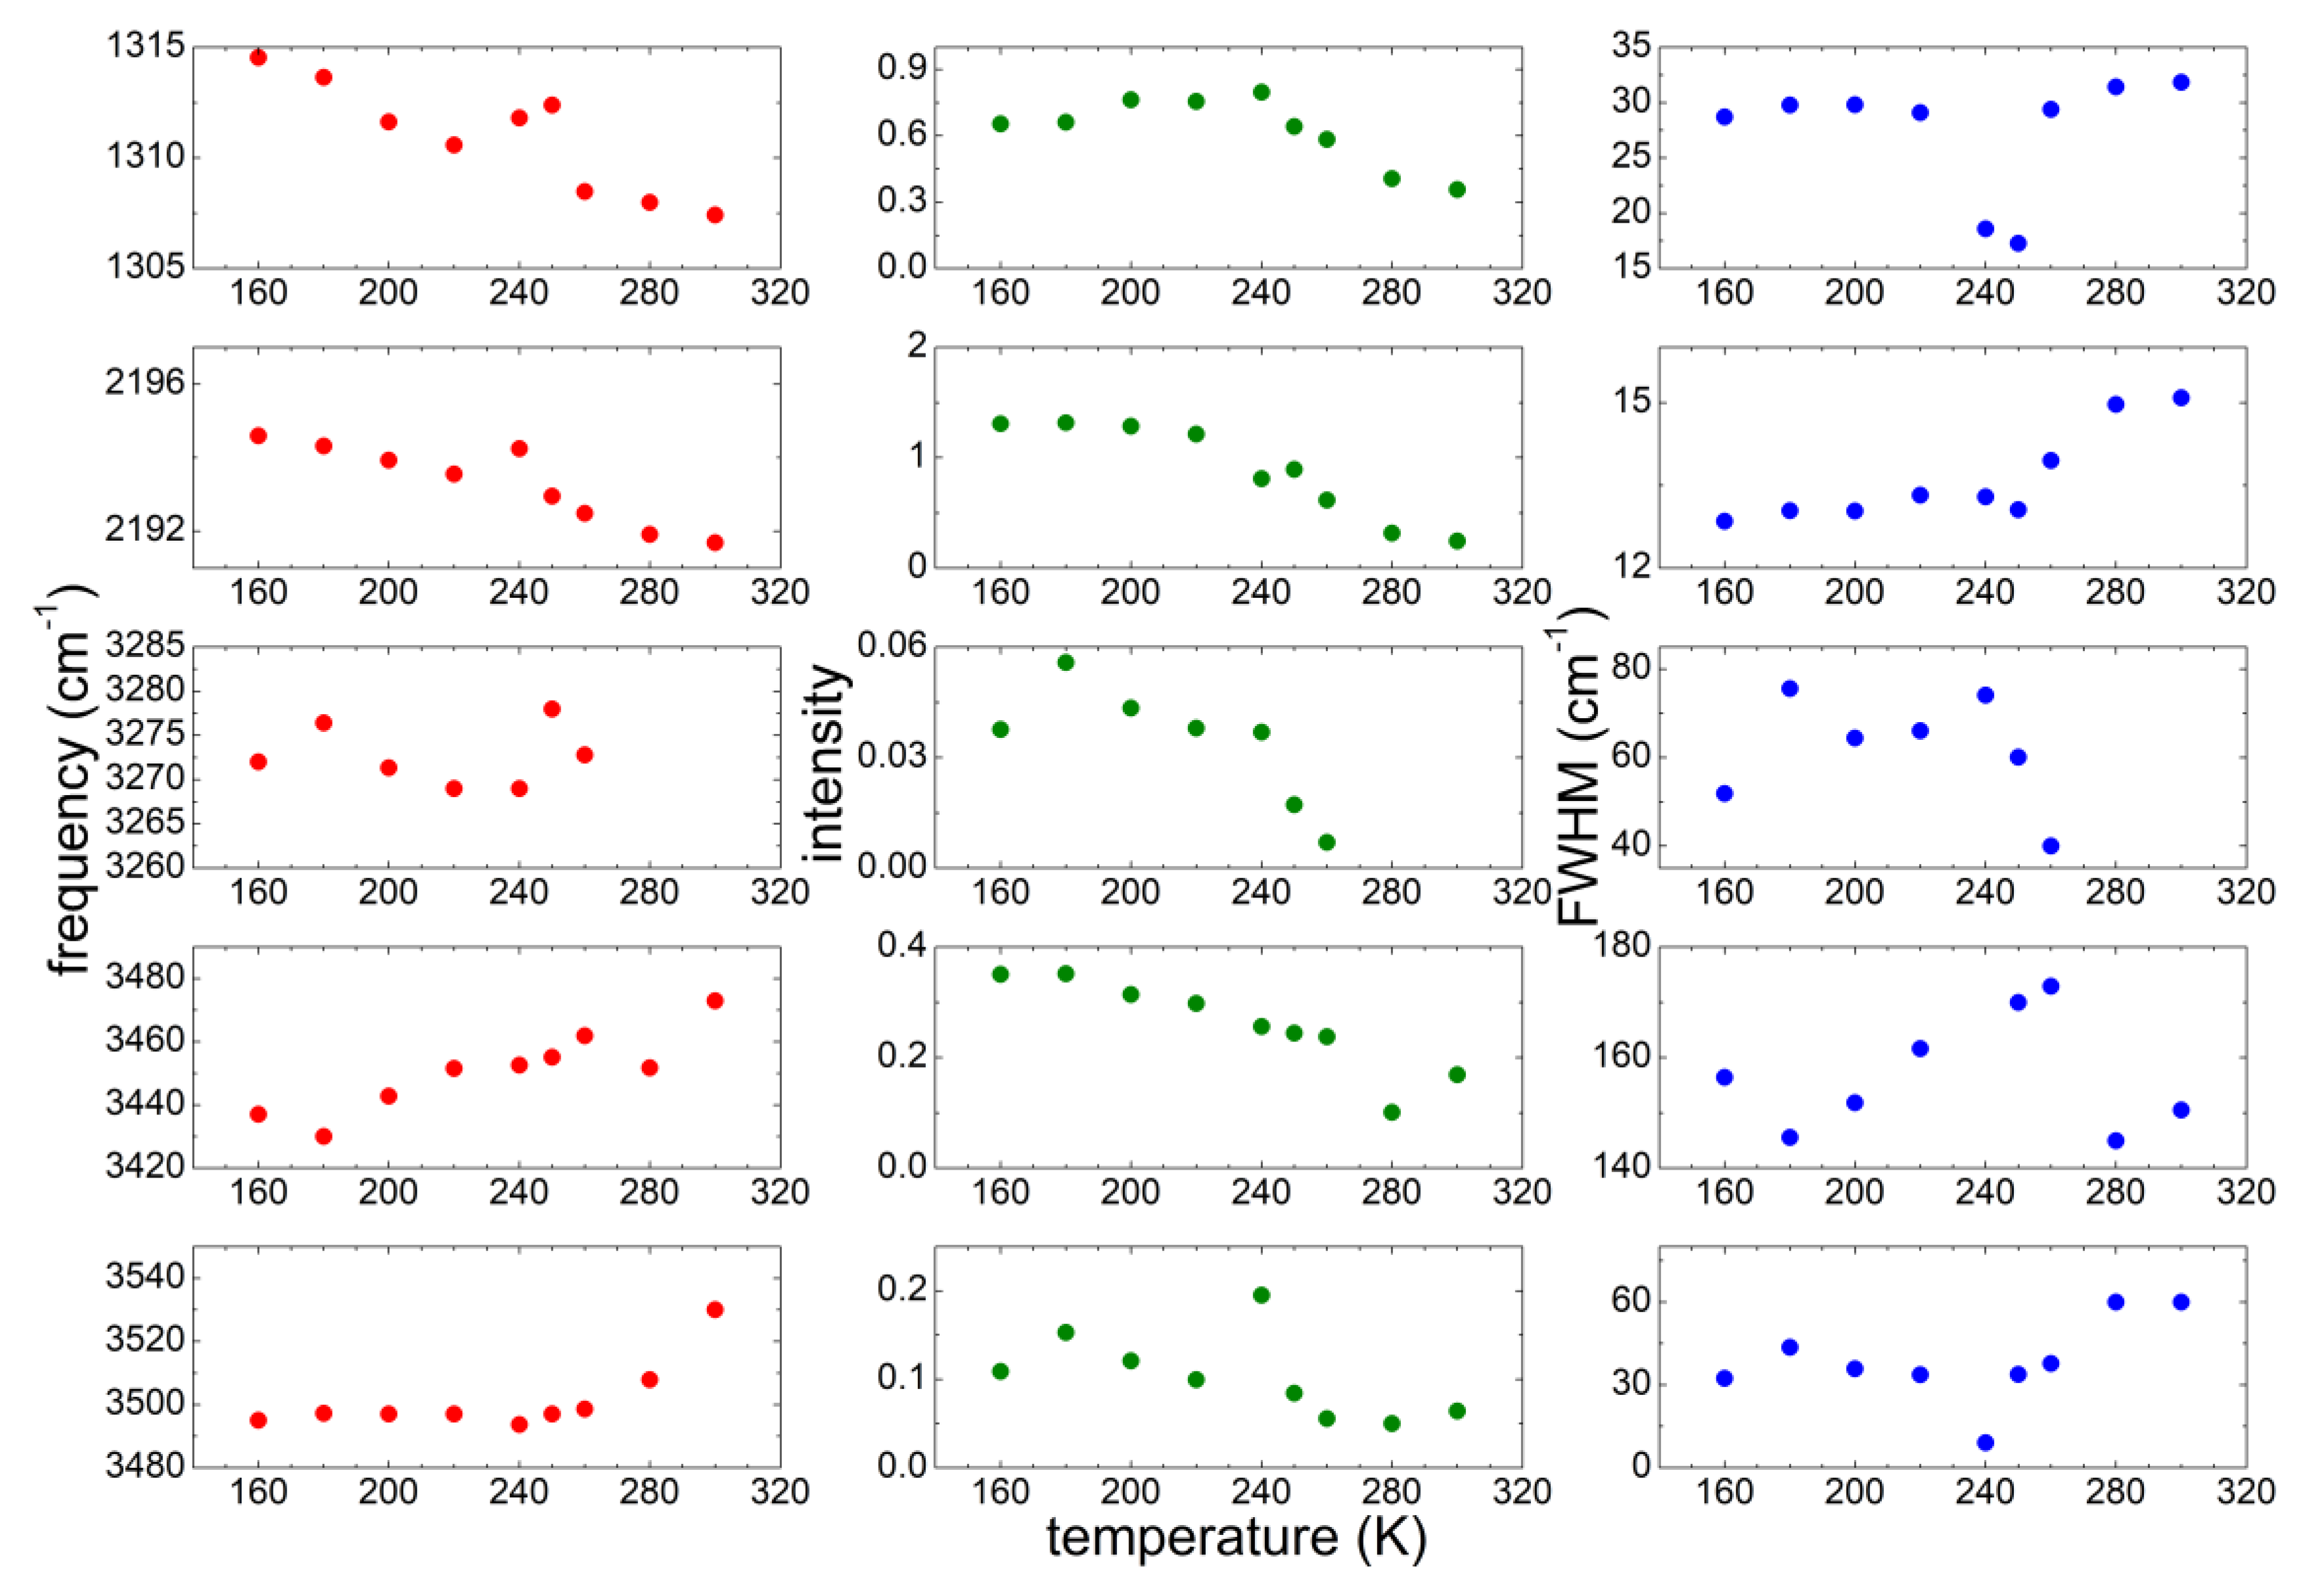
3.2. Temperature Dependence of the As-Received Sample

Figure 4 reports the temperature dependence of the absorption spectrum of the PYR14-DCA sample. The spectrum recorded at the lowest temperature of 160 K looks similar to that measured at the highest T (320 K), i.e., the same bands are present in the two spectra, they are just narrower and better defined at the lower temperature, as expected for a sample that does not undergo phase transitions on cooling. The main difference is observed in the region between 3200 and 3600 cm−1, corresponding to the OH stretching vibrations of water: while at room temperature there are two bands centered around 3430 and 3490 cm−1, at low T, one observes an increase of the intensity of the band at ~3420 cm−1 and a third band, centered around 3280 cm−1, develops. On increasing temperature, no major changes are visible up to 220 K. On the contrary, at 240 K all the absorption lines get narrower and some of them split; the same features are visible also at 250 K. On further heating, starting from 260 K the bands return to the shape they had at 220 K and they maintain that same shape up to the maximum temperature of 320 K. The evolution of the absorption bands as a function of temperature are typical of a lack of crystallization on cooling; the sample likely transforms into a glass at low T. On heating, the sample undergoes a cold crystallization in a restricted temperature range including 240 and 250 K. Starting from 260 K, the specimen liquefies and recovers the original liquid state. It is remarkable that this ionic liquid is able to undergo a crystallization process despite the presence of a large amount of water (~3.3 molecules of H2O per ionic couple). In hydrophilic 1-butyl-3-methylimidazolium dicyanamide (bmim DCA) the crystallization was previously suppressed by adding a much smaller concentration of bidistilled water (2.45 wt%, i.e., 0.024 molecules of water per ionic couple) [32].
In order to study quantitatively the microstructure evolution of the sample as a function of T, we performed a detailed investigation of the dependence on T of the peak position, width and intensity of some significant bands: (1) the absorption around 1310 cm−1, that was attributed to the asymmetric stretching mode of the bridging N and C atoms of the anion [35,36,37,38]; (2) the absorptions around 2230 cm−1, attributed to the triple bond between the C and the terminal N atoms of the anion [35,36,37,38]; (3) the OH stretching bands between 3200 and 3600 cm−1, coming from undesired water. For the OH bands, three contributions were considered, centered around 3500, 3440 and 3270 cm−1 at the lowest temperature. These three contributions correspond to different coordination of water by means of hydrogen bonds [32]: while the bands between 3400 and 3500 cm−1 are due to an intermediate coordination 2 or 3 of water molecules, the band centered around 3270 cm−1 is typical of 4-fold coordination and was largely observed in pure water in the solid state [38]. All these absorption bands were fitted by Gaussian curves as a function of increasing T and the best fit parameters (peak frequency, intensity and full width at half maximum) are reported in Figure 5.
Concerning the vibrations due to the DCA anion, the band around 1310 cm−1 decreases its intensity for increasing T; in correspondence with the cold crystallization the peak frequency increases and the FWHM drastically decreases. The behavior of the peak frequency and intensity is similar for the band centered around 2190 cm−1. However, in the latter case the width of the band increases above 250 K.
Regarding the OH stretching bands, three contributions are considered: the one around 3270 cm−1 is present only below 260 K and its intensity strongly decreases for increasing T starting at 250 K. The band centered around 3440 cm−1 at low T shifts towards higher frequencies for increasing temperatures reaching 3480 cm−1 at 300 K, while its intensity decreases as T increases. Finally, the absorption at the highest frequency shifts from ~3500 cm−1 to 3540 cm−1 between 280 K and 300 K, and becomes broader at high T. More interestingly, its linewidth drastically decreases by a factor of 3.5 in correspondence with the cold crystallization, as already visible from the absorption spectra (Figure 4), similarly to the effect already commented for the two bands due to the DCA anion vibrations.

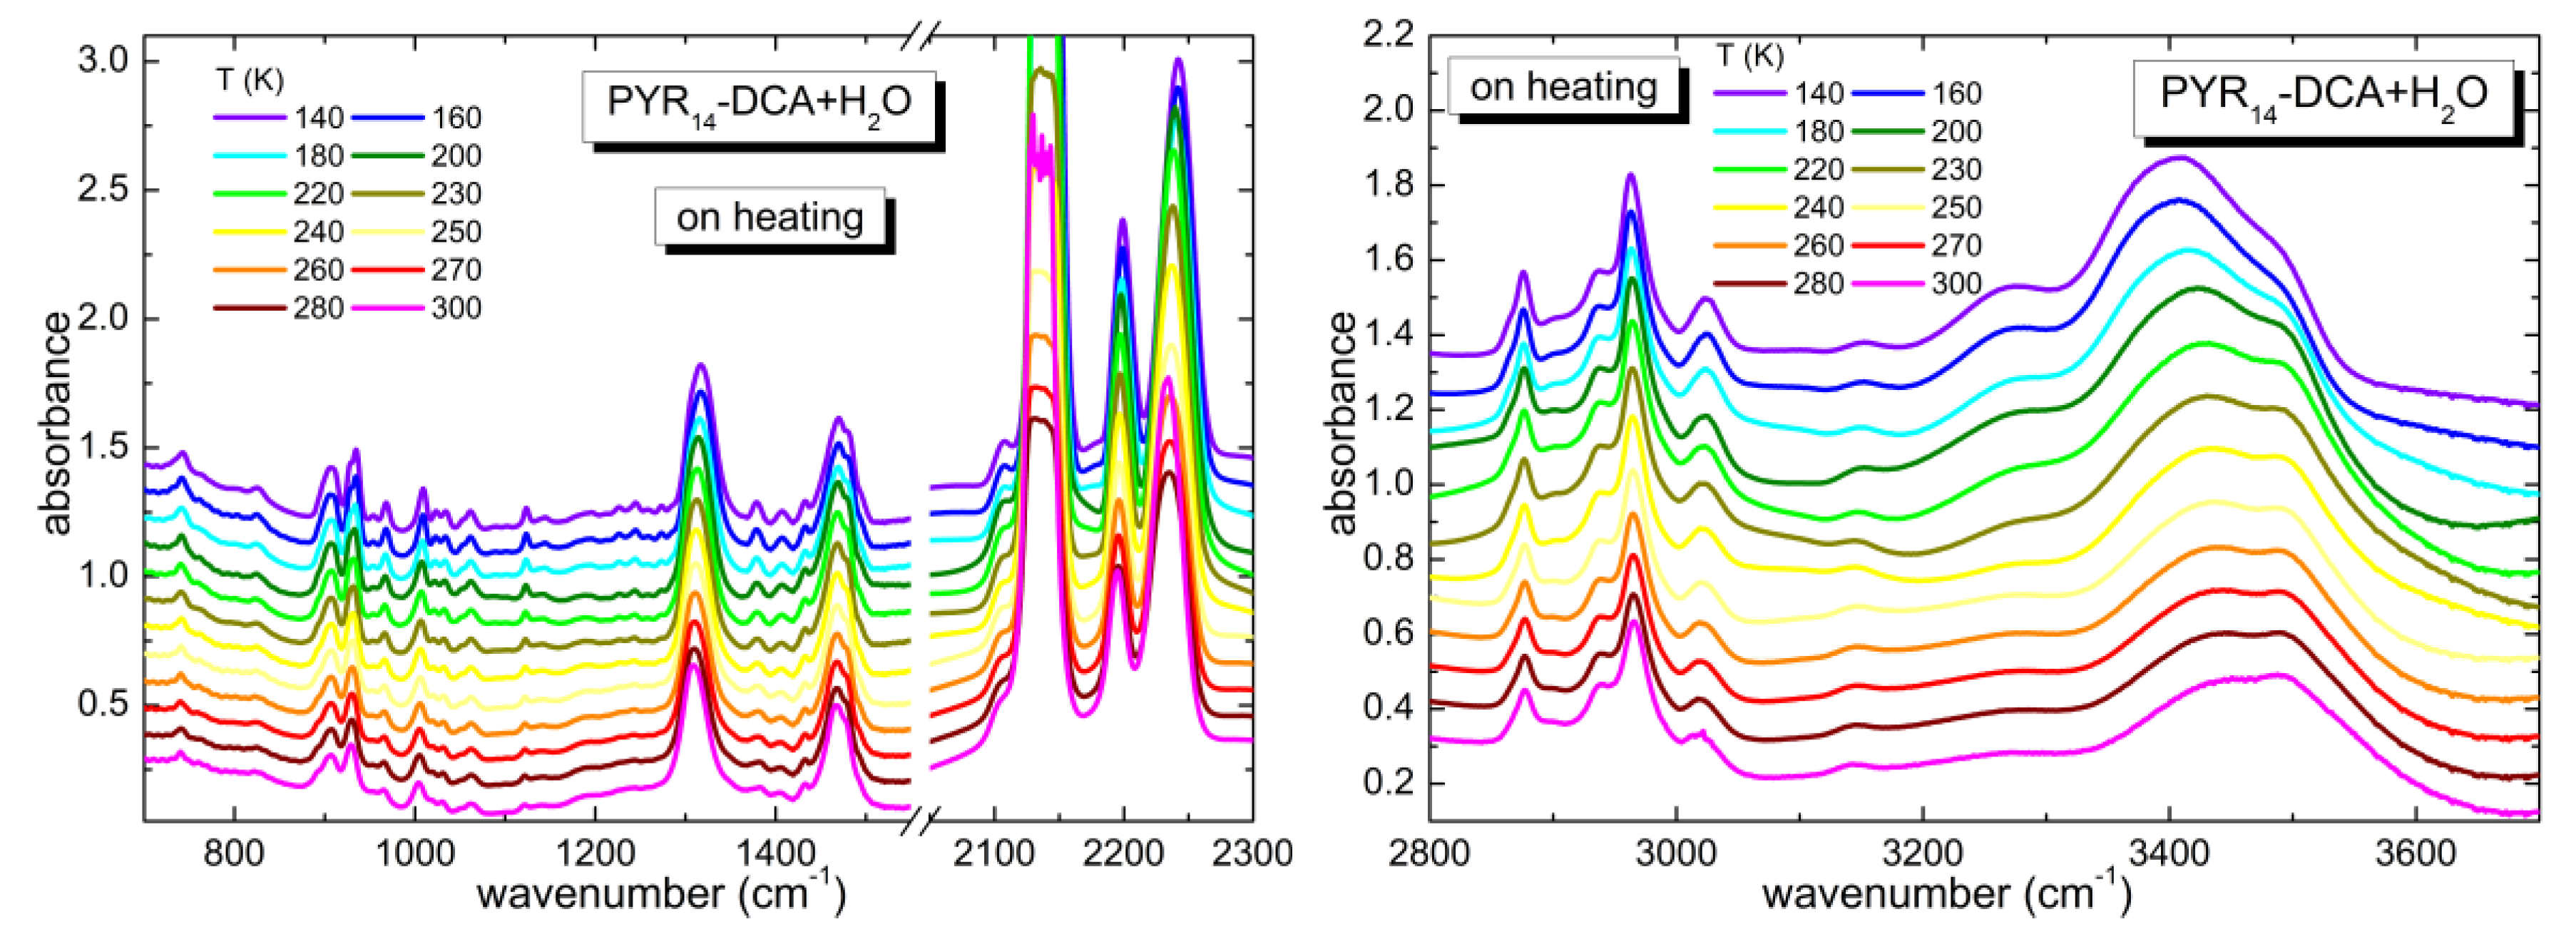
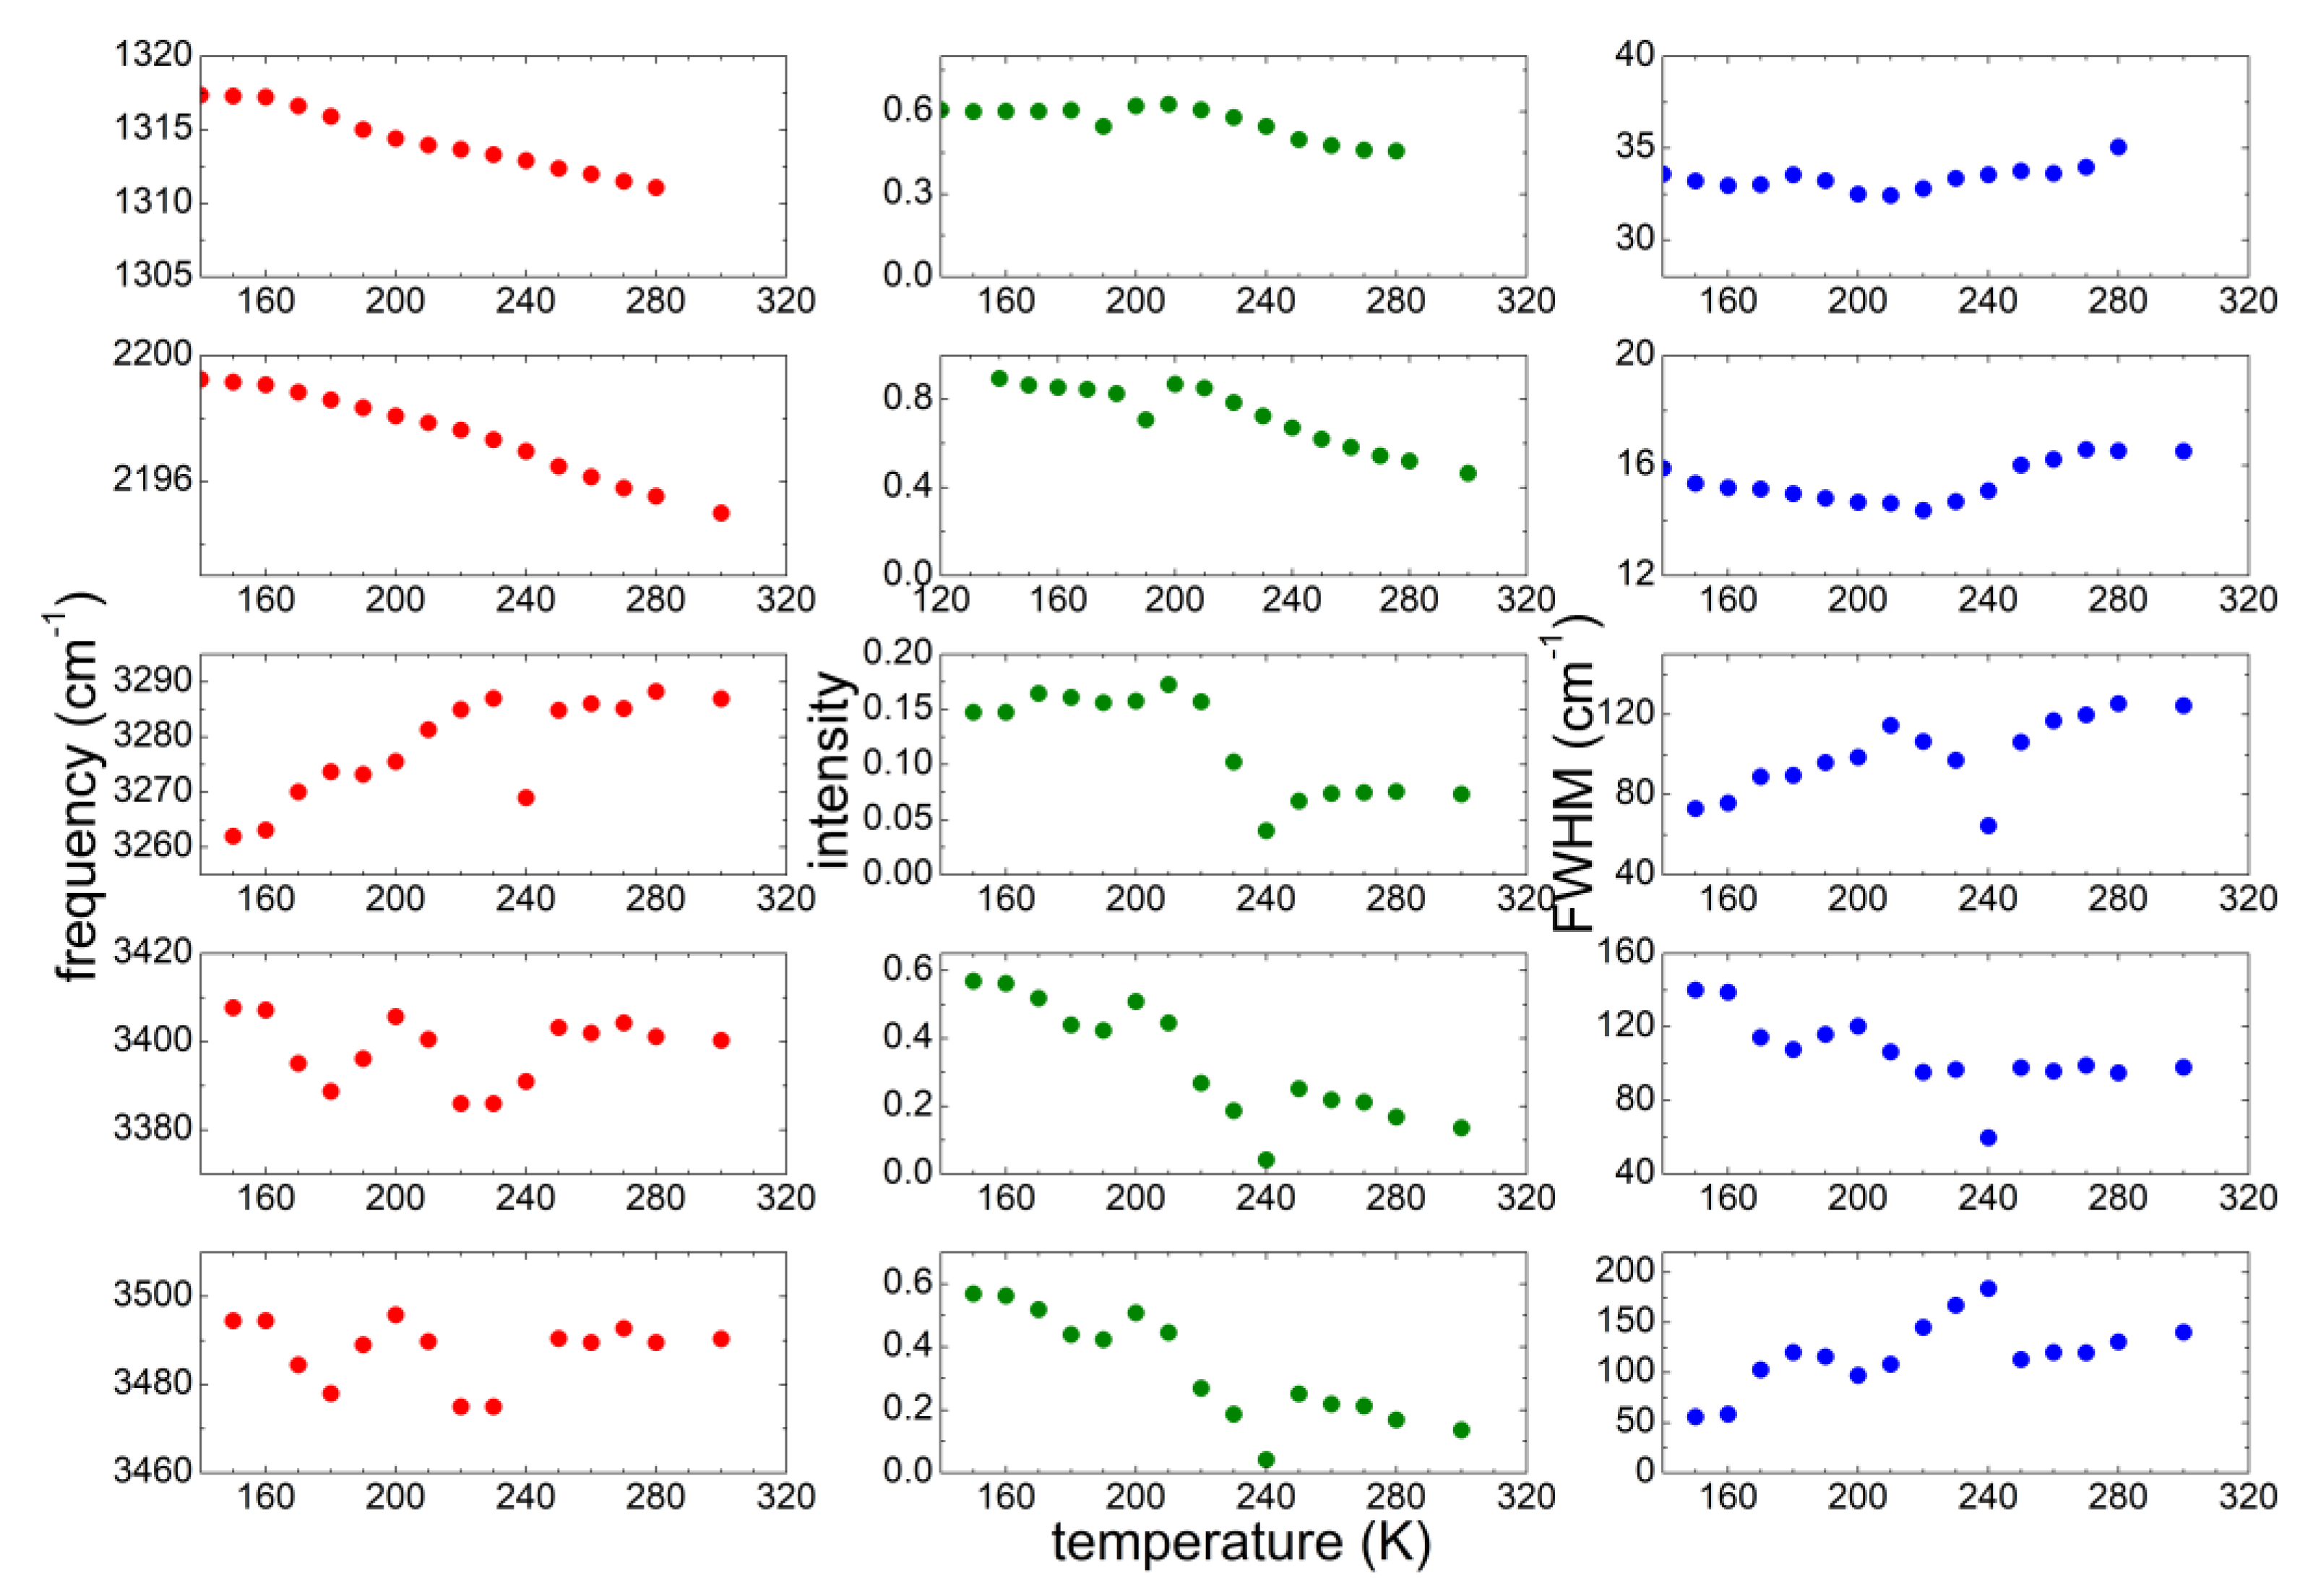
3.3. Temperature Dependence of the Intentionally Hydrated Sample

The temperature dependence of the infrared spectrum of PYR14-DCA + H2O is reported in Figure 6. As in the case of PYR14-DCA, in PYR14-DCA + H2O the spectra measured at the highest (300 K) and lowest (140 K) temperature display the same bands, without any splitting. Only in the region between 3200 and 3600 cm−1 there is an increase of the intensity of the bands centered around 3270 and 3400 cm−1 at low Ts. On increasing temperature, the bands smoothly recover the shape they had at room temperature, before the thermal cycle. This trend suggests that in PYR14-DCA + H2O no crystallization takes place as a function of temperature, rather suggesting that a glass transition occurs at very low temperatures.
To gain a better description of the interaction of the ionic liquid with a large amount of water, the analysis of the same vibrational lines considered for PYR14-DCA was repeated for the PYR14-DCA + H2O sample. The best fit parameters of the investigated five bands are reported in Figure 7. Both bands due to the DCA vibrations show a decrease of both frequency and intensity as the temperature increases, while the width of those bands stay almost constant. Concerning the OH stretching bands, the two absorptions centered at ~3400 and 3480 cm−1 remain practically at the same frequencies in the whole temperature range, while their intensity decreases as T increases. A different behavior is shown by the band around 3270 cm−1: the frequency increases as T increases; its intensity stays almost constant up to 210 K, significantly decreases between 220 and 240 K and stays constant for higher temperatures.

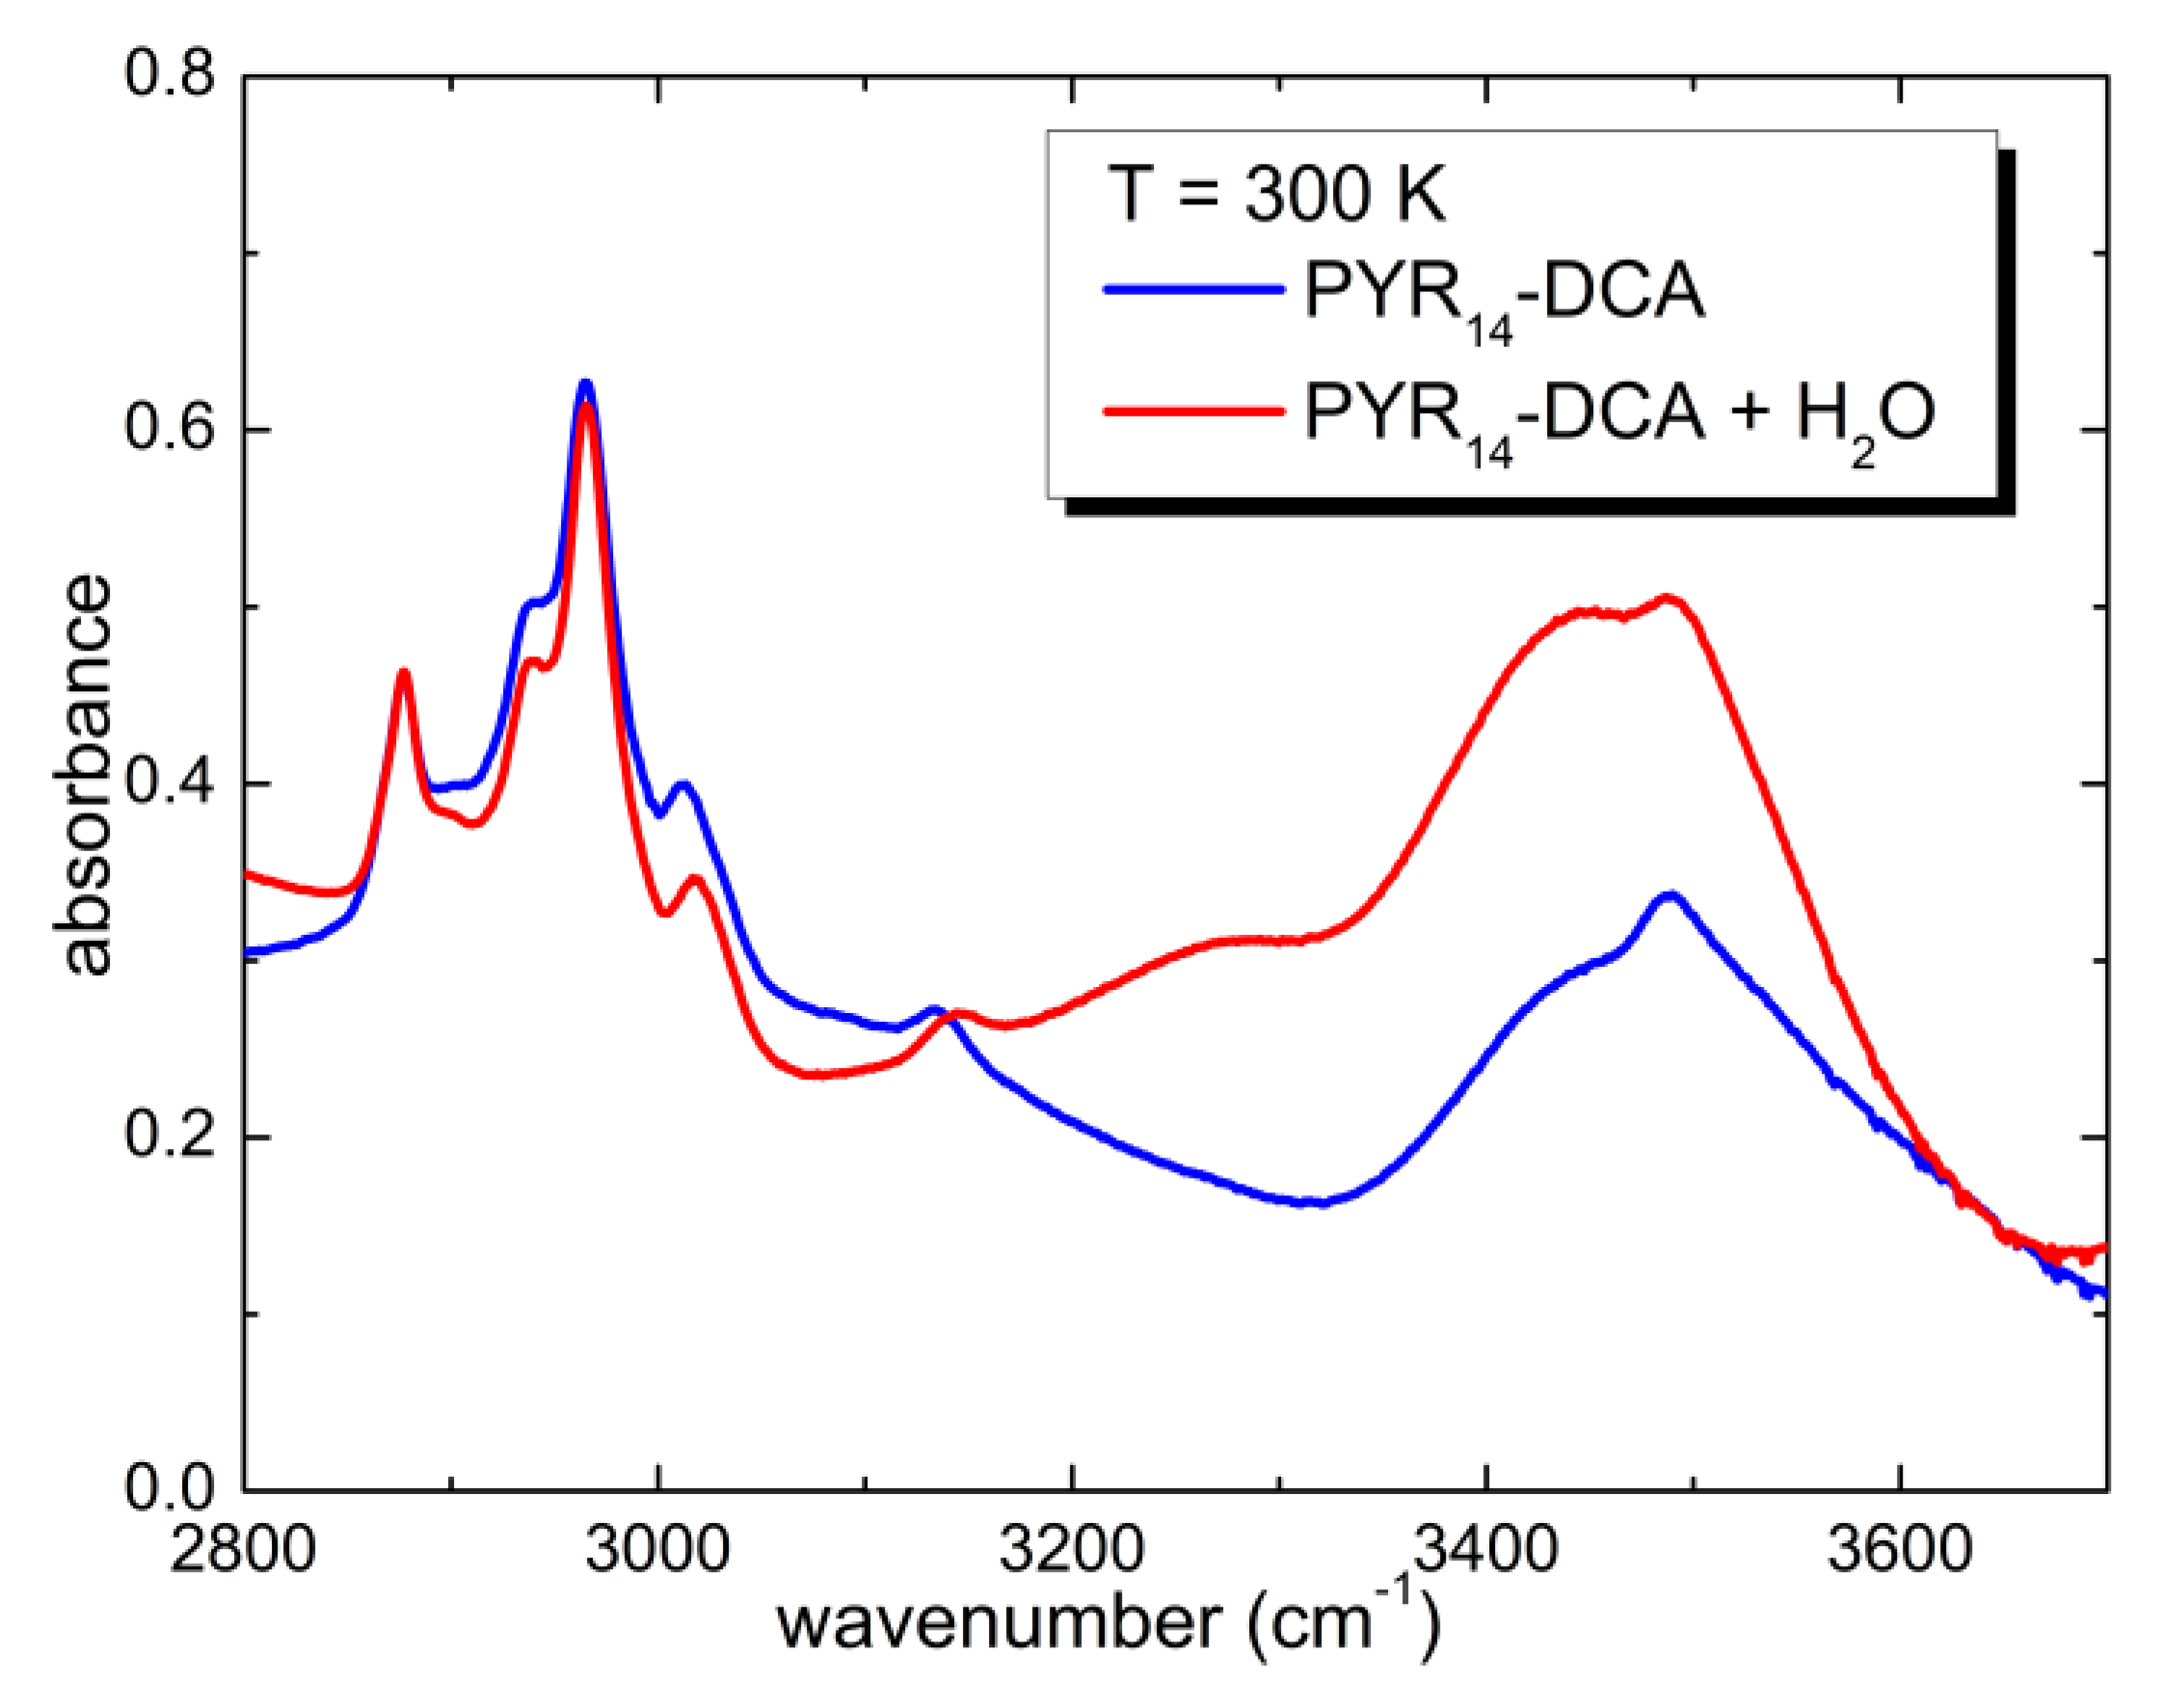
3.4. Interaction of Water with the Ionic Liquid

The interaction of water and the ionic liquid can be investigated by comparing the position of the vibrational bands when different concentrations of solvent are present in the sample. In the previous literature it has been reported that water mainly interacts with the anion of ILs [8,20,21,22,23,24,25,26] Indeed, Figure 8 displays a comparison of the spectra of PYR14-DCA and PYR14-DCA + H2O at 300 K and 160 K in the region 1250–2300 cm−1, where one finds the absorption around 1310 cm−1, that was attributed to the asymmetric stretching mode of the bridging N and C atoms of the anion and the absorptions around 2230 cm−1, attributed to the triple bond between the C and the terminal N atoms [35,36,37,38]. The three bands due to the anion shift toward higher frequencies in the intentionally hydrated sample by ~6 cm−1. Similar observations were previously reported for other ionic liquids mixed with water and the different behavior of anion and cation vibrations were interpreted as the consequence of the strong interaction of water with the anions [14,18,39]. It can be noted in the present study that both the vibration of the central part (C-N-C) and of the extremities (C≡N) of the anion are affected, suggesting that the whole anion interacts with water.
While it is well known that water mainly interacts with the anion of ionic liquids, in some cases weaker interactions have also been reported between water and the cations of ILs [17,18,39]. Figure 9 displays a comparison of the spectra of PYR14-DCA and PYR14-DCA + H2O at 300 K and 160 K in the region 2840–3170 cm−1, where the absorption bands due to the CH stretching of the cation can be found. Both at room temperature and at 160 K, one can observe that the bands centered around 2876, 2935, 2964 cm−1(band A, B and C in the following) maintain their central frequency after the intentional addition of water while the bands around 3015 and 3135 cm−1 (band D and E in the following) are blue shifted by ~6 cm−1 by increasing the H2O content.
Contrarily to the case of imidazolium-based ionic liquids [40], to the best or our knowledge a detailed attribution of the CH stretching bands of ILs containing the pyrrolidinium cation is not available. Based on our DFT calculations, we suggest that band A is due to the terminal CH3 group of the butyl chain, band B and C are ascribable to the whole alkyl chain, band D is attributable to the motions of the pyrrolidinium ring and band E originates from the CH3 methyl group directly attached to the N atom. Using these attributions, we can suggest that the absorption lines that are more strongly affected by the addition of water are those due to the pyrrolidinium ring and to the methyl group directly attached to the N atom of the cation.

4. Discussion

4.1. Temperature Evolution of Water

The infrared absorbance due to OH stretching vibrations have been largely investigated in the past and it has been proved that their analysis is able to provide useful information about the coordination of water molecules. Water can form hydrogen bonds with itself or with other molecules. The existence of different number of coordinated molecules gives rise to OH stretching bands centered at different frequencies. The less coordinated water molecules are usually characterized by a doublet centered around 3600 and 3550 cm−1 [9]. With increasing coordination, the absorption bands move toward lower frequencies and the two peaks tend to merge in a single structured absorption [9,32]. In the case of four-fold coordination, a band centered at 3270 cm−1 is clearly visible; this band has been largely investigated in the solid state [38]. In some cases, these three types of coordination are called multimer (MW), intermediate (IW) and network water (NW) [18,41,42]. In an unknown system, the investigation of the frequency position of the OH stretching bands can become a powerful mean to determine the coordination of water molecules.
In the presently investigated samples, no band above 3600 cm−1 is visible, in agreement with the high-water content and the expected high coordination of water molecules. It must be noted that in the present case, the concentration of water is much higher than in the previously investigated bmim-DCA [32], where the concentration was lower than 0.024 molecules of water per ionic couple. In this system, bands above 3550 cm−1 were also absent. In the present study, even though the concentration of H2O is as high as ~3.3 molecules per ionic couple, one can observe a cold crystallization in the PYR14-DCA sample. Part of the water molecules participate to the crystallization process, as witnessed by the narrowing of the OH band centered around 3500 cm−1. In PYR14-DCA, at low temperatures there is an increase of the intensity of the bands due to H2O (see Figure 5) and even the presence of network water, centered around 3270 cm−1, is visible well below the crystallization temperature. When cold crystallization takes place, the intensity of the band of the network water decreases and it is drastically reduced at 260 K, below the melting point of bulk water. In this framework, it seems that the ionic liquid and water behave in two almost independent ways, except for the limited amount of less coordinated H2O involved in the crystallization process (band centered around 3500 cm−1).
In PYR14-DCA + H2O, all OH stretching bands are red shifted compared to PYR14-DCA, indicating a stronger interaction of water with itself and with the IL, forming hydrogen bonding. Moreover, in PYR14-DCA + H2O, network water is already present at room temperature, further suggesting stronger interaction in this sample. However, it must be noted that the intensity of this band has two plateau regions, one below and one above 240 K, the same temperature at which the network water band starts to disappear in PYR14-DCA. It seems plausible that water transforms into a glassy state below 240 K in both samples.

4.2. Interaction of Water with the Anion and Cation of the Ionic Liquid

The addition of water molecules to PYR14-DCA shifts the position of the anion vibration lines towards higher frequency. This fact, observed in other ILs [17,18,39], has been attributed to the interaction of water mainly with the anions by means of hydrogen bonding. The shift of the anions vibrations can be explained considering that with increasing water content the bonds in the anion strengthen as a result of the decrease of the interaction between anion and cation [18]. The present investigation indicates that cations also interact with water, as witnessed by the blue shift of the two upper frequency stretching modes of PYR14. This blue shift is consistent with the occurrence of hydrogen bonding forming between water and cations. Similar results were reported for the interaction of 5-hydroxymethylfurfural (5-HMF) with various ILs based on the 1-butyl-3-methylimidazolium cation and different anions [39]. The addition of the solvent produces a blue shift of the vibrational bands of both anion and cations. This fact has been attributed to the occurrence of hydrogen bonding of 5-HMF with both anions and cations. It must be noted that 5-HMF acts as a hydrogen bond acceptor with respect to the anion (anion∙∙∙O-H bonds develop), while 5-HMF is a hydrogen donor for the cation (C-H∙∙∙O bonds can form) [39]. It is plausible that in the presently investigated case, water is a hydrogen bond acceptor for the DCA anion and a hydrogen bond donor for the PYR14 cation.
In the present study, not all the vibrational bands of the cation are affected by the instauration of hydrogen bonding: the modes due to alkyl chain seem unaffected, while the vibrations due to the pyrrolidinium ring and to the methyl group attached to the N atoms are clearly shifted. This is consistent with the hydrophobic nature of alkyl chains longer than four CH groups, that was suggested as the origin of microdomains and micellae in ILs with long chains [43].
It must be pointed out that the interaction of the anions and cations with water molecules through hydrogen bonds implies a decrease of the interactions between PYR14 and DCA. Indeed, the frequency shift of the CH stretching bands of PYR14-DCA + H2O are comparable to those observed in aprotic cholinium propionate ([Chl][Pro]) upon hydration. In the latter compound, as well as in ILs based on the 1-butyl-3-methylimidazolium cation and various anions [43], when the concentration of water exceeds 4–5 molecules per ion pair, one observes a transition from contact ion pairs (CIPs) to solvent-shared ion pairs (SIPs) due to the increasing interactions of cholinium and proponiate ions with water. This bond is established at the detriment of bonds between cation and anion. In this way the cation and anion tend to separate and water molecules are allowed to fill the space between them. This mechanism is more effective in aprotic than in protic ionic liquids [18].

5. Conclusions

The addition of water to the hydrophilic PYR14-DCA IL blue-shifts the bands of the anion and some bands of the cation belonging to the pyrrolidinium ring and to the methyl group vibrations, demonstrating the instauration of hydrogen bonding between H2O and both anions and cations. Concomitantly, the bands of water are red shifted. Remarkably, even in the presence of 3.3 molecules of water per ionic couple, one can observe a cold crystallization process that involves also part of the less bound water molecules. On the contrary, no crystallization is observed for an IL:water concentration of 1:6.6.

Author Contributions

Conceptualization, O.P. and A.P.; formal analysis, O.P.; investigation, O.P.; F.T.; J.-B.B.; P.R. and A.P.; writing—original draft preparation, A.P.; writing—review and editing, O.P.; F.T.; J.-B.B.; P.R. and A.P.; funding acquisition, A.P. All authors have read and agreed to the published version of the manuscript.

Funding

The research leading to this result has been supported by the project CALIPSOplus under the Grant Agreement 730872 from the EU Framework Programme for Research and Innovation HORIZON 2020, for the beamtimes 20170928 and 20190321 at Soleil Synchrotron, and by the project titled “Effect of water on the local structure and phase behavior of hydrophilic ionic liquids” funded by Sapienza University of Rome (Progetto Ateneo 2018, prot. RM11816427031C31).

Conflicts of Interest

The authors declare no conflict of interest.

References

  1. Verma, C.; Mishra, A.; Chauhan, S.; Verma, P.; Srivastava, V.; Quraishi, M.A.; Ebenso, E.E. Dissolution of cellulose in ionic liquids and their mixed cosolvents: A review. Sustain. Chem. Pharm. 2019, 13, 100162. [Google Scholar] [CrossRef]
  2. Isosaari, P.; Srivastava, V.; Sillanpää, M. Ionic liquid-based water treatment technologies for organic pollutants: Current status and future prospects of ionic liquid mediated technologies. Sci. Total Environ. 2019, 690, 604–619. [Google Scholar] [CrossRef] [PubMed]
  3. Saha, D.; Mukherjee, A. Effect of water and ionic liquids on biomolecules. Biophys. Rev. 2018, 10, 795–808. [Google Scholar] [CrossRef] [PubMed]
  4. Borodin, O.; Self, J.; Persson, K.A.; Wang, C.; Xu, K. Uncharted waters: Super-concentrated electrolytes. Joule 2020, 4, 69–100. [Google Scholar] [CrossRef]
  5. BagherKarimi, M.; Mohammadi, F.; Hooshyari, K. Recent approaches to improve Nafion performance for fuel cell applications: A review. Int. J. Hydrog. Energy 2019, 44, 28919–28938. [Google Scholar]
  6. Hejazifar, M.; Lanaridi, O.; Bica-Schroder, K. Ionic liquid based microemulsions: A review. J. Mol. Liq. 2020, 303, 112264. [Google Scholar] [CrossRef]
  7. Domańska, U. Experimental data of fluid phase equilibria-correlation and prediction models: A review. Processes 2019, 7, 277. [Google Scholar] [CrossRef] [Green Version]
  8. Ma, C.; Laaksonen, A.; Liu, C.; Lu, X.; Ji, X. The peculiar effect of water on ionic liquids and deep eutectic solvents. Chem. Soc. Rev. 2018, 47, 8685–8720. [Google Scholar] [CrossRef] [Green Version]
  9. Cammarata, L.; Kazarian, S.G.; Salter, P.A.; Welton, T. Molecular states of water in room temperature ionic liquids. Phys. Chem. Chem. Phys. 2001, 3, 5192–5200. [Google Scholar] [CrossRef] [Green Version]
  10. Aliaga, C.; Baker, G.A.; Baldelli, S. Sum frequency generation studies of ammonium and pyrrolidinium ionic liquids based on the bis-trifluoromethanesulfonimide anion. J. Phys. Chem. B 2008, 112, 1676–1684. [Google Scholar] [CrossRef]
  11. Fazio, B.; Triolo, A.; Di Marco, G. Local organization of water and its effect on the structural heterogeneities in room-temperature ionicliquid/H2O mixtures. J. Raman Spectrosc. 2008, 39, 233–237. [Google Scholar] [CrossRef]
  12. Bešter-Rogač, M.; Stoppa, A.; Hunger, J.; Hefter, G.; Buchner, R. Association of ionic liquids in solution: A combined dielectric and conductivity study of [bmim][Cl] in water and in acetonitrile. Phys. Chem. Chem. Phys. 2011, 13, 17588–17598. [Google Scholar] [CrossRef] [PubMed] [Green Version]
  13. Fadeeva, T.A.; Husson, P.; DeVine, J.A.; Costa Gomes, M.F.; Greenbaum, S.G.; Castner, E.W. Interactions between water and 1-butyl-1-methylpyrrolidinium ionic liquids. J. Chem. Phys. 2015, 143, 064503. [Google Scholar] [CrossRef] [PubMed]
  14. Yaghini, N.; Pitawala, J.; Matic, A.; Martinelli, A. Effect of water on the local structure and phase behavior of imidazolium-based protic ionic liquids. J. Phys. Chem. B 2015, 119, 1611–1622. [Google Scholar] [CrossRef] [PubMed]
  15. Śmiechowski, M. Anion–Water interactions of weakly hydrated anions: Molecular dynamics simulations of aqueous NaBF4 and NaPF6. Mol. Phys. 2016, 114, 1831–1846. [Google Scholar] [CrossRef]
  16. Abe, H.; Takekiyo, T.; Yoshimura, Y.; Saihara, K.; Shimizu, A. Anomalous freezing of nano-confined water in room-temperature ionic liquid 1-butyl-3-methylimidazolium nitrate. ChemPhysChem 2016, 17, 1136–1142. [Google Scholar] [CrossRef]
  17. Wang, H.; Liu, M.; Zhao, Y.; Xuan, X.; Zhao, Y.; Wang, J. Hydrogen bonding mediated ion pairs of some aprotic ionic liquids and their structural transition in aqueous solution. Sci. China Chem. 2017, 60, 970–978. [Google Scholar] [CrossRef]
  18. Kundu, K.; Chandra, G.K.; Umapathy, S.; Kiefer, J. Spectroscopic and computational insights into the ion–solvent interactions in hydrated aprotic and protic ionic liquids. Phys. Chem. Chem. Phys. 2019, 21, 20791–20804. [Google Scholar] [CrossRef]
  19. Abe, H.; Takekiyo, T.; Yoshimura, Y.; Shimizu, A. Static and dynamic properties of nano-confined water in room-temperature ionic liquids. J. Mol. Liq. 2019, 290, 111216. [Google Scholar] [CrossRef]
  20. van der Vegt, N.F.A.; Haldrup, K.; Roke, S.; Zheng, J.; Lund, M.; Bakker, H.J. Water-mediated ion pairing: Occurrence and relevance. Chem. Rev. 2016, 116, 7626–7641. [Google Scholar] [CrossRef] [Green Version]
  21. Fumino, K.; Stange, P.; Fossog, V.; Hempelmann, R.; Ludwig, R. Equilibrium of contact and solvent-separated ion pairs in mixtures of protic ionic liquids and molecular solvents controlled by polarity. Angew. Chem. Int. Ed. 2013, 52, 12439–12442. [Google Scholar] [CrossRef] [PubMed]
  22. Schröder, C.; Rudas, T.; Neumayr, G.; Benkner, S.; Steinhauser, O. On the collective network of ionic liquid/water mixtures. I. Orientational structure. J. Chem. Phys. 2007, 127, 234503. [Google Scholar] [CrossRef] [PubMed]
  23. Varela, L.M.; Méndez-Morales, T.; Carrete, J.; Gómez-González, V.; Docampo-Álvarez, B.; Gallego, L.J.; Cabeza, O.; Russina, O. Solvation of molecular cosolvents and inorganic salts in ionic liquids: A review of molecular dynamics simulations. J. Mol. Liq. 2015, 210, 178–188. [Google Scholar] [CrossRef]
  24. Heid, E.; Docampo-Álvarez, B.; Varela, L.M.; Prosenz, K.; Steinhauser, O.; Schröder, C. Langevin behavior of the dielectric decrement in ionic liquid water mixtures. Phys. Chem. Chem. Phys. 2018, 20, 15106–15117. [Google Scholar] [CrossRef] [PubMed] [Green Version]
  25. Schröder, C.; Hunger, J.; Stoppa, A.; Buchner, R.; Steinhauser, O. On the collective network of ionic liquid/water mixtures. II. Decomposition and interpretation of dielectric spectra. J. Chem. Phys. 2008, 129, 184501. [Google Scholar]
  26. Macchieraldo, R.; Esser, L.; Elfgen, R.; Voepel, P.; Zahn, S.; Smarsly, B.M.; Kirchner, B. Hydrophilic ionic liquid mixtures of weakly and strongly coordinating anions with and without water. ACS Omega 2018, 3, 8567–8582. [Google Scholar] [CrossRef] [Green Version]
  27. Freire, M.G.; Neves, C.M.S.S.; Marrucho, I.M.; Coutinho, J.A.P.; Fernandes, A.M. Hydrolysis of tetrafluoroborate and hexafluorophosphate counter ions in imidazolium-based ionic liquids. J. Phys. Chem. A 2010, 114, 3744–3749. [Google Scholar] [CrossRef]
  28. Mariani, A.; Russina, O.; Caminiti, R.; Triolo, A. Structural organization in a methanol:ethylammonium nitrate (1:4) mixture: A joint X-ray/Neutron diffraction and computational study. J. Mol. Liq. 2015, 212, 947–956. [Google Scholar] [CrossRef]
  29. Russina, O.; Sferrazza, A.; Caminiti, R.; Triolo, A. Amphiphile meets amphiphile: Beyond the polar−apolar dualism in ionic liquid/alcohol mixtures. J. Phys. Chem. Lett. 2014, 5, 1738–1742. [Google Scholar] [CrossRef]
  30. Abe, H.; Kohki, E.; Nakada, A.; Kishimura, H. Phase behavior in quaternary ammonium ionic liquid-propanol solutions: Hydrophobicity, molecular conformations, and isomer effects. Chem. Phys. 2017, 491, 136–142. [Google Scholar] [CrossRef]
  31. Abe, H.; Murata, K.; Kiyokawa, S.; Yoshimura, Y. Surface tension anomalies in room temperature ionic liquids-acetone solutions. Chem. Phys. Lett. 2018, 699, 275–278. [Google Scholar] [CrossRef]
  32. Palumbo, O.; Trequattrini, F.; Brubach, J.-B.; Roy, P.; Paolone, A. Crystallization of mixtures of hydrophilic ionic liquids and water: Evidence of microscopic inhomogeneities. J. Colloid Interf. Sci. 2019, 552, 43–50. [Google Scholar] [CrossRef] [PubMed]
  33. Faye, M.; Bordessoule, M.; Kanouté, B.; Brubach, J.B.; Roy, P.; Manceron, L. Improved mid infrared detector for high spectral or spatial resolution and synchrotron radiation use. Rev. Sci. Instr. 2016, 87, 063119. [Google Scholar] [CrossRef]
  34. Vitucci, F.M.; Palumbo, O.; Trequattrini, F.; Brubach, J.-B.; Roy, P.; Meschini, I.; Croce, F.; Paolone, A. Interaction of 1-butyl-1-methylpyrrolidinium bis(trifluoromethanesulfonyl)imide with an electrospun PVdF membrane: Temperature dependence of the anion conformers. J. Chem. Phys. 2015, 143, 094707. [Google Scholar] [CrossRef] [PubMed]
  35. Jurgens, B.; Irran, E.; Schnick, W. Syntheses, vibrational spectroscopy, and crystal structure determination from X-Ray powder diffraction data of alkaline earth dicyanamides M[N(CN)2]2 with M = Mg, Ca, Sr, and Ba. J. Solid State Chem. 2001, 157, 241–249. [Google Scholar] [CrossRef]
  36. Dahl, K.; Sando, G.M.; Fox, D.M.; Sutto, T.E.; Owrutsky, J.C. Vibrational spectroscopy and dynamics of small anions in ionic liquid solutions. J. Chem. Phys. 2005, 123, 084504. [Google Scholar] [CrossRef] [PubMed]
  37. Sprague, J.W.; Grasselli, J.G.; Ritchey, W.M. The synthesis and infrared and nuclear magnetic resonance spectra of ammonium dicyanamide. J. Phys. Chem. 1964, 68, 431–433. [Google Scholar] [CrossRef]
  38. Le Caer, S.; Klein, G.; Ortiz, D.; Lima, M.; Devineau, S.; Pin, S.; Brubach, J.-B.; Roy, P.; Pommeret, S.; Leibl, W.; et al. The effect of myoglobin crowding on the dynamics of water: An infrared study. Phys. Chem. Chem. Phys. 2014, 16, 22841–22852. [Google Scholar] [CrossRef]
  39. Wang, H.; Liu, S.; Zhao, Y.; Zhang, H.; Wang, J. Molecular origin for the difficulty in separation of 5-hydroxymethylfurfural from imidazolium based ionic liquids. ACS Sustain. Chem. Eng. 2016, 4, 6712–6721. [Google Scholar] [CrossRef]
  40. Haddad, B.; Brandán, S.A.; Assenine, M.A.; Paolone, A.; Villemin, D.; Bresson, S. Bidentate cation-anion coordination in the ionic liquid 1-ethyl-3-methylimidazolium hexafluorophosphate supported by vibrational spectra and NBO, AIM and SQMFF calculations. J. Mol. Struct. 2020, 1212, 128104. [Google Scholar] [CrossRef]
  41. Brubach, J.-B.; Mermet, A.; Filabozzi, A.; Colavita, P.; Gerschel, A.; Roy, P. Infrared investigation of water encapsulated in non ionic reverse micelles. J. Phys. IV 2000, 10, 215–218. [Google Scholar] [CrossRef]
  42. DallaBernardina, S.; Paineau, E.; Brubach, J.-B.; Judeinstein, P.; Rouzière, S.; Launois, P.; Roy, P. Water in carbon nanotubes: The peculiar hydrogen bond network revealed by infrared spectroscopy. J. Am. Chem. Soc. 2016, 138, 10437–10443. [Google Scholar] [CrossRef] [PubMed]
  43. Russina, O.; Lo Celso, F.; Plechkova, N.V.; Triolo, A. Emerging evidences of mesoscopic-scale complexity in neat ionic liquids and their mixtures. J. Phys. Chem. Lett. 2017, 8, 1197–1204. [Google Scholar] [CrossRef] [PubMed]
Figure 1. Basic structure of the PYR14 cation and the DCA anion.
Applsci 10 04837 g001
Figure 2. Comparison of the infrared absorbance of PYR14-DCA measured at 300 and 241 K on heating (upper part of the panels, the lines are vertically shifted for clarity) and the calculated absorbance for the isolated ions DCA and PYR14 (lower part of the figures). For dicyanamide a scaling factor of the vibration frequencies of 0.97 was considered. The blue, magenta and yellow rectangles show the regions of the vibrations of the DCA anion, the PYR14 cation and water, respectively. The scales of the vertical axes are the same in the three panels (as indicated in the left panel).
Applsci 10 04837 g002
Figure 3. Comparison of the infrared absorption spectra measured at 300 K of PYR14-DCA and PYR14-DCA + H2O.
Applsci 10 04837 g003
Figure 4. Temperature dependence of the spectra of PYR14-DCA measured on heating from 160 up to 320 K in different frequency regions (700–1550 and 2050–2300 cm−1 in the left panel and 2800–3700 cm−1 in the right panel).
Applsci 10 04837 g004
Figure 5. Temperature dependence of the parameters of the most significant absorption lines of PYR14-DCA measured on heating from 160 up to 300 K.
Applsci 10 04837 g005
Figure 6. Temperature dependence of the spectra of PYR14-DCA + H2O measured on heating from 140 up to 300 K in different frequency regions (700–1550 and 2050–2300 cm−1 in the left panel and 2800–3700 cm−1 in the right panel).
Applsci 10 04837 g006
Figure 7. Temperature dependence of the parameters of the most significant absorption lines of PYR14-DCA + H2O measured on heating from 160 up to 300 K.
Applsci 10 04837 g007
Figure 8. Comparison of the infrared absorption spectra measured at 160 K and 300 K of PYR14-DCA and PYR14-DCA + H2O in correspondence with three anion vibrational bands. The curves are vertically shifted for clarity.
Applsci 10 04837 g008
Figure 9. Comparison of the infrared absorption spectra measured at 160 K and 300 K of PYR14-DCA and PYR14-DCA + H2O in correspondence with the CH stretching vibrational bands. The curves are vertically shifted for clarity.
Applsci 10 04837 g009

