Lattice Fracture Model for Concrete Fracture Revisited: Calibration and Validation


Abstract
Featured Application
Abstract
1. Introduction
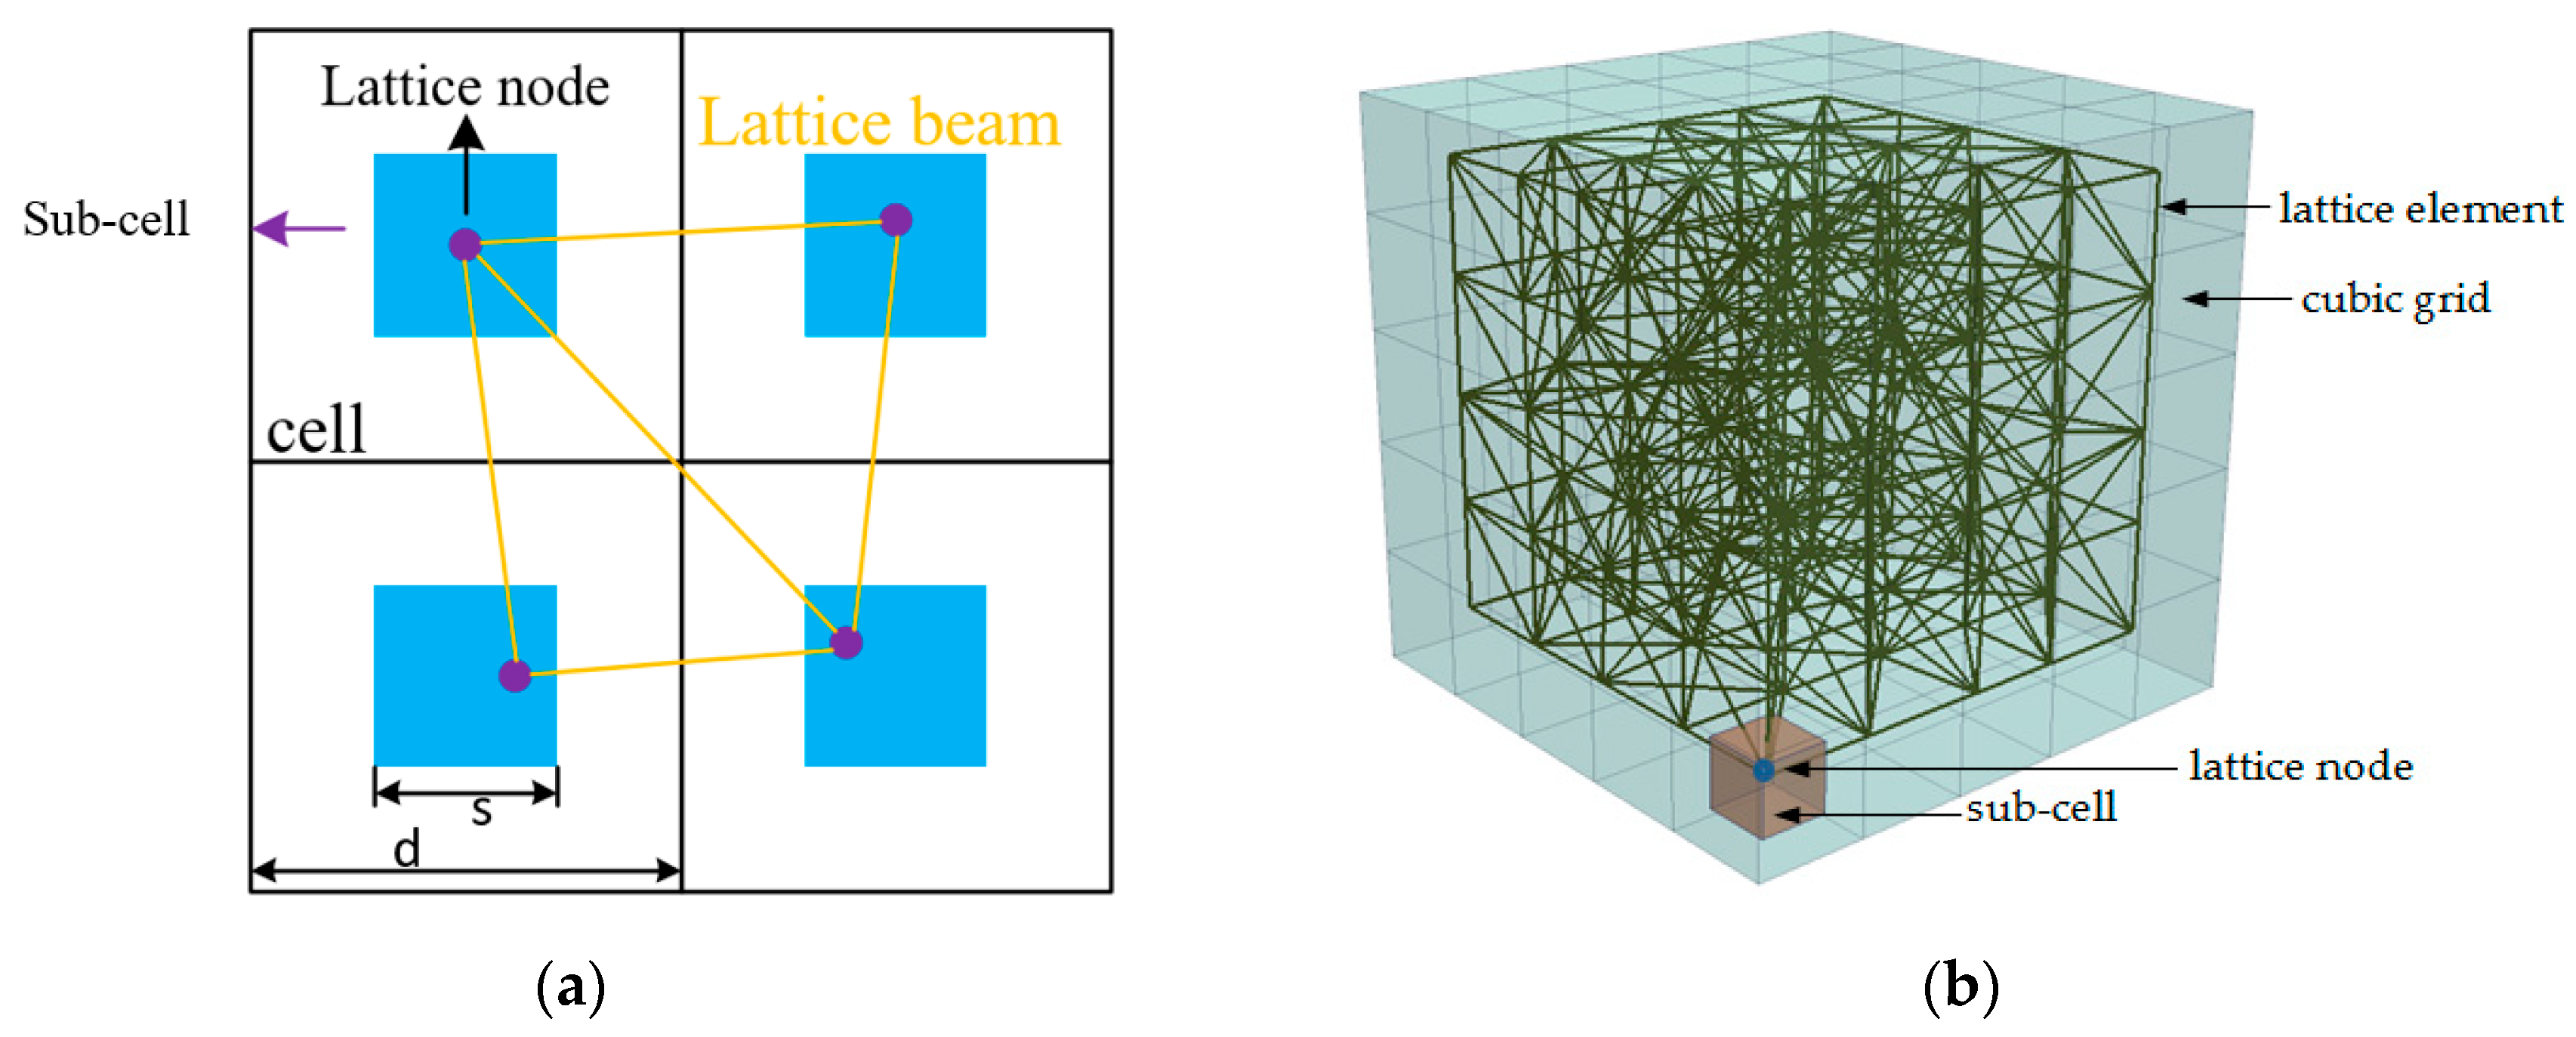
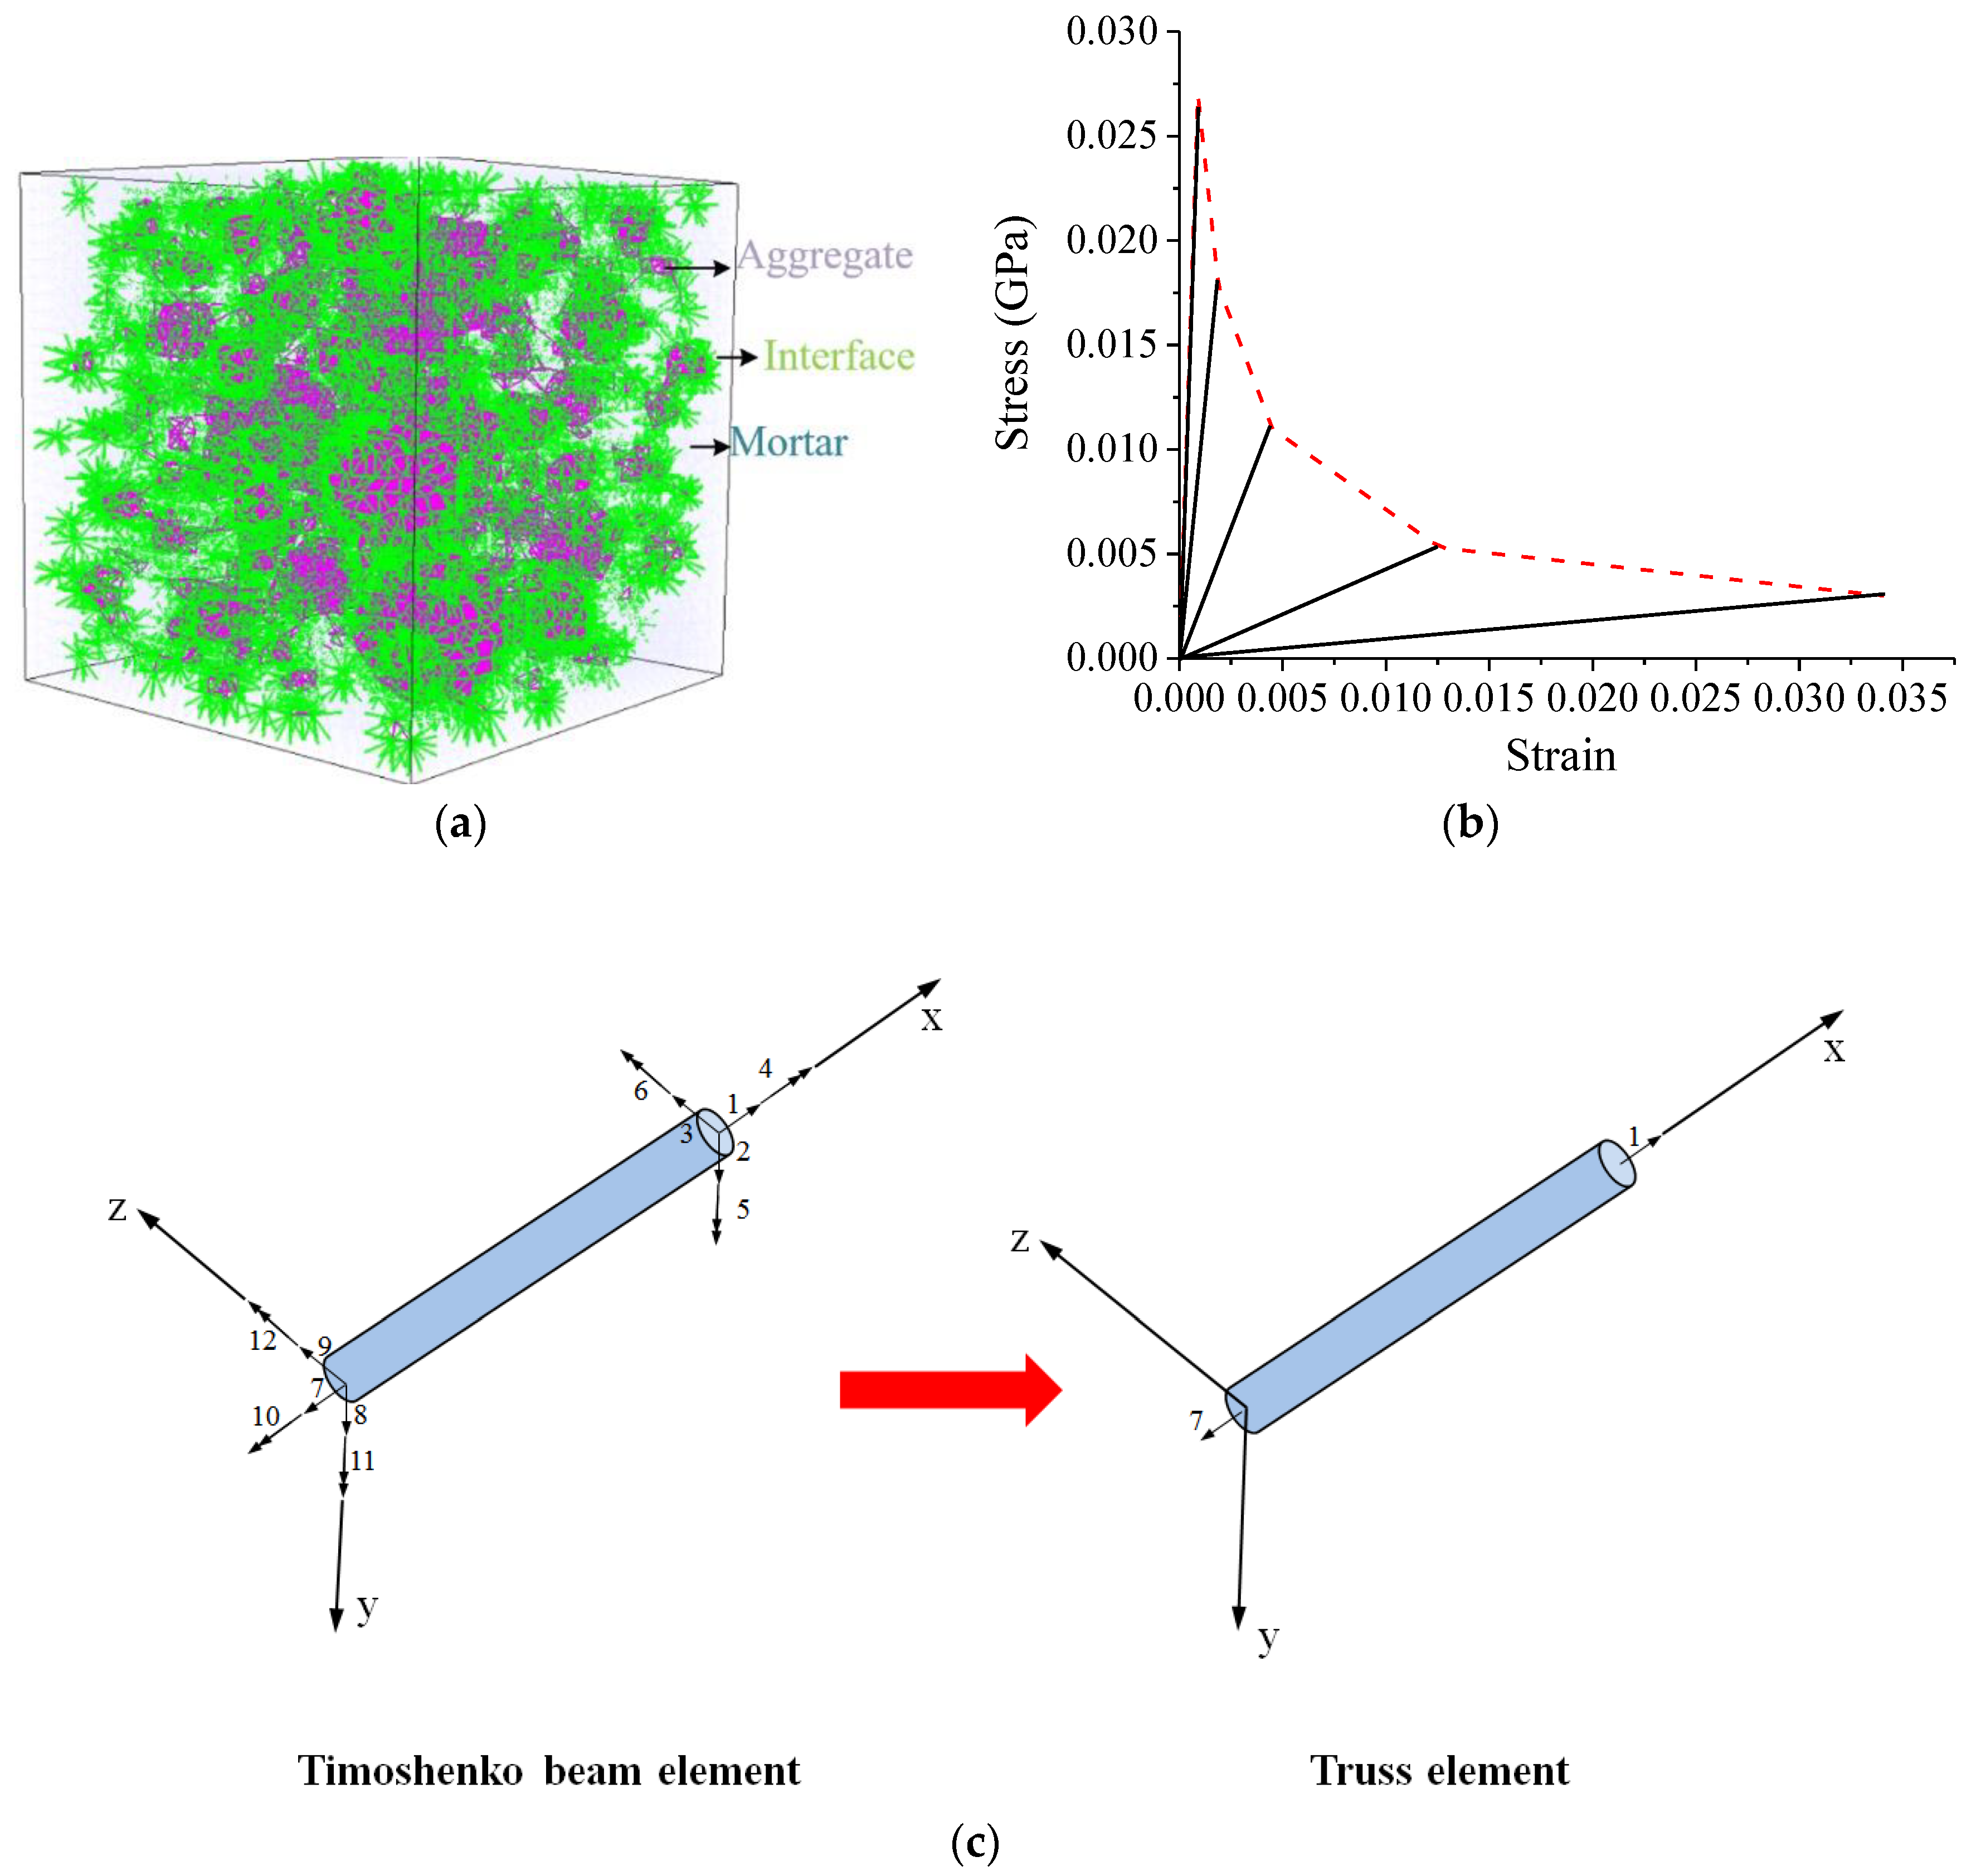
2. Modeling
3. Calibration
- Elastic modulus, E, and shear modulus, G, govern the response in the elastic regime. In LBM, the Poisson’s ratio is determined by the randomness. Based on the 0.2 randomness, the Poisson’s ratio of 0.18 is derived in the study.
- Tensile strength, ft, and compressive strength, fc, of lattice elements govern the macroscopic strength of the model. In this paper, the compressive strength of the lattice element is assumed as 10 times higher than the tensile strength, considering the fact that cementitious materials have a higher resistance to the compressive loading than tensile loading [3].
- Normal force factor, , and bending influence factor, , govern the crack pattern. The macroscopic model response, including the elastic regime and softening part, is also influenced by these two factors. In this paper, the is set to 1, which is in line with the literature [18,32,44]. The is determined through the calibration procedure that follows.
4. Validation
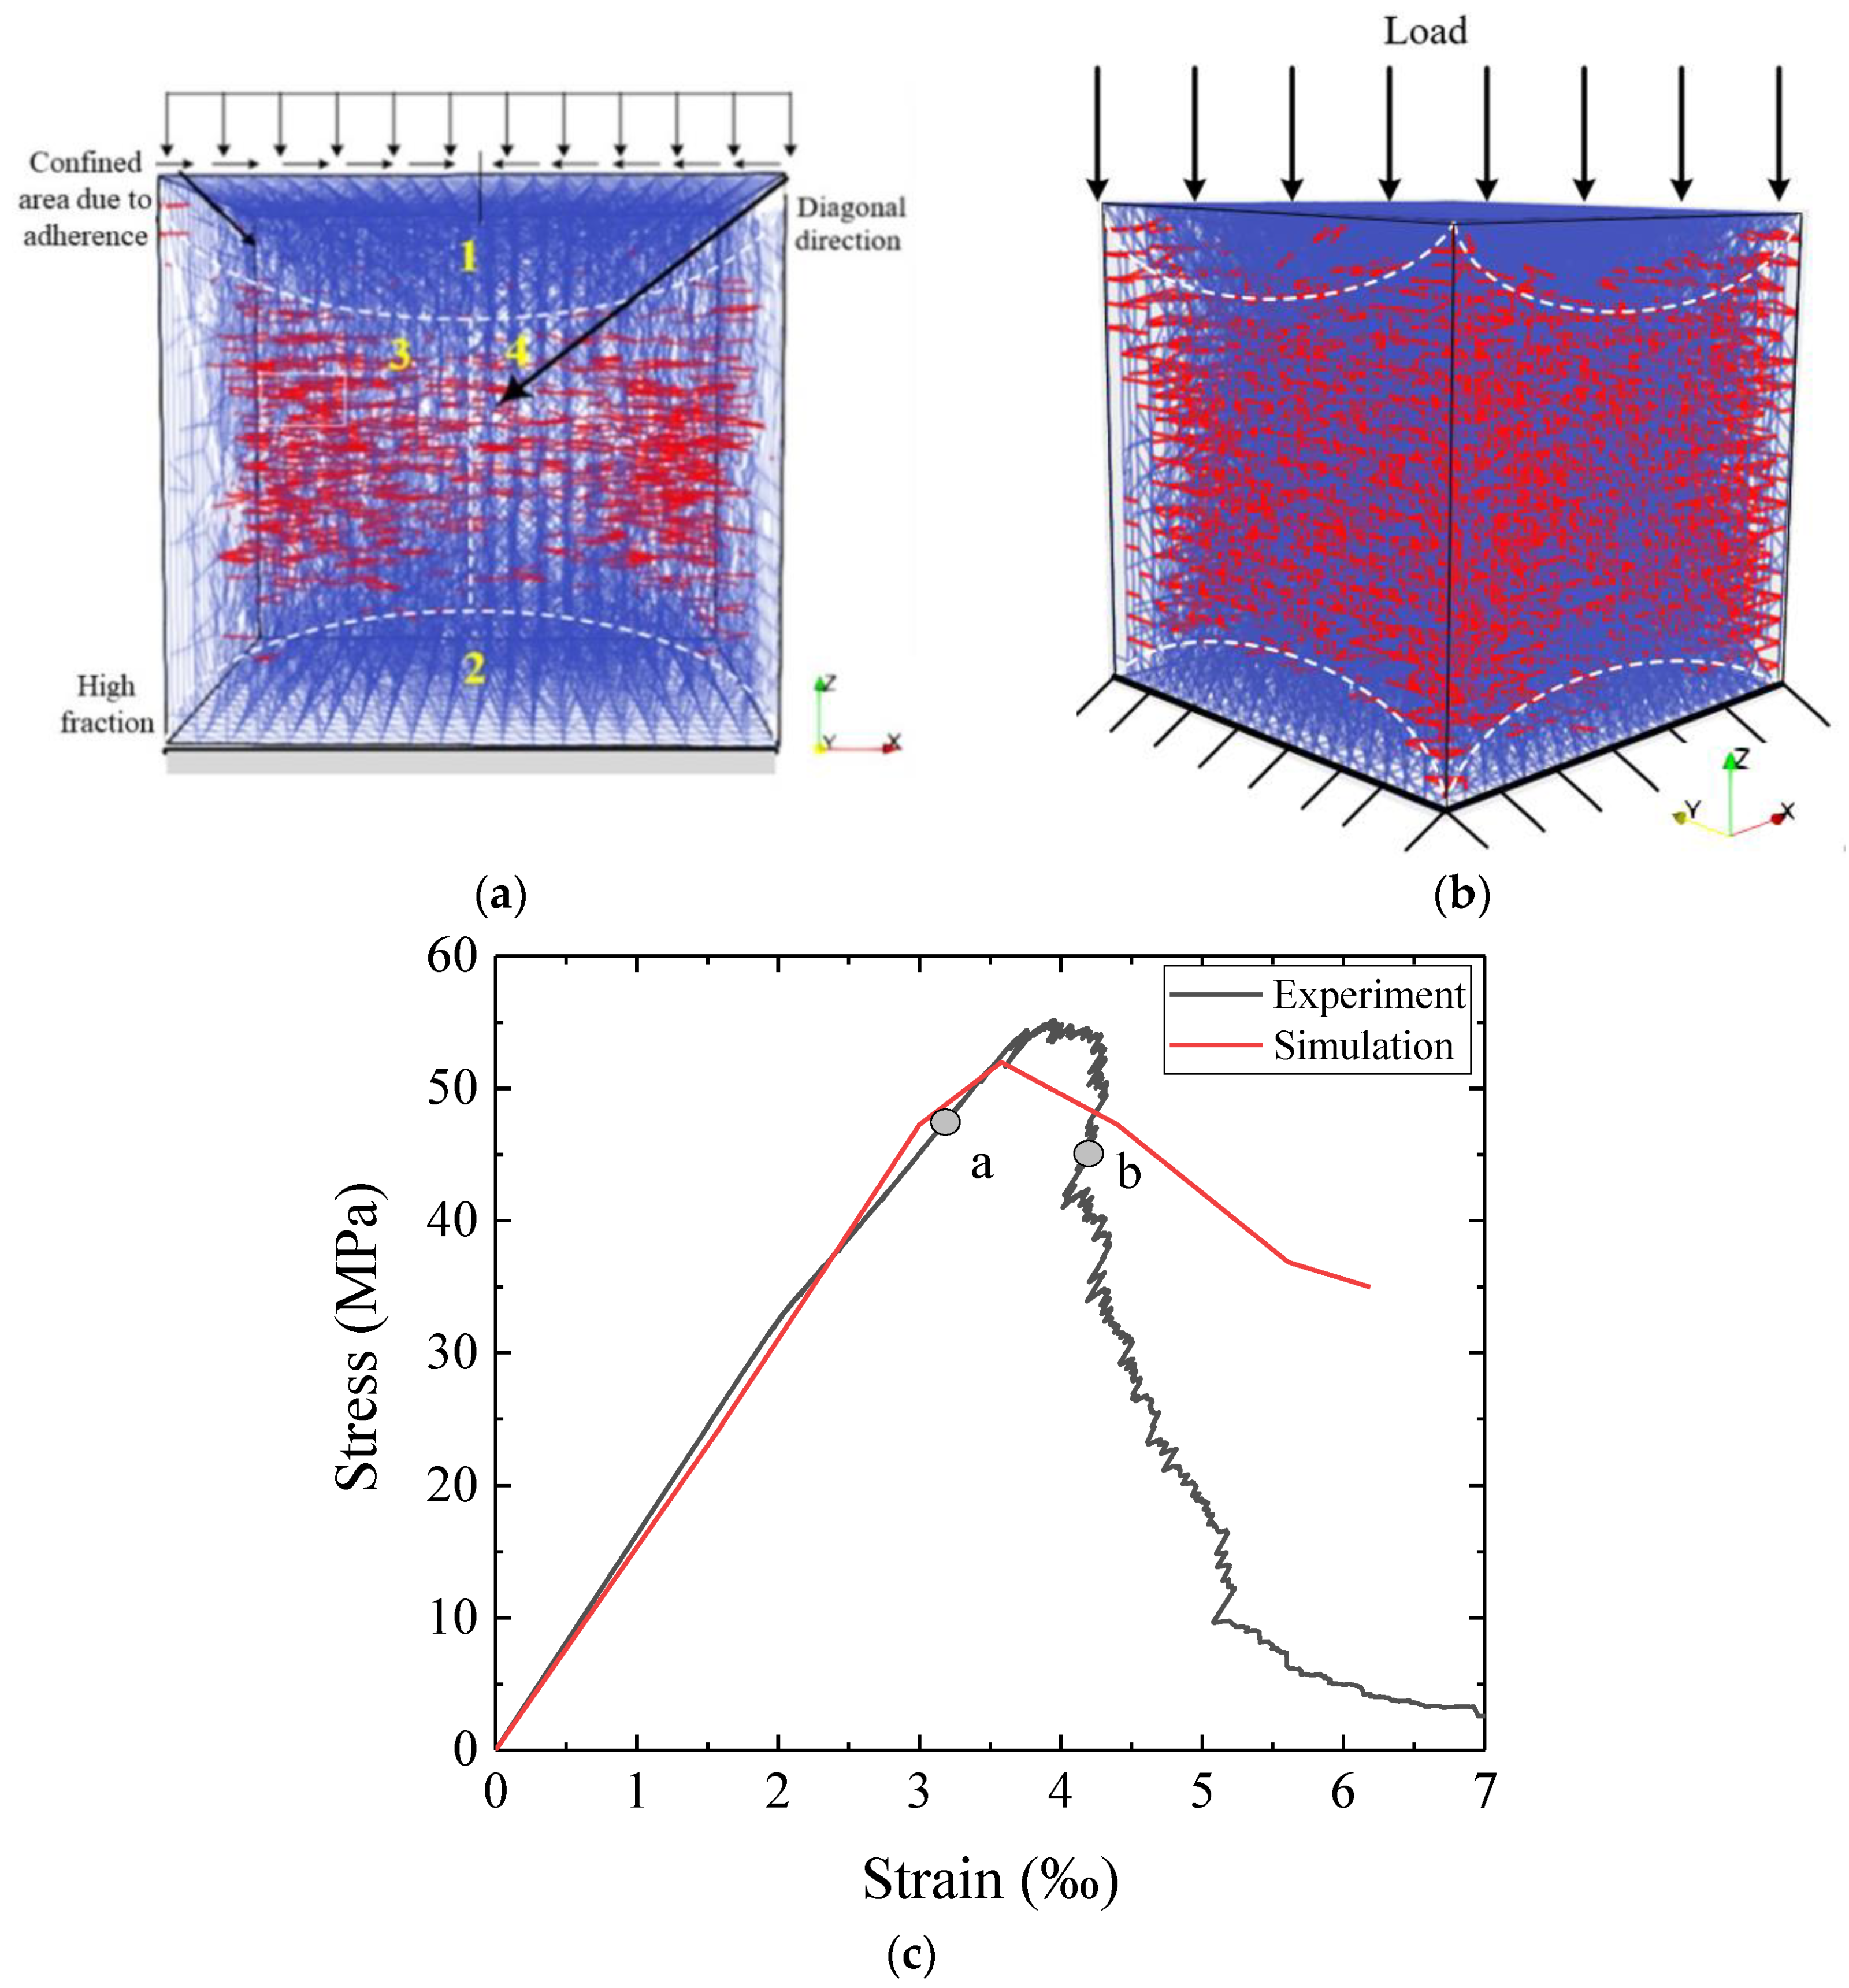
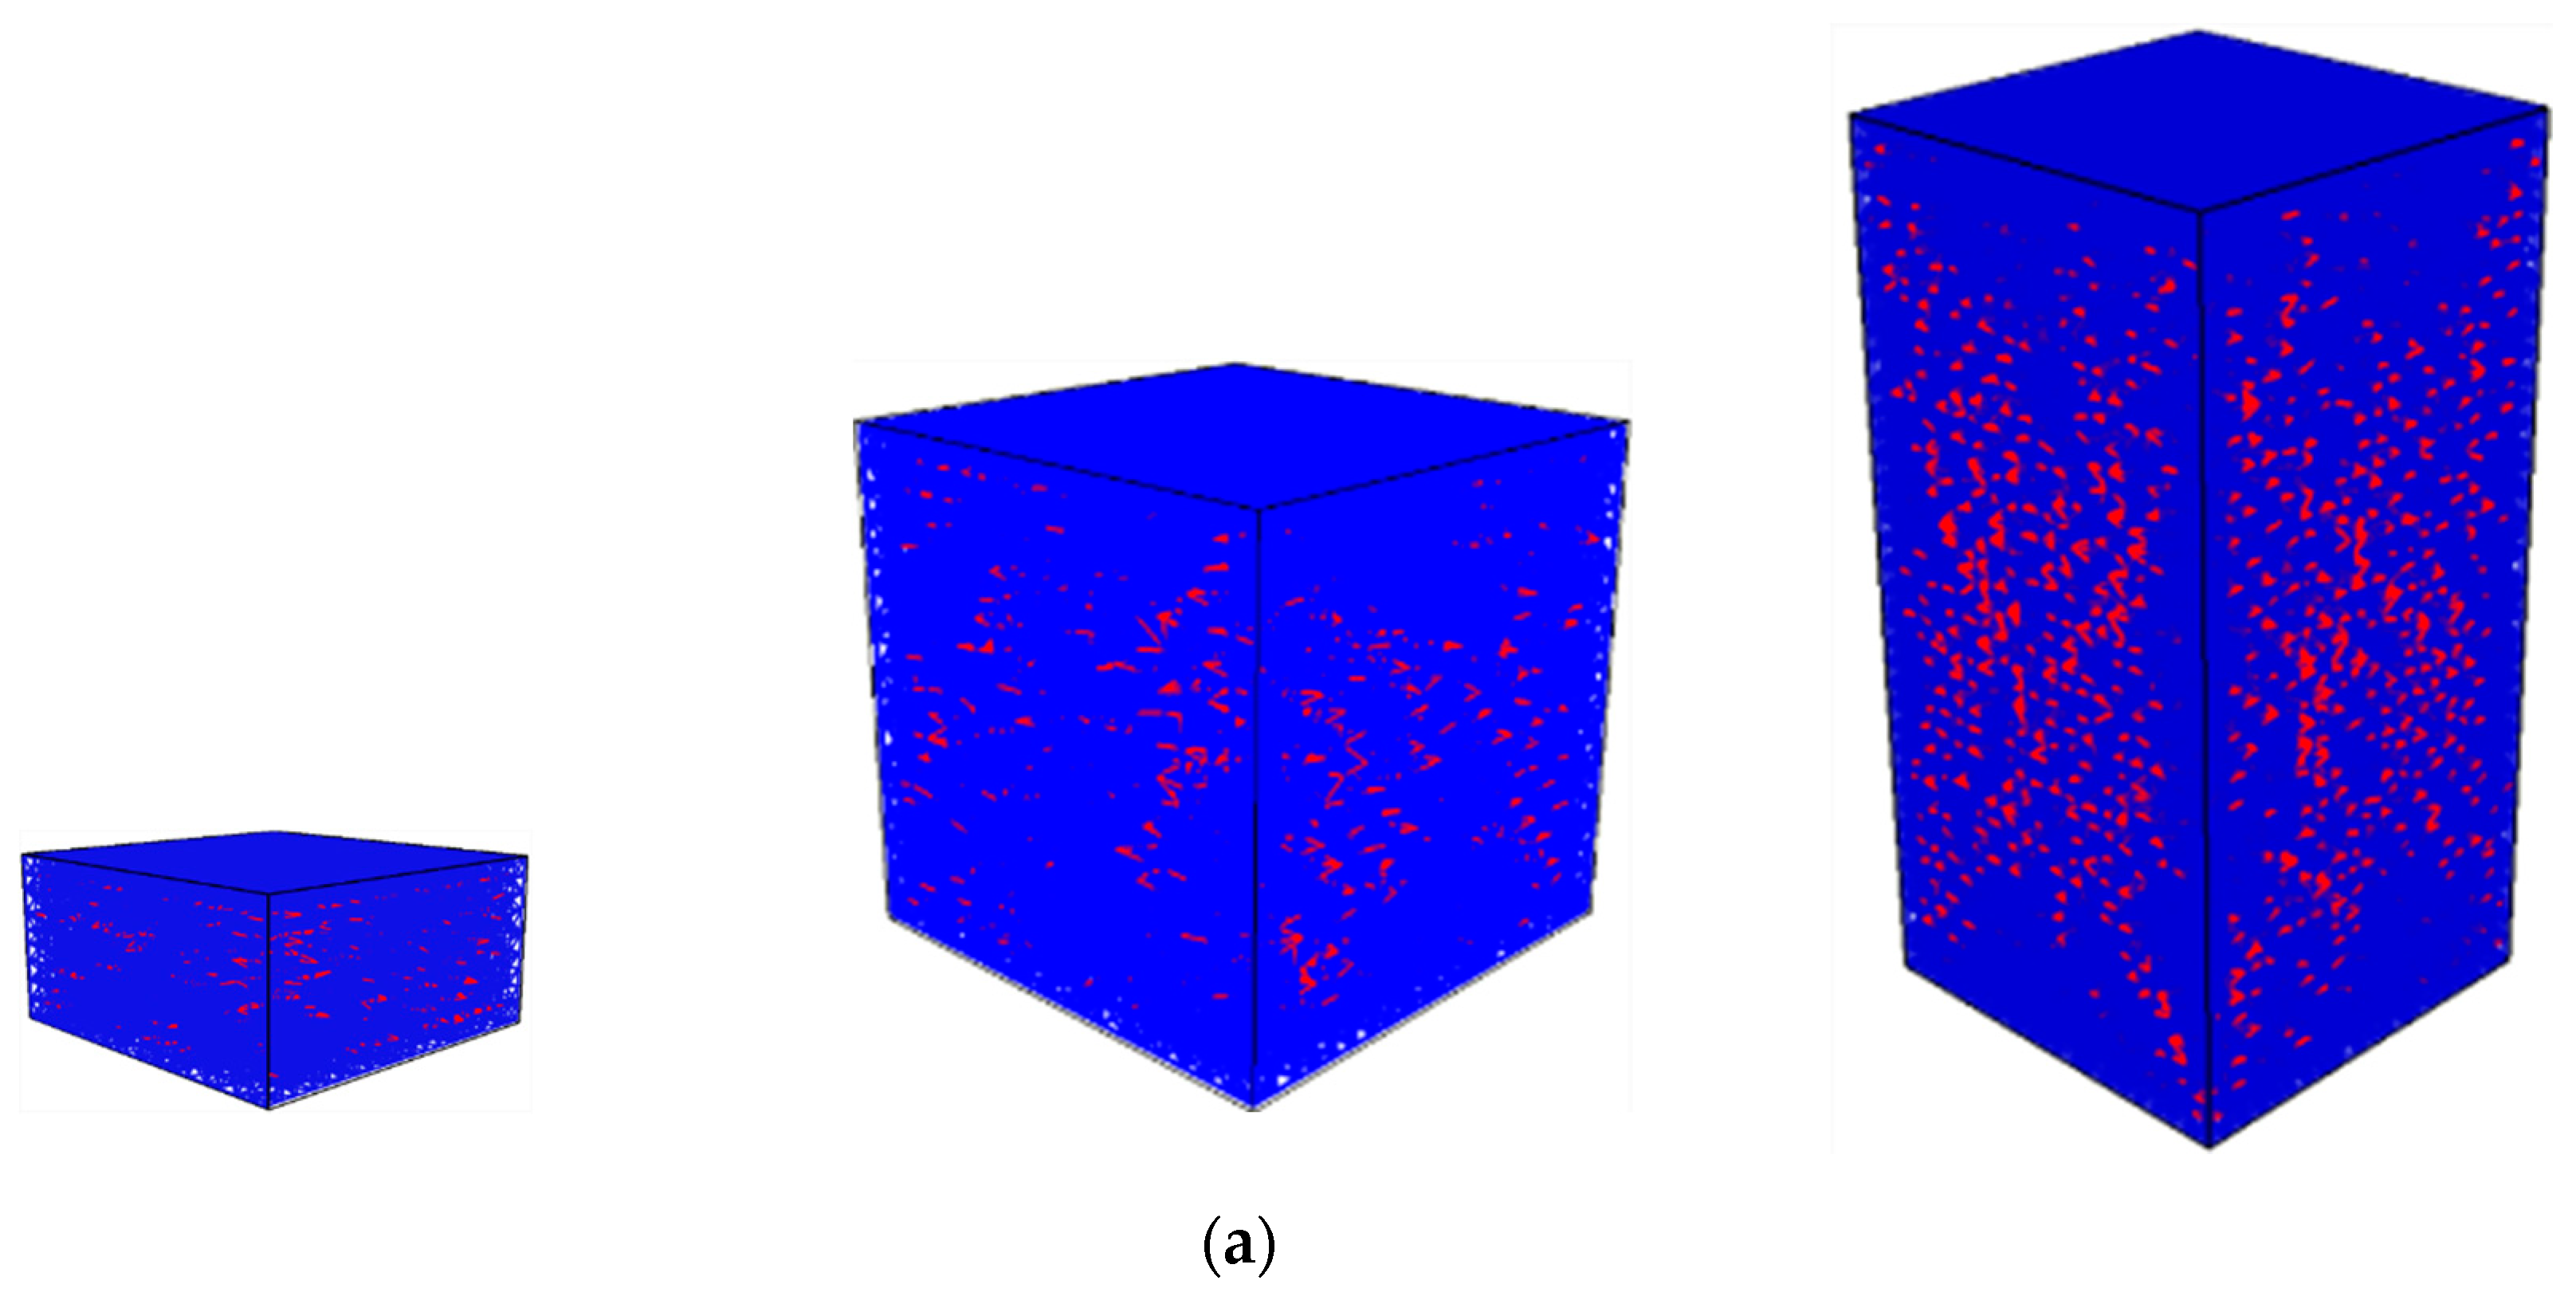
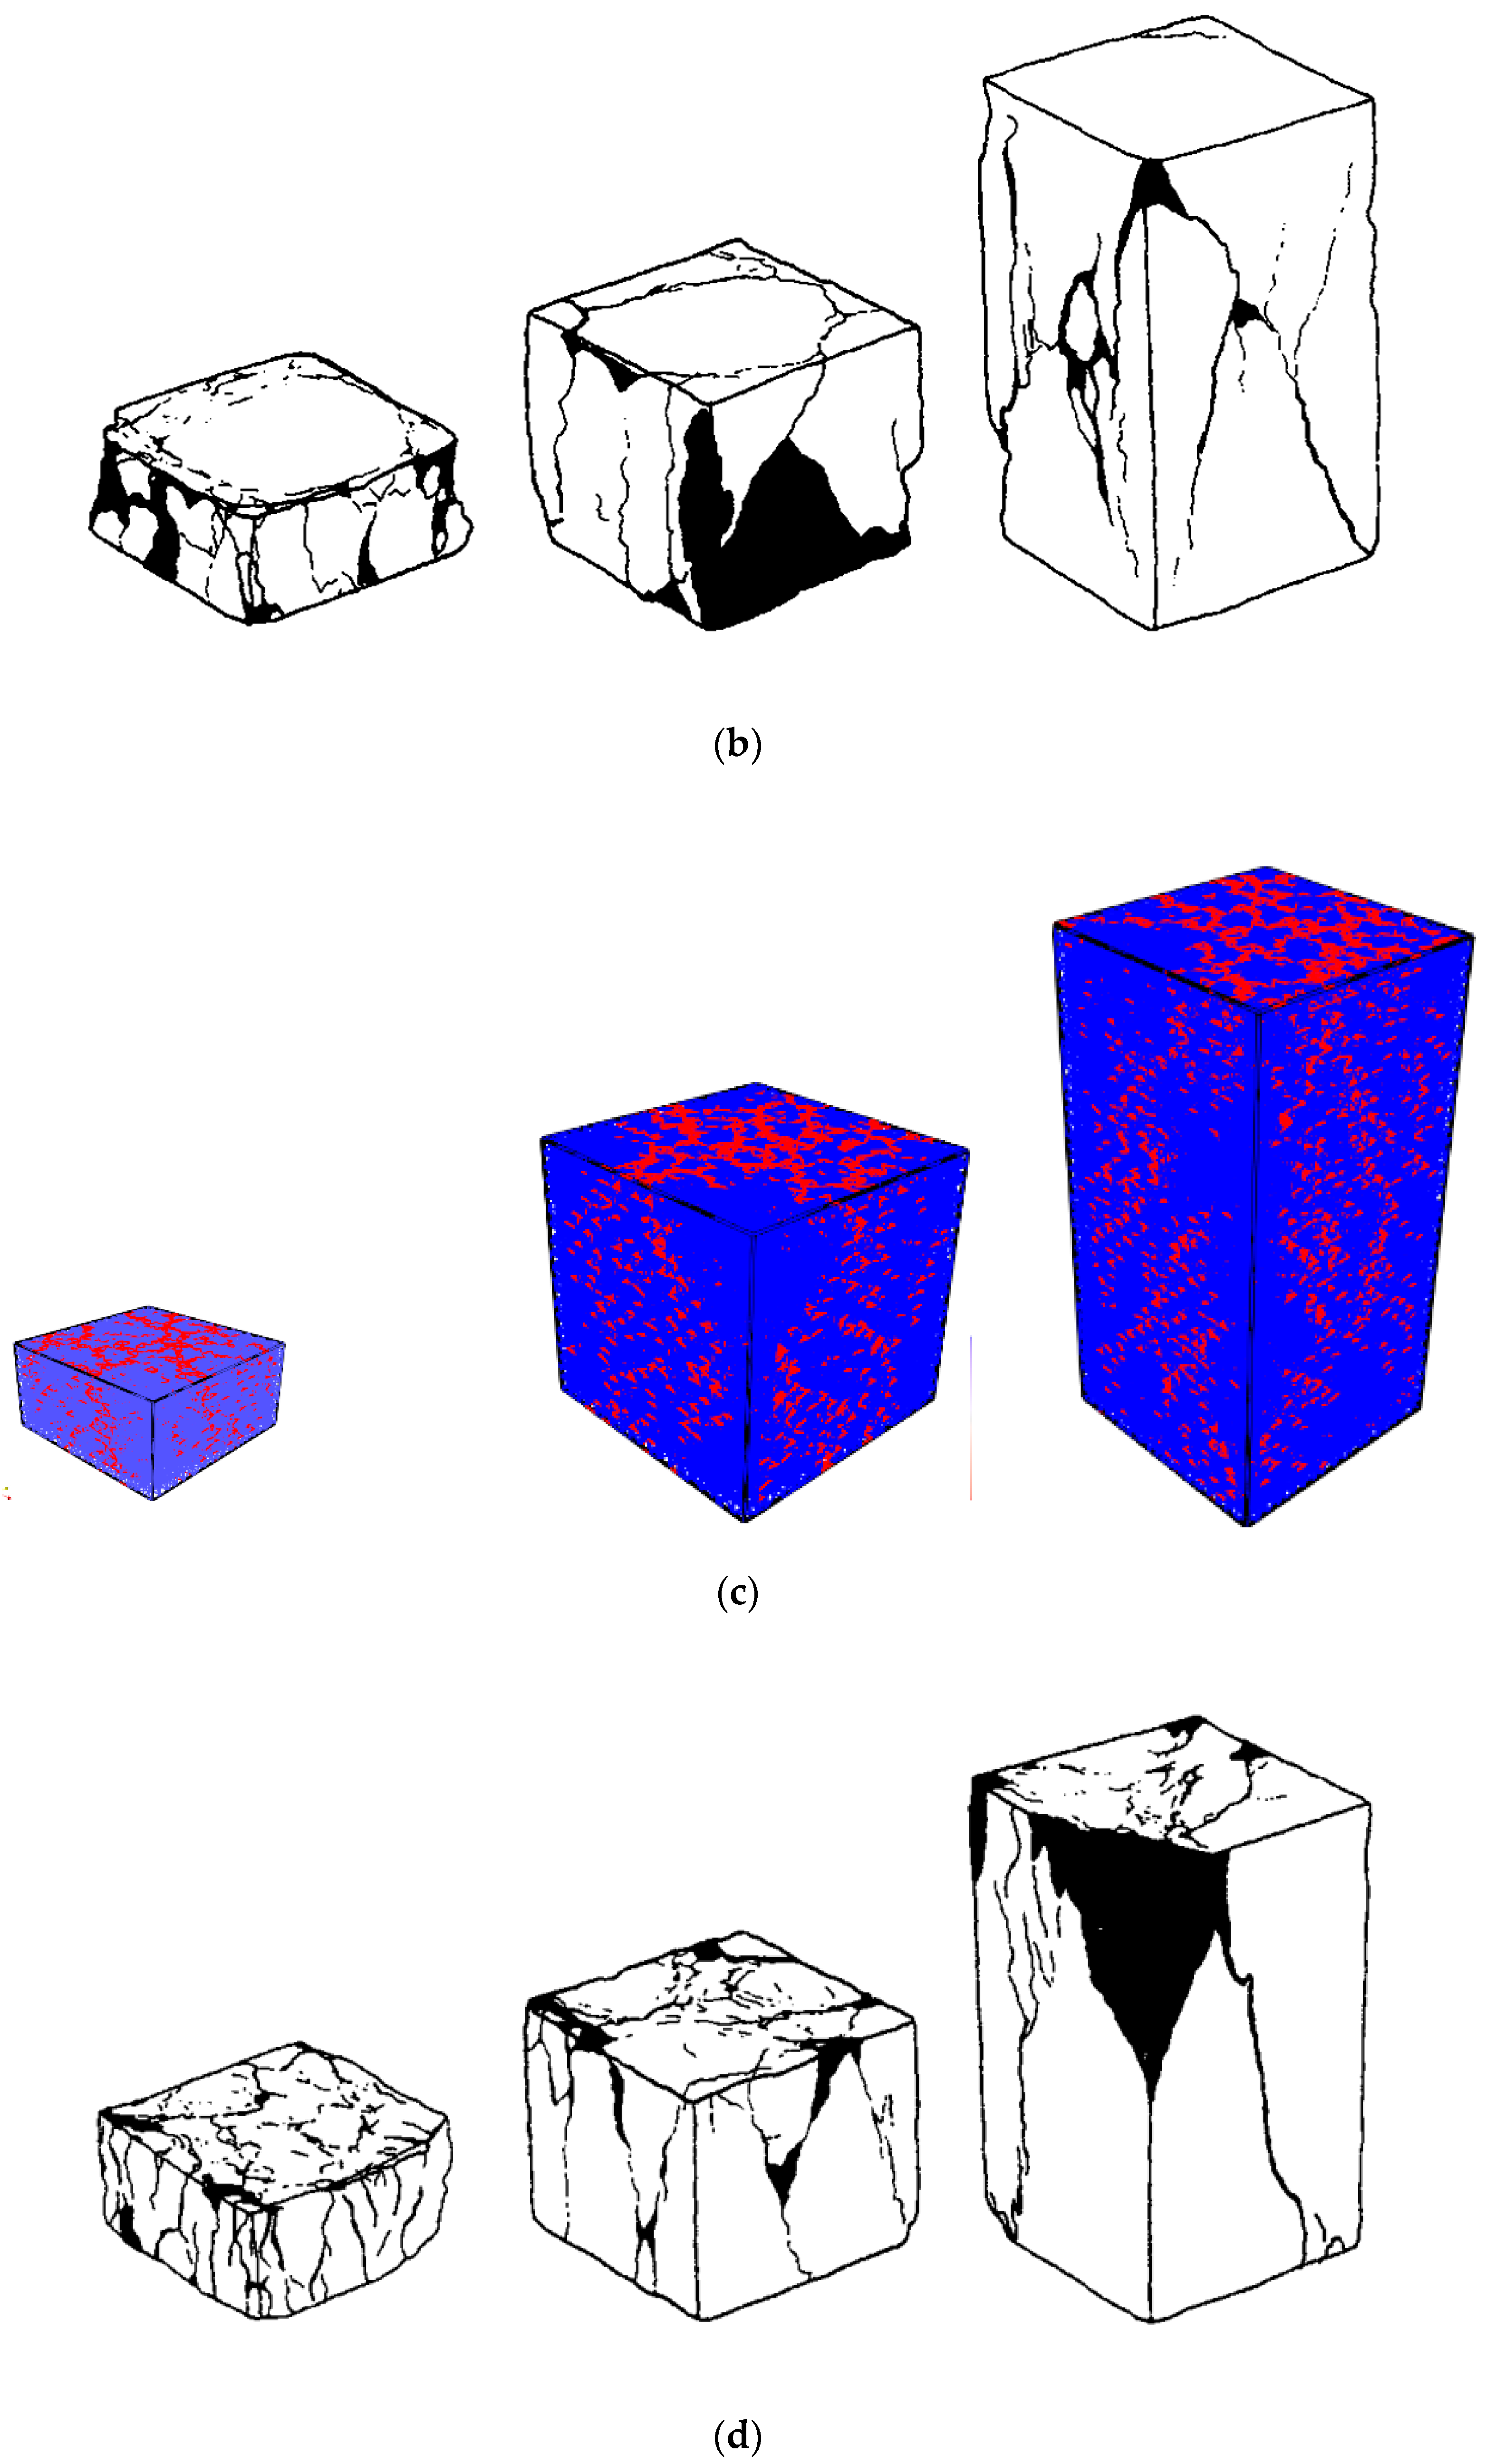
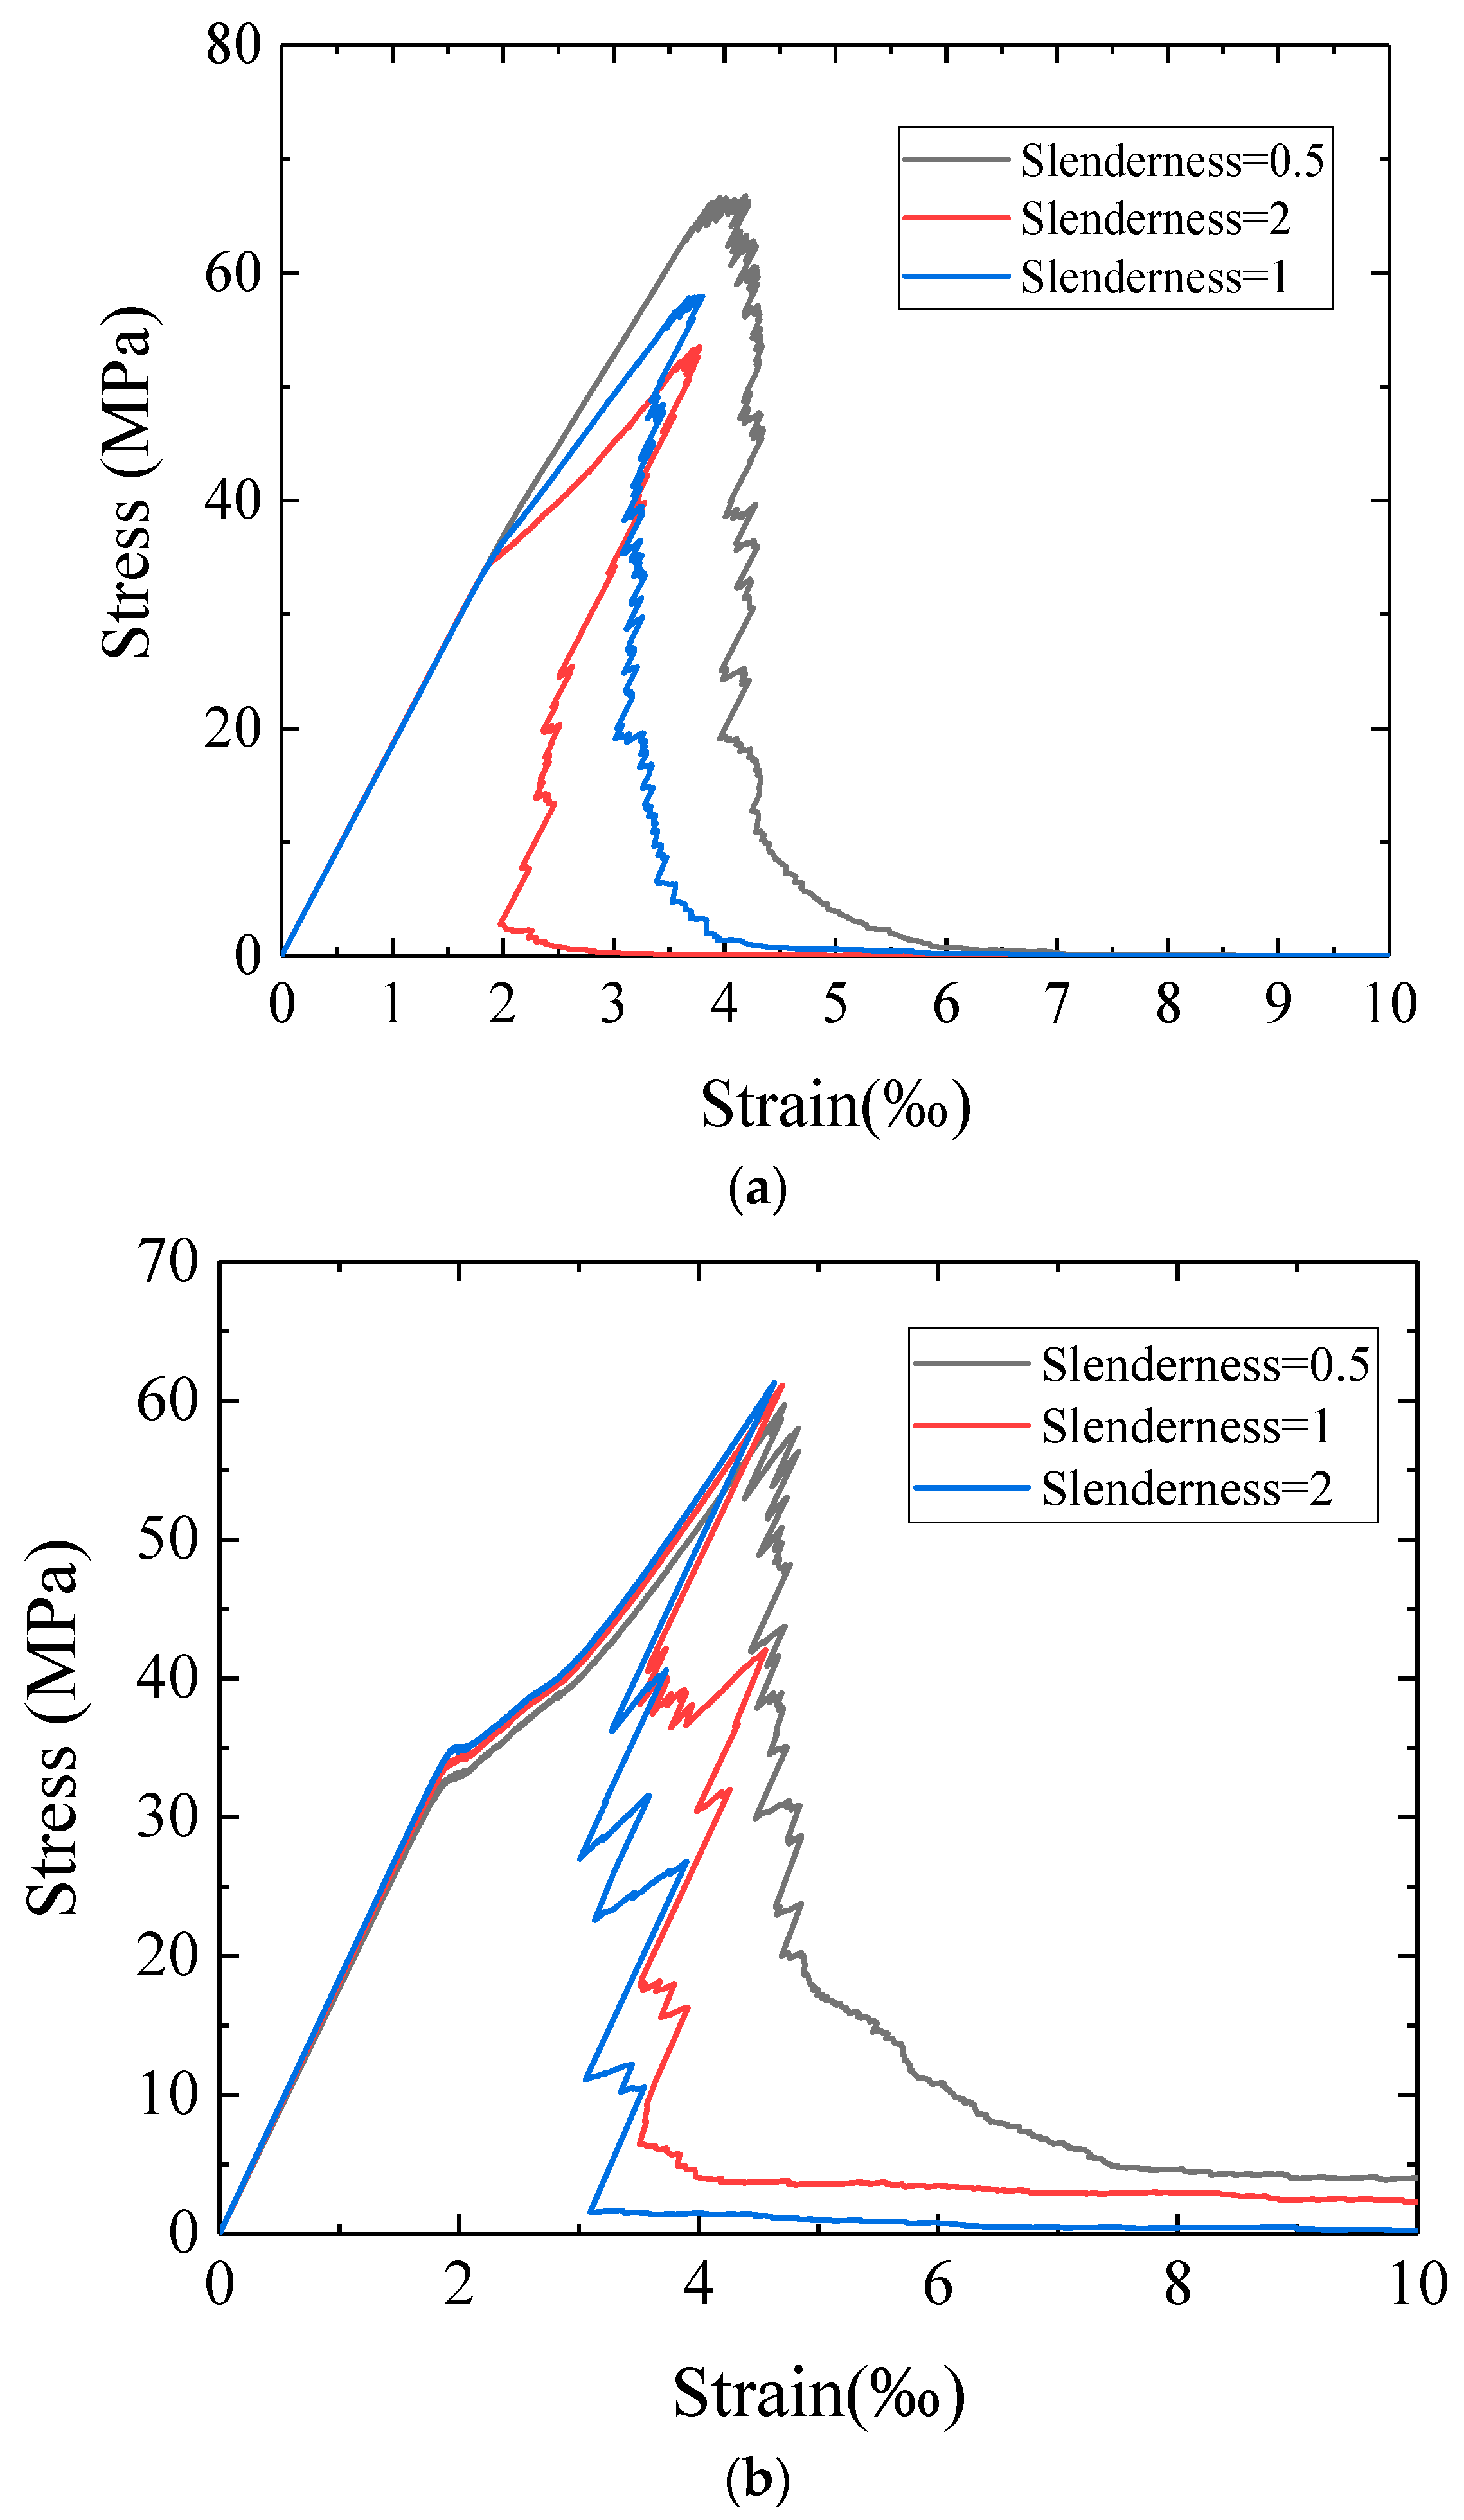
4.1. Uniaxial Compression Test
4.2. Tensile Splitting Test
4.3. Three-Point Bending Test
4.3.1. Size Effect
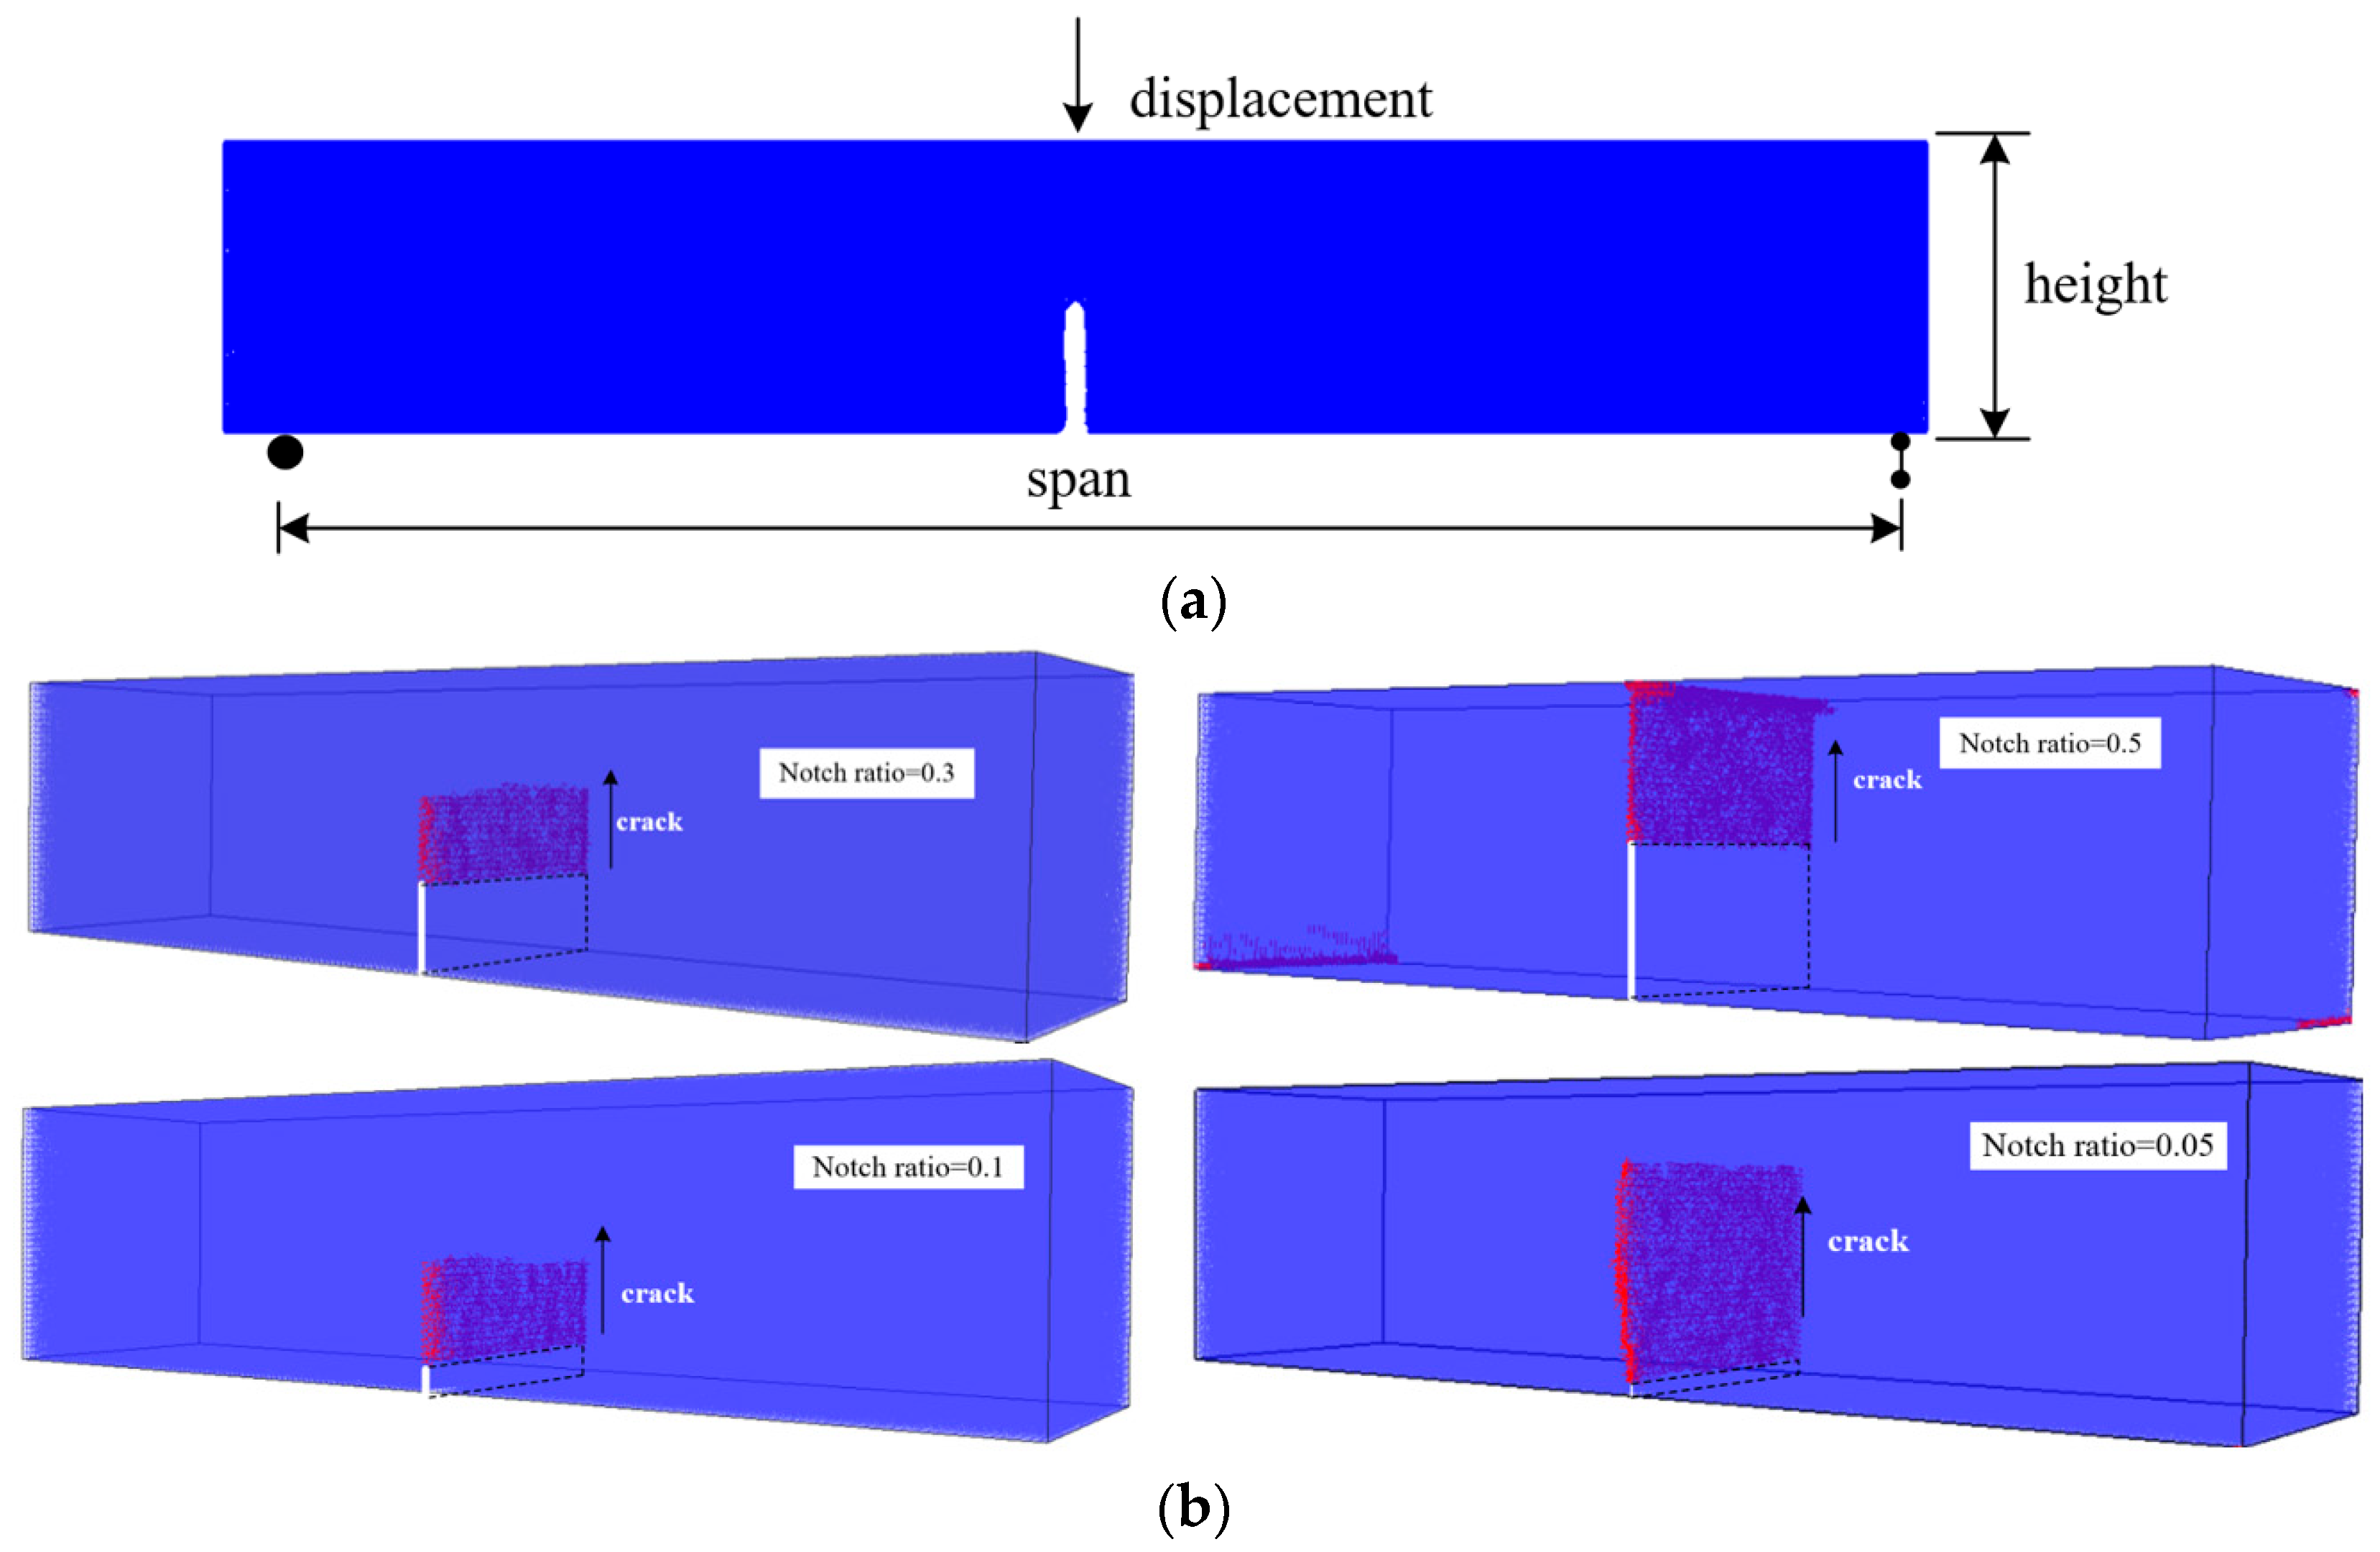
4.3.2. The Influence of Notch Ratio
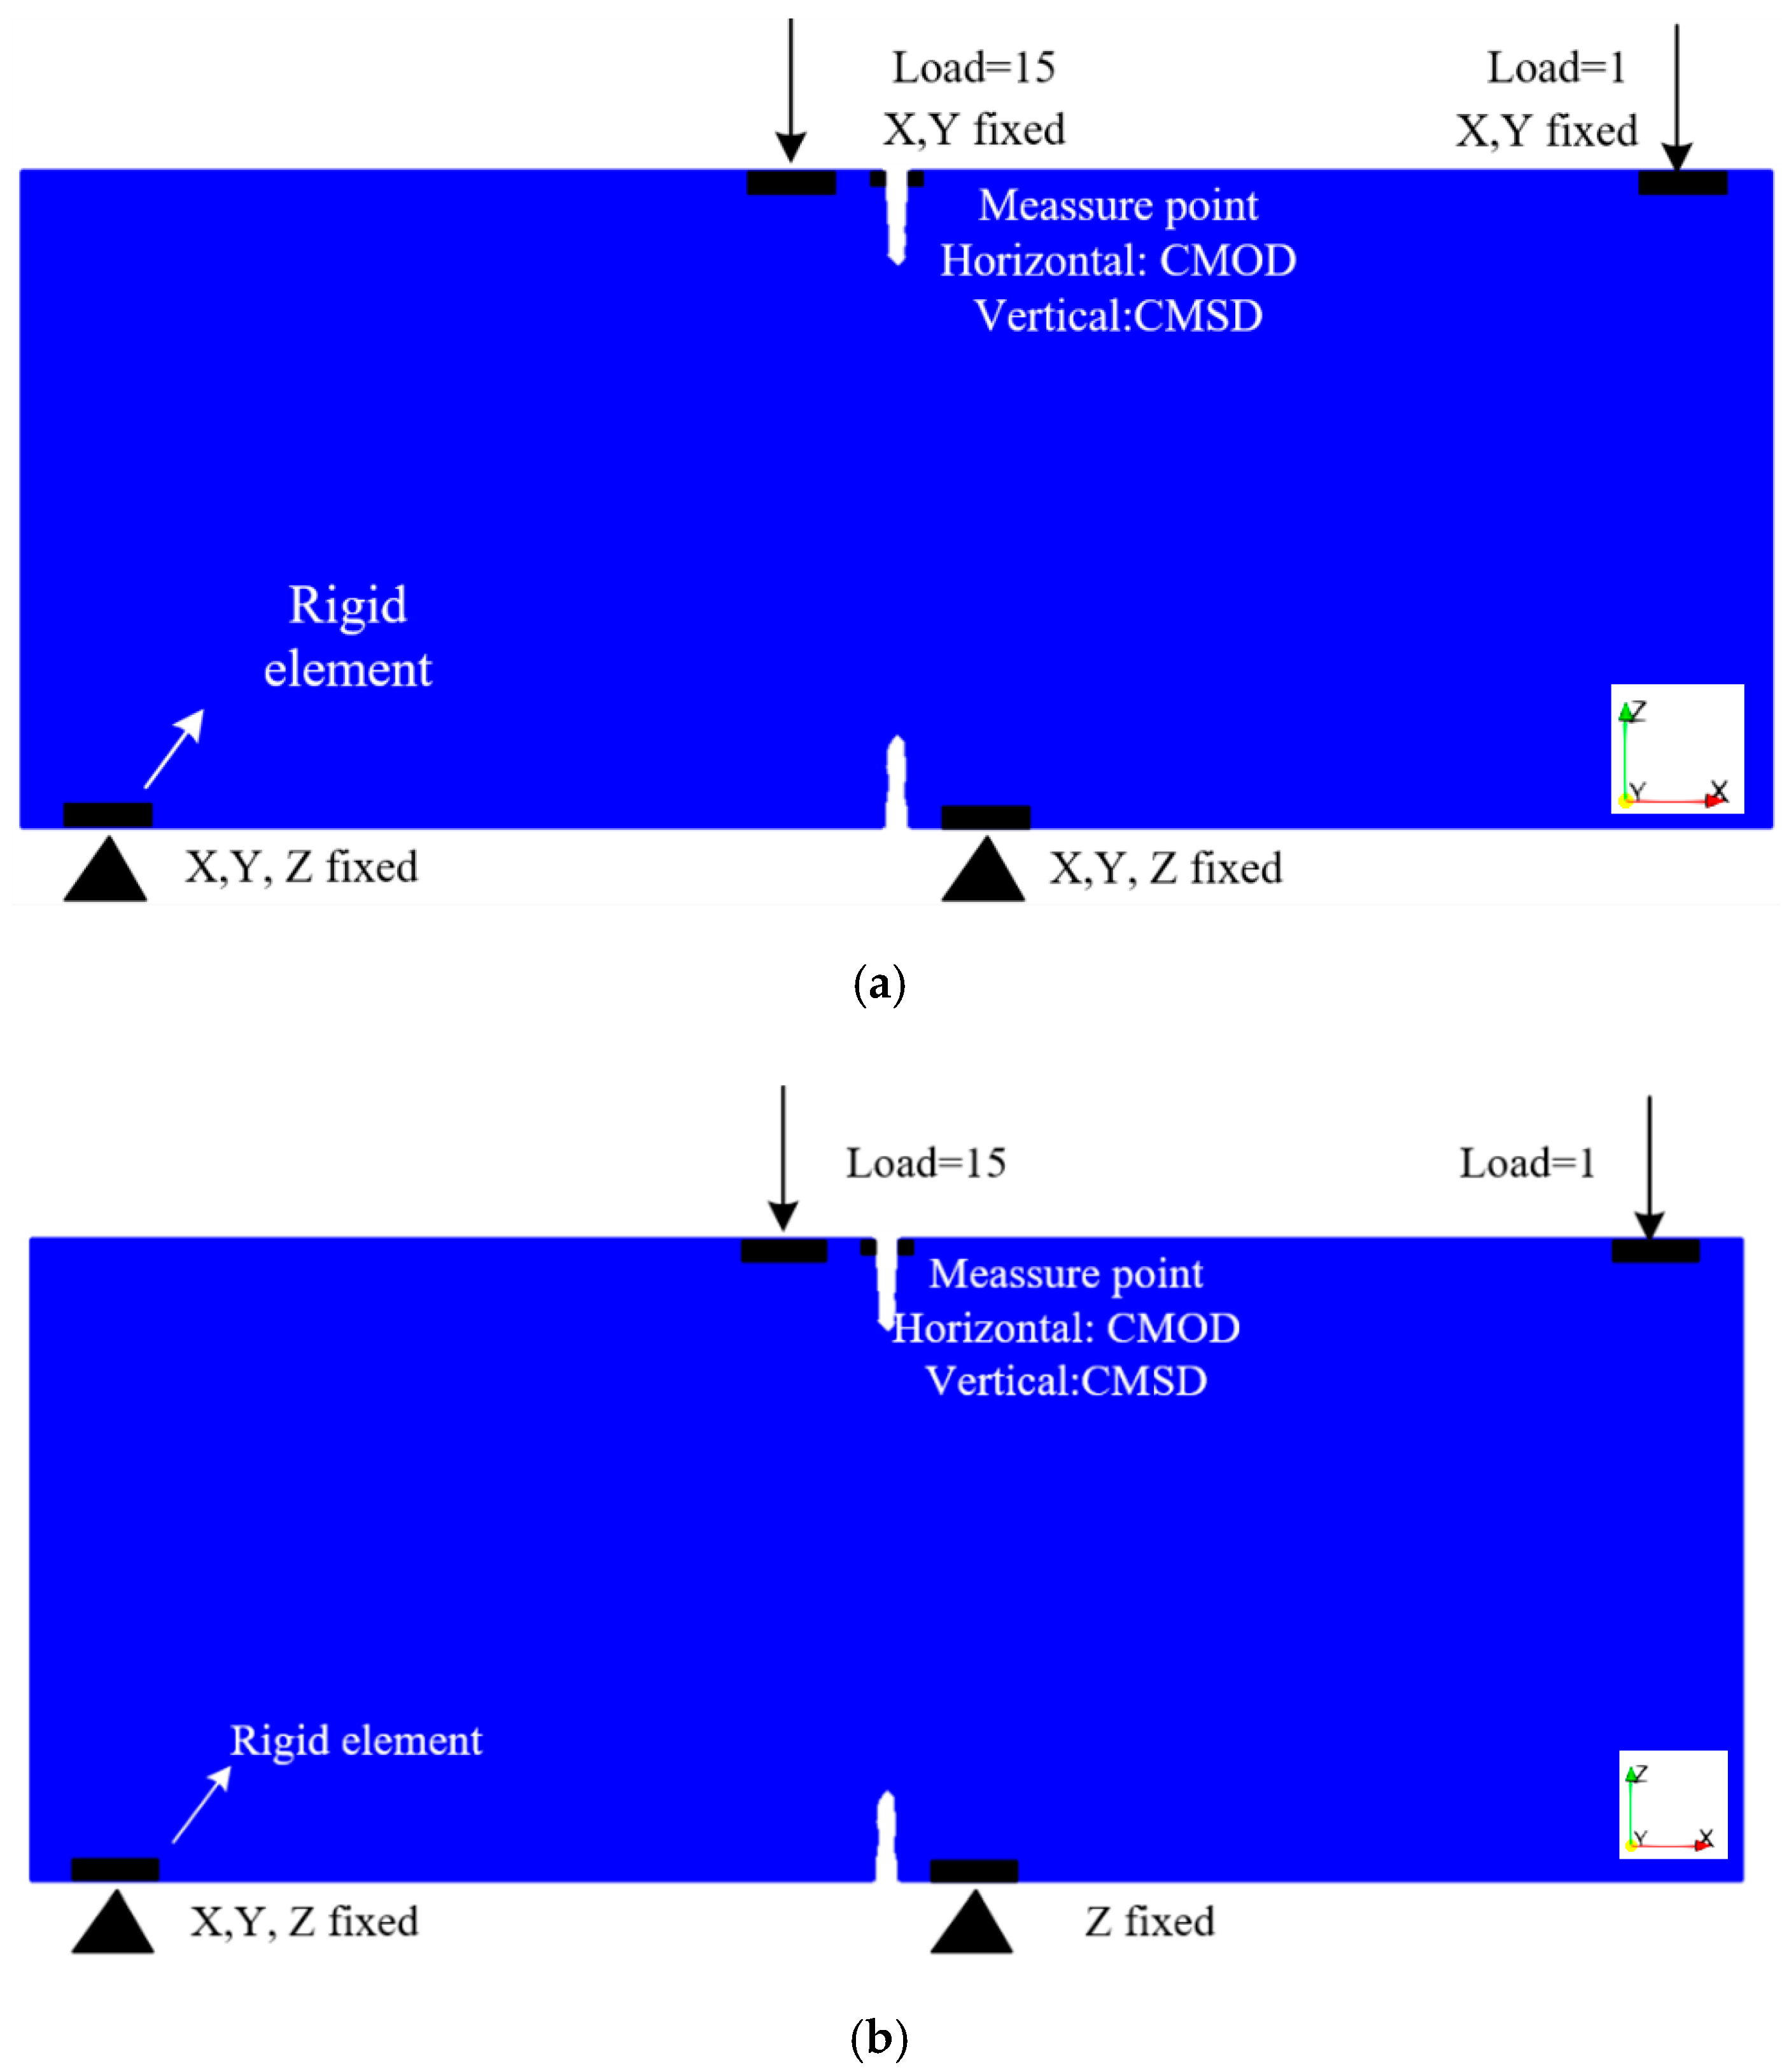
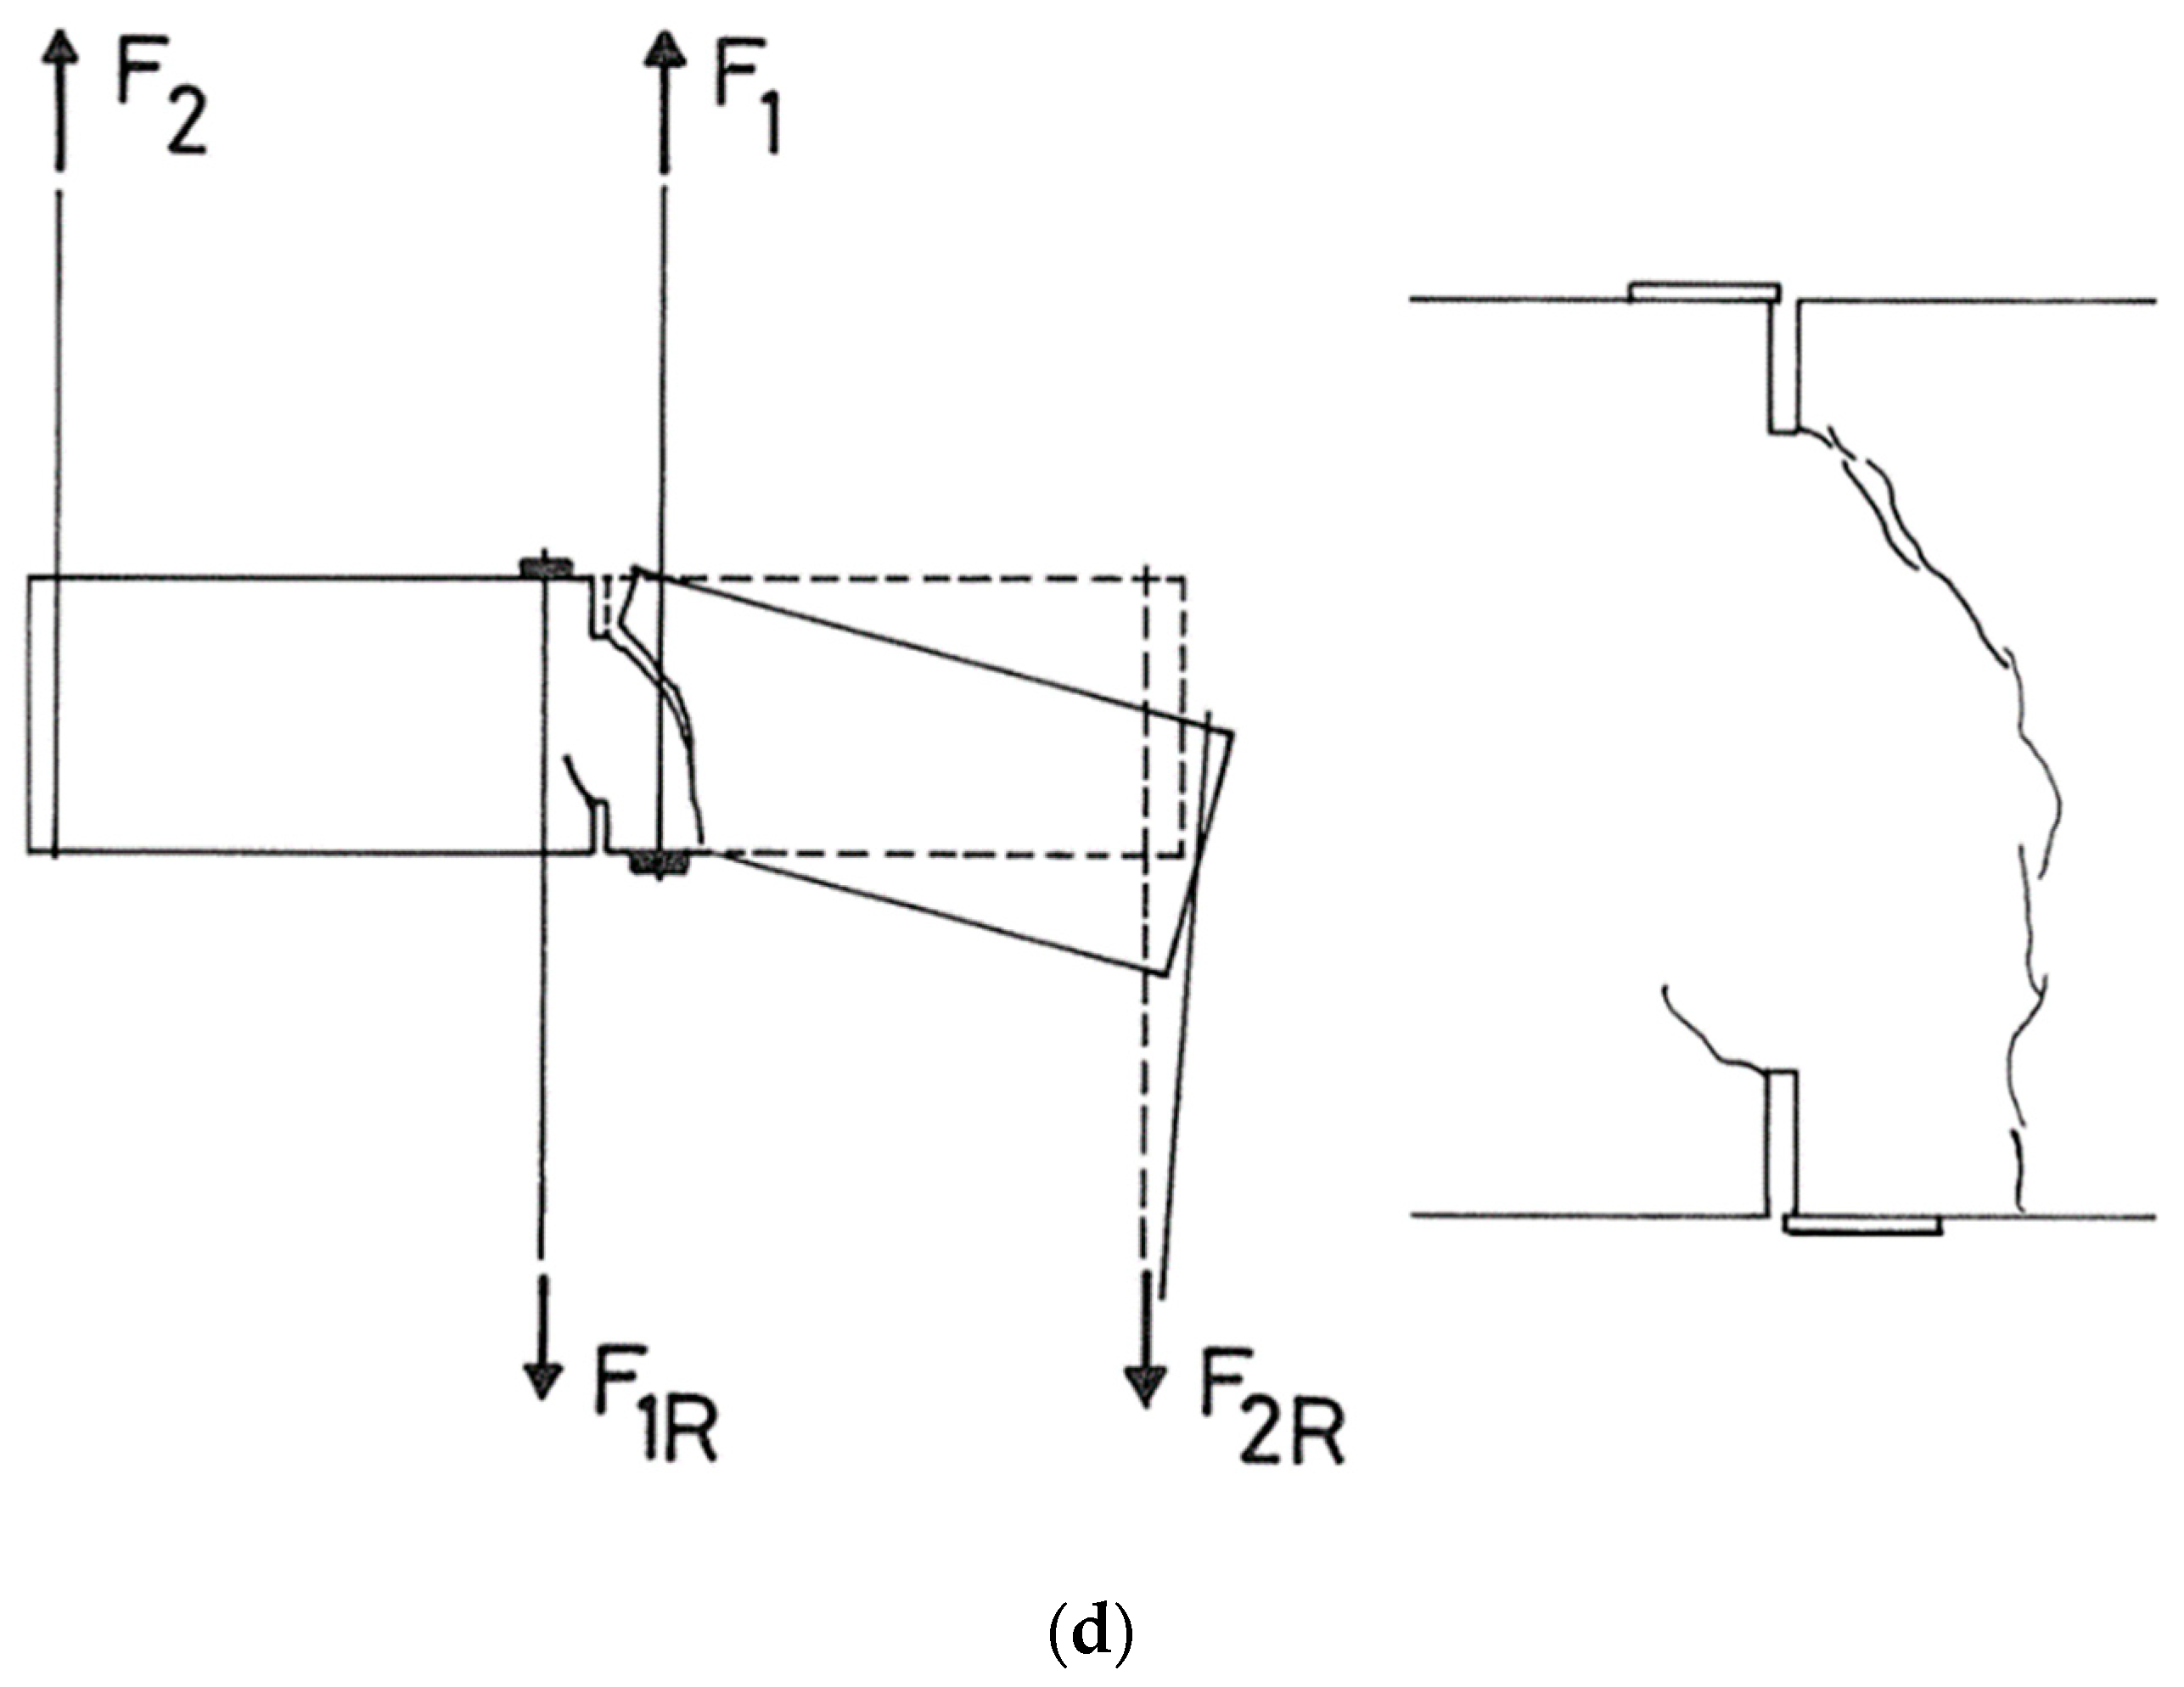
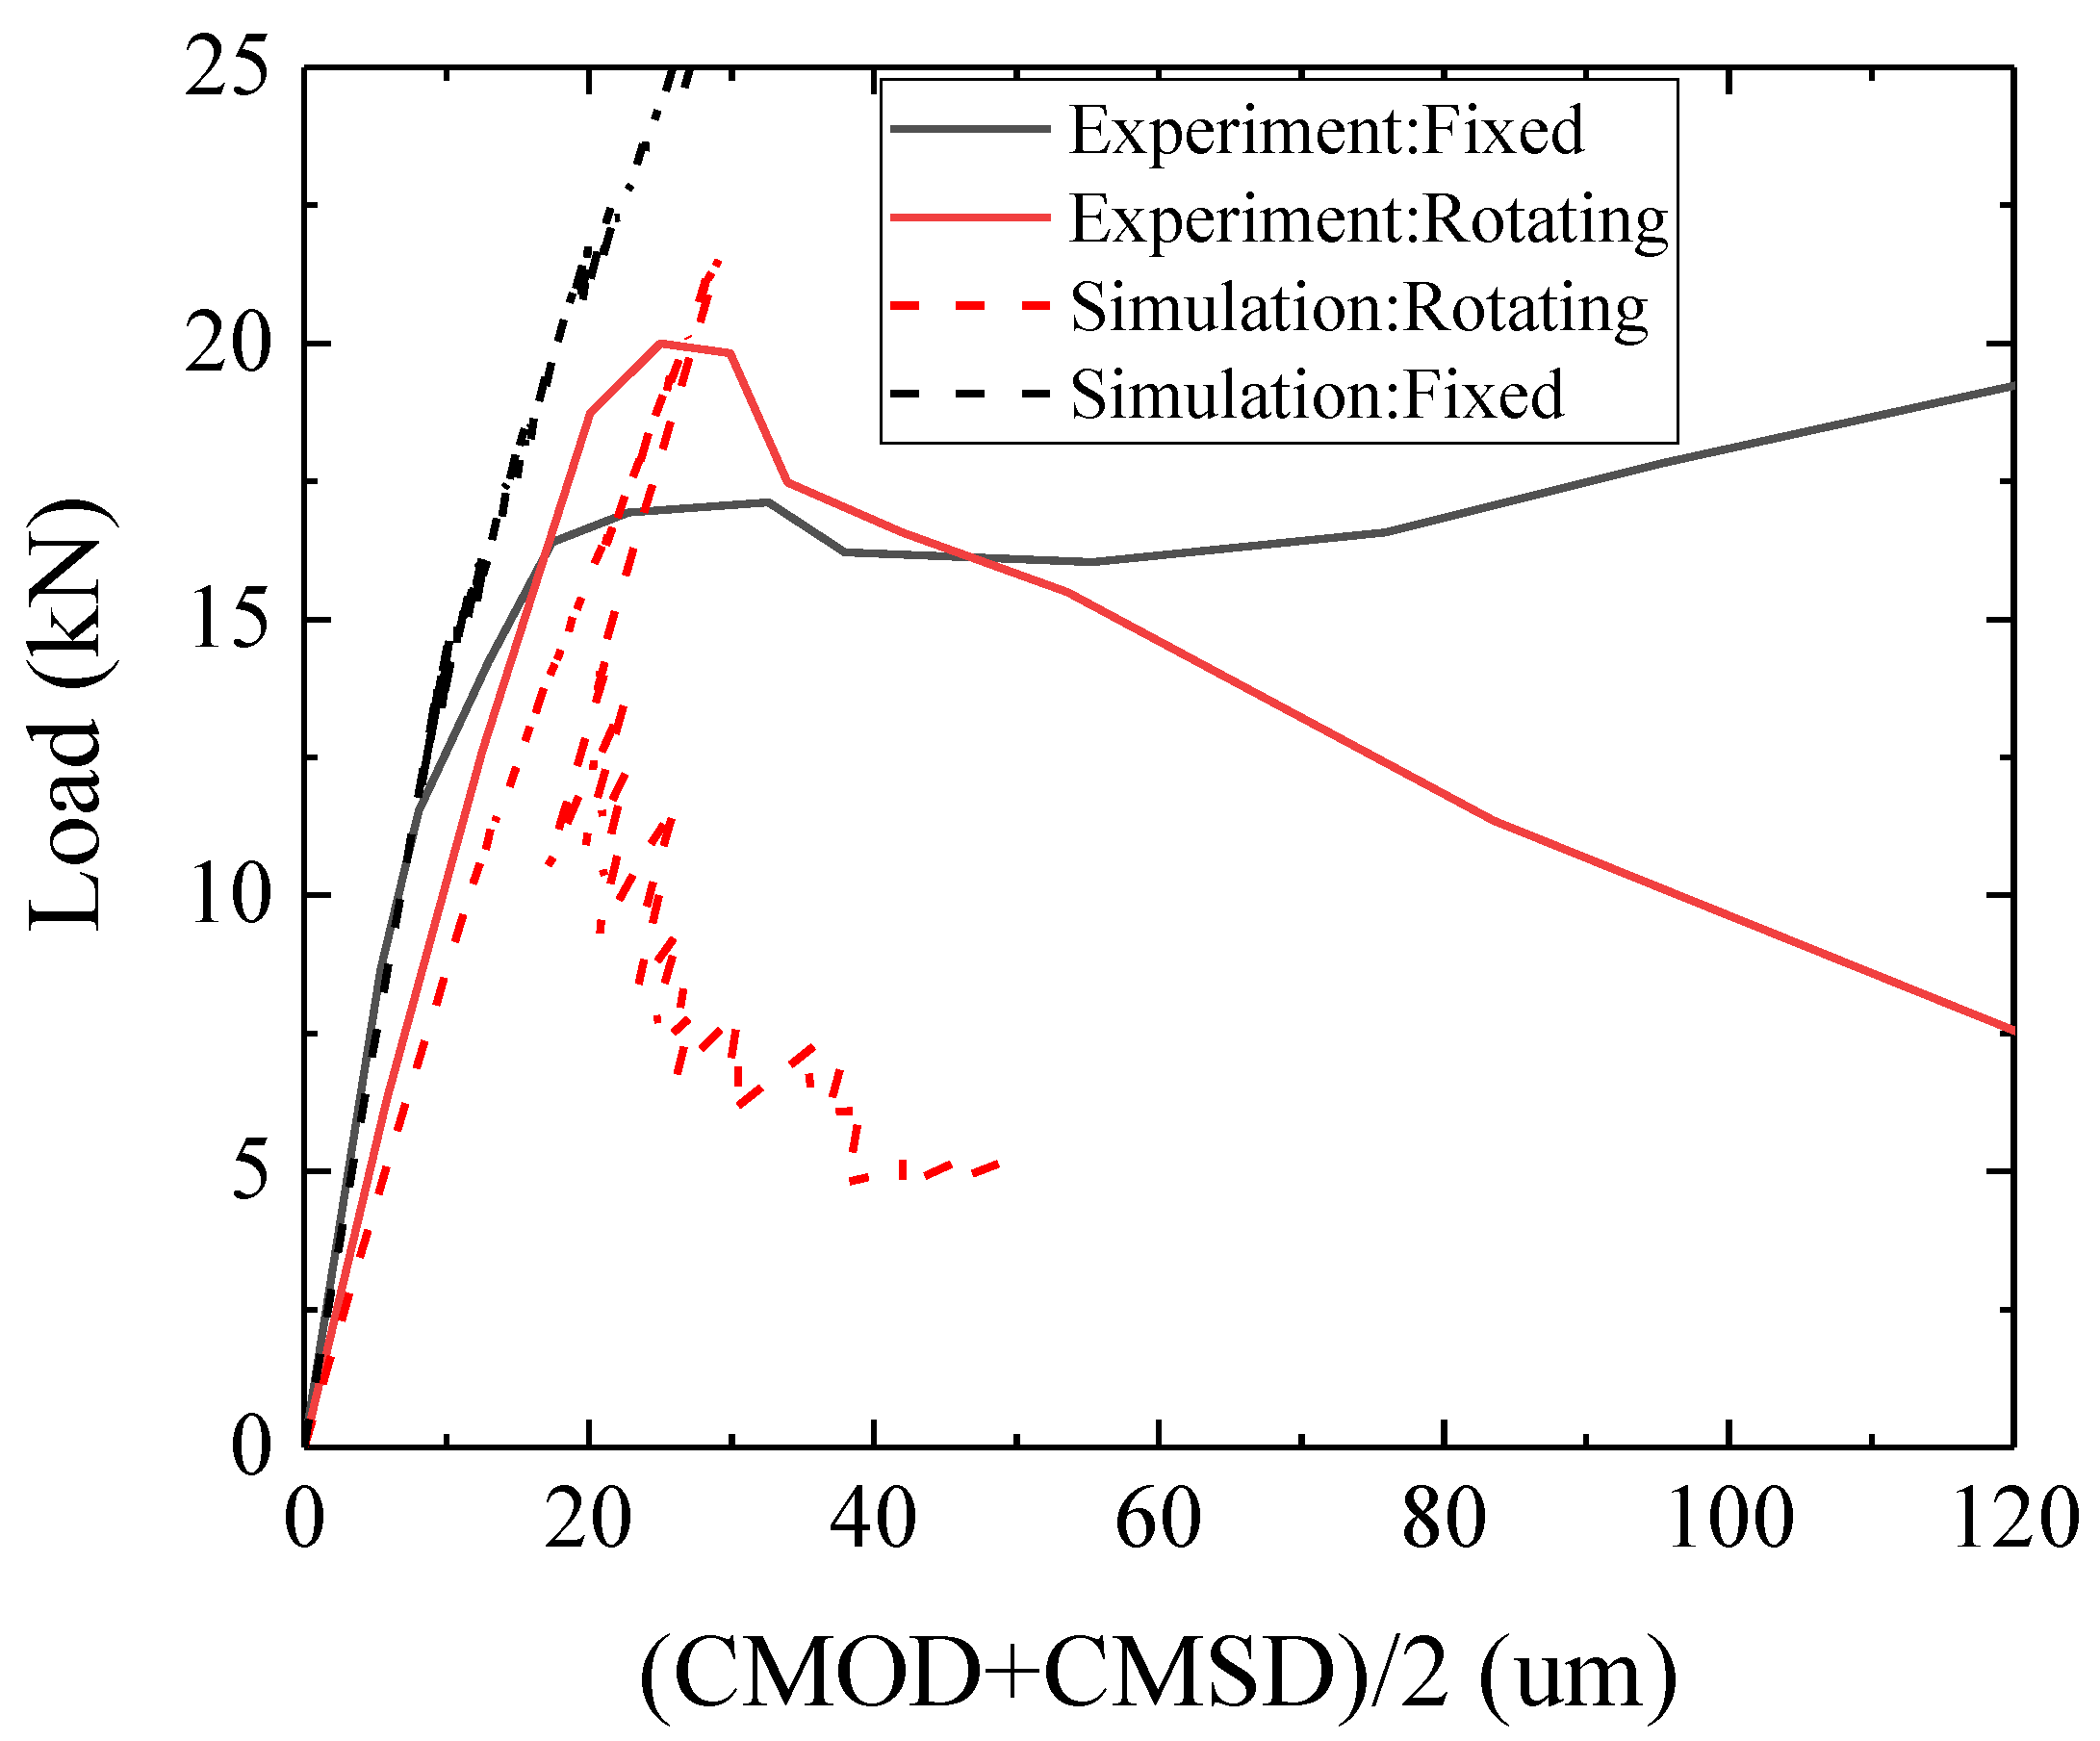
4.4. Double-Edge-Notched Beam Shear Test
5. Discussion
6. Conclusions
- The calibration method with a combination of two uniaxial tensile tests is utilized to get the value of the bending influence factor ( = 0.05), which can be used to simulate the fracture process of cementitious materials under different boundary conditions.
- The LBM can simulate the fracture process of concrete under uniaxial compression and tension. The model captures the effect of high friction boundary and low friction boundary conditions on compressive strength well. Also, the LBM can reproduce the differences in crack patterns and the load-displacement curve for different boundary conditions and slenderness.
- The LBM can reproduce the fracture process accurately and analyze the size effect on the load-displacement curve for concrete subjected to a three-point bending test. Furthermore, the LBM is also able to capture the influence of the notch size and the size effect on the load-displacement response.
- The LBM can simulate the fracture process in the Brazilian splitting test. Furthermore, it predicts the size effect on the splitting test and produces the same crack patterns observed in the experiments.
- The LBM can simulate the fracture process during a DEN beam shear experiment. It does not only predict the crack nucleation and propagation accurately but also shows the influence of different boundary conditions.
Author Contributions
Funding
Acknowledgments
Conflicts of Interest
References
- Bao, J.; Wang, L. Combined effect of water and sustained compressive loading on chloride penetration into concrete. Constr. Build. Mater. 2017, 156, 708–718. [Google Scholar] [CrossRef]
- Nitka, M.; Tejchman, J. Modelling of concrete behaviour in uniaxial compression and tension with DEM. Granul. Matter 2015, 17, 145–164. [Google Scholar] [CrossRef]
- Van Mier, J.G.M. Concrete Fracture: A Multiscale Approach; CRC Press: Boca Raton, FL, USA, 2012. [Google Scholar]
- Van Mier, J.G.M. Fracture Processes of Concrete; CRC Press: Boca Raton, FL, USA, 2017. [Google Scholar]
- Lilliu, G. 3D Analysis of Fracture Processes in Concrete; Eburon Uitgeverij BV: Utrecht, The Netherlands, 2007. [Google Scholar]
- De Borst, R. Some recent developments in computational modelling of concrete fracture. Int. J. Fract. 1997, 86, 5–36. [Google Scholar] [CrossRef]
- D’Addetta, G.A.; Kun, F.; Ramm, E. On the application of a discrete model to the fracture process of cohesive granular materials. Granul. Matter 2002, 4, 77–90. [Google Scholar] [CrossRef]
- Kwan, A.; Wang, Z.; Chan, H. Mesoscopic study of concrete II: Nonlinear finite element analysis. Comput. Struct. 1999, 70, 545–556. [Google Scholar] [CrossRef]
- Sagar, R.V.; Prasad, B.R.; Nazreen, S.; Singh, R. Modeling mode-I fracture process in concrete at meso-scale: Computational aspects of lattice model and a comparison between results of two dimensional lattice simulation and acoustic emission measurements. Eng. Fract. Mech. 2019, 210, 257–278. [Google Scholar] [CrossRef]
- Chen, H.; Jiao, Y.; Liu, Y. A nonlocal lattice particle model for fracture simulation of anisotropic materials. Compos. Part B Eng. 2016, 90, 141–151. [Google Scholar] [CrossRef]
- Hrennikoff, A. Solution of problems of elasticity by the framework method. Appl. Mech. 1941, 12, 169–175. [Google Scholar]
- Šavija, B.; Pacheco, J.; Polder, R. Lattice model as a tool for modelling transport phenomena in cement based composites. In Proceedings of the Numerical Modeling Strategies for Sustainable Concrete Structures, Aix en Provence, France, 29 May–1 June 2012; pp. 1–8. [Google Scholar]
- Bolander, J.E.; Sukumar, N. Irregular lattice model for quasistatic crack propagation. Phys. Rev. B 2005, 71, 094106. [Google Scholar] [CrossRef]
- Cusatis, G.; Mencarelli, A.; Pelessone, D.; Baylot, J. Lattice Discrete Particle Model (LDPM) for failure behavior of concrete. II: Calibration and validation. Cem. Concr. Compos. 2011, 33, 891–905. [Google Scholar] [CrossRef]
- Cusatis, G.; Pelessone, D.; Mencarelli, A. Lattice Discrete Particle Model (LDPM) for failure behavior of concrete. I: Theory. Cem. Concr. Compos. 2011, 33, 881–890. [Google Scholar] [CrossRef]
- Luković, M.; Šavija, B.; Schlangen, E.; Ye, G.; van Breugel, K. A 3D Lattice Modelling Study of Drying Shrinkage Damage in Concrete Repair Systems. Materials 2016, 9, 575. [Google Scholar] [CrossRef] [PubMed]
- Schlangen, E.; Garboczi, E. New method for simulating fracture using an elastically uniform random geometry lattice. Int. J. Eng. Sci. 1996, 34, 1131–1144. [Google Scholar] [CrossRef]
- Schlangen, E.; van Mier, J.G.M. Simple lattice model for numerical simulation of fracture of concrete materials and structures. Mater. Struct. 1992, 25, 534–542. [Google Scholar] [CrossRef]
- Vassaux, M.; Ragueneau, F.; Richard, B.; Millard, A. Compressive behavior of a lattice discrete element model for quasi-brittle materials. Comput. Modell. Concr. Struct. 2014, 1, 335–344. [Google Scholar] [CrossRef]
- Zhang, H.; Šavija, B.; Schlangen, E. Towards understanding stochastic fracture performance of cement paste at micro length scale based on numerical simulation. Constr. Build. Mater. 2018, 183, 189–201. [Google Scholar] [CrossRef]
- Schlangen, E.; Garboczi, E. Fracture simulations of concrete using lattice models: Computational aspects. Eng. Fract. Mech. 1997, 57, 319–332. [Google Scholar] [CrossRef]
- Fascetti, A.; Bolander, J.E.; Nistico’, N. Lattice Discrete Particle Modeling of Concrete under Compressive Loading: Multiscale Experimental Approach for Parameter Determination. J. Eng. Mech. 2018, 144, 04018058. [Google Scholar] [CrossRef]
- Herrmann, H.J.; Hansen, A.; Roux, S. Fracture of disordered, elastic lattices in two dimensions. Phys. Rev. B 1989, 39, 637–648. [Google Scholar] [CrossRef]
- Ince, R.; Arslan, A.; Karihaloo, B. Lattice modelling of size effect in concrete strength. Eng. Fract. Mech. 2003, 70, 2307–2320. [Google Scholar] [CrossRef]
- Luković, M.; Yang, Y.; Schlangen, E.; Hordijk, D. On the Potential of Lattice Type Model for Predicting Shear Capacity of Reinforced Concrete and SHCC Structures. In High Tech Concrete: Where Technology and Engineering Meet; Springer Science and Business Media LLC: Berlin/Heidelberg, Germany, 2017; pp. 804–813. [Google Scholar]
- Šavija, B.; Luković, M.; Schlangen, E. Modeling the rapid chloride migration test for concrete using the lattice model and characteristic Galerkin approach. In Computational Modelling of Concrete Structures; Informa UK Limited: Colchester, UK, 2014; pp. 629–638. [Google Scholar]
- De Barros-Leite, J.; Slowik, V. Simulation of concrete fracture by using mesolevel truss and particle models. In Proceedings of the Fifth International Conference on Fracture Mechanics of Concrete and Concrete Structures, Vail, CO, USA, 12–16 April 2004; pp. 12–16. [Google Scholar]
- Kawai, T. New discrete models and their application to seismic response analysis of structures. Nucl. Eng. Des. 1978, 48, 207–229. [Google Scholar] [CrossRef]
- Bolander, J.; Saito, S. Fracture analyses using spring networks with random geometry. Eng. Fract. Mech. 1998, 61, 569–591. [Google Scholar] [CrossRef]
- Bolander, J.E.; Hong, G.S. Rigid-body-spring network modeling of prestressed concrete members. Struct. J. 2002, 99, 595–604. [Google Scholar]
- Yip, M.; Mohle, J.; Bolander, J.E. Automated Modeling of Three-Dimensional Structural Components Using Irregular Lattices. Comput. Civ. Infrastruct. Eng. 2005, 20, 393–407. [Google Scholar] [CrossRef]
- Schlangen, E. Experimental and Numerical Analysis of Fracture Processes in Concrete; Delft University of Technology: Delft, The Netherlands, 1993. [Google Scholar]
- Abreu, M.; Lemos, J.; Carmeliet, J.; Schlangen, E.J.F. Modelling Compressive Cracking in Concrete Using a Modified Lattice Model; Taylor & Francis Group: London, UK, 2007. [Google Scholar]
- Liu, J.; Zhao, Z.; Deng, S.; Liang, N. Modified generalized beam lattice model associated with fracture of reinforced fiber/particle composites. Theor. Appl. Fract. Mech. 2008, 50, 132–141. [Google Scholar] [CrossRef]
- Pan, Z.-C.; Ma, R.; Wang, D.; Chen, A.-R. A review of lattice type model in fracture mechanics: Theory, applications, and perspectives. Eng. Fract. Mech. 2018, 190, 382–409. [Google Scholar] [CrossRef]
- Nikolic, M.; Karavelić, E.; Ibrahimbegovic, A.; Miščević, P. Lattice Element Models and Their Peculiarities. Arch. Comput. Methods Eng. 2017, 25, 753–784. [Google Scholar] [CrossRef]
- Lilliu, G.; van Mier, J. 3D lattice type fracture model for concrete. Eng. Fract. Mech. 2003, 70, 927–941. [Google Scholar] [CrossRef]
- Qian, Z.; Schlangen, E.; Ye, G.; van Breugel, K. Modeling Framework for Fracture in Multiscale Cement-Based Material Structures. Materials 2017, 10, 587. [Google Scholar] [CrossRef]
- Zhang, H.; Šavija, B.; Figueiredo, S.C.; Luković, M.; Schlangen, E. Microscale Testing and Modelling of Cement Paste as Basis for Multi-Scale Modelling. Materials 2016, 9, 907. [Google Scholar] [CrossRef]
- Zhang, H.; Šavija, B.; Figueiredo, S.C.; Schlangen, E. Experimentally validated multi-scale modelling scheme of deformation and fracture of cement paste. Cem. Concr. Res. 2017, 102, 175–186. [Google Scholar] [CrossRef]
- Qian, Z. Multiscale Modeling of Fracture Processes in Cementitious Materials; Delft University of Technology: Delft, The Netherlands, 2012. [Google Scholar]
- Abdellatef, M.; Boumakis, I.; Wan-Wendner, R.; Alnaggar, M. Lattice Discrete Particle Modeling of concrete coupled creep and shrinkage behavior: A comprehensive calibration and validation study. Constr. Build. Mater. 2019, 211, 629–645. [Google Scholar] [CrossRef]
- Alnaggar, M.; Bhanot, N. A machine learning approach for the identification of the Lattice Discrete Particle Model parameters. Eng. Fract. Mech. 2018, 197, 160–175. [Google Scholar] [CrossRef]
- Zhang, H.; Šavija, B.; Schlangen, E. Combined experimental and numerical study on micro-cube indentation splitting test of cement paste. Eng. Fract. Mech. 2018, 199, 773–786. [Google Scholar] [CrossRef]
- Van Vliet, M.R.; van Mier, J.G. Experimental investigation of size effect in concrete and sandstone under uniaxial tension. Eng. Fract. Mech. 2000, 65, 165–188. [Google Scholar] [CrossRef]
- Van Mier, J.; van Vliet, M. Influence of microstructure of concrete on size/scale effects in tensile fracture. Eng. Fract. Mech. 2003, 70, 2281–2306. [Google Scholar] [CrossRef]
- Shafieifar, M.; Farzad, M.; Azizinamini, A. Experimental and numerical study on mechanical properties of Ultra High Performance Concrete (UHPC). Constr. Build. Mater. 2017, 156, 402–411. [Google Scholar] [CrossRef]
- Bazant, Z.P.; Kazemi, M.T.; Hasegawa, T.; Mazars, J. Size effect in Brazilian split-cylinder tests: Measurements and fracture analysis. ACI Mat. J. 1991, 88, 325–332. [Google Scholar]
- Xu, S.; Zhu, Y. Experimental determination of fracture parameters for crack propagation in hardening cement paste and mortar. Int. J. Fract. 2009, 157, 33–43. [Google Scholar] [CrossRef]
- Van Mier, J.G.M.; Shah, S.P.; Arnaud, M.; Balayssac, J.P.; Bascoul, A.; Choi, S.; Dasenbrock, D.; Ferrara, G.; French, C.; Gobbi, M.E.; et al. Strain-softening of concrete in uniaxial compression. Mater. Struct. 1997, 30, 195–209. [Google Scholar] [CrossRef]
- Van Vliet, M.A.; van Mier, J.M. Experimental Investigation of Concrete Fracture under Uniaxial Compression; Wiley: Hoboken, NJ, USA, 1996; pp. 115–127. [Google Scholar]
- Nallathambi, P.; Karihaloo, B.; Heaton, B. Various size effects in fracture of concrete. Cem. Concr. Res. 1985, 15, 117–126. [Google Scholar] [CrossRef]
- Zhang, H.; Xu, Y.; Gan, Y.; Chang, Z.; Schlangen, E.; Šavija, B. Combined experimental and numerical study of uniaxial compression failure of hardened cement paste at micrometre length scale. Cem. Concr. Res. 2019, 126, 105925. [Google Scholar] [CrossRef]
- Hillerborg, A.; Modéer, M.; Petersson, P.-E. Analysis of crack formation and crack growth in concrete by means of fracture mechanics and finite elements. Cem. Concr. Res. 1976, 6, 773–781. [Google Scholar] [CrossRef]
- Bažant, Z.P.; Oh, B.H. Crack band theory for fracture of concrete. Mater. Struct. 1983, 16, 155–177. [Google Scholar] [CrossRef]
- Roelfstra, P.; Wittmann, F. Numerical method to link strain softening with failure of concrete, Fracture toughness and fracture energy of concrete. In Fracture Toughness and Fracture Energy in Concrete; Elsevier Science: Amsterdam, The Netherlands, 1986; pp. 163–175. [Google Scholar]
- Zhang, H. Experimentally Validated Multi-Scale Fracture Modelling Scheme of Cementitious Materials; Delft University of Technology: Delft, The Netherlands, 2019. [Google Scholar]
- Zhang, H.; Gan, Y.; Xu, Y.; Zhang, S.; Schlangen, E.; Šavija, B. Experimentally informed fracture modelling of interfacial transition zone at micro-scale. Cem. Concr. Compos. 2019, 104, 103383. [Google Scholar] [CrossRef]
- Zhang, H.; Šavija, B.; Xu, Y.; Schlangen, E. Size effect on splitting strength of hardened cement paste: Experimental and numerical study. Cem. Concr. Compos. 2018, 94, 264–276. [Google Scholar] [CrossRef]


| Model | D (mm) | R (mm) | t (mm) | Cell Size (mm) |
|---|---|---|---|---|
| No.1 | 50 | 36.25 | 100 | 2.5 |
| No.2 | 100 | 72.5 | 100 | 2.5 |
| E (GPa) | fc (MPa) | ft (MPa) | Cell Size (mm) | Poisson’s Ratio | ||
|---|---|---|---|---|---|---|
| 45 | 45 | 4.5 | 2.5 | 0.05 | 1 | 0.2 |
| E (GPa) | fc (MPa) | ft (MPa) | Cell Size (mm) | Poisson’s Ratio | ||
|---|---|---|---|---|---|---|
| 15.7225 | 90 | 9 | 2.5 | 0.05 | 1 | 0.2 |
| Mode | Size (mm × mm × mm) | Slenderness | Boundary Condition |
|---|---|---|---|
| No.1 | 50 × 50 × 25 | 0.5 | high friction |
| No.2 | 50 × 50 × 50 | 1 | |
| No.3 | 50 × 50 × 100 | 2 | |
| No.4 | 50 × 50 × 25 | 0.5 | low friction |
| No.5 | 50 × 50 × 50 | 1 | |
| No.6 | 50 × 50 × 100 | 2 |
| E (GPa) | fc (MPa) | ft (MPa) | Cell Size (mm) | Poisson’s Ratio | ||
|---|---|---|---|---|---|---|
| 30 | 100 | 10 | 2.5 | 0.05 | 1 | 0.2 |
| E (GPa) | fc (MPa) | ft (MPa) | Cell Size (mm) | Poisson’s Ratio | ||
|---|---|---|---|---|---|---|
| 20 | 75 | 7.5 | 2.5 | 1 | 0.2 | 0.05 |
| Model | Size | Local Mechanical Property | Cell Size (mm) | Notch Ratio | ||||
|---|---|---|---|---|---|---|---|---|
| Span (mm) | Height (mm) | Depth (mm) | E | fc | ft | |||
| No.1 | 400 mm | 100 mm | 100 mm | E = 40 GPa fc = 65 MPa ft = 6.5 MPa | 2.5 | 0.05 | ||
| No.2 | 2.5 | 0.1 | ||||||
| No.3 | 2.5 | 0.3 | ||||||
| No.4 | 2.5 | 0.5 | ||||||
| E (GPa) | fc (MPa) | ft (MPa) | Cell Size (mm) | Poisson’s Ratio | ||
|---|---|---|---|---|---|---|
| 20 | 60 | 6 | 2.5 | 1 | 0.2 | 0.05 |
| Model | Size mm | Material | Constitutive Relation | Removal Mechanism | Local Mechanical Property | Others |
|---|---|---|---|---|---|---|
| No.1 | 75 × 75 × 75 | homogeneous | brittle | one step | Mortar: E = 30 GPa fc = 270 MPa Aggregate: E = 70 GPa fc = 700 MPa Interface: E = 3.5 GPa fc = 20 MPa | Cell size: 2.5 mm; Poisson’s ratio: 0.2; = 1; = 0.05; |
| No.2 | homogeneous | brittle | two steps | |||
| No.3 | homogeneous | nonlinear | one step | |||
| No.4 | heterogeneous | brittle | one step |
© 2020 by the authors. Licensee MDPI, Basel, Switzerland. This article is an open access article distributed under the terms and conditions of the Creative Commons Attribution (CC BY) license (http://creativecommons.org/licenses/by/4.0/).
Share and Cite
Chang, Z.; Zhang, H.; Schlangen, E.; Šavija, B. Lattice Fracture Model for Concrete Fracture Revisited: Calibration and Validation. Appl. Sci. 2020, 10, 4822. https://doi.org/10.3390/app10144822
Chang Z, Zhang H, Schlangen E, Šavija B. Lattice Fracture Model for Concrete Fracture Revisited: Calibration and Validation. Applied Sciences. 2020; 10(14):4822. https://doi.org/10.3390/app10144822
Chicago/Turabian StyleChang, Ze, Hongzhi Zhang, Erik Schlangen, and Branko Šavija. 2020. "Lattice Fracture Model for Concrete Fracture Revisited: Calibration and Validation" Applied Sciences 10, no. 14: 4822. https://doi.org/10.3390/app10144822
APA StyleChang, Z., Zhang, H., Schlangen, E., & Šavija, B. (2020). Lattice Fracture Model for Concrete Fracture Revisited: Calibration and Validation. Applied Sciences, 10(14), 4822. https://doi.org/10.3390/app10144822