1. Introduction
Reinforced concrete (RC) structures in coastal areas are susceptible to chloride ion attack. On the one hand, airborne chloride ions can diffuse into RC structures over time [
1]; on the other hand, the use of sea sand and sea water in RC structures has been observed in some coastal areas [
2]. If the chloride concentration in concrete exceeds certain threshold, reinforcements in concrete could experience severe corrosion and the seismic performance can be seriously impaired. For example, more than 7000 RC buildings collapsed after the
Mw 7.8 Pedernales, Ecuador earthquake [
3]. According to site inspections, the use of sea sand caused severe reinforcement corrosion, which resulted in poor seismic performance of local RC structures, as shown in
Figure 1. Therefore, it is important to take chloride-induced corrosion into account when assessing the seismic performance of coastal RC structures.
Regional seismic damage prediction is a useful tool for assessing the seismic resilience of regional buildings [
4,
5,
6]. In a pre-earthquake scenario, regional seismic damage prediction can help to identify vulnerable spots of regional buildings; while in a post-earthquake scenario, it can assist in assessing the severity of the disaster [
7], which provides references for emergency response and disaster relief.
To date, regional seismic damage prediction methods can be categorized into the following three types: (1) seismic fragility method, (2) capacity spectrum method, and (3) time history analysis (THA)-based method. The seismic fragility method is developed based on historical seismic damage data or building seismic fragility data obtained through a numerical simulation [
8,
9,
10,
11]. This method can be used to predict the seismic damage of buildings according to ground motion intensities (e.g., spectral acceleration and peak ground acceleration). The capacity spectrum method adopts pushover analysis to predict seismic responses of buildings [
5,
12], which considers the nonlinear capacity of buildings and the spectral properties of ground motions. Such a method is simpler and more efficient than the THA-based method [
13]. The THA-based method uses the multi-degree-of-freedom (MDOF) model or a refined finite element model, which can better simulate the dynamic responses of buildings and fully consider the time/spectral domain characteristics of ground motions. Powered by high-performance computing [
14,
15], the THA-based regional seismic damage simulation method has had wide applications in previous studies [
4,
6,
16,
17,
18,
19]. The THA-based regional seismic damage simulation method has also been adopted into the Natural Hazards Engineering Research Infrastructure SimCenter framework [
20].
Although the aforementioned three methods have been extensively applied, related research on regional seismic damage prediction of corroded RC buildings in coastal areas is very limited. Current studies on the seismic performance of corroded structures has mainly focused on component and structural levels. At the component level, a large number of experiential studies have been conducted to investigate the seismic performance of corroded RC components [
21,
22,
23,
24,
25]. At the structural level, numerical simulations of corroded RC buildings and bridges have been reported by numerous researchers [
26,
27,
28,
29,
30,
31,
32]. Nevertheless, at a regional level, related study on regional seismic damage prediction of corroded RC buildings is limited. Only a few cases can be found on the seismic damage prediction of civil infrastructures. For example, Shabarchin et al. [
33] conducted a seismic damage simulation of oil and gas pipelines and considered the influence of pipeline corrosion.
From the above discussion, this work mainly focuses on the regional seismic damage simulation of corroded RC buildings using THA. Specifically, in
Section 2, the framework of the proposed method is introduced; in
Section 3, the corrosion simulation method of coastal RC buildings is discussed; in
Section 4, the experimental data of 73 RC components are collected and statistical analyses of key mechanical parameters are conducted; in
Section 5, pushover analyses of typical RC frames under different corrosion conditions are performed and the reduction rules of building interstory backbone curve parameters are investigated; and in
Section 6, case studies of Shenzhen city are performed to demonstrate the effectiveness of the proposed method. The outcomes of this study are expected to provide a useful reference for seismic risk management of coastal cities.
2. Methodology
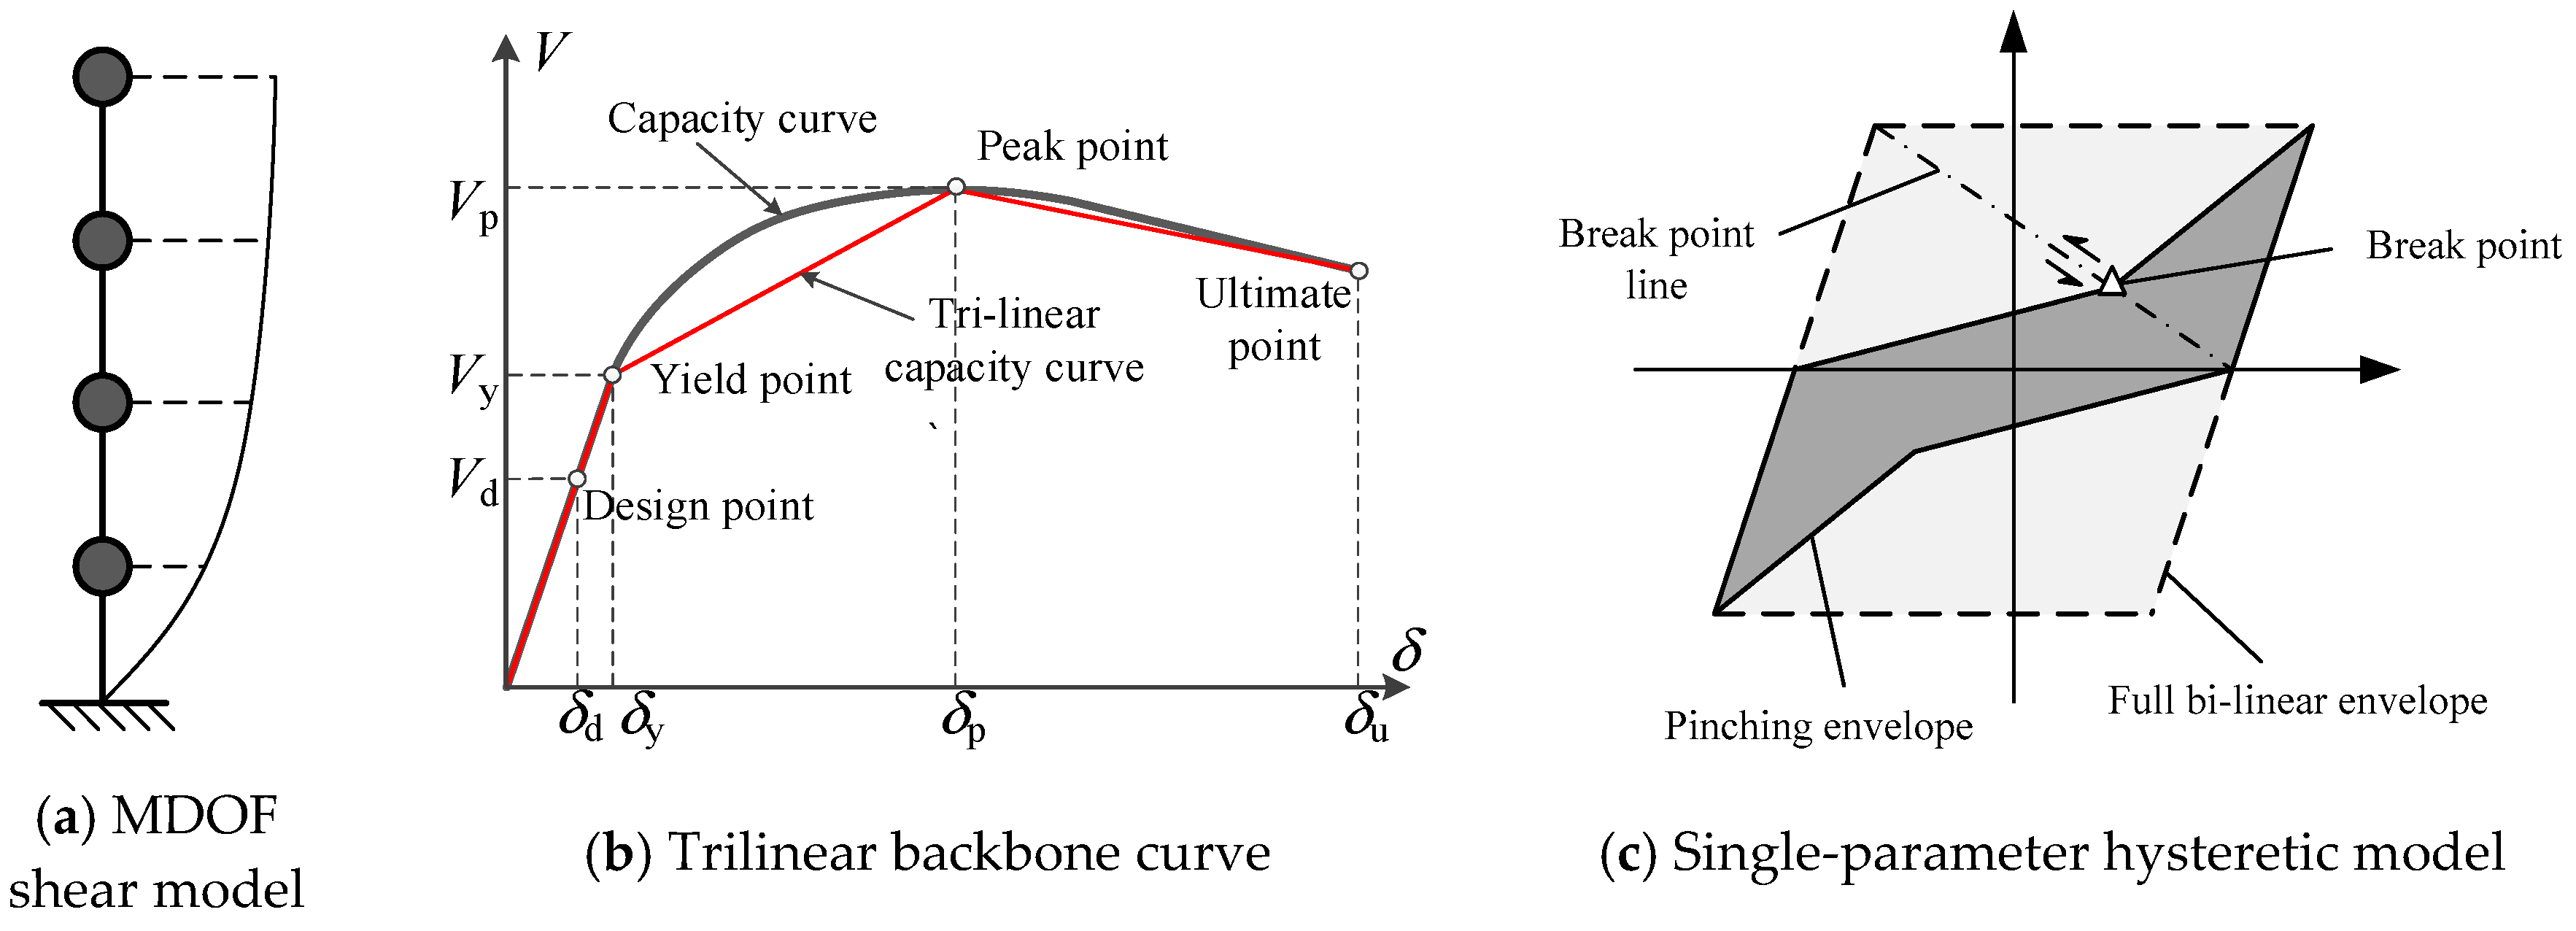
RC frame structures primarily exhibit shear deformation under lateral load, therefore, the MDOF shear model is adopted in this study. The MDOF shear model has been widely adopted to predict the responses of multistory buildings in regional seismic damage simulations [
4,
6,
18,
19]. In the MDOF shear model, the mass of each story concentrates on each mass point, and the mass points are linked to each other by shear springs [
34], as exhibited in
Figure 2a. Owing to a limited amount of detailed building information for regional simulation, a trilinear backbone curve model (
Figure 2b) [
5,
18] and a single-parameter hysteretic model (
Figure 2c) [
35] are adopted to simulate the nonlinear performance of shear springs. Note that the proposed method mainly focuses on corroded RC frame structures. The model adopted in
Figure 2 is not applicable to other structural systems, such as RC frame-shear wall structures. Other simplified models such as the MDOF flexural shear model can be used to simulate the seismic performance of high-rise buildings in regional simulations [
36].
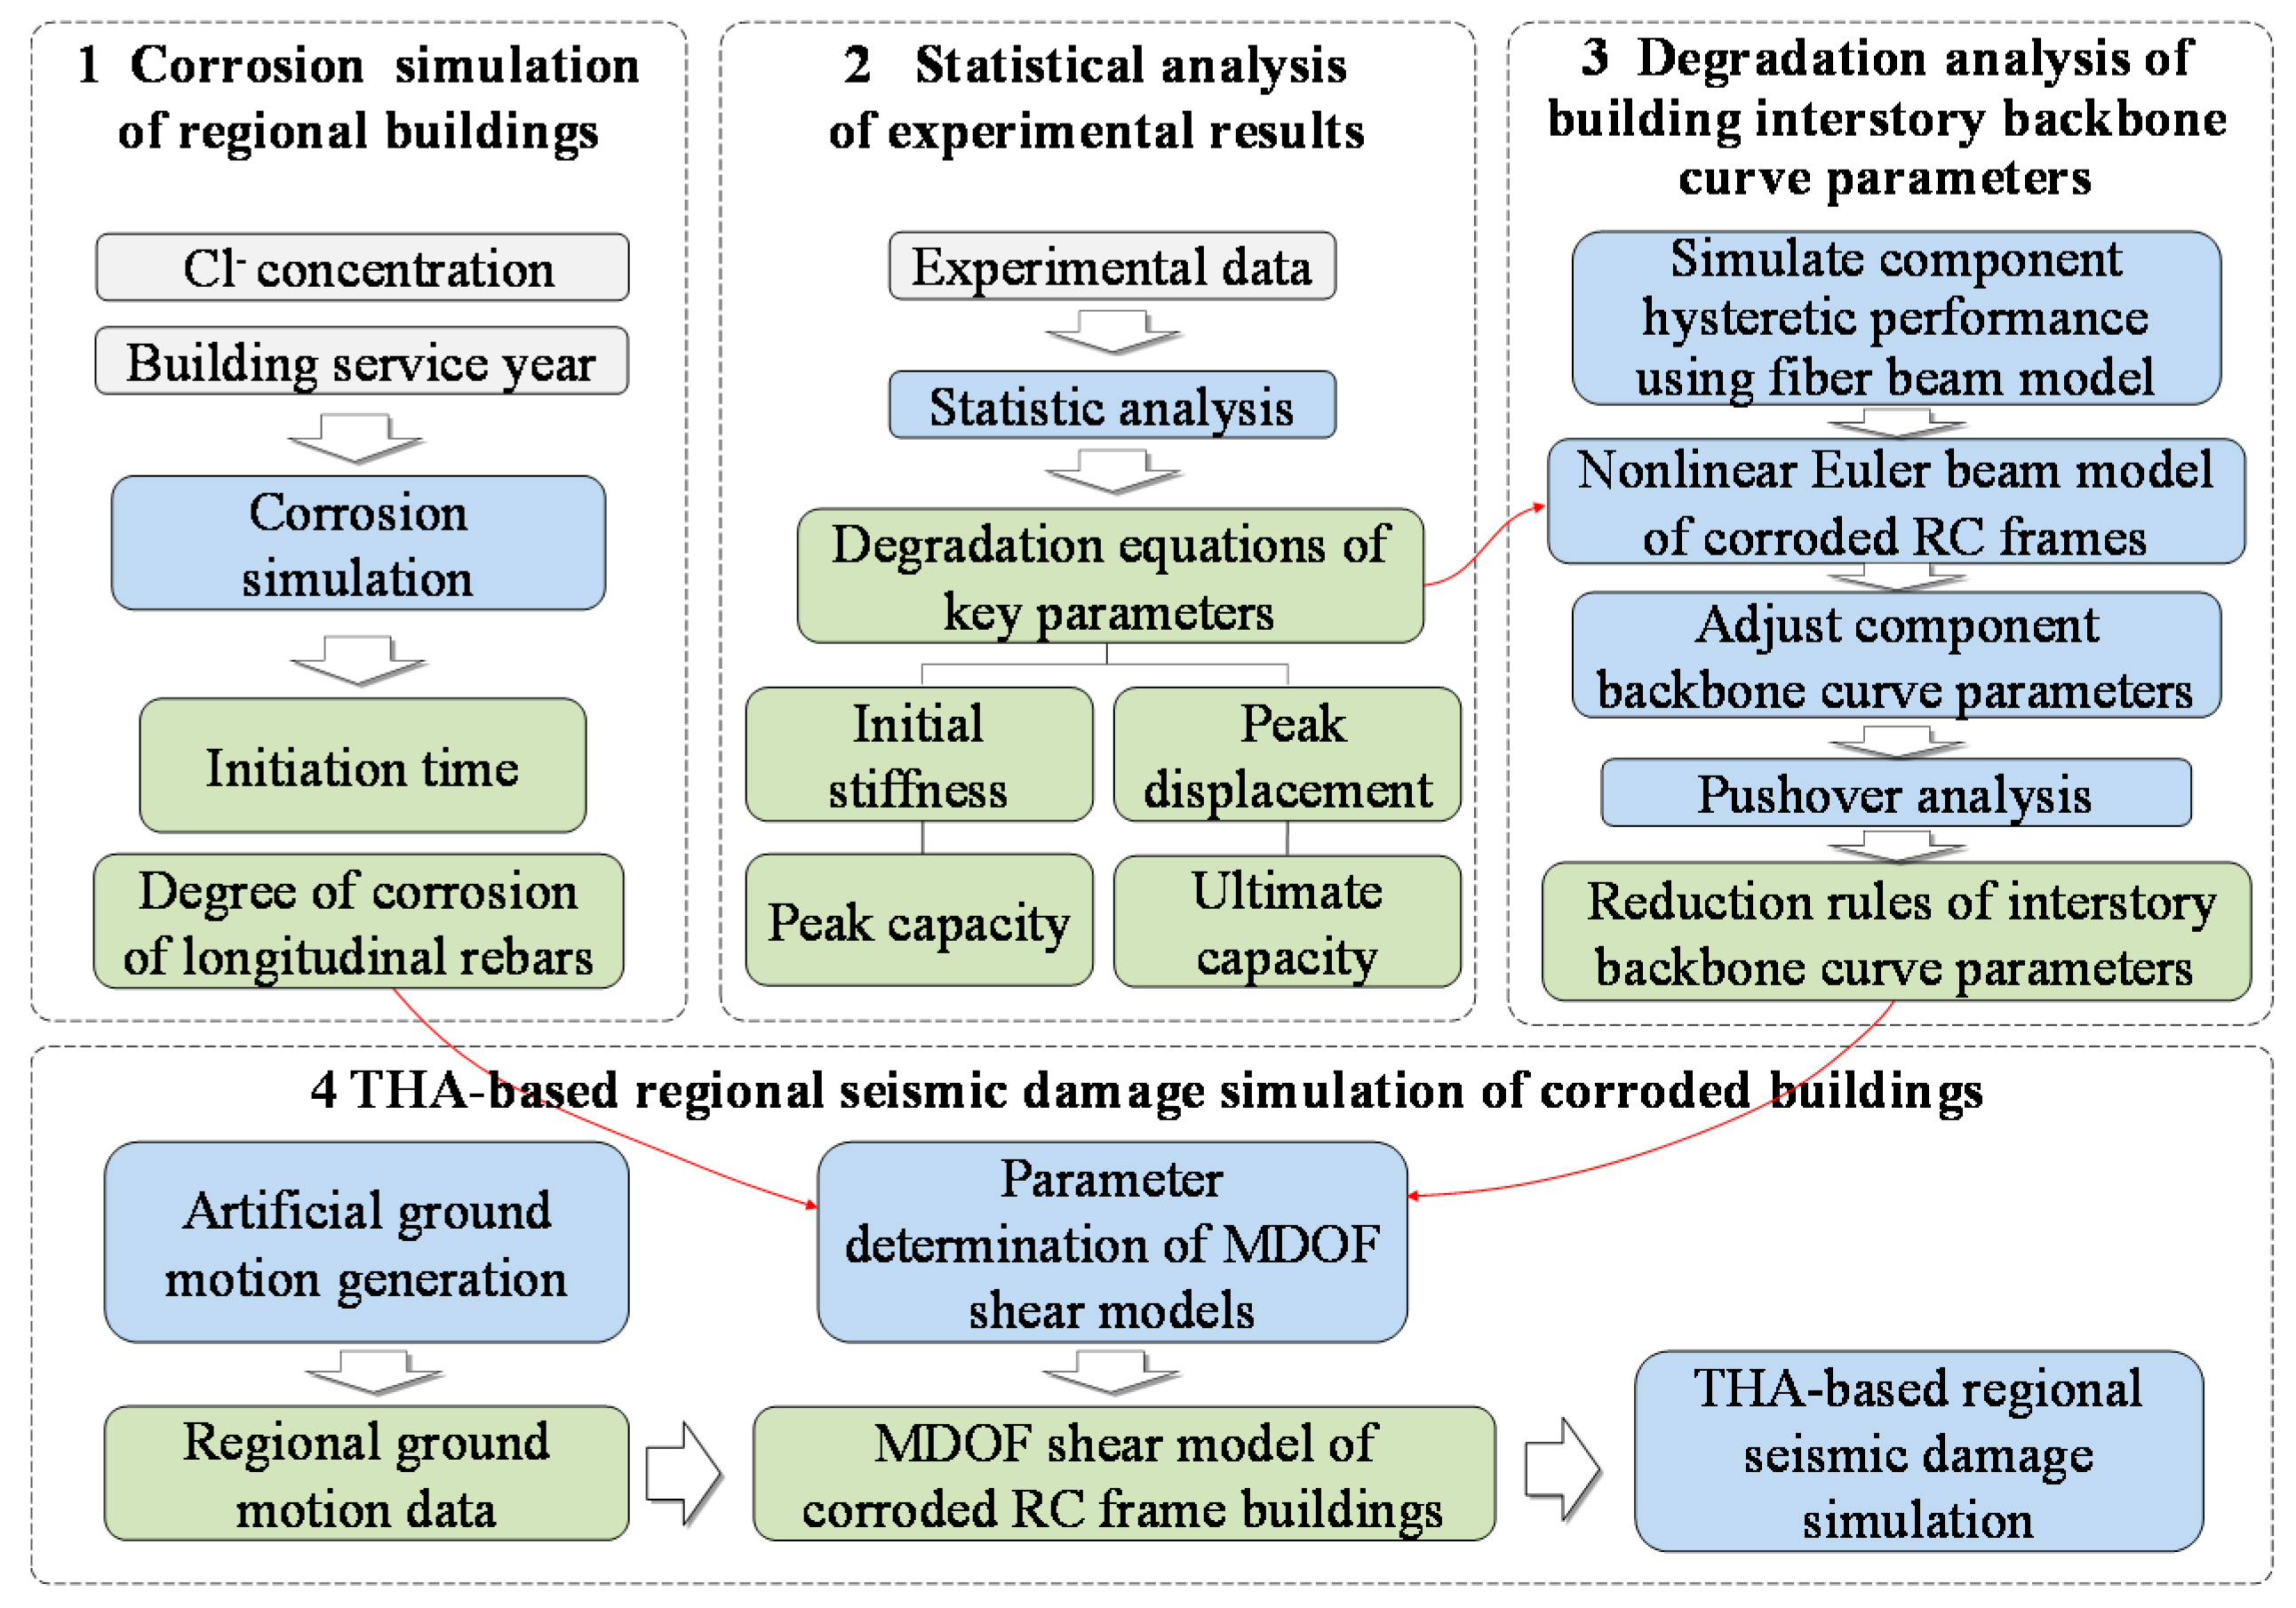
The framework of regional seismic damage simulation for corroded RC frame structures consists of four modules, as illustrated in
Figure 3, and described as follows:
(1) Corrosion Simulation of Regional Buildings.
In this module, a chloride-induced corrosion simulation method is adopted to obtain the degree of corrosion of regional buildings considering the concentration of chloride ion and service year of buildings. The simulated degree of corrosion of longitudinal reinforcement is used to estimate the reduction of key mechanical parameters in the following modules.
(2) Statistical Analysis of Experimental Results of Corroded RC Components.
The experimental data of corroded components are collected in this study. Subsequently, the backbone curve parameters (i.e., initial stiffness, peak carrying capacity, peak displacement, and ultimate carrying capacity) of RC components with different degrees of corrosion are analyzed statistically to obtain the reduction rule of each key parameter. The obtained reduction rules of component backbone curve parameters can be used to estimate the nonlinear performance of corroded RC components in the following modules.
(3) Degradation Analysis of Building Interstory Backbone Curve Parameters.
The MDOF shear model is used for the seismic damage simulation of corroded RC frame structures in a city-scale scenario. Therefore, the reduction rules for the interstory backbone curve parameters of corroded RC frame structures are required for the parameter determination of the MDOF shear model. In this module, the component reduction rules obtained in the former module are used for the pushover analyses of corroded RC frame structures. First, typical RC frame structures are designed, and the hysteretic results of beam and column components are simulated using a fiber beam model. Second, a nonlinear Euler beam model is constructed for the studied RC frames and the hysteretic parameters of components are calibrated according to the hysteretic results computed in the first step. Third, the curvature–bending moment backbone curve parameters of each component are adjusted according to the reduction rules obtained in the second module. Fourth, pushover analyses of corroded RC frame structures are performed, and the reduction rules of building interstory backbone curve parameters are obtained through statistical analyses.
(4) THA-Based Regional Seismic Damage Simulation of Corroded Buildings.
First, set up an earthquake scenario and generate ground motions of the studied region. Second, construct the MDOF shear models of RC frame structures according to building attribute data (number of stories, floor area, year of built, etc.). Specifically, the interstory stiffness of the MDOF model can be determined according to the empirical equation for the natural period of RC frame structures and the interstory capacity can be determined through equivalent lateral force analysis [
18]. Third, the interstory parameters, obtained in the former step, are for uncorroded buildings, and the interstory backbone curve parameters should be adjusted based on the reduction rules obtained in the third module. Fourth, perform a time history analyses of the MDOF shear models and assess the damage state of each building according to the calculated engineering demand parameters [
18,
37].
Note that the methods in the fourth module are relatively mature [
4,
5,
6,
18,
19], methods of the former three modules are discussed in the following sections.
3. Corrosion Simulation of Coastal RC Buildings
Chloride-induced corrosion is one of the main reasons for deterioration of RC structures. Therefore, the following work mainly deals with chloride-induced corrosion, and other effects such as carbonation-induced corrosion can be found in future studies.
The deterioration process of chloride-induced corrosion of RC structures can be divided into three stages [
28], as shown in
Figure 4. According to the deterioration process, the calculation methods for corrosion initiation time and degree of corrosion are discussed, in detail, in the following subsections.
3.1. Initiation Time
There are many models concerning the calculation of the corrosion initiation time of reinforcements in concrete [
38,
39,
40]. The ingress of chloride ions is one of the most important causes of corrosion initiation of reinforcing steel [
41]. Most of the existing methods are based on Fick’s law to simulate the chloride ion diffusion in concrete structures [
42]. The corrosion initiation time is the time taken for the chloride ion concentration on the surface of reinforcements to reach the critical value [
43]. Specifically, Equation (1) can be used to calculate the corrosion initiation time of RC structures [
40].
where
Tcorr is the corrosion initiation time,
D is the chloride ion diffusion coefficient,
X is the cover of concrete,
Ccr is the critical chloride ion concentration,
C0 is the initial chloride ion concentration in cement paste, and
Cs is the chloride ion concentration on the surface of concrete.
The chloride ion diffusion coefficient
D and the critical chloride ion concentration
Ccr in Equation (1) can be determined according to the study by Vu and Stewart [
1]. The initial chloride ion concentration,
C0, in cement paste can be determined according to the actual condition of coastal buildings. For example, if sea sand is used irregularly in concrete, the initial chloride ion concentration can be relatively high [
2,
44]. Owing to the influence of sea breeze and sea fog, the chloride ion concentration on the surface of the coastal RC structures,
Cs, is related to the distance from the coastline
d. The chloride ion concentration on the surface of coastal RC structures,
Cs (kg∙m
−3), can be calculated according to the work of McGee (Equation (2)) [
45], which is proposed based on the statistical results of 1158 bridges in coastal atmospheric environments.
3.2. Degree of Corrosion
Once the corrosion initiation time of reinforcements in concrete is estimated, Equations (3)–(7) can be used to determine the section loss rate of reinforcements caused by corrosion [
46].
where
Ψ(
t) is the degree of corrosion of reinforcements at time
t;
D(
t) is the diameter of reinforcements at time
t;
D0 is the initial diameter of reinforcements;
α is the pitting coefficient, which is 2.0 for general corrosion and 4–8 for pitting corrosion [
47];
Pave(
t) is the average corrosion depth of mass loss per unit volume at time
t, which can be calculated by Equation (5).
where
ĸ equals 0.0116, which helps to convert the unit from μA∙cm
−2 to mm∙year
−1 [
1]; and
icorr(
t) is the corrosion current density at time
t in μA∙cm
−2. The corrosion current density
icorr(
t) at time
t can be calculated according to Equations (6) and (7), based on the study of Vu and Stewart [
1].
where
icorr0 is the corrosion current density at the time of
Tcorr, and
w/
c is the water-cement ratio of concrete.
X is the cover of concrete in centimeter.
4. Statistical Analysis of Experimental Results of Corroded RC Components
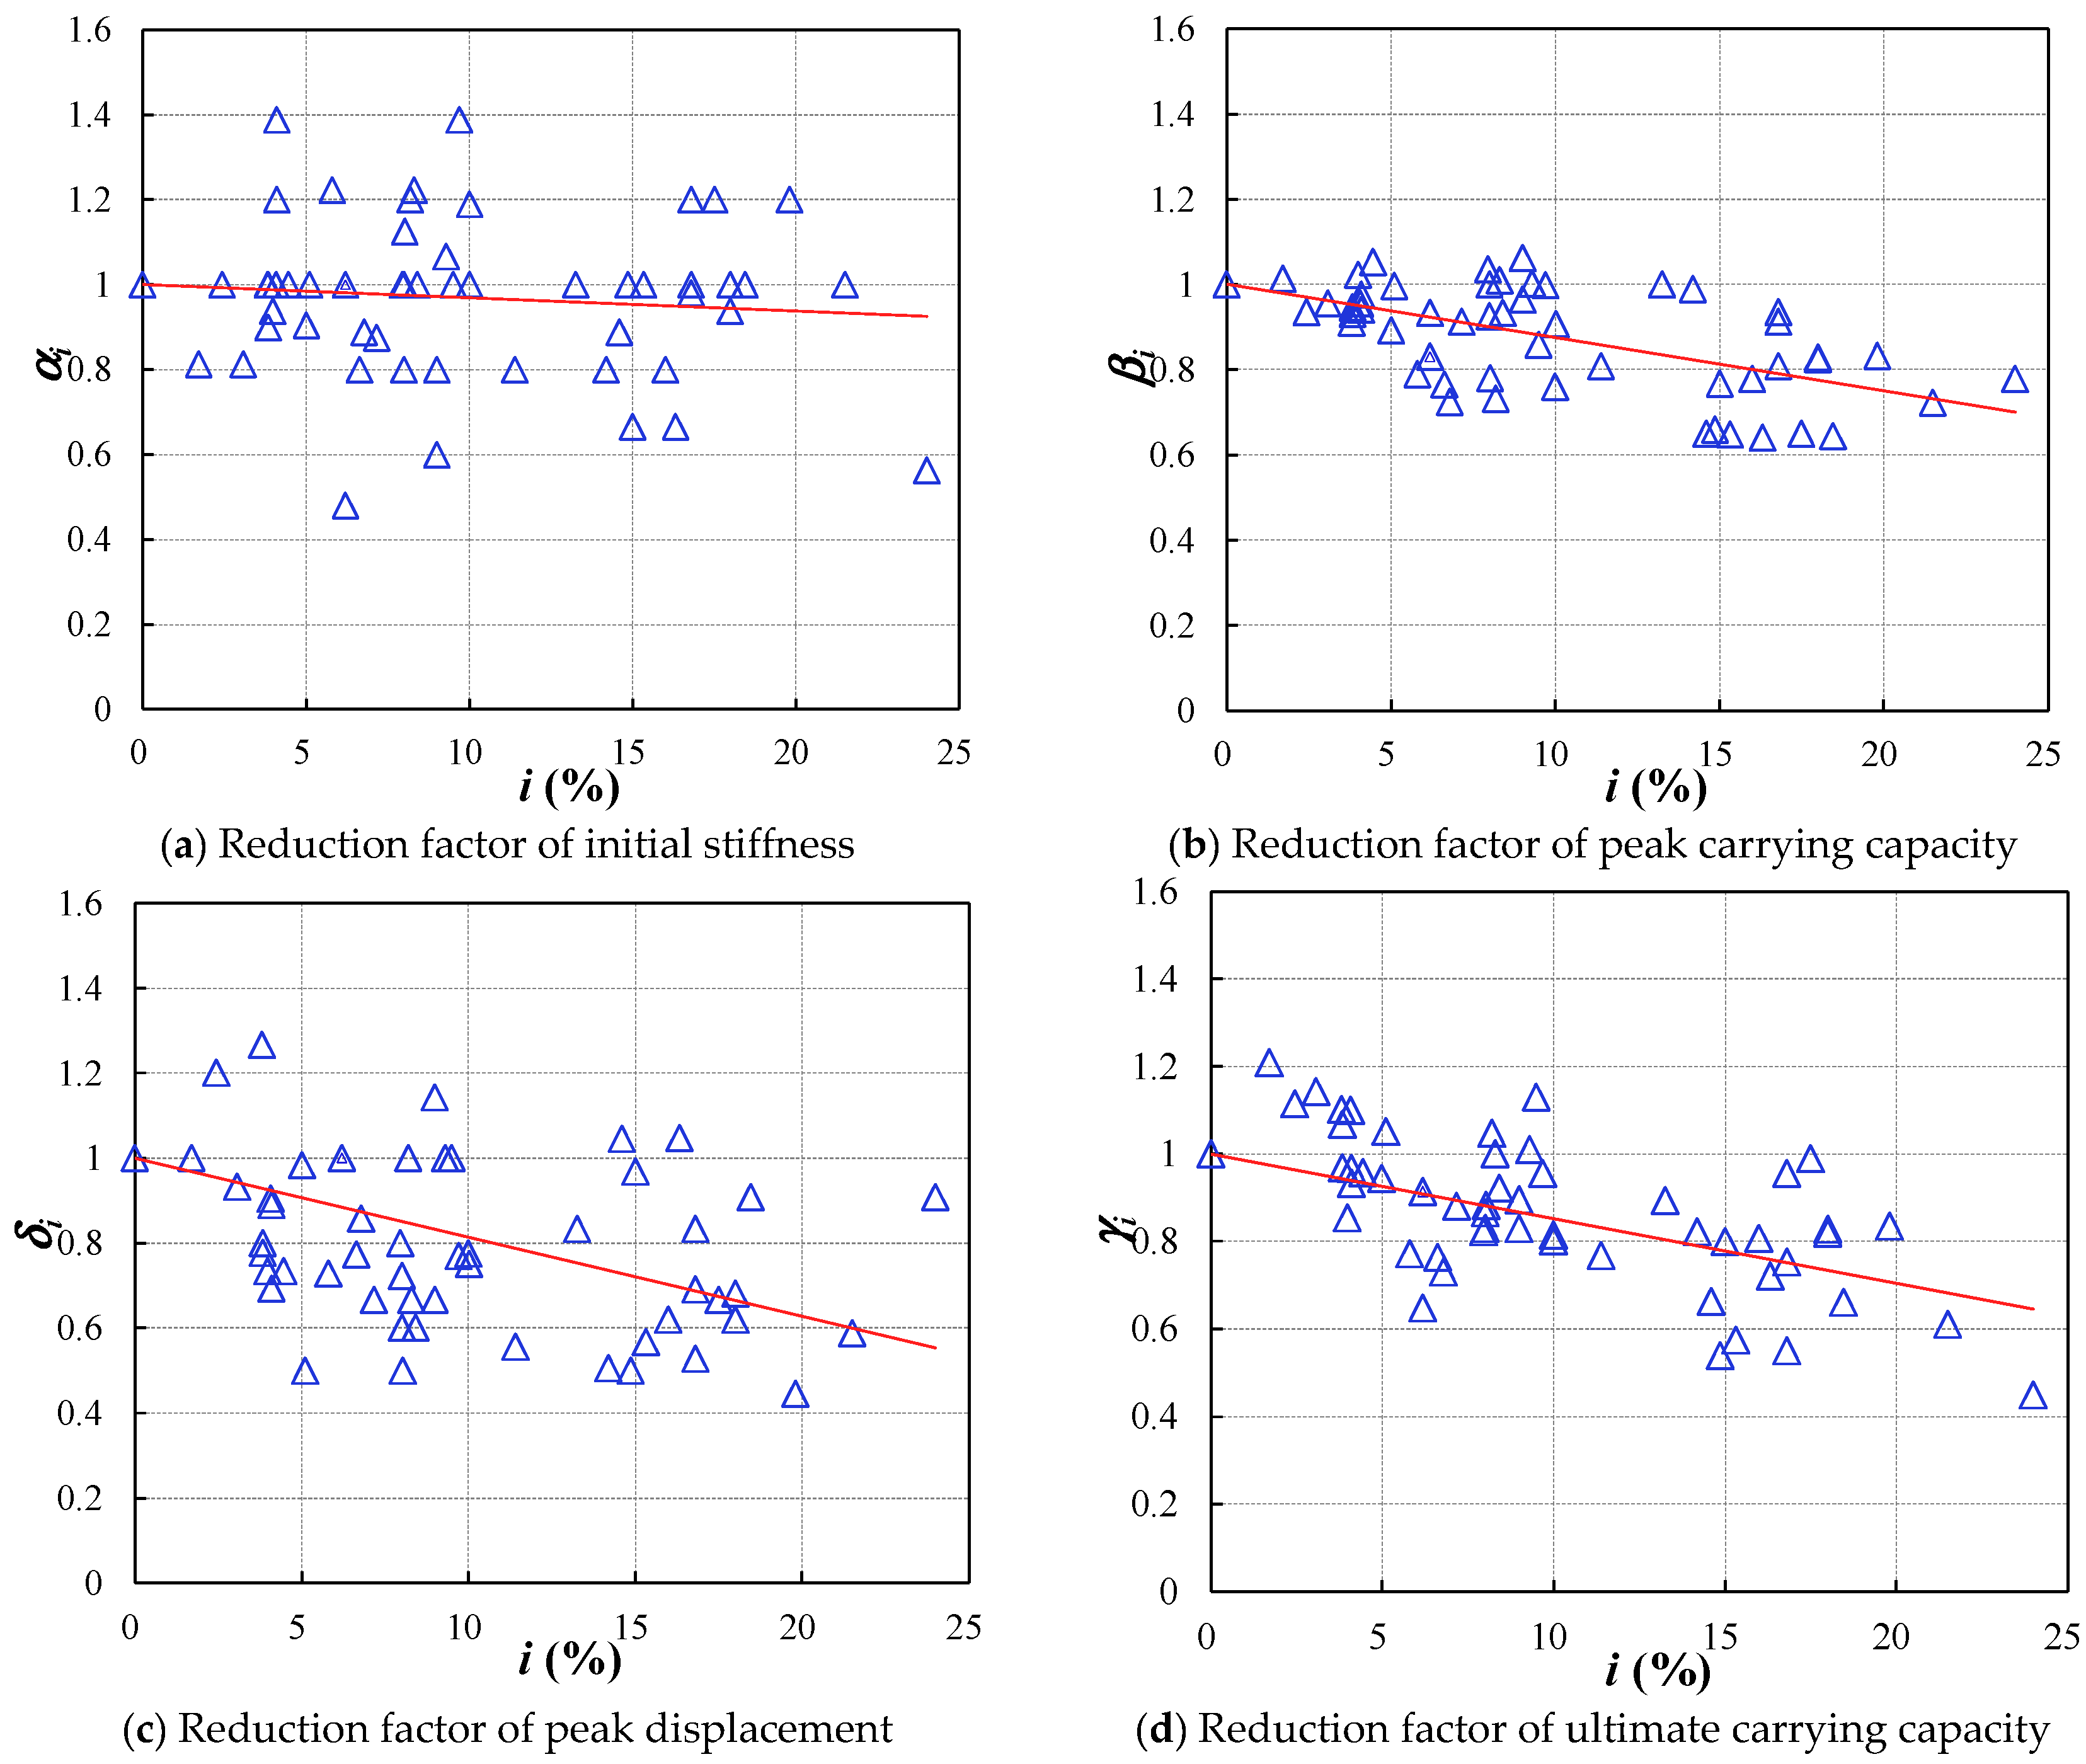
To date, the mechanical properties of corroded beam and column components have been studied experimentally by numerous researchers. In this section, experimental data of corroded slender RC components are collected and the backbone curve parameters (i.e., initial stiffness, peak carrying capacity, peak displacement, and ultimate carrying capacity) of these components are analyzed statistically to reveal the degradation characteristics of key backbone curve parameters.
The flexural capacity of slender RC components can be affected by various design factors, for example, reinforcement ratio, section dimension, material strength, and axial load ratio. To eliminate the influence of different design factors, components with the same design factors but different degrees of corrosion are categorized into groups. For each group, the reduction ratio of backbone curve parameters of the corroded to uncorroded components is calculated. Note that the reduction ratio is a dimensionless value, which is useful to reflect the degradation of mechanical properties induced by corrosion. The adopted backbone curve parameters and the calculation methods are elaborated as follows:
- (1)
For the reduction factor of initial stiffness
αi (Equation (8)), the initial stiffness is calibrated according to Tran and Li [
48], which is obtained by calculating the secant stiffness at the point when the applied load reaches 0.75 times of the peak carrying capacity.
αi is the ratio of the backbone curve initial stiffness
Ki of a corroded component with the degree of corrosion
i to the initial stiffness
K0 of an uncorroded component with the same design details, as illustrated in
Figure 5a.
- (2)
For the reduction factor of peak carrying capacity
βi (Equation (9)), the peak carrying capacity can be obtained by calculating the maximum value of the applied load. In Equation (9),
Fi is the peak carrying capacity of a component with the degree of corrosion I, and
F0 is the peak carrying capacity of an uncorroded component (
Figure 5a).
- (3)
For the reduction factor of peak displacement
δi (Equation (10)), the peak displacement is the corresponding displacement of the peak carrying capacity.
δi is the ratio of the peak displacement
∆pi of a component with the degree of corrosion
i to peak displacement of an uncorroded component
∆p0 (
Figure 5a).
- (4)
The reduction factor of ultimate carrying capacity
γi (Equation (11)) is the ratio of the ultimate carrying capacity
Fui of a component with the degree of corrosion of
i to that of an uncorroded component
Fu0 (
Figure 5a). In literatures, the ultimate point is usually defined as the point when the carrying capacity decreased to 0.85 times that of the peak carrying capacity [
24,
49]. For the collected test results, some specimens exhibited small strength degradation and the test was terminated when the carrying capacity was still larger than 0.85 times the peak carrying capacity. Note that the terminated displacement is larger than 1.3 times the peak displacement for all components, the point at 1.3 times the peak displacement is defined as the ultimate point, and the corresponding carrying capacity is defined as the ultimate carrying capacity (
Figure 5a). The calibrated backbone curve for an example specimen is illustrated in
Figure 5b.
In this study, 73 slender RC components with different degrees of corrosion are collected and the properties of these components are exhibited in
Table 1. According to the calculation methods in Equations (8)–(11), the computed reduction factors of the four key parameters of all specimens are displayed in
Figure 6.
The reduction factors of all four key parameters are fitted using linear regression and the results are shown in Equations (12)–(15). Note that the experimental results are relatively dispersed, the expectation value and standard deviation of regression errors are presented in Equations (12)–(15) to demonstrate the dispersion of experimental data. According to the results, all four reduction factors decrease with an increase in degree of corrosion. It is worth noting that in Equation (14), the slope value of the peak displacement,
δi, is −1.87, which has the largest absolute value. This implies that the ductility of RC components experiences severe deterioration with an increase in degree of corrosion.
where
i is the degree of corrosion of longitudinal reinforcement.
5. Degradation Analysis of Building Interstory Backbone Curve Parameters
To perform regional seismic damage prediction of corroded buildings based on the MDOF shear model, the reduction rules of interstory backbone curve parameters are indispensable. To this end, finite element models of RC frame structures in different corrosion conditions are constructed in this section. The reduction rules of building interstory backbone curve parameters are investigated through pushover analyses.
5.1. Simulation Procedure
In this work, the nonlinear Euler beam element is used to simulate the corroded RC frame structures. The curvature–bending moment hysteretic model of the nonlinear Euler beam element adopts a trilinear backbone curve model and a single-parameter hysteretic model as shown in
Figure 2. The detailed simulation procedure of corroded RC frame structures is shown in
Figure 7.
The simulation procedure of corroded RC frame structures can be divided into five steps as follows:
Collect design information of the RC frame structure, including dimension of components, reinforcement details, and degree of corrosion of each component.
Simulate the curvature–bending moment hysteretic curves of all beam and column components in uncorroded state. There are a lot of methods available for simulating the performance of slender RC components in uncorroded states. Among them, the fiber beam model exhibits good computational efficiency and can well capture the nonlinear properties of steel and concrete materials [
61]. Therefore, a fiber beam model is used in this step to calculate the hysteretic curves of uncorroded components.
Calibrate the trilinear backbone curve and the single-parameter hysteretic models (
Figure 2) according to the simulated curvature–bending moment hysteretic curve.
Adjust the backbone curve parameters of corroded components according to the degree of corrosion of each component and the reduction equations obtained in
Section 4.
Construct the nonlinear Euler beam model of corroded RC frame structures. Perform pushover analyses to obtain the interstory backbone curves of corroded RC frame structures.
5.2. Simulation of Corroded RC Frame Structures
The corrosion condition of RC structures in coastal areas is complicated. In this section, two factors that can affect the seismic performance of corroded RC frame structures are considered in the simulation, which are the proportion of corroded components (PCC) and degree of corrosion.
(1) Proportion of Corroded Components (PCC)
The corrosion conditions of internal and peripheral components in an RC frame structures are completely different. The external beams and columns are in direct contact with coastal corrosive environment, which makes them more susceptible to chloride attack. Therefore, in this study, the peripheral beam and column components are assumed to be influenced by chloride attack and the degree of corrosion of peripheral components can be computed according to the method presented in
Section 3. Meanwhile, the internal beam and column components do not have direct contact with the external environment and no corrosion is assumed for internal components (
Figure 8). The proportion of corroded components (PCC) is defined as the ratio of peripheral column number to total column number.
(2) Degree of Corrosion
The degree of corrosion of components can significantly affect the seismic performance of RC frame structures. Therefore, the influence of degree of corrosion on the seismic performance of corroded RC frame structures is also investigated in the following numerical simulations.
In this section, note that only two factors (i.e., PCC and degree of corrosion) are considered in the seismic performance analysis of corroded individual buildings. The actual corrosion condition of individual buildings can be much more complicated. For example, the bottom of columns can experience severe corrosion due to salinization of soil, and the peripheral components can experience non-uniform corrosion due to a higher chloride concentration on the outer surface of RC components [
60]. Furthermore, a simplified hysteretic model is used to simulate the performance of corroded RC frame structures. Some mechanisms, such as post-yielding buckling [
62], can also affect the performance deterioration of RC frame structures, which require further investigation in future studies.
In this section, typical RC frame structures with different PCCs and degrees of corrosion are investigated numerically. Specifically, four four-story RC frame structures with different bays are designed in compliance with Chinese code (GB50010-2010) [
63]. According to the seismic intensity of Shenzhen, the adopted maximum value of the design spectrum acceleration is 0.8 m∙s
−2 and the rigid diaphragm assumption is adopted for the floor system. Note that the structural configuration and the design code adopted can also influence the seismic performance of corroded RC frame structures. Further works are required to investigate these effects.
Pushover analyses are performed for all frames and the fixed boundary condition is adopted for all columns at the bottom. The structure–soil interaction in not considered in this study. The effect of structure–soil interaction can be considered in future studies according to related works [
64,
65].
Design details are shown in
Figure 8 and the parameters of different simulation cases are presented in
Table 2.
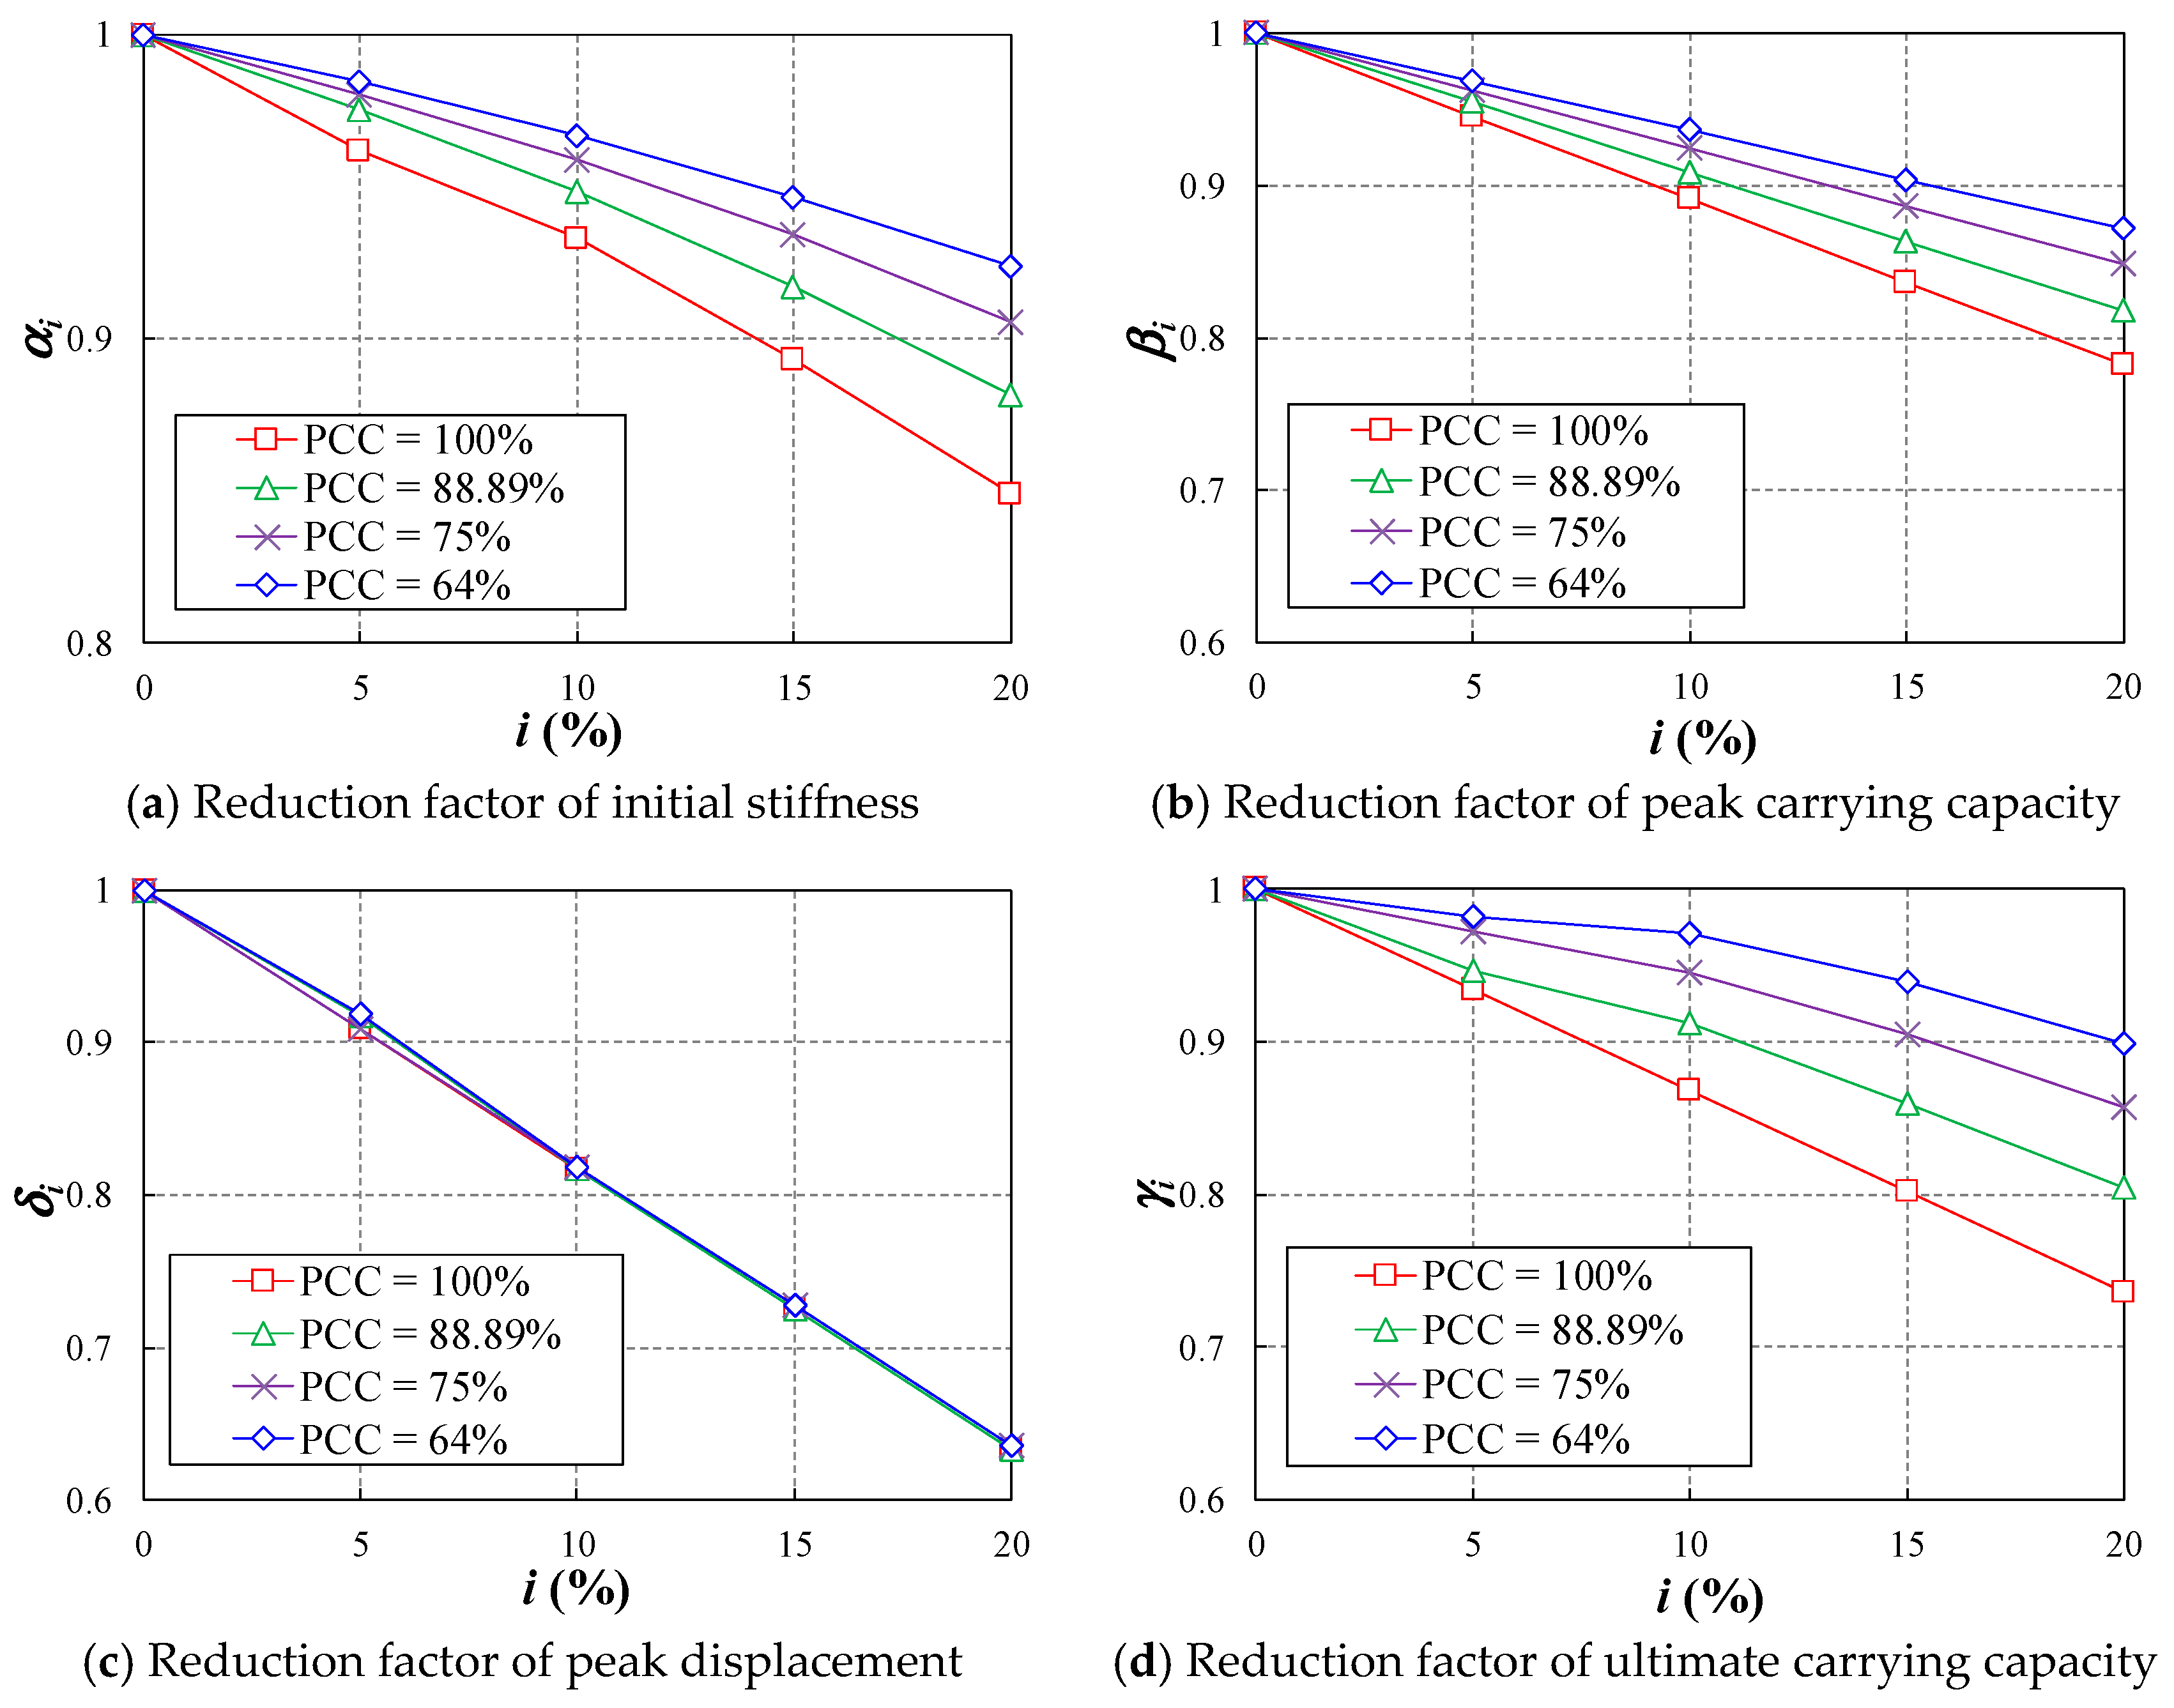
5.3. Results of Simulation
The simulated interstory backbone curves of the first story of all cases are presented in
Figure 9. The results show that with an increased degree of corrosion, the initial stiffness, ductility, and load carrying capacity, in all cases, decrease. Note that the results exhibit a similar pattern, because the trilinear backbone curve is adopted to simulate the curvature–bending moment response of RC components. Meanwhile, the responses of corroded components are simulated by reducing the key mechanical parameters of RC components in an uncorroded state according to Equations (12)–(15). Therefore, the backbone curves of both corroded and uncorroded frames exhibit similar trilinear patterns.
After obtaining the backbone curves of all cases, the reduction factors of backbone curve parameters among cases with different degrees of corrosion are computed according to the method presented in
Section 4. The calculated parameter reduction factors are shown in
Figure 10.
The above results show that reduction factors of building interstory backbone curve parameters decrease with an increase in degree of corrosion, which corresponds to the experimental results (
Figure 6). Moreover, the PCC can also affect backbone curve parameters. For example, the larger the PCC, the smaller the stiffness and carrying capacities. The above results show that both PCC and degree of corrosion can affect the building interstory backbone curve parameters. Therefore, bivariate linear regression is used to analyze the reduction factors and the reduction equations are shown in Equations (16)–(19).
where
ω is the PCC and
i is the degree of corrosion of corroded components.
From the above analyses, the reduction rules of interstory backbone curve parameters of corroded RC frame structures are obtained. For the THA-based building seismic damage simulation of corroded RC frame structures using a MDOF shear model, the initial uncorroded interstory backbone curve parameters of the MDOF shear model obtained through the method of Xiong et al. [
18] can be adjusted using Equations (16)–(19) (
Figure 3).
6. Case Studies of Shenzhen City
Shenzhen is a coastal city located in the south of China. Buildings in the coastal area of Shenzhen city are prone to chloride attack. Therefore, RC frame structures of Shenzhen city are investigated in the following sections.
6.1. Introduction to the Studied Area
The studied area contains 8809 RC frame buildings. The building inventory data include name, year of built, structural type, floor area, number of stories, and location of each building. The floor area is used to calculate the proportion of peripheral components by assuming a 6 m span for all RC frame buildings. The distributions of year of built and number of stories of the studied buildings are shown in
Figure 11. The distribution of year of built is also shown in
Figure 12. As evident in the figure, old buildings mainly concentrated in the southeast of the region.
6.2. Initiation Time and Degree of Corrosion
According to the method presented in
Section 3, the parameters for corrosion simulation include the following: the cover of concrete
X, the chloride diffusion coefficient
D, the critical chloride concentration
Ccr, the water cement ratio of concrete
w/
c, and the initial diameter of longitudinal reinforcements
D0. These parameters are presented in
Table 3. The chloride ion concentration on concrete surface,
Cs, is calculated according to Equation (2). Considering that this study deals with city-scale building seismic damage simulation, the detailed information of each building is very limited, and the pitting corrosion information of each building is difficult to acquire. Therefore, only general corrosion is adopted in the following simulation [
47] (Equation (4)).
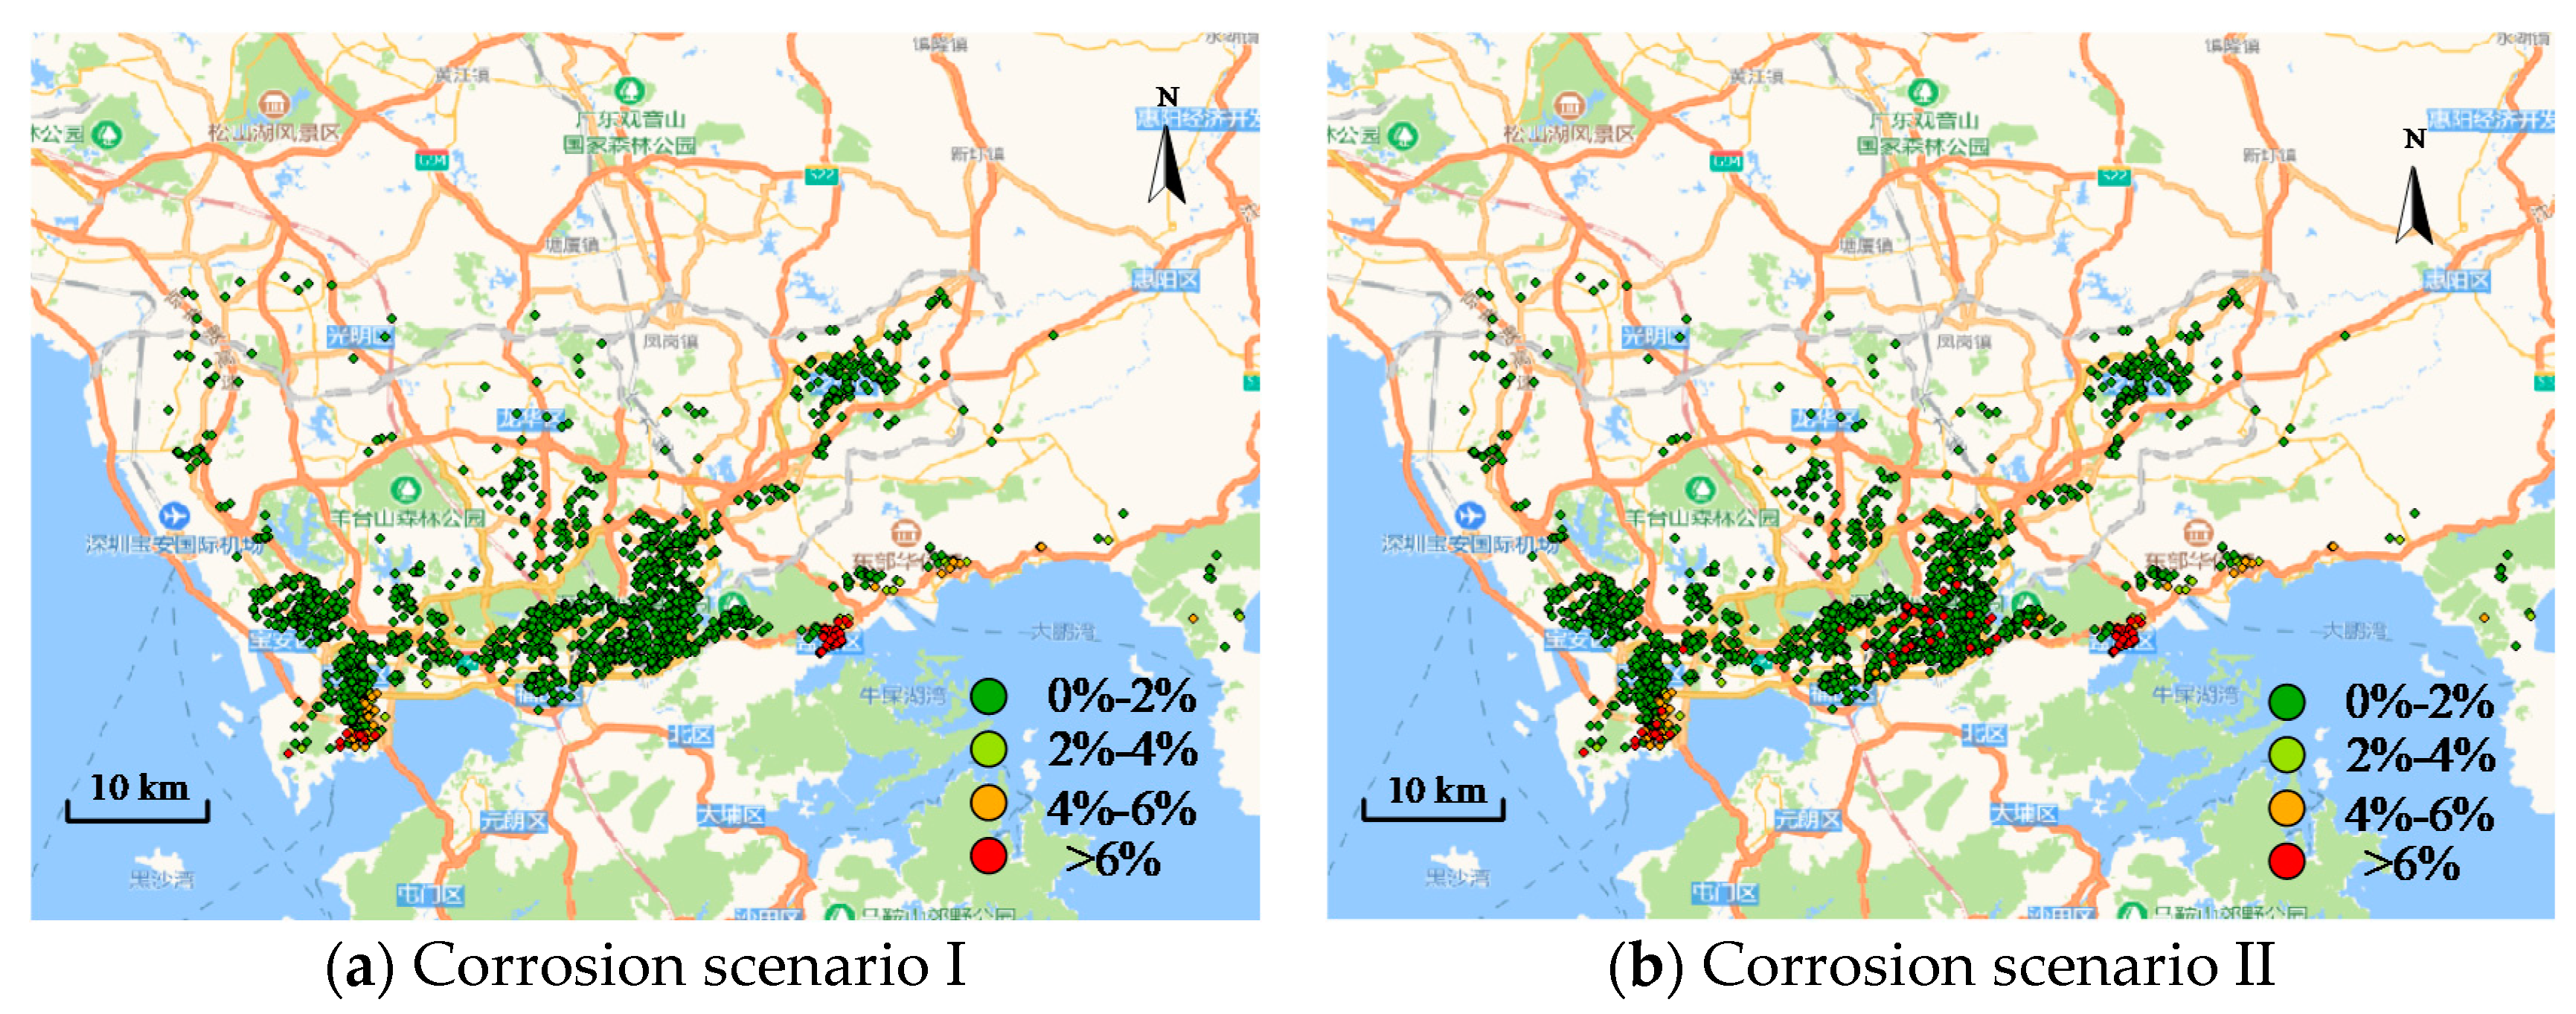
As shown in
Figure 13a, in corrosion scenario I, only some buildings near the coastline experienced corrosion. For corrosion scenario II, some old buildings that are far from the coastline also experienced corrosion due to irregular use of sea sand in concrete (
Figure 13b).
6.3. Earthquake Simulation
In the simulation cases, the epicenter is set at the Jiuweiling fault with the strike direction of 46 degrees [
66]. On the basis of the Chinese response spectral attenuation functions [
67] and site amplification factors [
68], seismic response spectrum data in the whole area are obtained. Subsequently, ground motions of the whole area are generated through the artificial ground motion generation program SIMQKE [
69]. Finally, ground motions are input into the MDOF model of each building for time history analysis, and the seismic response of each building is obtained.
Figure 14 shows the attenuation functions and typical ground motion time histories used in this study.
Figure 15 shows the epicenter of the earthquake scenario and the distributions of response spectral parameter Sa_0.3 s in the whole area under the M6.5 and M7.5 earthquake scenarios.
6.4. Simulation Procedure of an Individual Building in Shenzhen City
To illustrate the proposed method, the simulation procedure of an individual building is presented in this section. The studied RC frame building has six stories and was built in 1985, which is located at the southeast coast of Shenzhen city. The dimension of its floor plan is 50 m long and 15 m wide. The detailed simulation procedure of the building using the MDOF model is as follows:
- (1)
The natural period of the building can be calculated according to the number of stories together with the empirical equation of building natural period [
18]. The interstory shear stiffness of the MDOF model can be determined based on the natural period of the building and the mass of each story [
18].
- (2)
The equivalent lateral force analysis is used to determine the interstory shear carrying capacity of the MDOF model [
18] based on the corresponding seismic design code for buildings in 1985.
- (3)
The proposed method in
Section 3 is adopted to compute the degree of corrosion of peripheral components, given the year of built and the distance from coastline of the studied building.
- (4)
The layout of columns is determined according to the dimension of floor plan by assuming a 6 m column spacing. The PCC can be obtained by calculating the ratio of peripheral column number and total column number (
Section 5.2).
- (5)
The interstory backbone curve parameters of the building in uncorroded state determined in the first and second steps are reduced according to Equations (16)–(19), given the degree of corrosion and PCC obtained in Steps (3) and (4).
- (6)
Finally, nonlinear time history analysis of the established MDOF model is performed and the calculated engineering demand parameters are used to determine the damage state of the building.
The above procedure is realized through FORTRAN programming. Therefore, the nonlinear time history analyses of a large number of corroded buildings in an urban area can be conducted automatically.
6.5. Results of Simulation
To compare the simulation results for cases with and without corrosion considered, regional seismic damage simulations for the area in uncorroded state and in corrosion scenario I (
Figure 13a) are performed using the M7.5 earthquake scenario (
Figure 15b). The simulated distributions of building seismic damages are illustrated in
Figure 16. The results in
Figure 16a,b indicate that only slight differences of building seismic damages can be found in the red-framed areas. This is because in corrosion scenario I, only a few buildings located in the red-framed areas are corroded. These buildings are very close to the coastline and are susceptible to airborne chloride-induced corrosion (
Figure 13a). When corrosion is considered for the case in
Figure 16b, these coastal buildings exhibit more severe damage as compared with those in
Figure 16a.
To compare the two corrosion scenarios (
Figure 13), regional seismic damage simulations are conducted using the M6.5 earthquake scenario and the results are shown in
Figure 17. The seismic damage results of buildings in corrosion scenario II (
Figure 17b) are more severe than those in corrosion scenario I (
Figure 17a). This is because in corrosion scenario II, some old buildings are assumed to be built using sea sand as construction material and severe chloride-induced corrosion can be observed for these buildings (
Figure 13b), which results in more severe damage as compared with those in corrosion scenario I (
Figure 17a).
From the above simulations, corrosion of reinforcements has a relatively large impact on the seismic performance of buildings. The seismic damage simulation results of buildings in corrosion scenario I indicate that airborne diffusion-induced corrosion primarily affects RC buildings near the coastline. The simulation results of buildings in corrosion scenario II show that irregular use of sea sand in RC structures can accelerate the corrosion process, and therefore buildings far from the coastline can also suffer from corrosion-induced seismic performance deterioration.
7. Conclusions
A regional seismic damage simulation method for corroded coastal RC frame structures is proposed in this study. Through statistical analysis of experimental data and numerical simulation of typical corroded RC frame structures, the reduction rules of key mechanical parameters are obtained for the THA-based regional seismic damage simulation. Some conclusive remarks can be drawn as follows:
- (1)
The experimental data of 73 slender RC components with different degrees of corrosion are collected to obtain the reduction rules of component backbone curve parameters (i.e., initial stiffness, peak displacement, peak carrying capacity, and ultimate carrying capacity). Such results can be useful in simulating the response of corroded RC components or structures.
- (2)
Pushover analyses of 20 corroded RC frames are conducted based on the obtained reduction rules of component backbone curve parameters. The simulated results indicate that both the degree of corrosion and proportion of corroded components can greatly affect the interstory mechanical properties of corroded RC frame structures.
- (3)
The regional seismic damage simulation method of corroded RC frame structures is proposed based on the multi-degree-of-freedom (MDOF) model and the nonlinear time history analysis. The reduction rules of interstory mechanical properties obtained through pushover analyses of corroded RC frame structures are used to determine the parameters of the MDOF model.
- (4)
The proposed method is demonstrated through a case study of RC frame structures in Shenzhen city. Two corrosion scenarios are assumed for the studied area. The simulated results show that RC buildings along the coastline are affected by airborne chloride-induced corrosion and severe seismic damage can be observed in the M7.5 earthquake scenario. Moreover, some buildings that are far from the coastline can also experience severe seismic damage due to corrosion caused by irregular use of sea sand as constructional material.
Author Contributions
Conceptualization, C.X.; Data curation, Y.L. and J.H.; Funding acquisition, C.X. and D.L.; Investigation, X.D., Y.L., and J.H.; Project administration, X.L. and D.L.; Resources, D.L.; Supervision, X.L. and D.L.; Writing—original draft, C.X. and X.D.; Writing—review and editing, C.X. and Q.L. All authors have read and agreed to the published version of the manuscript.
Funding
This research was funded by the Scientific Research Fund of the Institute of Engineering Mechanics, China Earthquake Administration (grant no. 2017D01), the National Natural Science Foundation of China (grant no. 51520105012; 51708361), and the Intellectual Innovation Program of Shenzhen Science and Technology Innovation Committee (grant no. JCYJ20180305123919731).
Conflicts of Interest
The authors declare no conflict of interest.
References
- Vu, K.A.; Stewart, M.G. Structural reliability of concrete bridges including improved chloride-induced corrosion models. Struct. Saf. 2000, 22, 313–333. [Google Scholar] [CrossRef]
- Xiao, J.; Qiang, C.; Nanni, A.; Zhang, K. Use of sea-sand and seawater in concrete construction: Current status. Constr. Build. Mater. 2017, 155, 1101–1111. [Google Scholar] [CrossRef]
- Yépez, F.; Yépez, O. Role of construction materials in the collapse of R/C buildings after Mw 7.8 Pedernales-Ecuador earthquake, April 2016. Case Stud. Struct. Eng. 2017, 7, 24–31. [Google Scholar] [CrossRef]
- Hori, M.; Ichimura, T. Current state of integrated earthquake simulation for earthquake hazard and disaster. J. Seismol. 2008, 12, 307–321. [Google Scholar] [CrossRef]
- Federal Emergency Management Agency (FEMA). Multi-hazard Loss Estimation Methodology-Earthquake Model. HAZUS-MH 2.1 Technical Manual; Federal Emergency Management Agency: Washington, DC, USA, 2012.
- Xiong, C.; Lu, X.; Huang, J.; Guan, H. Multi-LOD seismic-damage simulation of urban buildings and case study in Beijing CBD. Bull. Earthq. Eng. 2019, 17, 2037–2057. [Google Scholar] [CrossRef]
- Lu, X.; Zeng, X.; Xu, Z.; Guan, H. Improving the accuracy of near-real-time seismic loss estimation using post-earthquake remote sensing images. Earthq. Spectra. 2018, 34, 1219–1245. [Google Scholar] [CrossRef]
- Applied Technology Council (ATC). Earthquake Damage Evaluation Data for California. ATC-13 Report; Applied Technology Council: Redwood, CA, USA, 1985. [Google Scholar]
- Dolce, M.; Masi, A.; Marino, M.; Vona, M. Earthquake damage scenarios of the building stock of Potenza (Southern Italy) including site effects. Bull. Earthq. Eng. 2003, 1, 115–140. [Google Scholar] [CrossRef]
- Verderame, G.M.; Ricci, P.; Luca, F.D.; Gaudio, C.D.; Risi, M.T. Damage scenarios for RC buildings during the 2012 Emilia (Italy) earthquake. Soil. Dyn. Earthq. Eng. 2014, 66, 385–400. [Google Scholar] [CrossRef]
- del Gaudio, C.; Ricci, P.; Verdername, G.M.; Manfredi, G. Development and urban-scale application of a simplified method for seismic fragility assessment of RC buildings. Eng. Struct. 2015, 91, 40–57. [Google Scholar] [CrossRef]
- MAE Center. Earthquake Risk Assessment Using MAEviz 2.0: A Tutorial Mid-America Earthquake Center University of Illinois at Urbana-Champaign; MAE Center: Urbana-Champaign, IL, USA, 2006. [Google Scholar]
- Bergami, A.V.; Forte, A.; Lavorato, D.; Nuti, C. Proposal of a incremental modal pushover analysis (IMPA). Earthq. Struct. 2017, 13, 539–549. [Google Scholar] [CrossRef]
- Lu, X.; Han, B.; Hori, M.; Xiong, C.; Xu, Z. A Coarse-grained parallel approach for seismic damage simulations of urban areas based on refined models and GPU/CPU cooperative computing. Adv. Eng. Softw. 2014, 70, 90–103. [Google Scholar] [CrossRef]
- Xu, Z.; Lu, X.; Law, K. A Computational framework for regional seismic simulation of buildings with multiple fidelity models. Adv. Eng. Softw. 2016, 99, 100–110. [Google Scholar] [CrossRef]
- Hori, M. Introduction to Computational Earthquake Engineering; Imperial College Press: London, UK, 2006; ISBN 978-18-4816-398-0. [Google Scholar]
- Xiong, C.; Lu, X.; Guan, H.; Xu, Z. A nonlinear computational model for regional seismic simulation of tall buildings. Bull. Earthq. Eng. 2016, 14, 1047–1069. [Google Scholar] [CrossRef]
- Xiong, C.; Lu, X.; Lin, X.; Xu, Z.; Ye, L. Parameter determination and damage assessment for THA-based regional seismic damage prediction of multi-story buildings. J. Earthq. Eng. 2017, 21, 461–485. [Google Scholar] [CrossRef]
- Xiong, C.; Huang, J.; Lu, X. Framework for city-scale building seismic resilience simulation and repair scheduling with labor constraints driven by time–history analysis. Comput. Aided Civil. Infrastruct. Eng. 2020, 35, 322–341. [Google Scholar] [CrossRef]
- Mahin, S.A.; Deierlein, G.G.; Govindjee, S.; Lowes, L.N.; Kareem, A.; Crittenden, C.; McKenna, F.; Schoettler, M. SimCenter Computational Framework for Simulating and Mitigating the Effects of Earthquakes. In Proceedings of the 11th U.S. National Conference on Earthquake Engineering, Los Angeles, CA, USA, 24–29 June 2018; pp. 25–29. [Google Scholar]
- Wang, X. Research of seismic performance and hysteretic mode of corroded reinforced concrete members. J. Xi’an Univ. Archit. Technol. 2003, 33, 15–21. (In Chinese) [Google Scholar]
- Gong, J.; Zhong, W.; Zhao, G. Experimental study on low-cycle behavior of corroded reinforced concrete member under eccentric compression. J. Build. Struct. 2014, 25, 92–104. (In Chinese) [Google Scholar] [CrossRef]
- Yan, G.; Zhuang, J.; Zeng, J. Research on mechanics characteristics of corroded reinforced concrete members. J. Fujian Univ. Technol. 2006, 4, 775–780. (In Chinese) [Google Scholar]
- Li, J.; Gong, J.; Wang, L. Seismic behavior of corrosion-damaged reinforced concrete columns strengthened using combined carbon fiber-reinforced polymer and steel jacket. Constr. Build. Mater. 2009, 23, 2653–2663. [Google Scholar] [CrossRef]
- Goksu, C. Seismic Behavior of RC Columns with Corroded Plain and Deformed Reinforcing Bars. Ph.D. Thesis, Istanbul Technical University, Istanbul, Turkey, 2012. [Google Scholar]
- Simioni, P. Seismic Response of Reinforced Concrete Structures Affected by Reinforcement Corrosion. Ph.D. Thesis, Technische Universität Braunschweig, Braunschweig, Germany, 2009. [Google Scholar]
- Ghosh, J.; Padgett, J.E. Aging considerations in the development of time-dependent seismic fragility curves. J. Struct. Eng. 2010, 136, 1497–1511. [Google Scholar] [CrossRef]
- Chiu, C.K.; Tu, F.J.; Haiao, F.P. Lifetime Seismic Performance Assessment for Chloride-corroded Reinforced Concrete Buildings. Struct. Infrastruct. Eng. 2015, 3, 345–362. [Google Scholar] [CrossRef]
- Biondini, F.; Camnasio, E.; Titi, A. Seismic resilience of concrete structures under corrosion. Earthq. Eng. Struct. Dyn. 2015, 44, 2445–2466. [Google Scholar] [CrossRef]
- Chiu, C.K.; Lyu, Y.C.; Jean, W.Y. Probability-based damage assessment for reinforced concrete bridge columns considering the corrosive and seismic hazards in Taiwan. Nat. Hazards Rev. 2014, 71, 2143–2164. [Google Scholar] [CrossRef]
- Yalciner, H.; Sensoy, S.; Eren, O. Seismic performance assessment of a corroded 50-year-old reinforced concrete building. J. Struct. Eng. 2015, 141, 05015001. [Google Scholar] [CrossRef]
- Deng, P.; Zhang, C.; Pei, S.; Jin, Z. Modeling the impact of corrosion on seismic performance of multi-span simply-supported bridges. Constr. Build. Mater. 2018, 185, 193–205. [Google Scholar] [CrossRef]
- Shabarchin, O.; Tesfamariam, S. Risk Assessment of oil and gas pipelines with consideration of induced seismicity and internal corrosion. J. Loss Prev. Process. Ind. 2017, 47, 85–94. [Google Scholar] [CrossRef]
- Chopra, A.K. Dynamics of Structures; Prentice Hall: Upper Saddle River, NJ, USA, 2011; ISBN 978-0132858038. [Google Scholar]
- Steelman, J.S.; Hajjar, J.F. Influence of inelastic seismic response modeling on regional loss estimation. Eng. Struct. 2009, 31, 2976–2987. [Google Scholar] [CrossRef]
- Miranda, E.; Taghavi, S. Approximate floor acceleration demands in multistory buildings I: Formulation. J. Struct. Eng. 2005, 131, 203–211. [Google Scholar] [CrossRef]
- Federal Emergency Management Agency (FEMA). Seismic Performance Assessment of Buildings, Volume 1–Methodology; Technical Report FEMA-P58; Federal Emergency Management Agency (FEMA): Washington, DC, USA, 2012.
- Shafei, B.; Alipour, A.; Shinozuka, M. Prediction of corrosion initiation in reinforced concrete members subjected to environmental stressors: A finite-element framework. Cem. Concr. Res. 2012, 42, 365–376. [Google Scholar] [CrossRef]
- Zhang, X.; Wang, J.; Zhao, Y.; Tang, L.; Xing, F. Time-dependent probability assessment for chloride induced corrosion of rc structures using the third-moment method. Constr. Build. Mater. 2015, 76, 232–244. [Google Scholar] [CrossRef]
- FIB. Model. Code for Service Life Design; Bulletin 34; FIB Press: Lausanne, Switzerland, 2006; ISBN 2-88394-073-8. [Google Scholar]
- Song, H.; Saraswathy, V. Corrosion Monitoring of Reinforced Concrete Structures-A Review. Int. J. Electrochem. Sci. 2007, 2, 1–28. [Google Scholar]
- Poulsen, E.; Mejlbro, L. Diffusion of Chloride in Concrete: Theory and Application; CRC Press: Boca Raton, FL, USA, 2005; ISBN 0-419-25300-9. [Google Scholar]
- Camnasio, E. Lifetime Performance and Seismic Resilience of Concrete Structures Exposed to Corrosion. Ph.D. Thesis, Politecnico di Milano, Milan, Italy, 2013. [Google Scholar]
- Liu, W.; Xie, Y.; Dong, B.; Xing, F. Study on Characteristics of Dredged Marine Sand and the Mechanical Properties of Concrete Made with Dredged Marine Sand. B. Chin. Cearm. Soc. 2014, 33, 15–22. (In Chinese) [Google Scholar] [CrossRef]
- McGee, R. Modelling of Durability Performance of Tasmanian Bridges. In Proceedings of the ICASP8 Applications of Statistics and Probability in Civil Engineering, Sydney, Australia, 12–15 December 1999; pp. 297–306. [Google Scholar]
- Dizaj, E.A.; Madandoust, R.; Kashani, M.M. Exploring the impact of chloride-induced corrosion on seismic damage limit states and residual capacity of reinforced concrete structures. Struct. Infrastruct. Eng. 2018, 14, 714–729. [Google Scholar] [CrossRef]
- Vidal, T.; Castel, A.; François, R. Analyzing crack width to predict corrosion in reinforced concrete. Cem. Concr. Res. 2004, 34, 165–174. [Google Scholar] [CrossRef]
- Tran, C.T.N.; Li, B. Initial stiffness of reinforced concrete columns with moderate aspect ratios. Adv. Struct. Eng. 2012, 15, 256–276. [Google Scholar] [CrossRef]
- Zhou, H.; Xu, Y.; Peng, Y.; Liang, X.; Li, D.; Xing, F. Partially corroded reinforced concrete piers under axial compression and cyclic loading: An experimental study. Eng. Struct. 2020, 203, 109880. [Google Scholar] [CrossRef]
- Ma, Y.; Che, Y.; Gong, J. Behavior of corrosion damaged circular reinforced concrete columns under cyclic loading. Constr. Build. Mater. 2012, 29, 548–556. [Google Scholar] [CrossRef]
- Ou, Y.; Tsai, L.; Chen, H. Cyclic performance of large-scale corroded reinforced concrete beams. Earthq. Eng. Struct. Dyn. 2012, 41, 593–604. [Google Scholar] [CrossRef]
- Wang, W. Research on Dynamic Performance of Corroded Reinforced Concrete Structure. Master’s Thesis, Shenzhen University, Shenzhen, China, 2013. (In Chinese). [Google Scholar]
- Zhu, J. Degradation of Capacity of the Corroded Reinforced Concrete Columns. Master’s Thesis, Shanghai University, Shanghai, China, 2013. (In Chinese). [Google Scholar]
- Meda, A.; Mostosi, S.; Rinaldi, Z.; Riva, P. Experimental evaluation of the corrosion influence on the cyclic behaviour of rc columns. Eng. Struct. 2014, 76, 112–123. [Google Scholar] [CrossRef]
- Guo, A.; Li, H.; Ba, X.; Guan, X.; Li, H. Experimental Investigation on the cyclic performance of reinforced concrete piers with chloride-induced corrosion in marine environment. Eng. Struct. 2015, 105, 1–11. [Google Scholar] [CrossRef]
- Yang, S.; Song, X.; Jia, H.; Chen, X.; Liu, X. Experimental research on hysteretic behaviors of corroded reinforced concrete columns with different maximum amounts of corrosion of rebar. Constr. Build. Mater. 2016, 121, 319–327. [Google Scholar] [CrossRef]
- Yuan, Z.; Fang, C.; Parsaeimaram, M.; Yang, S. Cyclic Behavior of corroded reinforced concrete bridge piers. J. Bridge. Eng. 2017, 22, 04017020. [Google Scholar] [CrossRef]
- Zheng, S.; Dong, L.; Zuo, H.; Qin, Q.; Liu, W.; Li, Q. Experimental investigation on seismic behaviors of corroded RC frame columns in artificial climate. J. Build. Struct. 2018, 39, 28–36. [Google Scholar]
- Rajput, A.S.; Sharma, U.K. Corroded reinforced concrete columns under simulated seismic loading. Eng. Struct. 2018, 171, 453–463. [Google Scholar] [CrossRef]
- Li, D.; Wei, R.; Xing, F.; Sui, L.; Zhou, Y.; Wang, W. Influence of non-uniform corrosion of steel bars on the seismic behavior of reinforced concrete columns. Constr. Build. Mater. 2018, 167, 20–32. [Google Scholar] [CrossRef]
- Lu, X.; Lu, X.; Guan, H.; Ye, L. Collapse simulation of reinforced concrete high-rise building induced by extreme earthquakes. Earthq. Eng. Struct. Dyn. 2013, 42, 705–723. [Google Scholar] [CrossRef]
- Lavorato, D.; Fiorentino, G.; Pelle, A.; Rasulo, A.; Bergami, A.V.; Briseghella, B.; Nuti, C. A corrosion model for the interpretation of cyclic behavior of reinforced concrete sections. Struct. Concr. 2019, 1–15. [Google Scholar] [CrossRef]
- Code for Design of Concrete Structures; GB50010-2010; Architecture & Building Press: Beijing, China, 2015.
- Gutierrez, J.A.; Chopra, A.K. A substructure method for earthquake analysis of structures including structure-soil interaction. Earthq. Eng. Struct. Dyn. 1978, 6, 51–69. [Google Scholar] [CrossRef]
- Ganjavi, B.; Hao, H. Effect of structural characteristics distribution on strength demand and ductility reduction factor of MDOF systems considering soil-structure interaction. Earthq. Eng. Eng. Vib. 2012, 11, 205–220. [Google Scholar] [CrossRef]
- Xu, J.; Yu, C.; Tang, D.; Zhang, G.; Xiao, B.; Jiang, P.; Chen, P. Active fault exploration and seismic hazard assessment in shenzhen city. Geotech. Invest. Survey. 2012, 1, 161–166. (In Chinese) [Google Scholar]
- Yu, Y. Study on Attenuation Relationships of Long Period Ground Motions. Ph.D. Thesis, Institute of Geophysics, China Earthquake Administration, Beijing, China, 2002. [Google Scholar]
- Lu, H.; Zhao, F. Site coefficients suitable to China site category. Acta. Seismol. Sin. 2007, 20, 71–79. [Google Scholar] [CrossRef]
- Gasparini, D.; Vanmarcke, E.H. SIMQKE, A Program. Artificial Motion Generation; Department of Civil Engineering, Massachusetts Institute of Technology: Cambridge, MA, USA, 1976. [Google Scholar]
Figure 1.
Collapsed building with a high degree of corrosion in the reinforcements [
3]: (
a) Corroded reinforcements; (
b) Corroded reinforcements can be broken by hand.
Figure 1.
Collapsed building with a high degree of corrosion in the reinforcements [
3]: (
a) Corroded reinforcements; (
b) Corroded reinforcements can be broken by hand.
Figure 2.
Multi-degree-of-freedom (MDOF) shear model: (a) MDOF shear model; (b) Trilinear backbone curve; (c) Single-parameter hysteretic model.
Figure 2.
Multi-degree-of-freedom (MDOF) shear model: (a) MDOF shear model; (b) Trilinear backbone curve; (c) Single-parameter hysteretic model.
Figure 3.
Framework of regional seismic damage simulation for corroded reinforced concrete (RC) frame structures.
Figure 3.
Framework of regional seismic damage simulation for corroded reinforced concrete (RC) frame structures.
Figure 4.
Deterioration process of chloride-induced RC structure corrosion.
Figure 4.
Deterioration process of chloride-induced RC structure corrosion.
Figure 5.
Calibration of backbone curve parameters: (a) Backbone curves of corroded and uncorroded specimens; (b) Test and calibrated backbone curves
Figure 5.
Calibration of backbone curve parameters: (a) Backbone curves of corroded and uncorroded specimens; (b) Test and calibrated backbone curves
Figure 6.
Reduction factors of key backbone curve parameters: (a) Reduction factor of initial stiffness; (b) Reduction factor of peak carrying capacity; (c) Reduction factor of peak displacement; (d) Reduction factor of ultimate carrying capacity.
Figure 6.
Reduction factors of key backbone curve parameters: (a) Reduction factor of initial stiffness; (b) Reduction factor of peak carrying capacity; (c) Reduction factor of peak displacement; (d) Reduction factor of ultimate carrying capacity.
Figure 7.
Simulation procedure of corroded RC frame structures.
Figure 7.
Simulation procedure of corroded RC frame structures.
Figure 8.
Design details of the RC frame structure.
Figure 8.
Design details of the RC frame structure.
Figure 9.
First story backbone curves of all cases: (a) One-bay building (PCC = 100.00%); (b) Two-bay building (PCC = 88.89%); (c) Three-bay building (PCC = 75.00%); (d) Four-bay building (PCC = 64.00%).
Figure 9.
First story backbone curves of all cases: (a) One-bay building (PCC = 100.00%); (b) Two-bay building (PCC = 88.89%); (c) Three-bay building (PCC = 75.00%); (d) Four-bay building (PCC = 64.00%).
Figure 10.
Reduction factors of building interstory backbone curve parameters: (a) Reduction factor of initial stiffness; (b) Reduction factor of peak carrying capacity; (c) Reduction factor of peak displacement; (d) Reduction factor of ultimate carrying capacity.
Figure 10.
Reduction factors of building interstory backbone curve parameters: (a) Reduction factor of initial stiffness; (b) Reduction factor of peak carrying capacity; (c) Reduction factor of peak displacement; (d) Reduction factor of ultimate carrying capacity.
Figure 11.
Building information of the studied area: (a) Distribution of year of built; (b) Distribution of number of stories.
Figure 11.
Building information of the studied area: (a) Distribution of year of built; (b) Distribution of number of stories.
Figure 12.
Distribution of year of built in the area.
Figure 12.
Distribution of year of built in the area.
Figure 13.
Simulated distributions of degree of corrosion for RC frame buildings in Shenzhen city: (a) Corrosion scenario I; (b) Corrosion scenario II.
Figure 13.
Simulated distributions of degree of corrosion for RC frame buildings in Shenzhen city: (a) Corrosion scenario I; (b) Corrosion scenario II.
Figure 14.
Earthquake data: (a) Ground motion attenuation function (M6.5); (b) Acceleration/velocity time histories.
Figure 14.
Earthquake data: (a) Ground motion attenuation function (M6.5); (b) Acceleration/velocity time histories.
Figure 15.
Distributions of ground motion intensity parameter Sa_0.3 s (m∙s−2): (a) M6.5; (b) M7.5.
Figure 15.
Distributions of ground motion intensity parameter Sa_0.3 s (m∙s−2): (a) M6.5; (b) M7.5.
Figure 16.
Distributions of building seismic damage results (M7.5). (a) No corrosion; (b) Corrosion scenario I
Figure 16.
Distributions of building seismic damage results (M7.5). (a) No corrosion; (b) Corrosion scenario I
Figure 17.
Distributions of building seismic damage results (M6.5): (a) Corrosion scenario I; (b) Corrosion scenario II.
Figure 17.
Distributions of building seismic damage results (M6.5): (a) Corrosion scenario I; (b) Corrosion scenario II.
Table 1.
Properties of collected specimens.
Table 1.
Properties of collected specimens.
| No. | Reference | Component Type | Section Dimension (mm) | Axial Load Ratio | Number of Specimens |
|---|
| 1 | Wang [21] | Column | 200 × 200 | 0.34 | 2 |
| 2 | Gong et al. [22] | Column | 200 × 200 | 0.23 | 8 |
| 3 | Yan et al. [23] | Column | 200 × 200 | 0.27 | 3 |
| 4 | Li et al. [24] | Column | 200 × 200 | 0.35 | 2 |
| 5 | Goksu [25] | Column | 200 × 300 | 0.18 | 3 |
| 6 | Ma et al. [50] | Column | 260 | 0.15, 0.25, 0.4 | 7 |
| 7 | Ou et al. [51] | Beam | 300 × 500 | 0 | 5 |
| 8 | Wang [52] | Column | 300 × 300 | 0.1, 0.3 | 6 |
| 9 | Zhu [53] | Column | 300 | 0.2 | 8 |
| 10 | Meda et al. [54] | Column | 300 × 300 | 0.3 | 2 |
| 11 | Guo et al. [55] | Column | 250 × 600 | 0.1 | 4 |
| 12 | Yang et al. [56] | Column | 210 × 210 | 0.18 | 5 |
| 13 | Yuan et al. [57] | Column | 300 | 0.4 | 3 |
| 14 | Zheng et al. [58] | Column | 200 × 200 | 0.4 | 4 |
| 15 | Rajput et al. [59] | Column | 300 × 300 | 0.32 | 5 |
| 16 | Li et al. [60] | Column | 300 × 300 | 0.1, 0.3 | 6 |
Table 2.
Parameters of simulation cases.
Table 2.
Parameters of simulation cases.
| ID | Bays | Span (m) | Story Height (m) | Proportion of Corroded Components | Degree of Corrosion |
|---|
| F-1-0 to F-1-20 | 1 | 6 | 3.3 | 100.00% | 0%, 5%, 10%, 15%, 20% |
| F-2-0 to F-2-20 | 2 | 6 | 3.3 | 88.89% | 0%, 5%, 10%, 15%, 20% |
| F-3-0 to F-3-20 | 3 | 6 | 3.3 | 75.00% | 0%, 5%, 10%, 15%, 20% |
| F-4-0 to F-4-20 | 4 | 6 | 3.3 | 64.00% | 0%, 5%, 10%, 15%, 20% |
Table 3.
Parameters for corrosion simulation.
Table 3.
Parameters for corrosion simulation.
| Parameters | Value |
|---|
| X | 25 mm |
| D | 1 cm2∙year−1 |
| Ccr | 0.9 kg∙m−3 |
| w/c | 0.45 |
| D0 | 25 mm |
© 2020 by the authors. Licensee MDPI, Basel, Switzerland. This article is an open access article distributed under the terms and conditions of the Creative Commons Attribution (CC BY) license (http://creativecommons.org/licenses/by/4.0/).

 ,
, 


