Article

Underwater Optical Path Loss after Passage of a Tropical Storm

Naval Ocean Analysis and Prediction Laboratory, Department of Oceanography, Naval Postgraduate School, Monterey, CA 93943, USA
*
Author to whom correspondence should be addressed.
Appl. Sci. 2020, 10(14), 4777; https://doi.org/10.3390/app10144777
Submission received: 4 June 2020 / Revised: 4 July 2020 / Accepted: 6 July 2020 / Published: 11 July 2020
(This article belongs to the Section Marine Science and Engineering)

Abstract

:
Underwater wireless optical communications (UWOCs) have attracted considerable attention in recent years as an alternative means for acoustic communication. However, optical path loss of light propagation from attenuation is in large part due to absorption and scattering in various water conditions. Identification of environmental effects, especially tropical storms on underwater optical path loss, is key to the success of using optics for UWOCs. Underwater inherent optical properties (IOPs), such as the beam attenuation coefficient for 470 nm light in the western North Pacific Ocean, were measured from U.S. Naval Oceanographic Office Seagliders deployed after Super Typhoon Guchol’s (June 7–20, 2012) passage from June 25 to June 30, 2012 and without any typhoon passage from January 9 to February 28, 2014. The two observed sets (with and without the super typhoon) of IOPs are taken as input for a recently developed radiative transfer equation solver. The simulated normalized received powers for the two durations show a large impact of typhoon passage on UWOCs.

1. Introduction

Optical beam propagation is a challenge in underwater wireless optical communication (UWOC) due to scattering and absorption in complicated water bodies, varying from deep oceans to shallow water, limiting the propagation of the optical beam [1]. For example, dissolved mineral components, colored organic matter, and salts are found in clear ocean water. High concentrations of suspended particles and dissolved minerals are found in turbid harbors. Underwater turbulence is another challenge. The fluctuations in temperature, salinity, and density caused by atmospheric forces lead to huge fluctuations in the intensity of the signal at the receiver. Besides that, interference and dispersion must also be taken into account for UWOC problems. Underwater channel is much more complex in comparison to free space optics. Pure water has 1000 times the attenuation of clear air [2]. Therefore, one of the main challenges in UWOC channel modeling is to evaluate the overall underwater optical path loss under severe weather conditions.
Three types of communication links are available: line-of-sight, modulating retro reflector, and reflective [3]. The line-of-sight link is a straight and unobstructed path of communication between transmitter and receiver. The modulating retro reflector link has optical communication and other functions, such as programmable signage, using an optical retro reflector and an optical modulator. The reflective communication link has a transmitter to emit light upward towards the air–ocean interface with an inclination angle greater than the critical angle to ensure total internal reflection. The optical path loss from transmitter to receiver directly determines the quality of the line-of-sight link [4].
Tropical storms, especially typhoons and hurricanes, generate strong surface wind stress that enhances currents, waves, and turbulences, and in turn changes the absorption and scattering of the water and constituents within, such as particles of various origins including algal cells, detritus, sediments, plankton, and even bubbles near the surface, that cause significant optical path loss. Particle scattering, path radiance, and turbulence affected by the atmosphere are dominant factors in power reduction in UWOC [5]. Little attention has been paid to the effects of a typhoon’s or hurricane‘s passage on optical path loss, despite evidence suggesting that the strong winds significantly affect underwater inherent optical parameters (IOPs) such as the beam attenuation coefficient [6], and in turn the quality of UWOC [7]. This may be because tropical storms are not a typical phenomenon in the area where UWOC links are used. However, studying path loss after typhoon passage is useful for UWOC since we may want to know how many days we need to wait to use UWOC again. Investigation of optical path loss (directly affecting the line-of-sight link) after typhoon passage in comparison to that without typhoon passage shows the typhoon’s effect.
Recently, the effects of tropical storms on electro-optical identification (EOID) in the western North Pacific Ocean were investigated using the Navy‘s electro-optical detection simulator (EODES) with data collected by three Naval Oceanographic Office (NAVOCEANO) Seagliders. The beam attenuation coefficient c (470 nm) was measured from June 25 to June 30, 2012 after Super Typhoon Guchol’s passage and from January 6 to February 28, 2014 with no typhoon activity. As a U.S. Navy standard model, the EODES is used to identify the quality of optical detection. It simulates the propagation of a narrow, highly collimated beam of light (e.g., laser) by scattering and absorbing seawater where the IOPs vary in the direction of the beam axis, and provides tactical performance prediction for the laser line scanner (LLS) of several AQS-24a systems for mine countermeasures in the fleet with the use of four modules: utility, radiative transfer, EOID sensors and systems, and environmental state [6]. The simulated results show that Super Typhoon Gochul largely reduced the maximum detectable depth of EOID by about 15 m in comparison to without typhoon activity.
Because tropical storms affect UWOC only on the received power, a much simpler method than the EODES would be used. The differential-integral radiative transfer equation (RTE) is discretized into a set of algebraic equations. The classic Gauss–Seidel iterative method is used to solve the algebraic equations (called the RTE solver) and in turn to compute the received power [8]. Unlike uniform discretization of the angular space as in [9], an optimal non-uniform angular discretization scheme is used to consider the strong forward scattering characteristics of ocean waters. Since the optical path loss from transmitter to receiver directly affects the line-of-sight link, the optical path loss is calculated with and without typhoon passage using the RTE solver to identify a typhoon’s effect on the UWOC line-of-sight link.
The rest of the paper is organized as follows. Section 2 describes the selection of the typhoon influence area. Section 3 describes IOPs in the western Pacific Ocean observed by the NAVOCEANO Seagliders with and without typhoon passage. Section 4 depicts a two-dimensional RTE. Section 5 shows the impact of a typhoon’s passage on the optical path loss. Section 6 presents the conclusions.

2. Selection of Typhoon-Influenced Area

Typhoons hit the western North Pacific Ocean from early June to early December in 2012 and early March to early December in 2014 [10]. To study the typhoons’ effect on UWOC, ideally the IOP data should be collected from measurements that are taken at the same geographic location directly before and after a storm event since the influence of hydrography, land, and seasonal variability cannot be ignored. However, such a practice is difficult due to the basic features of tropical storms and the difficulty in IOP observation. Tropical storms typically form over large bodies of relatively warm water and span a large range of sizes, from 100 to 2000 km as measured by the radius of vanishing wind [10]. The average life of a hurricane, determined by time and place of origin and rate of forward movement, is nine days. The longest life cycle of a hurricane ever recorded was Tropical Cyclone Ginger, which lasted 31 days (September 5–October 5, 1971) [11].
To overcome such a difficulty, we chose a typhoon-influenced area with high ocean transparency and low seasonal variability. The Secchi disk depth (SDD) is a key index of water transparency. The satellite observations by the Sea-Viewing Wide Field-of-View Sensor (SeaWiFS) show the global climatological annual mean and absolute seasonal amplitude (maximum minus minimum) of SDD [12]. The area 124° E–134° E, 15° N–27° N is characterized as high transparency with low seasonal variability from Figure 2a,b [6].
In 2012, a tropical disturbance formed south-southeast of Pohnpei on June 7, and was upgraded to a tropical depression on June 10 in the area 124° E–134° E, 15° N–27° N. The system later intensified in favorable conditions, and reached typhoon intensity (i.e., Typhoon Guchol) on June 15. It reached super typhoon status on June 16–17, before making landfall over Japan as a typhoon on June 19 (Figure 1). Guchol brought heavy rain and strong winds in the Western Pacific Ocean near Japan on June 19 and 20. On the contrary, there was no typhoon activity in the Western Pacific Ocean from January 6 to February 28, 2014 [6]. The IOPs were measured from Seagliders of the NAVOCEANO during two different periods: (a) June 25–30, 2012, which is seven days after super Typhoon Guchol’s passage, and (b) January 9–February 28, 2014 with no typhoon activity.

3. IOPs with and without Typhoon Passage

A glider is a remote operator programmed to perform a series of downward and upward tracks while collecting various oceanographic parameter data using various installed sensor packages. It can position itself at the ocean surface with a 45° downward angle to present the antenna array skyward to facilitate two-way satellite communications. The NAVOCEANO Seaglider has the Seabird Electronics SBE 41 CP CTD sensor (hydrographic measurement) and WET Labs’ Beam Attenuation Meter (BAM) (optical measurement) [13]. The technical details about the BAM can be found in [14]. The Seaglider measures temperature, salinity, and beam attenuation coefficient (c) down to 100 m in depth. NAVOCEANO has routine quality control procedures on all raw observational data. Bad profiles were removed due to obviously erroneous locations, large spikes, and mismatches of characteristics with the surrounding profiles.
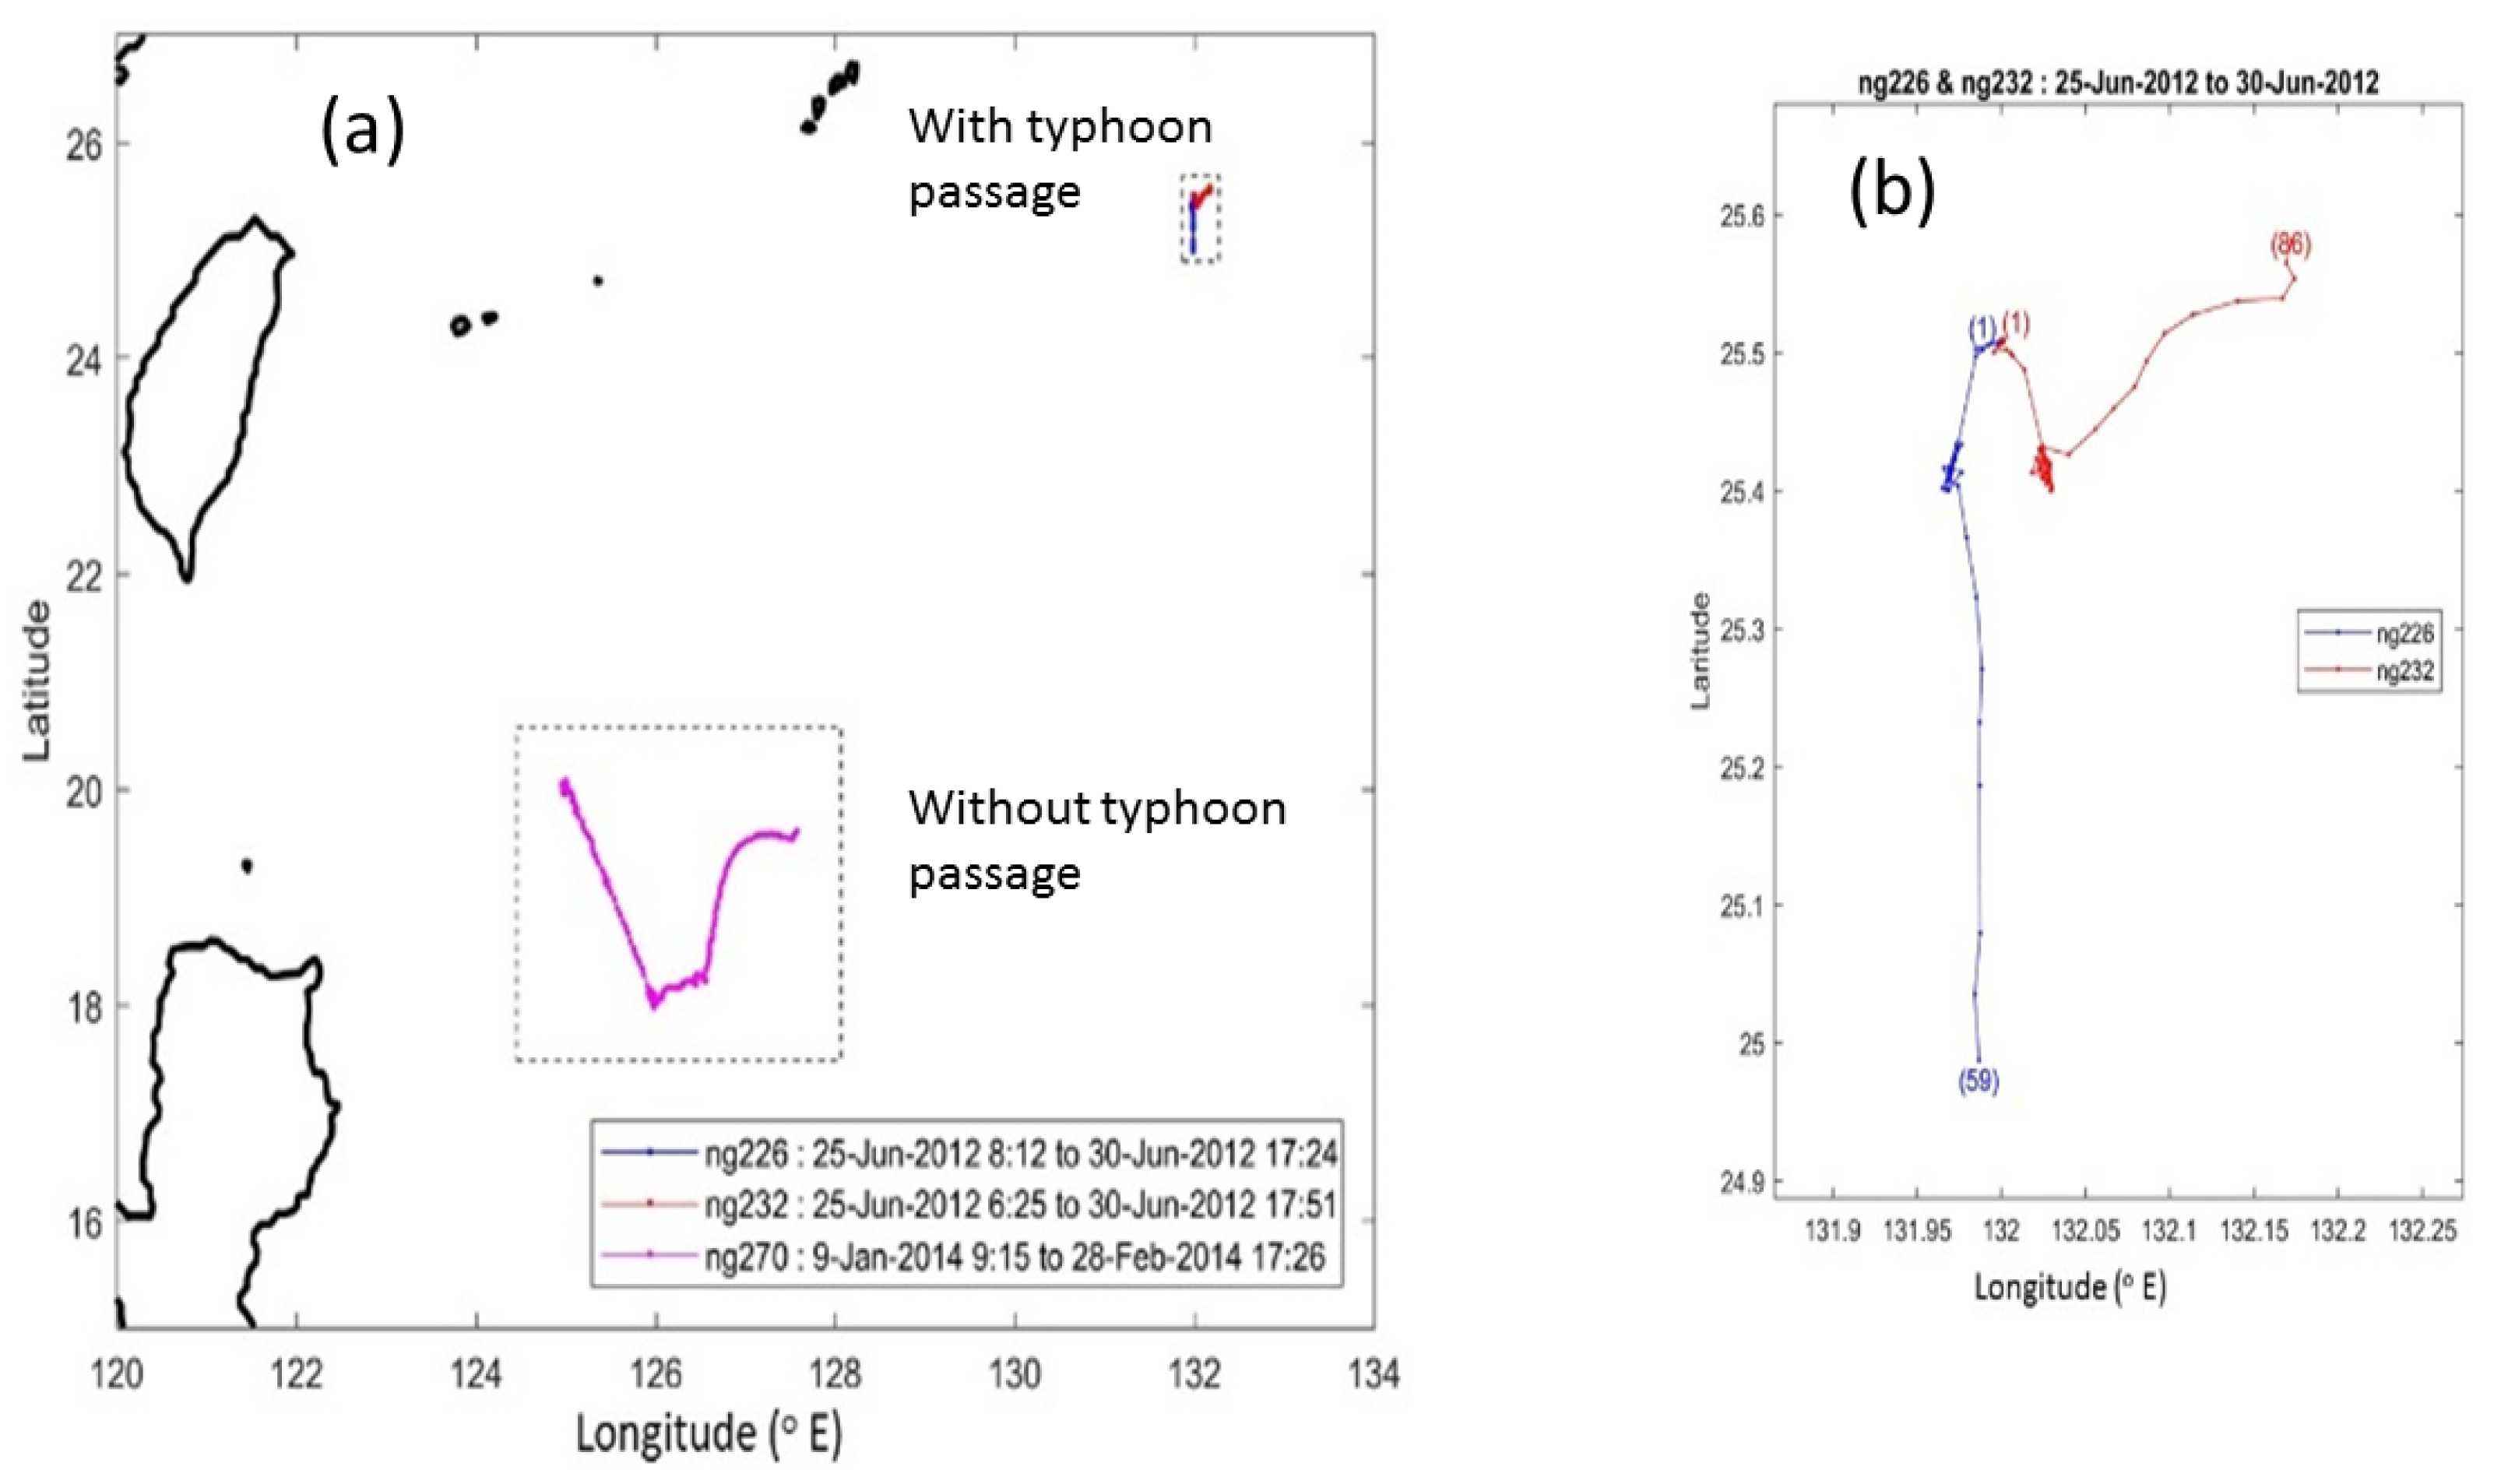
NAVOCEANO provided the profile data of three Seagliders inside the area 124° E–134° E, 15° N–27° N after quality control with high transparency and low seasonal variability. Among them, two Seagliders (NG226 and NG232) were in the area where Super Typhoon Guchol passed by seven days ago. The two Seagliders were deployed from a survey ship 15 min and 223 m apart: 03:19 UTC, June 25, 2012 at 25°30′20″ N, 131°59′51″ E for NG226 (blue trajectory in Figure 2a,b), and 03:34 UTC, June 25, 2012 at 25°30′27″ N, 131°59′55″ E for NG232 (red trajectory in Figure 2a,b). The two Seagliders took very different trajectories despite being very close (only 223 m apart) initially, with NG226 drifting southwestward and then southward and NG232 drifting southeastward and then northeastward. On June 30, 2012, NG226 was located at 24°59′27″ N, 131°59′26″ E at 17:24 UTC. However, NG232 was located at 25°34′50″ N, 132°10′20″ E at 17:51 UTC. Such strong bifurcation of ocean currents was generated in the wake of Super Typhoon Guchol. The third Seaglider (NG270) was underwater from January 6 to February 28, 2014 without any typhoon activities (magenta trajectory in Figure 2a). We used IOP data from the two Seagliders for comparison: NG226 with a typhoon and NG270 without a typhoon.
The beam attenuation coefficient c (470 nm), measured by NG226 (59 profiles) from June 25 to June 30, 2012 after Super Typhoon Guchol’s passage (See Figure 5a in [6].) is large with horizontally averaged values (red solid profiles) generally greater than 0.8 m−1. The beam attenuation coefficient c (470 nm) measured by NG270 (825 profiles) from January 6 to February 28, 2014 with no typhoon activity (see Figure 6 in [6]) is much smaller with horizontally averaged values less than 0.05 m−1.
The difference in c(z) between with and without typhoon passage is huge. During Super Typhoon Guchol’s passage, high winds generated strong upwelling in the upper ocean and pumped rich nutrients upward from the subsurface layer to the euphotic layer. This would induce the phytoplankton chlorophyll-a (Chl-a) to breed and grow rapidly. The Chl-a concentration (C) is directly related to the beam attenuation coefficient by a classic least-square fitted formula for the wavelength of 490 nm [15],
c ( z ) = c w ( z ) + 0.39 [ C ( z ) ] 0.57
where cw(z) is the beam attenuation coefficient for the pure water. If we assume that Equation (1) is also valid for the wavelength of 470 nm, the IOP measurements (Figures 5a and 6 in [6]) show an abundance of Chl-a after typhoon passage.

4. Two-Dimensional RTE

Different from [6], we used a simple algorithm to solve a two-dimensional RTE rather than a complete package, the U.S. Navy‘s electro-optical detection simulator (EODES) for optical detection, especially for tactical performance prediction of laser line scan sensors of several AQS-24a systems for mine countermeasures in the fleet. Here, we discretize the differential-integral RTE into a set of algebraic equations and use the classic Gauss–Seidel iteration to get numerical solutions.
Let the optical beam axis point face in the z-direction (i.e., the light propagation direction) with ρ the radial coordinate, n the unit vector representing the projection of direction of a light vector onto the transverse plane, and n’ the corresponding scattered direction. Let θ be the scattering angle between n and n’, i.e., n n = cos θ . Here, θ is the scattering angle. An asymmetry parameter g (ranging from 0 to 1) describes scattering types with g = 0 for dominating isotropic scattering and g near 1 for peaked scattering. The value of g is near 0.924 for sea water [16], which indicates the feasibility for underwater optical communication. Scattering and absorption are azimuthally symmetric when they are independent on the azimuthal angle. The phase function is [17]
β ( n , n ) = 1 g 2 2 π ( 1 + g 2 2 g cos θ )
for the azimuthally symmetric scattering. For the azimuthally symmetric scattering and absorption, the radiance, L ( r , n ) [Watts/(m2sr)], is independent on the azimuthal angle. Under the small-angle approximation and negligible temporal dispersion, the RTE is a differential-integral equation with the position vector r = (ρ, z), and the direction vector n being two-dimensional [18],
n L ( ρ , z , n ) = c L ( ρ , z , n ) + b 2 π β ( n , n ) L ( ρ , z , n ) d n + S ( ρ , z , n )
which has three independent variables, ρ , z, and θ . Since the observational beam attenuation coefficient is vertical (z) with a resolution of approximately 1 m, the position coordinates ( ρ , z) are discretized into (1 m × 1 m) grids:
ρ i = i Δ ρ , z j = j Δ z ,   Δ ρ = Δ z = 1   m .
The angular variable θ is discretized into K (=72) directions with an equal angle interval (5°),
θ k = k Δ θ , Δ θ = 5 o .
The differential-integral Equation (3) is discretized into a set of algebraic equations,
sin θ k L i , j , k L i 1 , j , k Δ ρ + cos θ k L i , j , k L i , j 1 , k Δ z + c j L i , j , k = b j k = 1 K w k , k L i , j , k + S i , j , k ,   b j = ω c j
where wk,k′ is the discretized phase function (2) and cj is the observed beam attenuation coefficient.
Note that conversion of the differential-integral RTE (3) into a set of algebraic equations (6) is the major difference between [6] and this research. Following [8] with the same discrete phase function wk,k′, the Gauss–Seidel iteration is used to solve the discrete two-dimensional (2D) RTE (6),
L i , j , k l + 1 = sin θ k Δ ρ L i 1 , j , k l + 1 + cos θ k Δ z L i , j 1 , k l + 1 + b j k = 1 K w k , k L i , j , k l + S i . j . k sin θ k / Δ ρ + cos θ k / Δ z + c j
where l is the iterative step. The iteration is repeated until the relative error norm is smaller than a predetermined termination value (10−4) [8]:
n L ( ρ , z , n ) = c L ( ρ , z , n ) + b 2 π β ( n , n ) L ( ρ , z , n ) d n + S ( ρ , z , n )
i j k [ L i , j , k l + 1 L i , j , k l ] 2 i j k [ L i , j , k l ] 2 < 10 4 .
Let R be the radius of the receiver aperture. The scattering is assumed to be symmetric in the azimuthal direction, which means that the radiance for any azimuthal angle on the same circle is the same. Therefore, the received power can be defined as lateral integration of the radiance at z [8]
P ( z ) = 2 π 0 R L ( z , ρ , θ ) ρ d θ d   ρ = m = 1 M A m [ k = 1 K L m + ( I 1 ) / 2 , J , k Δ θ k ]
where A1, A2, …, AM are the areas of the circular regions with θ from 0 to 2π, and ρ from 0 to Δρ/2 (A1), from Δρ/2 to 3Δρ/2 (A2), …, from Δρ/2 + (m − 2)Δρ to Δρ/2 + (m − 1)Δρ (Am), until m = M = Rρ, i.e.,
A 1 = π ( Δ ρ 2 ) 2 , A m = π [ Δ ρ 2 + ( m 1 ) Δ ρ ] 2 π [ Δ ρ 2 + ( m 2 ) Δ ρ ] 2 , m = 2 , 3 , , M .
The normalized received power
P n ( z j ) = P ( z j ) / P ( z 0 )
is used to represent the optical power loss. Here, z0 is the source of depth. Since we only have beam attenuation coefficient data, it is hard to conduct link budget and system analysis for optical communication. As a first step, we calculate the optical power loss using the RTE solver to identify indirectly the performance of the optical communication (line-of-sight) link.

5. Effect of Super Typhoon Guchol’s Passage

With the beam attenuation coefficient c(z) collected from the three NAVOCEANO Seagliders depicted in Section 3, the volume back scattering coefficient b(z) is calculated with a single scattering albedo, ω = b/c. The light albedo (ω) for light with a wavelength of 514 nm was calculated to be 0.241 for the clear ocean, 0.551 for the coastal ocean, and 0.833 for a turbid harbor. At 470 nm, ω would be higher and less variable because of lower absorption than at 514 nm [18]. Thus, the value of ω was selected as 0.75, an average between 0.60 (>0.551) and 0.90 (>0.833) for our study area (the western North Pacific). Between the two Seagliders, NG226 was under Super Typhoon Guchol‘s influence (see Figure 5a in [6]) and NG270 was not (see Figure 6 in [6]). We assumed that there was no natural optical source, i.e., S = 0. The same albedo was used for all cases. It seems likely that a storm event will change the composition of the scattering and absorbing water constituents and hence the albedo. We will study this issue in the near future.
In the simulation, the light propagation direction was assumed vertically downward in consistence with the IOP data. The following model parameters were adopted: zj was the same as the observational depth of the individual Seaglider‘s profile with Δz nearly 1 m and the source depth at the first observational point, the lateral step size Δρ = 0.01 m, the receiver aperture = 0.1 m, and K = 32. The Gauss–Seidel iteration (4) was used to solve the 2D RTE (3) with the observed beam attenuation coefficient c(zj) and the calculated volume back scattering coefficient b(zj) with a single albedo ω = 0.75 to obtain the radiance LI, j, k and, in turn, calculate the normalized received power Pn(z).
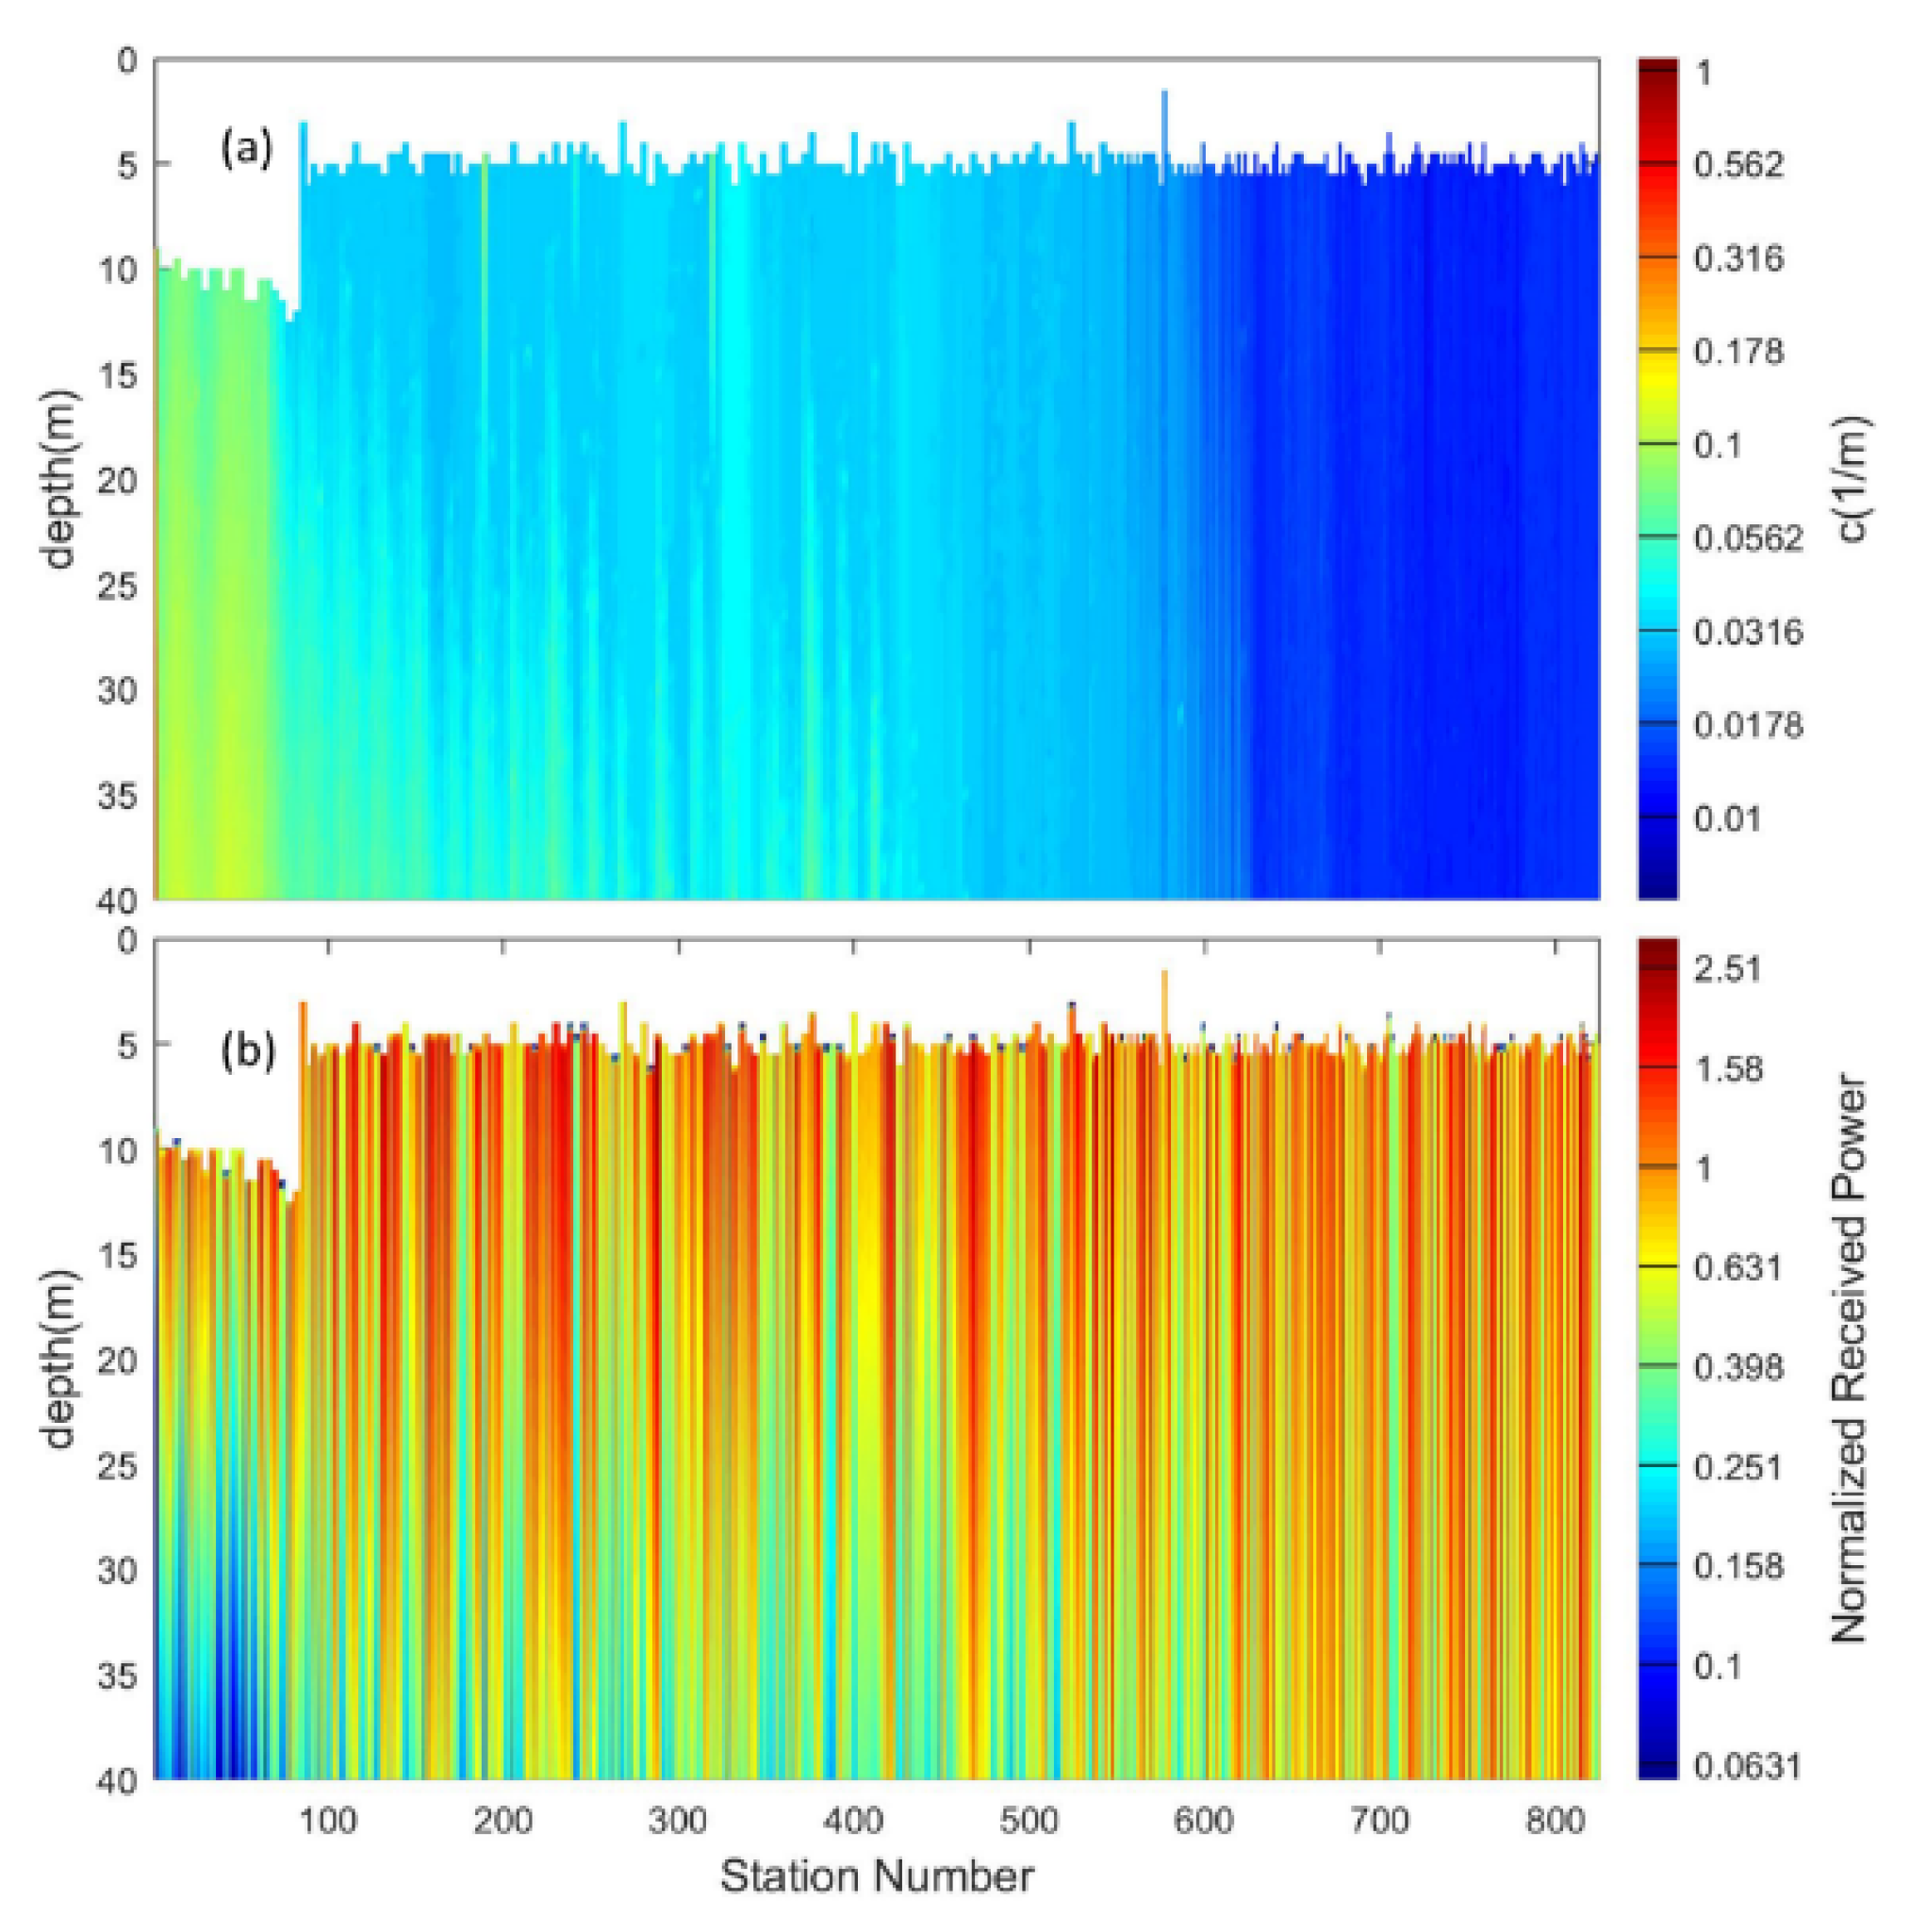
The cross sections of the beam attenuation coefficient c(z) from January 6 to February 28, 2014, without typhoon activity along the track of the NAVOCEANO Seaglider NG270 (Figure 3a), show small values c < 0.05 m−1. The corresponding normalized received power Pn(z) reduces slowly from 1 at the surface to 0.1–1 at 40 m (Figure 3b), which indicates the feasibility of using UWOC without strong events like typhoons. Usually, a UWOC link can be as long as 20 m. The minimum received optical power of −19 dBm is required to achieve a bit-error rate (BER) of 1.0 × 10⁻³ to establish a 9 m underwater optical channel at 1 Gbps [19].
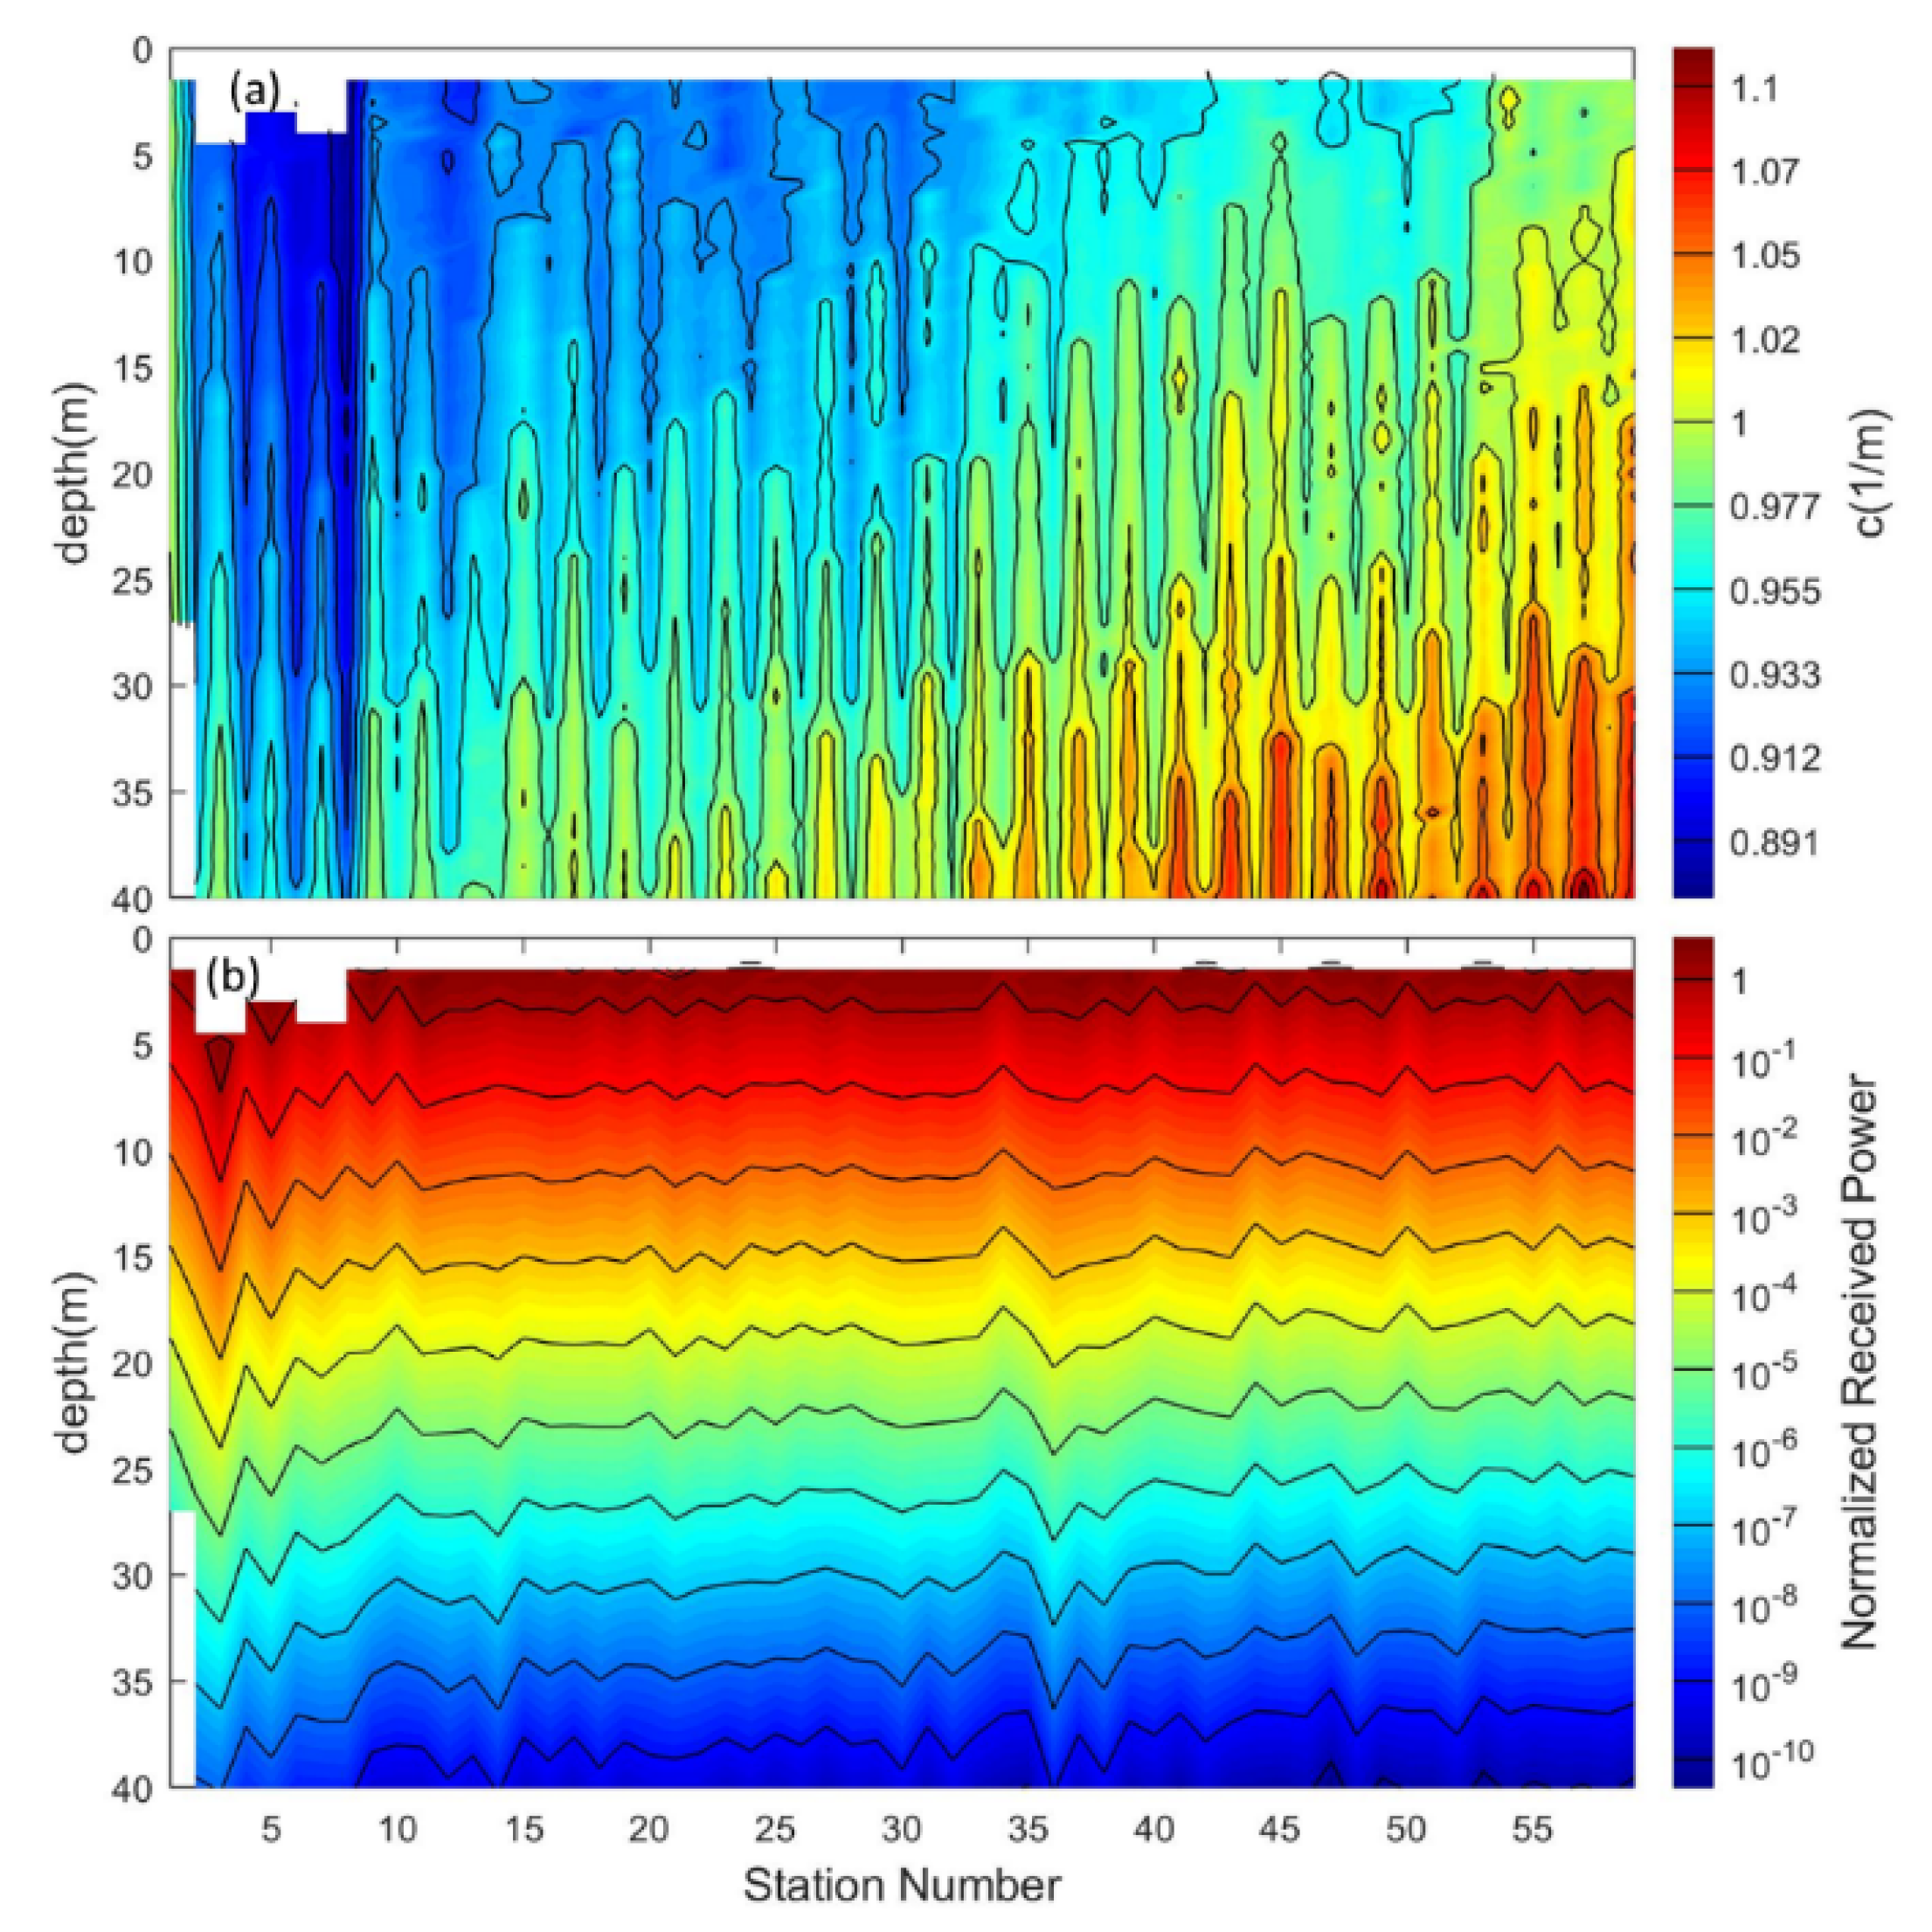
On the other hand, the cross section of the beam attenuation coefficient c(z) from January 25 to January 30, 2012, after Super Typhoon Guchol‘s passage along the tracks of the NAVOCEANO Seaglider NG226 (Figure 4a) shows large values c > 0.75 m−1. The corresponding normalized received power Pn(z) reduces rapidly from 1 at the surface to 10−10 at z = 40 m along NG226 (Figure 4b). This indicates that Super Typhoon Guchol caused huge path loss and made UWOC impossible even 7 to 13 days after passage.

6. Conclusions

This study identified the typhoon effects on UWOC in the western North Pacific Ocean by solving a 2D RTE numerically with the data collected by three NAVOCEANO Seagliders. The beam attenuation coefficient c (470 nm) was measured from June 25 to June 30, 2012 after Super Typhoon Guchol’s passage and from January 6 to February 28, 2014 with no typhoon activity. A huge difference was found in the horizontally averaged c, greater than 0.8 m−1 during Typhoon Guchol‘s passage and with much smaller values, less than 0.05 m−1, without typhoon activity. The volume back scattering coefficient b(z) was calculated from the observed beam attenuation coefficient c(z) with a single scattering albedo ω = 0.75. The 2D Henyey-Greenstein (H-G) phase function was used for the azimuthally symmetric and strong forward scattering with g = 0.924. After discretization in position and direction, the 2D RTE becomes a set of algebraic equations. The Gauss–Seidel iteration was used to solve the 2D RTE and in turn to calculate the normalized received power using observed IOPs from the NAVOCEANO Seagliders with and without the influence of a typhoon. The simulated results show that Super Typhoon Gochul destroyed the UWOC due to the rapid reduction of normalized power from 1 at the surface to 10−1 (practically 0) at z = 40 m, in comparison to 1.0 to 0.1 at z = 40 m without typhoon passage.
The results only show the strong typhoon effect through comparison between NG226 and NG270 during two periods: June 25–30, 2012 and January 6–February 28, 2014. These two short durations are not enough to conclude and affirm the feasibility of using UWOC in the western North Pacific Ocean without typhoon passage because it is well known that the IOPs of the underwater channel can be easily affected by phenomena such as wind, surface waves, optical turbulences, and water currents. Furthermore, the actual UWOC analysis is thin here since developing a full communication system model is beyond the scope of the current effort. The communication link performance has not been evaluated due to the limited amount of available data. It will be investigated in future studies using a more complete dataset and UWOC link models.

Author Contributions

Conceptualization, P.C.C.; methodology, P.C.C.; software, C.F.; validation, C.F.; formal analysis, P.C.C.; investigation, C.F.; resources, P.C.C.; data curation, C.F.; writing—original draft preparation, P.C.C.; writing—review and editing, P.C.C.; visualization, C.F.; supervision, P.C.C.; project administration, P.C.C.; funding acquisition, P.C.C. All authors have read and agreed to the published version of the manuscript.

Funding

This research was funded by the Office of Naval Research.

Acknowledgments

We thank the Naval Oceanographic Office for the use of optical data from three Seagliders.

Conflicts of Interest

The authors declare no conflicts of interest.

References

  1. Smith, R.C.; Baker, K.S. Optical properties of the clearest natural waters (200800 nm). Appl. Opt. 1981, 20, 177–184. [Google Scholar] [CrossRef] [PubMed]
  2. Lanbo, L.; Shengli, Z.; Jun-Hong, C. Prospects and problems of wireless communication for underwater sensor networks. Wireless Commun. Mobile Comput. 2008, 8, 977–994. [Google Scholar] [CrossRef]
  3. Kaushal, H.; Kaddoum, G. Underwater optical wireless communication. IEEE Access 2016. [Google Scholar] [CrossRef]
  4. Choudhary, A.; Jagadeesh, V.K. PMuthuchidambaranathan, Pathloss Analysis of NLOS underwater Wireless Optical Communication Channel. In Proceedings of the International Conference on Electronics and Communication Systems, Marseille, France, 13–14 February 2014; pp. 1–4. [Google Scholar] [CrossRef]
  5. Hou, W.; Jarosz, E.; Woods, S.; Goode, W.; Weidemann, A. Impacts of underwater turbulence on acoustical and optical signals and their linkage. Opt. Exp. 2013, 21, 4367–4375. [Google Scholar] [CrossRef] [PubMed]
  6. Chu, P.C.; Fan, C.W. Underwater optical detection after passage of tropical storm. J. Appl. Remote Sens. 2019, 13, 047502. [Google Scholar] [CrossRef]
  7. Chu, P.C.; Breshears, B.F.; Cullen, A.J.; Hammerer, R.F.; Martinez, R.P.; Phung, T.Q.; Margolina, T.; Fan, C.W. Environmental effects on underwater optical transmission. In Ocean Sensing and Monitoring IX; Weilin, H., Robert, A.A., Eds.; SPIE: Anaheim, CA, USA, 2017; Volume 10186. [Google Scholar] [CrossRef]
  8. Li, C.; Park, K.-H. On the use of a direct radiative transfer equation solver for path loss calculation in underwater optical wireless channels. IEEE Wireless Commun. Lett. 2015, 4, 561–564. [Google Scholar] [CrossRef] [Green Version]
  9. Gao, H.; Zhao, H. A fast-forward solver of radiative transfer equation. Transp. Theory Statist. Phys. 2009, 38, 149–192. [Google Scholar] [CrossRef]
  10. Wikipedia, Tropical Cyclone. 2019. Available online: https://en.wikipedia.org/wiki/Tropical_cyclone (accessed on 2 May 2020).
  11. University of Rhode Island, Hurricanes, Science and Society. 2019. Available online: http://hurricanescience.org/science/science/hurricanelifecycle/ (accessed on 2 May 2020).
  12. He, X.; Pan, D.; Bai, Y.; Wang, T.; Chen, C.A.; Zhu, Q.; Hao, Z.; Gong, F. Recent changes of global ocean transparency observed by SeaWiFS. Cont. Shelf Res. 2017, 143, 159–166. [Google Scholar] [CrossRef]
  13. Mahoney, K.L.; Grembowicz, K.; Bricker, B.; Crossland, S.; Bryant, D.; Torres, M. RIMPAC 08: Naval Oceanographic Office glider operations. In Proceedings of the SPIE Defense and Security; SPIE: Orlando, FL, USA, 2009. [Google Scholar] [CrossRef]
  14. Garaba, S.; Joshi, I.; Zaneveld, R. Technical Report on Wetlabs AC-S absorption and Beam Attenuation Meter. Technical Report. Maine Insitu Sound and Color Lab, The University of Maine, 2013; pp. 1–14. Available online: ftp://misclab.umeoce.maine.edu/users/optics/classFTP2013/Final_Projects/GroupSIA/Dummies_Intro_ACS_SG.pdf (accessed on 15 April 2020).
  15. Voss, K.J. A spectral model of the beam attenuation coefficient in the ocean and coastal waters. Limnol. Oceangr. 1992, 37, 501–509. [Google Scholar] [CrossRef] [Green Version]
  16. Gabriel, M.; Khalighi, A.; Bourennane, S.; Léon, P.; Rigaud, V. Monte-Carlo-based channel characterization for underwater optical communication systems. J. Opt. Commun. Netw. 2013, 5, 1–12. [Google Scholar] [CrossRef] [Green Version]
  17. Henyey, L.G.; Greenstein, J.L. Diffuse radiation in the galaxy. Astrophys. J. 1941, 93, 70–83. [Google Scholar] [CrossRef]
  18. Mobley, C. Ocean Optics Web Book. 2016. Available online: http://www.oceanopticsbook.info/ (accessed on 15 April 2020).
  19. Shen, C.; Guo, Y.; Oubei, H.M.; Ng, T.K.; Liu, G.; Park, K.-H.; Ho, K.-T.; Alouini, M.-S.; Ooi, B.S. 20-meter underwater wireless optical communication link with 1.5 Gbps data rate. Opt. Express 2016, 24, 25502–25509. [Google Scholar] [CrossRef] [PubMed]
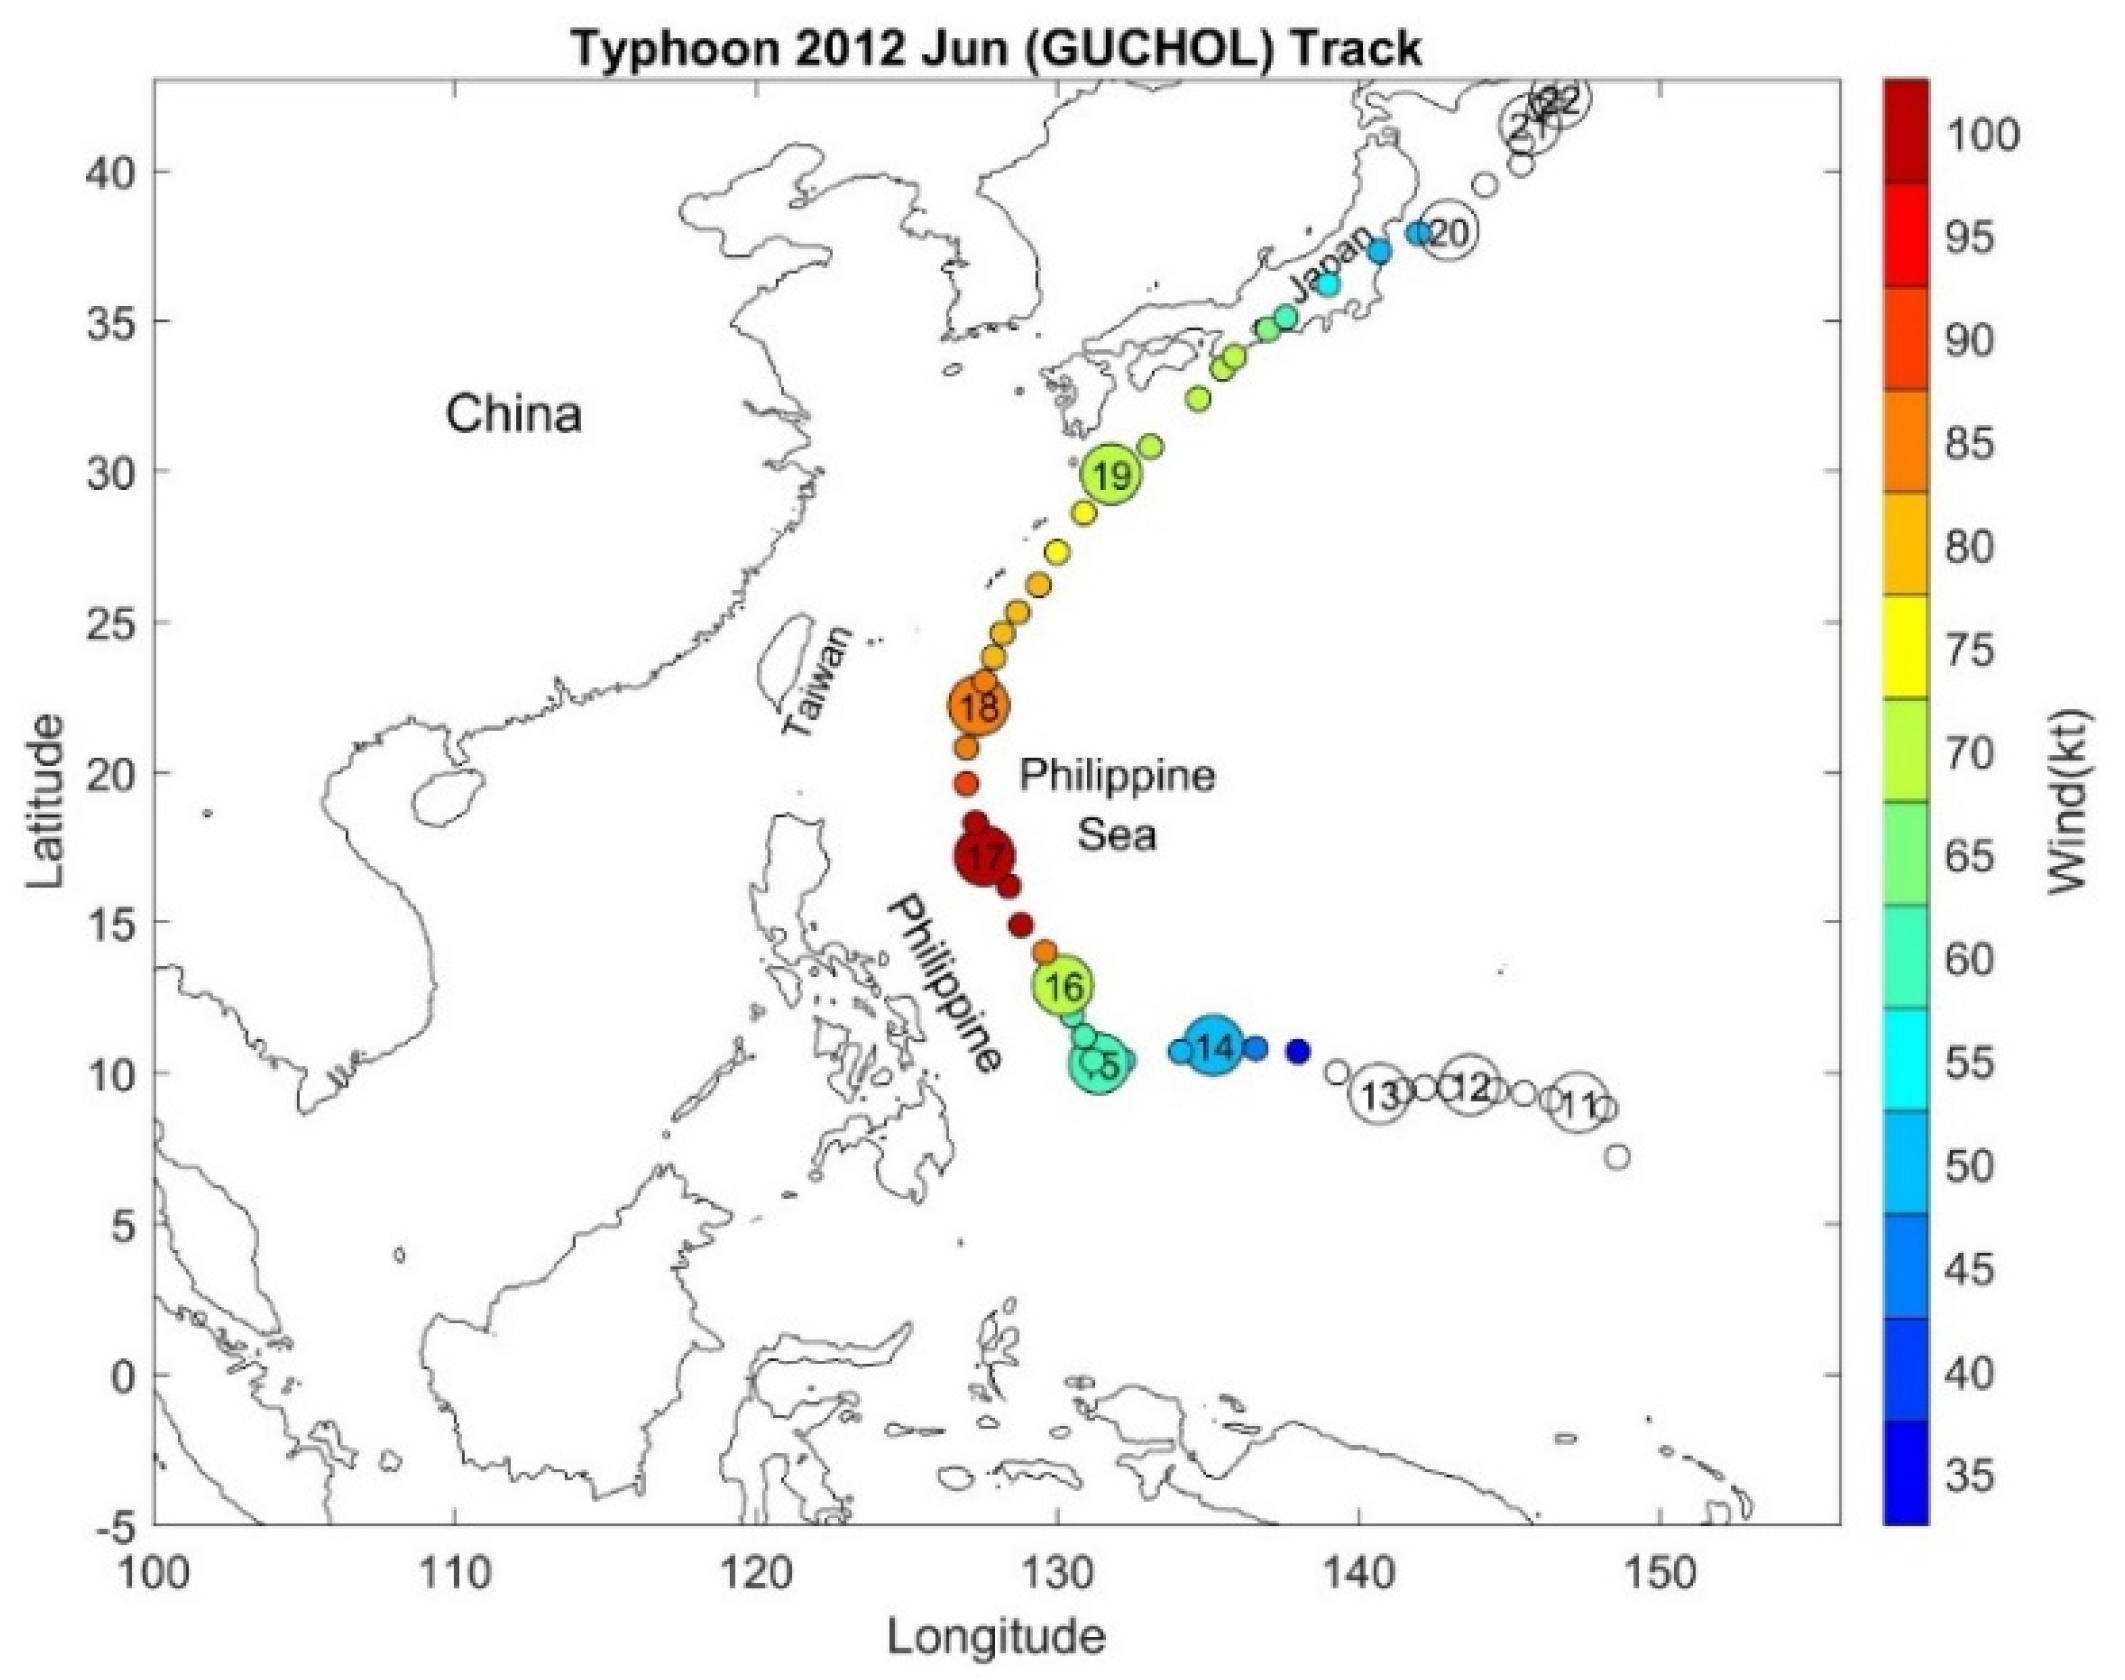
Figure 1. Geography of the Western Pacific Ocean and track of Super Typhoon Guchol (2012) with strength.
Applsci 10 04777 g001
Figure 2. Tracks of (a) Naval Oceanographic Office (NAVOCEANO) Seagliders NG270 from January 9 to February 28, 2014 (red) without typhoon activity, as well as a zoomed-in view of tracks of the Seagliders (NG226, NG232) from January 25 to January 30, 2012 (blue) after Super Typhoon Guchol‘s passage, and (b) a zoomed-in view of NG226 and NG232.
Applsci 10 04777 g002
Figure 3. (a) Cross section of the observed volume attenuation coefficient c(z) along the tracks of NAVOCEANO Seaglider NG270 from January 6 to February 28, 2014 (red) without typhoon activity, and (b) the calculated normalized received power Pn(z). The horizontal axis shows the glider’s location along the magenta-colored track in Figure 2a with Station-1 located at 19°36′32″ N, 124°58′56″ E at 05:01 UTC, January 9, 2014 and Station-825 at 19°59′27″ N, 127°34′05″ E at 17:26 UTC, February 28, 2014. Note that there was no typhoon passing by during that period.
Applsci 10 04777 g003
Figure 4. (a) Cross section of the observed volume attenuation coefficient c(z) along the tracks of NAVOCEANO Seaglider NG226 from January 25 to January 30, 2012, after Super Typhoon Guchol’s passage, and (b) the calculated normalized received power Pn(z). The horizontal axis shows the glider’s location along the blue-colored track in Figure 2b with Station-1 located at 25°30′20″ N, 131°59′51″ E at 03:19 UTC, June 25, 2012, and Station-59 at 24°59′27″ N, 131°59′26″ E at 17:24 UTC, June 30, 2012. It is noted that Super Typhoon Guchol moved out of the area on June 18, 2012.
Applsci 10 04777 g004