Article

Depth of Interaction Estimation in a Preclinical PET Scanner Equipped with Monolithic Crystals Coupled to SiPMs Using a Deep Neural Network

by
Amirhossein Sanaat
1 and
Habib Zaidi
1,2,3,4,*
1
Division of Nuclear Medicine and Molecular Imaging, Geneva University Hospital, CH-1211 Geneva, Switzerland
2
Geneva University Neurocenter, Geneva University, 1205 Geneva, Switzerland
3
Department of Nuclear Medicine and Molecular Imaging, University of Groningen, University Medical Center Groningen, 9700 RB Groningen, The Netherlands
4
Department of Nuclear Medicine, University of Southern Denmark, DK-500 Odense, Denmark
*
Author to whom correspondence should be addressed.
Appl. Sci. 2020, 10(14), 4753; https://doi.org/10.3390/app10144753
Submission received: 6 June 2020 / Revised: 6 July 2020 / Accepted: 8 July 2020 / Published: 10 July 2020
(This article belongs to the Special Issue PET Imaging with Deep Learning)

Abstract

:
The scintillation light distribution produced by photodetectors in positron emission tomography (PET) provides the depth of interaction (DOI) information required for high-resolution imaging. The goal of positioning techniques is to reverse the photodetector signal’s pattern map to the coordinates of the incident photon energy position. By considering the DOI information, monolithic crystals offer good spatial, energy, and timing resolution along with high sensitivity. In this work, a supervised deep neural network was used for the approximation of DOI and to assess through Monte Carlo (MC) simulations the performance on a small-animal PET scanner consisting of ten 50 × 50 × 10 mm3 continuous Lutetium-Yttrium Oxyorthosilicate doped with Cerium (LYSO: Ce) crystals and 12 × 12 silicon photomultiplier (SiPM) arrays. The scintillation position was predicted by a multilayer perceptron neural network with 256 units and 4 layers whose inputs were the number of fired pixels on the SiPM plane and the total deposited energy. A GEANT4 MC code was used to generate training and test datasets by altering the photons’ incident position, energy, and direction, as well as readout of the photodetector output. The calculated spatial resolutions in the X-Y plane and along the Z-axis were 0.96 and 1.02 mm, respectively. Our results demonstrated that using a multilayer perceptron (MLP)-based positioning algorithm in the detector modules, constituting the PET scanner, enhances the spatial resolution by approximately 18% while the absolute sensitivity remains constant. The proposed algorithm proved its ability to predict the DOI for depth under 7 mm with an error below 8.7%.

Graphical Abstract

1. Introduction

Each pair of annihilation photons detected by a positron emission tomography (PET) scanner is assigned to a line-of-response (LOR) linking the two scintillation crystals recording the coincidence event. In practice, the localization of the positron-electron interaction point assumes that both annihilation photons are absorbed by the two detector elements. However, in reality, the LORs are commonly replaced with volumes-of-response (VOR), including almost all virtual LORs owing to positioning uncertainty. Reducing a VOR to a LOR has been among the objectives of the PET imaging community for a few decades. For accurate estimation of a LOR, the coordinates of both coincidence photons inside the monolithic crystals should be accurately defined. One of the most important features of monolithic crystals coupled to position-sensitive photodetectors, including avalanche photodetectors (APDs) and silicon photomultipliers (SiPMs) is the extraction of 3D position information [1,2]. Providing the DOI information or the third dimension of the scintillation position improves the spatial resolution by decreasing the parallax error at the corners of the detectors. Accurate determination of the 3D position is crucial in small-bore PET scanners, including preclinical and organ-specific PET scanners dedicated to brain, prostate, and female breast imaging [3,4].
In recent years, a number of commercial preclinical PET scanners using advanced analytical positioning methods were designed and fabricated. The Bruker Albira is a multipurpose preclinical PET scanner equipped with monolithic crystals and multi-anode photomultiplier tubes. The achieved radial and axial spatial resolutions were 1.72 and 2.45 mm, respectively, whereas the maximum absolute sensitivity was 5.3% [5]. The MOLECUBES β-CUBE is a commercial small-animal PET scanner that was designed using a monolithic Lutetium-Yttrium Oxyorthosilicate doped with Cerium (LYSO: Ce) crystal with 8 mm thickness attached to 3 mm × 3 mm Silicon photomultipliers. The spatial resolution and absolute sensitivity of this scanner are 1 mm and 12.4%, respectively, at the center of the field-of-view (FOV) [6].
A model was fitted to the optical photons distribution to estimate the 3D scintillation event’s position inside the monolithic crystal. For each interaction position, the maximum likelihood was estimated based on the optical photon distribution map as a successfully implemented option following training [7]. Another study presented a mathematical framework based on the distribution of pixel intensity values and the attenuation and stopping power of the scintillation material [8]. In this approach, the DOI was estimated as the ratio of the photon’s deposited energy to the maximum local intensity. Besides the analytical techniques based on pure mathematical approaches, a body of literature is accumulating on the use of machine learning, particularly deep neural networks (DNNs) to create a lookup table built by irradiating the scintillator crystal side [9].
Recently, Wang et al. introduced an artificial neural network for extracting the 3D interaction position of the scintillation point inside the crystal [10]. Another group devised a technique that reduces the nonlinear dimensionality to predict the features of the detector response [11]. The DOI estimation in monolithic scintillators faces several challenges, including a computational burden and complicated calibration. Among the above-mentioned approaches, the Gradient Tree Boosting algorithm showed the best performance for extracting the scintillation position in continuous crystals, enabling a spatial resolution of 2.12 mm to be achieved [12]. More recently, Hashimoto et al. used deep neural networks for 3D interaction position estimation for Cherenkov-based detectors through Monte Carlo (MC) simulations [13].
The core inspiration of the current work is to present a new positioning technique based on a deep learning algorithm aimed at achieving an enhanced spatial resolution while maintaining the high sensitivity of monolithic crystals. Previous studies using different deep learning approaches suffer from the lack of comprehensive evaluation and are limited to the assessment of a single detector module. Our work evaluates the proposed positioning algorithm in whole PET scanner geometry to demonstrate the advantages of DOI estimation (especially at the corners of the FOV). Furthermore, our work provides an assessment of an image quality phantom for a realistic evaluation of the overall impact of the positioning algorithm. This study focused on proposing and evaluating a technique for the 3D approximation of the scintillation position in continuous crystals using a supervised DNN and MC simulations. Most nonlinear interaction processes taking place during the scintillation process are accounted in detailed MC simulations. In addition, a DNN was implemented, owing to its capability in modeling complex nonlinear functions. Furthermore, the impact of the DOI information on the overall performance of a small-animal PET scanner was evaluated. Furthermore, we evaluated and compared the feasibility of machine learning for 3D position estimation based on multilayer perceptron (MLP) architecture inside the monolithic crystal compared to Anger positioning logic.

2. Materials and Methods

2.1. Geometrical Configuration of Preclinical PET Scanner

PET scanners with the high-spatial resolution are able to resolve two-point/line sources that are very close to each other and can depict small structures. The motivation behind this study lies in the usage of deep learning for scintillation positioning in a preclinical PET scanner with monolithic scintillation crystals readout by SiPMs. Monolithic scintillator-based detectors, having comparatively higher detection efficiency compared to pixelated crystals, are used to maintain/boost the absolute sensitivity, whereas machine learning-based positioning is utilized to retain/enhance the spatial resolution of the detector/scanner. To assess the potential of machine learning in event positioning, two small-animal PET scanners were simulated with two different positioning approaches (conventional Anger login and MLP). For further experimental validation, the number of detector modules and geometrical configuration were similar to the Xtrim preclinical PET scanner recently designed and developed in our lab [14,15].

2.1.1. Preclinical PET Detector Blocks

To assess the feasibility of the proposed method, we evaluated and compared MLP and Anger logic positioning schemes on a single detector module of the Xtrim PET scanner using realistic MC simulations. In the standard setup, we modelled a detector module consisting of a 10 mm thick continuous LYSO scintillator with an entrance area of 50.2 × 50.2 mm2 coupled with a SiPM array with 12 × 12 pixels and a 4.2 mm pixel pitch (Sensl ArrayC-30035-144P-PCB). To decrease photon leakage outside the crystal, a sheet of Barium sulfate (BaSO4) with 0.1 mm thickness was warped around the crystal. For the optical coupling of the scintillator and SiPMs surface, a layer of glue with a thickness of 0.05 mm was used.

2.1.2. Preclinical PET Scanner Configuration

To assess and compare the performance of the developed positioning algorithm in a small-animal PET scanner, both Anger logic and MLP were applied to the output (list mode) data during image reconstruction.

2.2. Monte Carlo Simulations

One of the most important aspects of our study, having a direct impact on the results, is the extraction of the distribution of optical photons. To this end, accurate tracking and modelling of scintillation photon interactions (e.g., reflection, refraction, and absorption), considering all phenomena taking place within the scintillator in our MC simulations, is a prerequisite. To accomplish this goal, the GEANT4 code (version 4.10.2) [16] was used for MC simulations of a single detector module and a complete preclinical PET scanner.
The interaction of scintillation photons at the boundaries of two materials that had different optical properties was precisely modelled based on Snell’s law using the well-established UNIFIED model of GEANT4 [17]. The required GEANT4 libraries for electron interactions, ionization photons, and optical photon interactions were added to the simulation physics list [18,19]. Further details about the validation process are provided in [20,21].

2.3. Image Reconstruction

For each scintillation event taking place, the number of optical photons collected by each of the SiPM pixels was stored. Hence, for each scintillation, we have 144 lines in our main root file where each line is labelled with the pixel’s number, and the number in each line represents the summation of optical photons collected by that pixel. The energy and time window of the simulated PET scanner were set at 150–650 keV and 4 ns, respectively, according to our experimental setup. The origin of the scintillation events in the monolithic crystal was estimated using Anger logic and MLP positioning methods using in-house code written in C++ computer code. A LOR was connected to two scintillation points and recorded based on their angle and distance from the central axes of the scanner. The recorded LORs were projected in the projection space followed by image reconstruction using the ordered subsets version of Green’s maximum a posteriori one step late (OSMAPOSL) algorithm implemented within the Software for Tomographic Image Reconstruction (STIR) package (5 iterations and 4 subsets) [22].

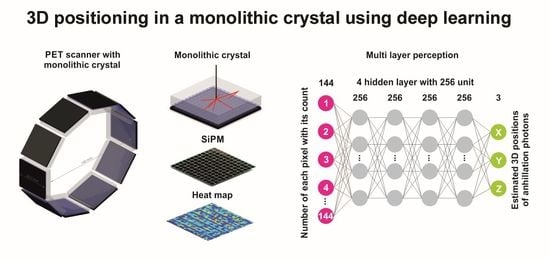
2.4. Neural Network Architecture

MLP was implemented as a DNN model for a prediction of the scintillation position within the monolithic crystal (Figure 1). To select appropriate hidden layers/units, we varied the number manually and determined the best combination. Lastly, 4 hidden layers and 256 hidden units were carefully chosen based on the minimum position resolution. In the training phase, data of approximately 5 × 10⁶ scintillation points—including the number of SiPM pixels (from 1 to 144) activated by scintillation photons, the weight of each pixel (the total number of optical photons absorbed by a certain pixel) and the accurate 3D position of the scintillation point within the crystal’s volume—were determined through MC simulations as reference. The DNN model was trained to synthesize the 3D position of the scintillation event from the map of optical photon distribution. For this work, a rectified linear unit (ReLU) was used as an activation function and the 144 SiPM’s pixel weights were converted into 4 hidden layers and 256 units. The number of epochs was set to 150 and Adam’s optimizer, with a weight decay of 10−4, was implemented for regularization and optimization purposes.
To obtain the 3D position (X, Y, Z)estimated, the final hidden layer is transformed into 3 outputs. For the testing phase, 106 new interaction data (unseen by the model) were fed into the model. The mean square error (MSE) was considered as a loss function. Both training and testing were carried out on a graphics processing unit (NVIDIA Quadra K5200 with 8 GB of memory).

2.5. Validation and Performance Evaluation

The validation of our proposed detector/scanner simulation and image reconstruction algorithm was performed through comparison with the experimental measurements acquired on the Xtrim preclinical PET scanner. The details of the validation procedure were described in previous studies [20,21,23]. Table 1 summarizes the technical features of the simulated Xtrim-PET. Performance evaluation of the proposed model was assessed using the National Electrical Manufacturers Association (NEMA) NU4-2008 standard for animal PET scanners [24]. Due to the high computational burden associated with optical photon transport simulations in the GEANT4 toolkit when evaluating count rate performance, we focused on assessing essential performance parameters, including spatial resolution, absolute sensitivity, and image quality for both Anger logic and MLP positioning techniques.

2.5.1. Spatial Resolution

To calculate the spatial resolution, the point spread function (PSF) of the optical photon distribution corresponding to a single detector module and a whole PET scanner was evaluated at separate positions based on the NEMA NU 4-2008 standard. The spatial resolution for two positioning methods (Anger logic and MLP) was calculated using a 22Na point source (148 kBq activity and 1 mm diameter). To calculate the spatial resolution for a detector module, the point source was kept at a distance equivalent to the radius of the scanner ring (84 mm) from a single detector module’s surface and was displaced with a 5 mm step size in the X and Y directions in a plane parallel to the detector block. The spatial resolution of the whole scanner was estimated by relocating the above-mentioned point source from the center to the edge of the field-of-view (FOV) in the radial and axial directions with the same step size to survey the impact of the parallax error. A Gaussian function was fitted onto the intensity profile of the point source and the full width at half-maximum (FWHM) was estimated.

2.5.2. Sensitivity

Although the absolute sensitivity is completely independent of the positioning methods investigated in this study, this parameter was assessed for the sake of completeness. To this end, we calculated the sensitivity by moving the 22Na point source (180 kBq) from one side to the other of the scanner’s axial FOV with 5 mm step size and for an acquisition time of 10 min.

2.5.3. Image Quality

Image quality was evaluated through simulations of two phantoms. First a planar grid of sources containing three 4 × 4 arrays of spheres filled with 22Na embedded within a tank of water. The diameters of the spheres were set to 0.75, 1.0, and 1.25 mm (corresponding center-to-center distances were 1.5, 2.0, and 2.5 mm). Second, a cylindrical phantom (50 mm length and 30 mm diameter) was simulated to evaluate Anger Logic and MLP positioning algorithms.

3. Results

3.1. Validation

There was good agreement between the experimental measurements performed on the Xtrim PET scanner and the simulated results in terms of spatial resolution and sensitivity. The discrepancy between the measured and real absolute sensitivity did not exceed 8% while the spatial resolution at the center of FOV (CFOV) reached a maximum error of 5%. The validation procedure is provided in detail in [23].

3.2. Quantitative Analysis

For a single preclinical PET detector module, the radial spatial resolution was estimated using Anger logic and MLP as positioning algorithms (Figure 2). The difference between the two algorithms is substantial for an animal-PET scanner with near sub-millimetric spatial resolution.
Figure 3a shows histograms in the XY plane of the estimation error Xreal-Xestimate whereas Figure 3b illustrates histograms of the Z-axis (DOI) estimation error Zreal-Zestimate from the validation dataset. On the XY plane, the histograms obtained using the MLP approach are almost similar to those obtained using Anger logic. In contrast, along the Z-axis, the MLP histogram is more symmetric in pick neighborhoods (still asymmetric in tails), different from the Anger histogram, depicting a visible difference between the proposed and conventional method.
The scanner’s spatial resolution based on Anger and MLP positioning algorithms should be measured at the center and at one-quarter of the axial transverse distance according to the NEMA NU-4 standard. Supplementary measurements were performed along the axial and radial directions with a step size of 5 mm (Figure 4). The calculated radial spatial resolution based on Anger logic varied between 1.5 mm and 2.4 mm (FWHM) while the MLP algorithm led to a radial spatial resolution that varied between 1.21 mm and 1.75 mm (FWHM).
The absolute sensitivity of the preclinical PET scanner is independent of the positioning algorithm (Figure 5). The sensitivity was estimated across the axial FOV using the default energy window (150–650 keV). The estimated DOI’s FWHM as a function of the scintillation point at depths of 2, 4, 6, 8, and 10 mm were reported in Table 2. The advantage of the MLP algorithm is more evident, relative to Anger logic, in distinguishing details in the Z-axis. The predicted depths (Z) of scintillations taking place on a detector module, and their corresponding bias and standard deviation (STD), were summarized in Table 3. A scintillation point source was placed at 10 positions (depths) and then displaced with a 1 mm step size from the surface of the SiPM to the entrance surface of the detector. The results showed that the error and STDs increase by increasing Z (getting close to the SiPM’s surface). When the distance from the SiPMs’ surface increases, the change in the optical photon distribution map on the photodetector surface leads to a decline in the model’s accuracy for the estimation of DOI.
Figure 6 illustrates reconstructed slices of the image quality phantom based on the NEMA NU-4 standard produced by the MLP and Anger logic positioning methods during reconstruction. Figure 7 and Figure 8 illustrate images of the grids along with horizontal intensity profiles drawn on images of the spherical sources for the MLP and Anger logic positioning methods, respectively.

4. Discussion

Enhancing the spatial resolution and sensitivity in both preclinical and clinical PET scanners is one of the key motivations driving research in PET instrumentation in academia and industry. A high spatial resolution and sensitivity are among the most important performance parameters in preclinical PET imaging. A higher absolute sensitivity enables a reduction in the scanning time and the injected activity. Furthermore, higher intrinsic spatial resolution leads to the detection of smaller structures and reduces quantification bias by decreasing the partial volume effect. In this work, we proposed a novel, deep learning-based technique for the positioning of scintillation events inside of a monolithic scintillator from the optical photons’ distribution map. A monolithic crystal is proposed to boost the absolute sensitivity while the MLP method used to compensate for the loss of spatial resolution caused using some regular positioning methods, like Anger logic, is based on a simple center of gravity method. This new PET detector module exploiting the MLP positioning method aims to achieve an optimal trade-off between detection efficiency and spatial resolution.
For a single detector module using the MLP positioning algorithm, the spatial resolution (FWHM) varies from 0.78 mm at the center to 1.15 mm at the edge of the detector. Conversely, the FWHM for a detector module using Anger logic positioning varies between 0.96 mm and 1.6 mm. A possible explanation of the improved spatial resolution by MLP is the capability of deep learning to extract various types of feature maps from an optical photon distribution map that leads to a better positioning accuracy relative to Anger logic, which is based on a simple center of mass calculation algorithm according to the weight of the SiPM pixels.
The results proved that the sensitivity is independent from the positioning algorithm because it only plays a role in the treatment of optical photons and not annihilation photons. A recent study reporting on a Cherenkov-based detector used deep learning for event positioning achieved a FWHM of 1.54 mm and 1.59 mm in the XY plane and Z-axis, respectively [13]. The Jagiellonian-PET (J-PET) is the sole whole-body PET scanner based on a monolithic crystal, an axial FOV of 1 m, a spatial resolution of approximately 3 mm, and a sensitivity of 14.9 cps/kBq at the CFOV [25]. The main purpose of this work is not to introduce a new preclinical-PET scanner with similar or better performance than the state-of-the-art commercial scanners, but rather to assess the impact of a deep learning-assisted positioning algorithm in terms of an improvement in the spatial resolution of a preclinical PET scanner equipped with a monolithic scintillation crystal without degrading the sensitivity through a minor modification of the image acquisition software.
An important aspect of the proposed preclinical-PET scanner, equipped with MLP positioning, is the way the distribution of scintillation photons reaching the SiPMs can be utilized to gain data about the scintillation position in the crystal. This is the incentive motivating the evaluation of the characteristics of photon transport. The map of optical photon distributions provides a clue about the distance of the scintillation event from the SiPM surface, confirming that the width of the distribution of optical photons is linked to the depth of interaction that can be utilized to approximate the DOI. The DOI resolution for the detector module positioning with Anger logic and MLP algorithms varied from 0.66 mm and 0.42 mm at 2 mm from the SiPM’s surface and increased to 1.38 and 1.02 mm for larger distances (10 mm), respectively. For scintillations taking place close to the SiPM’s surface, a small number of SiPM pixels are fired and the width of the distribution map is small. However, by moving to a larger distance, a higher number of SiPM pixels are involved in positioning, thus leading to the degradation of the DOI spatial resolution. MLP overestimated the DOI, which could be recovered by adding a constant coefficient to shift the pick of the normalized histogram of the estimation error in the Z-axis towards zero. The reason for this overestimation is reflected in Table 3, where a positive bias is observed for depths between 0 and 8 mm. When applying the Anger logic for the DOI prediction, few outliers with high bias (more than 6 mm) were observed but not reported in Figure 3b.
The qualitative assessment demonstrated the potential advantages of high-resolution imaging using a preclinical PET scanner equipped with the proposed MLP algorithm. Specifically, 1.25 mm and 1 mm diameter spheres are discernible from their neighbors on both scanners, whereas the 0.75 mm diameter sphere appears to be discernible only on the scanner running the MLP positioning algorithm (Figure 7 and Figure 8). Note that the visual assessment is supported by the intensity profiles drawn on the images.
MLP enhances the spatial resolution while avoiding image blurring compared to the Anger logic method without a DOI estimation. The enhancement near the corners of the crystal’s sides and the scanner’s FOV is more evident. The spatial resolution was calculated through imaging point sources, followed by fitting a Gaussian function on the image profiles of each point source. This work inherently bears a number of limitations. The MC simulations did not consider all of the physical factors involved in real life, including cross-talk, dark noise, after pulsing and photon detection efficiency. The 3D positioning facilitates the calculation of the difference between the position of the scintillation event and photon detection by SiPMs. Taking into account the path crossed by the annihilation photons inside the crystal improves the coincidence time resolution. Accurate estimation of time-of-flight information from the variance in path length among the scintillation origin position and the annihilation origin position in each of the coincident detectors is an avenue that needs to be explored.

5. Conclusions

This work demonstrated the feasibility of extracting the 3D position information of an annihilation photon’s interaction point within a monolithic scintillator using a DNN. MC simulations proved that our proposed technique can improve the spatial resolution compared to traditional analytical positioning techniques, such as Anger logic and methods based on the center of mass.

Author Contributions

Guarantors of integrity of entire study, H.Z.; study concepts/study design or data acquisition or data analysis/interpretation, manuscript drafting or manuscript revision for important intellectual content, A.S. and H.Z.; approval of final version of submitted manuscript, all authors; agree to ensure any questions related to the work are appropriately resolved, A.S. and H.Z.; literature research, A.S and H.Z.; statistical analysis, A.S., and manuscript editing, A.S and H.Z. All authors have read and agreed to the published version of the manuscript.

Funding

This research was funded by the Swiss National Science Foundation under grant number SNFN 320030-176052 and the Eurostars programme of the European commission under grant number E! 114,021 ProVision.

Conflicts of Interest

The authors declare no conflict of interest.

References

  1. Qi, J.; Leahy, R.M. Iterative reconstruction techniques in emission computed tomography. Phys. Med. Biol. 2006, 51, R541. [Google Scholar] [CrossRef]
  2. Reader, A.J.; Zaidi, H. Advances in PET image reconstruction. PET Clin. 2007, 2, 173–190. [Google Scholar] [CrossRef]
  3. Zaidi, H. Molecular Imaging of Small Animals: Instrumentation and Applications; Springer: Berlin, Germany, 2014. [Google Scholar]
  4. Stolin, A.V.; Martone, P.F.; Jaliparthi, G.; Raylman, R.R. Preclinical positron emission tomography scanner based on a monolithic annulus of scintillator: Initial design study. J. Med. Imaging 2017, 4, 011007. [Google Scholar] [CrossRef] [PubMed] [Green Version]
  5. Pajak, M.Z.; Volgyes, D.; Pimlott, S.L.; Salvador, C.C.; Asensi, A.S.; McKeown, C.; Waldeck, J.; Anderson, K.I. NEMA NU4-2008 performance evaluation of Albira: A two-ring small-animal PET system using continuous LYSO crystals. Open Med. J. 2016, 3, 12–26. [Google Scholar] [CrossRef]
  6. Krishnamoorthy, S.; Blankemeyer, E.; Mollet, P.; Surti, S.; Van Holen, R.; Karp, J.S. Performance evaluation of the MOLECUBES β-CUBE—A high spatial resolution and high sensitivity small animal PET scanner utilizing monolithic LYSO scintillation detectors. Phys. Med. Biol. 2018, 63, 155013. [Google Scholar] [CrossRef] [PubMed]
  7. Lee, M.S.; Lee, J.S. Depth-of-interaction measurement in a single-layer crystal array with a single-ended readout using digital silicon photomultiplier. Phys. Med. Biol. 2015, 60, 6495. [Google Scholar] [CrossRef] [PubMed]
  8. González-Montoro, A.; Sánchez, F.; Martí, R.; Hernández, L.; Aguilar, A.; Barberá, J.; Catret, J.V.; Cañizares, G.; Conde, P.; Lamprou, E. Detector block performance based on a monolithic LYSO crystal using a novel signal multiplexing method. Nucl. Instrum. Methods Phys. Res. Sect. A Accel. Spectrom. Detect. Assoc. Equip. 2018, 912, 372–377. [Google Scholar] [CrossRef]
  9. Borghi, G.; Peet, B.J.; Tabacchini, V.; Schaart, D.R. A 32 mm × 32 mm × 22 mm monolithic LYSO: Ce detector with dual-sided digital photon counter readout for ultrahigh-performance TOF-PET and TOF-PET/MRI. Phys. Med. Biol. 2016, 61, 4929. [Google Scholar] [CrossRef] [PubMed]
  10. Wang, Y.; Zhu, W.; Cheng, X.; Li, D. 3D position estimation using an artificial neural network for a continuous scintillator PET detector. Phys. Med. Biol. 2013, 58, 1375. [Google Scholar] [CrossRef]
  11. Müller, F.; Schug, D.; Hallen, P.; Grahe, J.; Schulz, V. Gradient tree boosting-based positioning method for monolithic scintillator crystals in positron emission tomography. IEEE Trans. Radiat. Plasma Med. Sci. 2018, 2, 411–421. [Google Scholar] [CrossRef]
  12. Müller, F.; Schug, D.; Hallen, P.; Grahe, J.; Schulz, V. A novel DOI positioning algorithm for monolithic scintillator crystals in PET based on gradient tree boosting. IEEE Trans. Radiat. Plasma Med. Sci. 2018, 3, 465–474. [Google Scholar] [CrossRef] [Green Version]
  13. Hashimoto, F.; Ote, K.; Ota, R.; Hasegawa, T. A feasibility study on 3D interaction position estimation using deep neural network in Cherenkov-based detector: A Monte Carlo simulation study. Biomed. Phys. Eng. Express 2019, 5, 035001. [Google Scholar] [CrossRef]
  14. Sajedi, S.; Zeraatkar, N.; Taheri, M.; Kaviani, S.; Khanmohammadi, H.; Sarkar, S.; Sabet, H.; Ay, M.R. Development and preliminary results of Xtrim-PET, a modular cost-effective preclinical scanner. Nucl. Instr. Meth. A. 2019, 940, 288–295. [Google Scholar] [CrossRef]
  15. Amirrashedi, M.; Sarkar, S.; Ghafarian, P.; Shahraki, R.H.; Geramifar, P.; Zaidi, H.; Ay, M.R. NEMA NU-4 2008 performance evaluation of Xtrim-PET: A prototype SiPM-based preclinical scanner. Med. Phys. 2019, 46, 4816–4825. [Google Scholar] [CrossRef]
  16. Agostinelli, S.; Allison, J.; Amako, K.; Apostolakis, J.; Araujo, H.; Arce, P.; Asai, M.; Axen, D.; Banerjee, S.; Barrand, G.U. GEANT4—A simulation toolkit. Nucl. Instrum. Meth. A 2003, 506, 250–303. [Google Scholar] [CrossRef] [Green Version]
  17. Nayar, S.K.; Ikeuchi, K.; Kanade, T. Surface reflection: Physical and geometrical perspectives. IEEE Trans. Pattern Anal. Mach. Intell. 1991, 13, 611–634. [Google Scholar] [CrossRef] [Green Version]
  18. Allison, J.; Amako, K.; Apostolakis, J.; Araujo, H.; Arce Dubois, P.; Asai, M.; Barrand, G.; Capra, R.; Chauvie, S.; Chytracek, R.; et al. Geant4 developments and applications. IEEE Trans. Nucl. Sci. 2006, 53, 270–278. [Google Scholar] [CrossRef] [Green Version]
  19. Allison, J.; Amako, K.; Apostolakis, J.; Arce, P.; Asai, M.; Aso, T.; Bagli, E.; Bagulya, A.; Banerjee, S.; Barrand, G.; et al. Recent developments in Geant4. Nucl. Instr. Meth. A 2016, 835, 186–225. [Google Scholar] [CrossRef]
  20. Sanaat, A.; Arabi, H.; Ay, M.; Zaidi, H. Novel preclinical PET geometrical concept using a monolithic scintillator crystal offering concurrent enhancement in spatial resolution and detection sensitivity: A simulation study. Phys. Med. Biol. 2020, 65, 045013. [Google Scholar] [CrossRef]
  21. Sanaat, A.; Zaidi, H. Accurate estimation of depth of interaction in PET on monolithic crystal coupled to SiPMs using deep convolutional neural network and Monte Carlo simulations. In Proceedings of the IEEE Nuclear Science Symposium and Medical Imaging Conference (NSS/MIC), Manchester, UK, 26 October–2 November 2019; p. M-06-119. [Google Scholar]
  22. Thielemans, K.; Tsoumpas, C.; Mustafovic, S.; Beisel, T.; Aguiar, P.; Dikaios, N.; Jacobson, M.W. STIR: Software for tomographic image reconstruction release 2. Phys. Med. Biol. 2012, 57, 867–883. [Google Scholar] [CrossRef] [Green Version]
  23. Sanaat, A.; Zafarghandi, M.S.; Ay, M.R. Design and performance evaluation of high resolution small animal PET scanner based on monolithic crystal: A simulation study. J. Instrum. 2019, 14, P01005. [Google Scholar] [CrossRef]
  24. National Electrical Manufacturers Association. NEMA Standards Publication NU 4-2008. Performance Measurements of Small Animal Positron Emission Tomographs; National Electrical Manufacturers Association: Rosslyn, VA, USA, 2008. [Google Scholar]
  25. Moskal, P.; Niedźwiecki, S.; Bednarski, T.; Czerwiński, E.; Kubicz, E.; Moskal, I.; Pawlik-Niedźwiecka, M.; Sharma, N.; Silarski, M.; Zieliński, M. Test of a single module of the J-PET scanner based on plastic scintillators. Nucl. Instrum. Methods Phys. Res. Sect. A Accel. Spectrom. Detect. Assoc. Equip. 2014, 764, 317–321. [Google Scholar] [CrossRef] [Green Version]
Figure 1. The network architecture and schematic diagram of the model used in this work.
Applsci 10 04753 g001
Figure 2. Spatial resolution of one detector module for a point source at six distances from the center of the crystal along the radial direction.
Applsci 10 04753 g002
Figure 3. The normalized histograms of the estimation error along (a) XY plane and (b) Z-axis (DOI) from the validation dataset.
Applsci 10 04753 g003
Figure 4. (a) Radial and (b) axial spatial resolutions of the PET scanner for a point source at five distances from the center of the Z-axis calculated using the National Electrical Manufacturers Association (NEMA) NU-4 protocol.
Applsci 10 04753 g004
Figure 5. Absolute sensitivity measured at different distances from the center of the field-of-view (FOV) along the Z-axis for the simulated PET scanner.
Applsci 10 04753 g005
Figure 6. Representative slices through the image quality phantom produced for a PET scanner using: (a) Anger positioning logic and (b) MLP algorithm.
Applsci 10 04753 g006
Figure 7. (a) Planar images and (b) line profiles of a grid containing 16 spherical sources with different diameters (from left to right: 1.25, 1 and 0.75 mm) and distances (from left to right: 2.5, 2, and 1.5 mm) for detector modules using the MLP positioning algorithm.
Applsci 10 04753 g007
Figure 8. (a) Planar images and (b) line profiles of a grid containing 16 spherical sources with different diameters (from left to right: 1.25, 1 and 0.75 mm) and distances (from left to right: 2.5, 2, and 1.5 mm) for detector modules using the Anger logic positioning algorithm.
Applsci 10 04753 g008
Table 1. Physical characteristics and dimensions of the preclinical positron emission tomography (PET) scanner used for the validation of GEANT4 Monte Carlo simulations.
ParameterValue
Number of block rings1
Detector blocks per ring10
Scintillator materialLYSO
Crystals per block24 × 24 = 576
Axial FOV50 mm
Transaxial FOV100 mm
Number of image planes109
Coincidence time window4.0 ns
Energy window150–650 keV
Energy resolution11.7%
Detector block entrance area50 × 50 mm2
Crystal size (thickness)2 × 2 × 10 mm3
Detector ring diameter168 mm
PhotodetectorSiPM
Array size12 × 12
Pixel pitch4.2 mm
Light guide size50 × 50 × 3 mm3
Reflector materialBaSO4
Thickness0.1 mm
Table 2. Depth of interaction resolution for one detector module based on Anger logic and multilayer perceptron (MLP) positioning algorithms. The depth of interaction (DOI) estimation based on Anger logic was calculated virtually by considering two perpendicular virtual silicon photomultipliers (SiPMs) at the two side faces of the monolithic crystal.
Depth (mm)Anger (mm)MLP (mm)
20.660.42
40.790.53
60.980.75
81.20.91
101.381.02
Table 3. Predicted Z by MLP for different depths of a monolithic detector module. The scintillation point was located at different Z positions as reference. At each depth, we estimated 10,000 scintillation Z positions.
Reference Z 12345678910
Predicted Z1.02.03.14.35.36.47.68.68.58.6
STD0.30.30.40.60.61.21.61.71.71.7
Bias (%)3.8−1.72.56.46.76.88.77.6−5.8−14.3

