Article

Fracture Properties of Concrete in Dry Environments with Different Curing Temperatures

1
School of Highway, Chang’an University, Xi’an 710064, China
2
State Key Laboratory of Hydroscience and Engineering, Tsinghua University, Beijing 100084, China
3
China Three Gorges Projects Development Co., Ltd., Chengdu 610017, China
*
Author to whom correspondence should be addressed.
Appl. Sci. 2020, 10(14), 4734; https://doi.org/10.3390/app10144734
Submission received: 12 June 2020 / Revised: 3 July 2020 / Accepted: 7 July 2020 / Published: 9 July 2020
(This article belongs to the Special Issue Mechanical Properties of Materials)

Abstract

:
This paper investigated the fracture properties of concrete in dry environments with different curing temperatures (5, 20, 40, and 60 °C). For each curing condition, the key fracture parameters of concrete were tested using wedge splitting specimens at five different ages (3, 7, 14, 28, and 60 d). The results show that in dry environments, the effective fracture toughness and fracture energy of concrete exposed to elevated temperatures increased at a relatively high growth rate at an early age. Nevertheless, the growth speed of effective fracture toughness and fracture energy decreased more quickly at elevated temperatures in the later stages. As a result, the concrete cured at higher temperature exhibited lower ultimate values of fracture parameters, and vice-versa. Namely, a temperature crossover effect was found in the effective fracture toughness and fracture energy of concrete under dry environments. Considering the early growth rate and ultimate values of fracture parameters, the optimum temperature suitable for concrete fracture properties development under dry condition was around 40 °C.

1. Introduction

Concrete is used in a wide variety of structures, which are usually exposed to changing temperature and moisture content. The development of concrete mechanical and physical characteristics is significantly affected by the curing conditions. Harsh environmental conditions not only make the on-site casting and quality control process difficult but also accelerate setting, promote uneven distribution, reduce the later-age strength, increase the likelihood of cracking both before and after hardening and deteriorate the durability [1,2,3,4,5]. In order to construct the concrete structures in extreme weather conditions (such as extremely hot and dry conditions, cool and damp conditions), we must pay high attention to the concrete deterioration caused by harsh climate.
As we all know, the temperature is a very important factor that affects the concrete properties, and extensive studies have been conducted thus far; but the majority of those studies were related to the influence of temperature on concrete mechanical parameters, such as compressive strength [6], flexural-tensile strength [7], splitting-tensile strength [8], and Young’s elastic modulus [9]. In general, temperature has a double effect on the development of concrete mechanical parameters. A higher curing temperature can significantly promote the development of concrete elastic modulus and strength in the early stages, but it also decreases the ultimate values of elastic modulus and strength. This behavior is called the temperature inversion phenomenon or temperature crossover effect [10]. Furthermore, apart from the Young’s elastic modulus and strength, the elevated curing temperature will also deteriorate the microstructure and durability of concrete. For example, Sharp et al. [11] found that the microstructures of concrete exposed to 60 °C exhibited larger apparent porosity than those exposed to 10 °C after one year, which was a significant reason that the concrete cured at 60 °C exhibited the lower ultimate strengths. Jiang et al. [12] demonstrated that with the increasing of curing temperature, the autogenous shrinkage of concrete increases, and the cracking resistance of concrete becomes worse. Especially, under high-temperatures curing conditions, the resistance to chloride irons permeability was weakened [13]; further, after prolonged exposure, the concrete exposed to higher temperature showed anomalous expansion and accompanied by micro-cracks, leading to a serious deterioration of the concrete structure durability [14].
The humidity is another important environmental factor affecting the concrete properties, and the concrete is usually placed at reduced humidity in engineering practice, resulting in that the free water inside the concrete evaporates into the surrounding at lower humidity. An insufficient moisture supply owing to this evaporation and diffusion not merely worsens the hydration reaction and microstructure of concrete but also drastically deteriorates the mechanical and fracture properties [15]. For example, Flatt et al. [16] theoretically proved that C3S stop hydrating when the internal relative humidity is less than 80%. Sagrario et al. [17] noticed that as the curing humidity decreases, the length of the chemical reaction chain forming the C-S-H gel increases, leading to a lower degree of hydration. Nawa et al. [18] reported that the strength at 60% relative humidity was 41% smaller than that in water after 7 d. Clearly, mechanical and physical properties of concrete measured under saturation conditions are larger than that of concrete under the realistic circumstance, and the influence of ambient humidity should be taken as seriously as that of temperature.
The fracture characteristics of concrete can dramatically affect the structural response of concrete members in the harsh environment, and the influence of ambient temperature and humidity on the fundamental fracture parameters of concrete should be studied. This is useful for a comprehensive understanding of the fracture properties of concrete exposed to realistic conditions, which is the key premise for assessing crack stability and predicting concrete structure failure based on fracture mechanics. However, so far, less information is available regarding the influence of environmental conditions on fracture properties of concrete, and some of the conclusions are contradictory. For instance, Buyukozturk et al. [19] clarified that due to the action of the pore water pressure inside the specimen, the fracture energy of concrete increases with reducing moisture. Mi et al. [20] observed that the value of fracture energy of concrete under dry conditions was smaller than that under saturated curing conditions. Besides, Yu et al. [21] obtained fracture energy gain data for concrete exposed to 14, 23, and 35 °C, and they clarified that concrete fracture energy improved dramatically with increasing temperature. Unfortunately, they did not investigate the fracture energy of concrete after 20 d. Analogously, Li et al. [22] observed that the fracture energy of full-graded concrete cast in hot weather was larger than that of concrete cast in cold weather from 28 d to 180 d. From the above results, it can be seen that fracture energy of concrete increased with increasing curing temperature. Conversely, Huang [23] clarified that the fracture energy of concrete stored at elevated temperature in summer was much smaller than that at 20 °C after 56 d, and the former was only half of the latter. This indicated that the elevated temperature deteriorated the fracture properties of concrete in later ages, which was in line with the results observed by Mi et al. [24]. Further, Mechtcherine [25] demonstrated that concrete fracture energy was less dependent on the temperature from 2 °C to 50 °C. It is clear that there is no consensus concerning the effect of ambient conditions on concrete fracture properties. What’s more, there are very litter or no studies explaining the influence of temperature and humidity coupling on the fracture properties of concrete.
Therefore, the current paper presents the investigation of the fracture characteristics of concrete in dry environments with different curing temperatures. The fracture properties of concrete including fracture toughness and fracture energy were measured under a constant relative humidity of 50% with four different temperatures. The information about the fracture properties of concrete under hot-dry (or cold-dry) environments was not available in previous publications. The experimental data is helpful for a deeper and comprehensive understanding of the fracture properties of concrete under extreme climate environment, which can greatly enhance the numerical simulation of cracking behavior of concrete members in harsh environments and promote the development of cracking design specifications for concrete structures.

2. Experimental Program

2.1. Materials and Mix Proportions

The cement employed was Portland cement with the grade of P.I 42.5 satisfying the specifications of ASTM C150. The bulk density of cement equals 1450 kg∙m−3. The fly ash accounted for 25% of the cementitious materials, which is mainly for saving cement and reducing the heat of hydration. The chemical composition of cementitious materials was measured using XRD, and the results were given in Table 1. The coarse aggregate was crushed basalt, physical properties and gradation of which met the specifications of ASTM C33/C33M. The fine aggregate used was natural river sand, and its fineness modulus was 2.52. Further, the sand accounted for 39% of the total aggregate by weight, and this proportion remained unchanged. After comprehensively considering the fluidity and strength, the effective water to binder ratio of 0.4 and a 468 kg∙m−3 cementitious content was selected. The concrete mix proportions were 1:0.40:1.50:2.34 (cementitious:water:sand:gravel). The slump of the concrete is 85 mm. Moreover, an external vibrator was utilized for concrete compaction.
It is noted that before mixing, all the mixture constituents for concrete were reserved in the chambers with humidity and temperature previously set at 50% and 20 °C for not less than one day to ensure all the specimens having the same initial condition.

2.2. Curing Condition

In this study, the temperatures used were 5 °C, 20 °C, 40 °C, and 60 °C, corresponding to cold, normal, hot, and extremely hot weather, respectively. As for the curing humidity, it was set at 50% RH (relative humidity) for each temperature. The temperature and humidity during curing were controlled automatically using specialized equipment, and the control accuracy of temperature and relative humidity was ±2 °C and ±2% RH, respectively. Five test ages were designed for each curing condition, and three replicates fracture samples were poured for each age. The experimental data were evaluated and analyzed using averages of three identical samples. However, it should be emphasized that for a given variable, if the value of a specimen deviated from the average by more than 10%, then an additional specimen was conducted to improve the credibility of the results.

2.3. Specimen Preparation
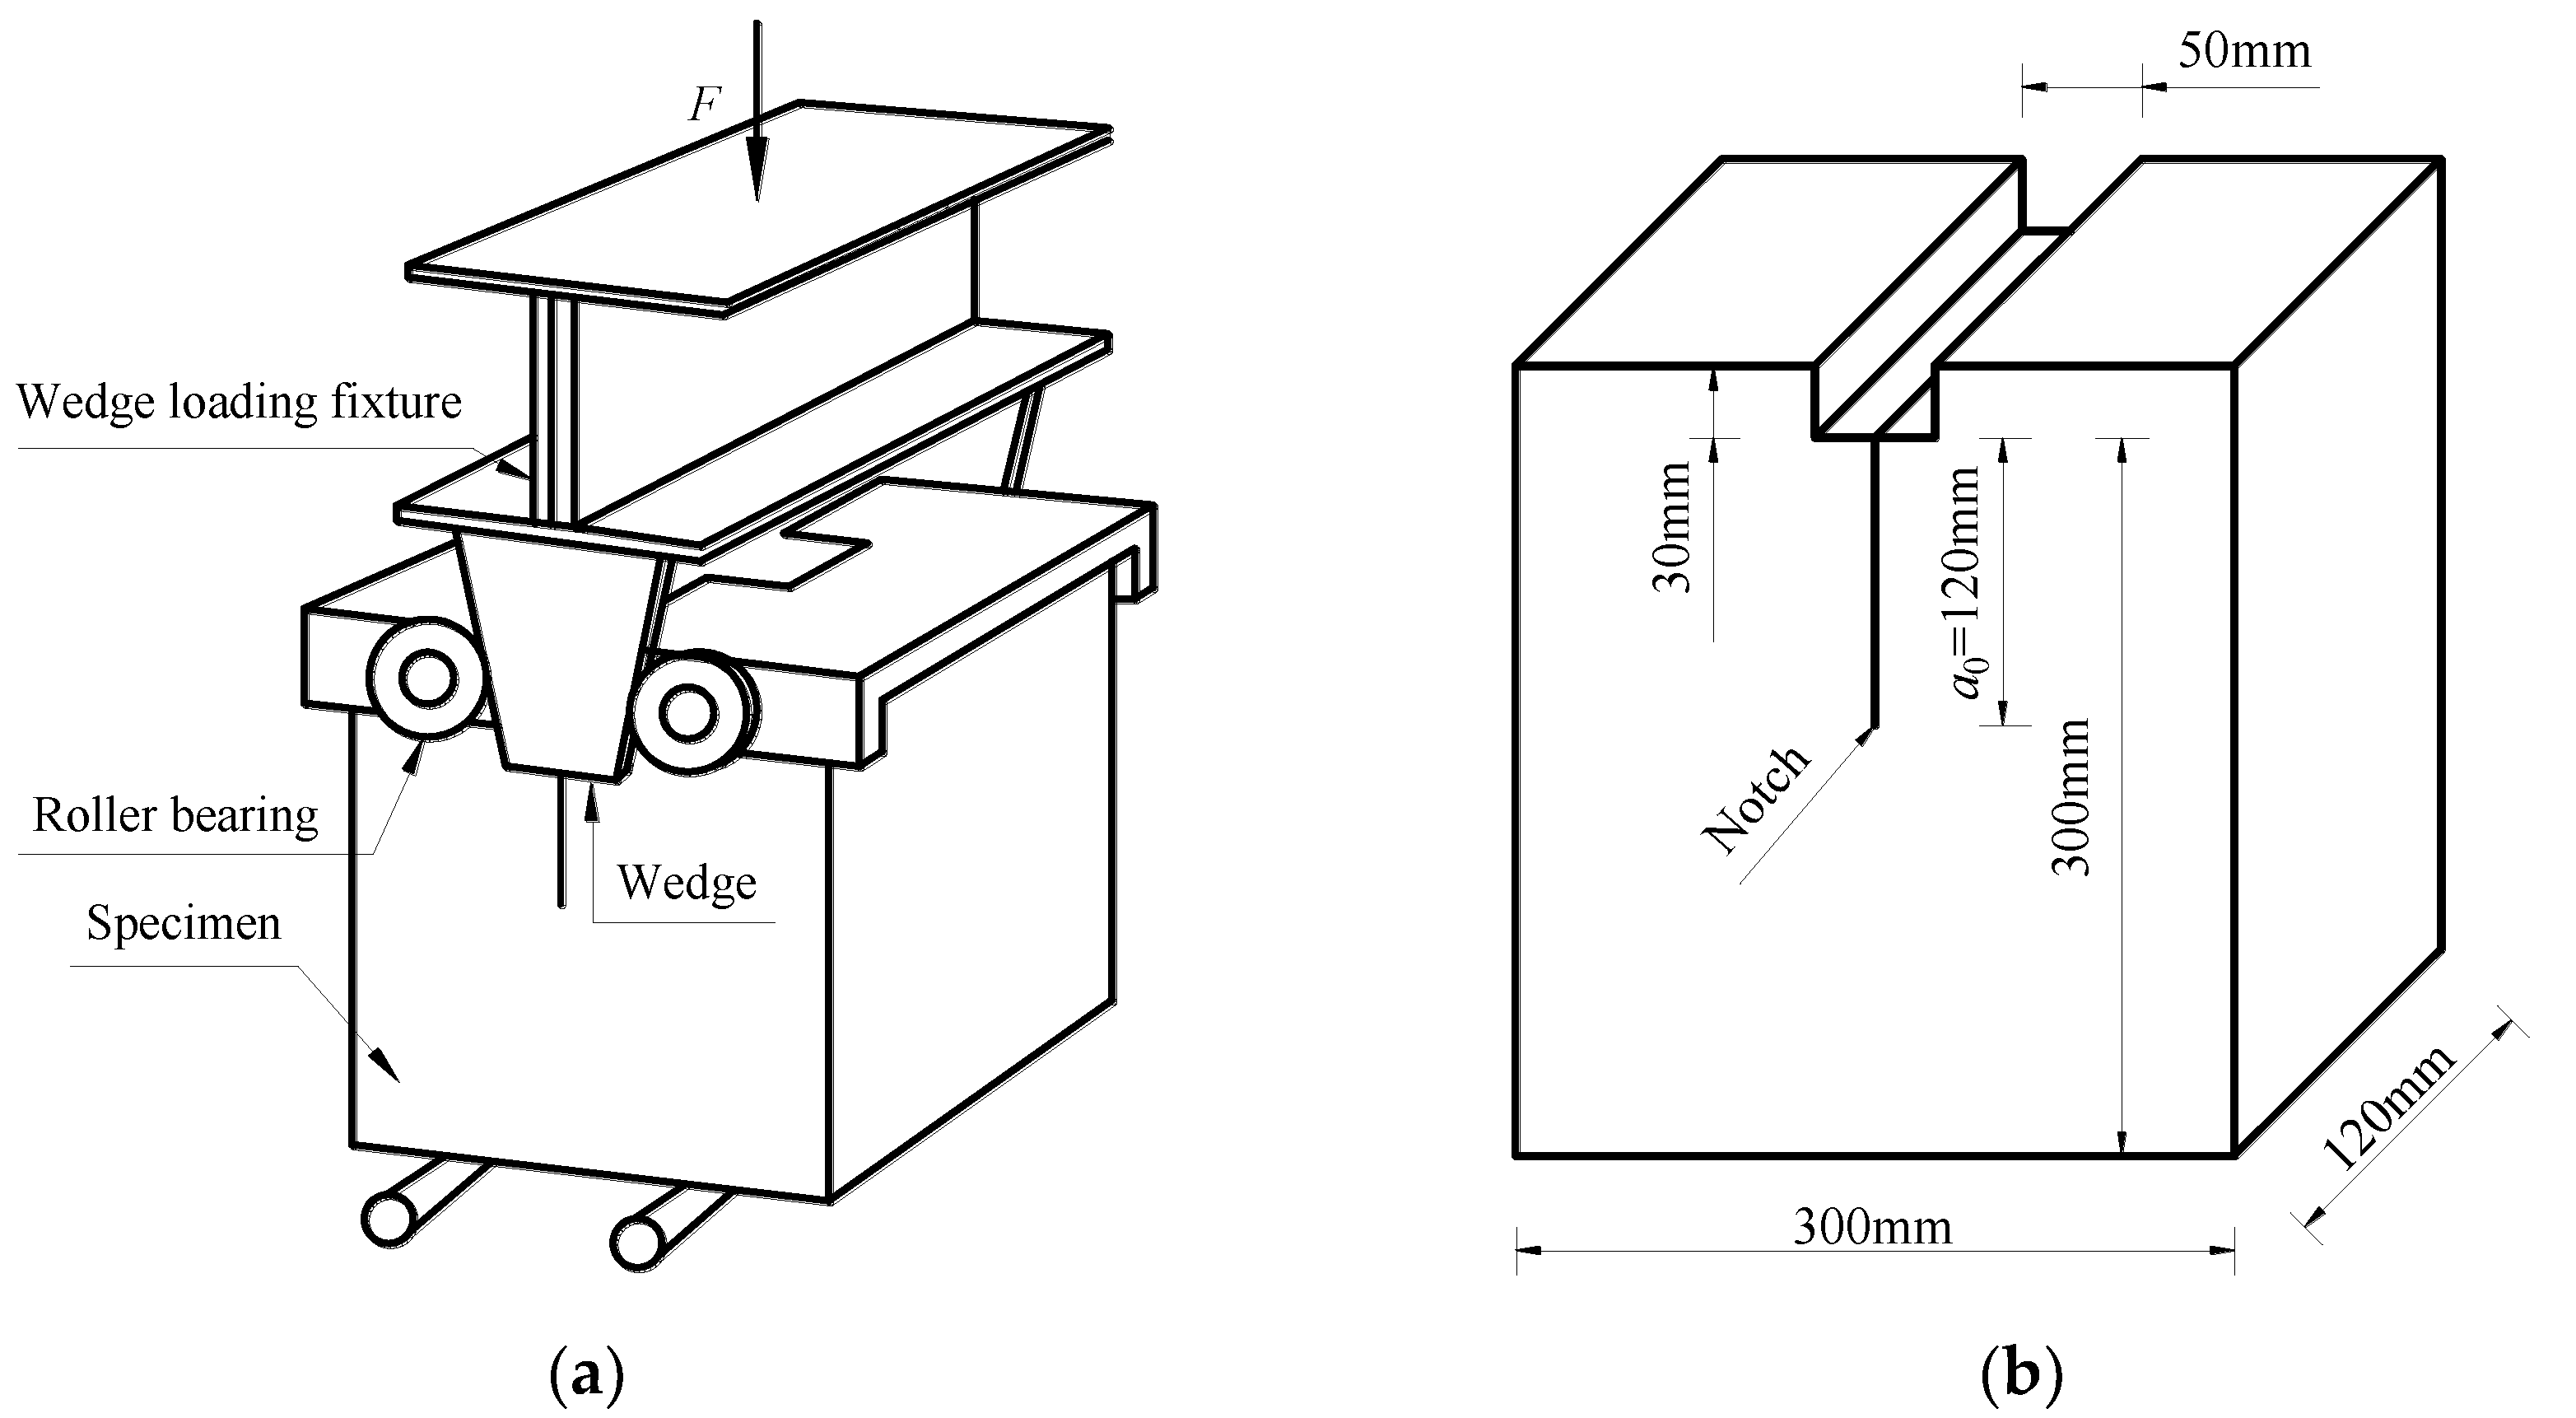
The notched wedge splitting specimens are employed for investigating concrete fracture properties. The advantages of using it are that its self-weight has an insignificant effect on test results and the ratio of ligament length to sample size is considerably large [26]. However, to avert the unexpected failure of the sample and improve the stability of the sample, the double supports were used instead of the traditional sample with one-line support [27]. The test principle is shown in Figure 1a, where the vertical load is converted into the horizontal splitting force through a wedge-loading fixture. In the present test, the wedge angle is 15°.
The dimension of the wedge splitting specimen was 120 × 300 × 300 mm (thickness × width × height), as shown in Figure 1b. The height of the specimen was greater than the recommended height in the specification in order to measure the fracture energy and fracture toughness independent of specimen size. The key purpose of this research is to investigate fracture properties of concrete under dry environments instead of the size effect, so a single specimen was adopted. In the concrete casting process, a steel plate was inserted into the tensile surface of the sample to form a notch. The thickness and initial length of the notch were 2 mm and 120 mm, respectively.
The specimen was poured in steel mold designed and manufactured according to experimental requirements, and each specimen was vibrated for about 1 min on a vibrator to eliminate air bubbles and to increase the density. After pouring, the sample was kept at natural conditions, and the pouring surface was covered with a layer of waterproof plastic film to prevent desiccation. Approximately 4.5 h after setting, the steel plate was cautiously pulled out. Subsequently, the sample was moved into the corresponding environmental box and kept there for 24 h. Afterward, the steel mold was removed and the concrete transferred into the same box again, where it was maintained until the test age. This process guarantees that the concrete has sufficient strength to avert damaging when placed, moved, and de-mold. Besides, this procedure also ensures that when concrete fracture properties begin to progress, all specimens achieve the same characteristics for better comparison. On the contrary, if the specimen is immediately transferred to the corresponding environment box after casting, the concrete already has different hydration degrees at the onset of its fracture properties development, resulting in difficulties in comparison [9]. Finally, this process is closer to practice, where concrete structures are usually cured for some time before being exposed to the working environment.
In addition to fracture specimens, additional cubes with a side length of 100 mm were cast using the same batch of concrete to determine the elastic modulus and strength for each research temperature. The cubes’ size and test procedure are consistent with the specification of DL/T 5150-2001 [28]. Although the size of the specimens differs with that recommended by ASTM C 496, test specification conforms to the ASTM C 496 [29]. For each investigated curing condition, eight identical cubes were poured, four of which were used to measure the strength, and the remaining four were employed to evaluate the elastic modulus.

2.4. Testing

The wedge splitting specimens were tested according to ASTM E 1820 on an Instron servo-hydraulic testing machine. The fracture experiment set-up is shown in Figure 2. During loading, the main deformation of crack mouth opening displacement (CMOD) was monitored in real-time by a clip-gauge mounted at the mouth of the notch. The capacity and accuracy of the clip-gauge were 5 mm and ±0.2 μm, respectively. The tests were controlled by the CMOD. To start the test, the specimen was preloaded with 0.2 kN. Subsequently, the Instron testing machine was driven by an initial displacement criterion of 0.04 mm∙min−1. In the post-peak range, the loading rate was gradually increased up to 0.08 mm∙min−1. The Instron testing machine stops the loading when the load drops to 95% of the peak load. The main reason for choosing this loading scheme was to make the specimen failed within 30 to 40 min. During the test, the information on load and CMOD was collected twice per second. Due to the use of a testing machine with large stiffness, the crack propagated steadily during the test.
The elastic modulus and compressive strength at 28 d were measured using a universal testing machine with a range of 100 tons and a linear variable displacement transducer. To start the test, the sample was preloaded with 5 kN. Thereafter, the testing machine was driven by the displacement criterion of 0.2 mm∙min−1. The elastic modulus and compressive strength were determined by averaging the test results of the four identical cubes. Table 2 presents the measured values of elastic modulus and compressive strength under different curing conditions.

3. Results

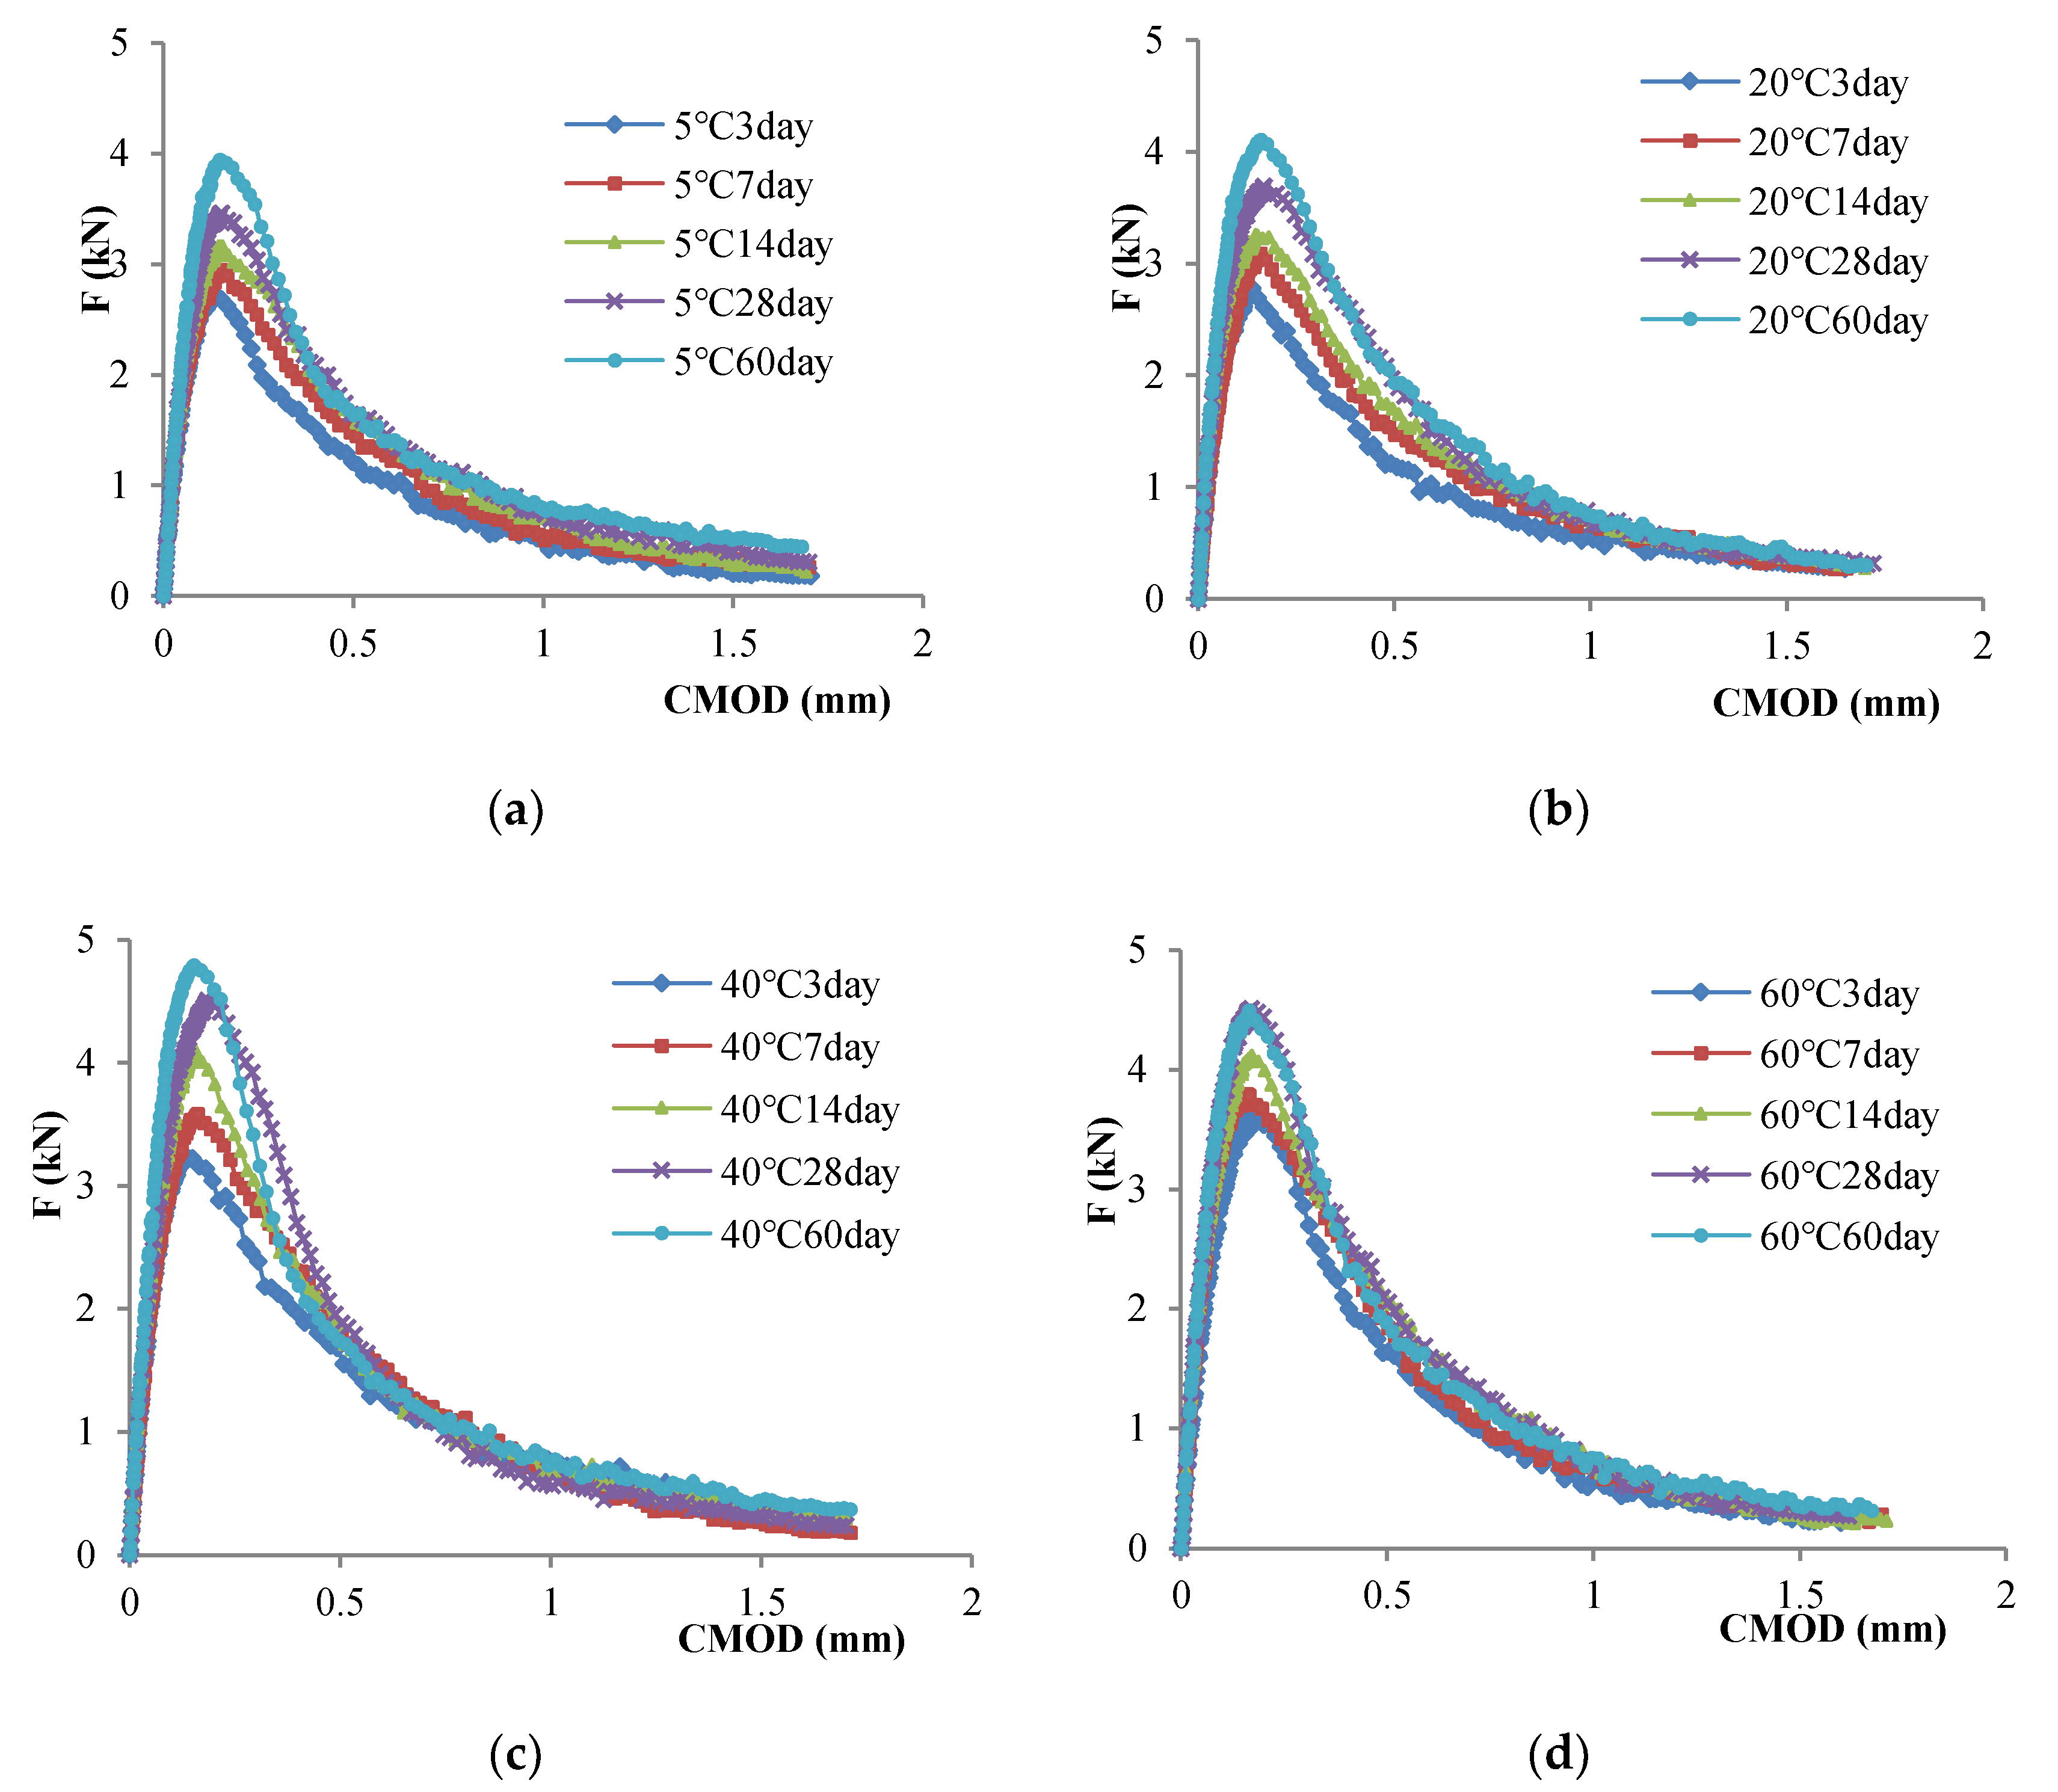
3.1. Load-CMOD Curves

Figure 3 presents the complete load-CMOD curves for concrete in a dry environment with different temperatures, which was used to obtain the peak load and calculate the fracture parameters such as fracture energy. Owing to the heterogeneity of concrete, the load-CMOD curves measured by the same set of specimens are different. For each investigated temperature and age, only the averaged curve of the same group of specimens was presented to avoid confusion. The overall load-CMOD curve is smooth, demonstrating that the unloading process was slow after the peak load and the test was carried out in a stable test state.
As presented in Figure 3, at the beginning of loading, there was a linear relationship between load and CMOD, indicating that concrete was in the stage of linear elasticity. The specimen did not undergo significant nonlinear deformation before the crack initiation or reaching the cracking load. For each curing condition, the initial slope increased as the concrete become older, which was attributed to the increase of the concrete strength and stiffness with time elapsing. Further, with the increase of curing time, the peak load grew markedly under each investigated curing temperature. For instance, for the specimens exposed to 5 °C, the peak load was 2.683 kN after 3 d, 2.906 kN after 7 d, 3.156 kN after 14 d, 3.427 kN after 28 d, and 3.911 kN after 60 d. The peak load increased by 14.1% from 28 d to 60 d, indicating that there was still a lot of un-hydrated cement inside the concrete under this curing condition. A similar phenomenon was also observed when the concrete kept at high temperature, but the rate of growth was lower than that of the concrete exposed to low temperature. Typically, for the concrete exposed to 60 °C, the peak load improved from 3.565 kN after 3 d of hydration to 4.491 kN after 60 d of hydration, where the peak load hardly increased beyond 28 d hydration.
Figure 3 also reveals that the peak load improved with the growing curing temperature during an early age, but this situation did not hold in later ages, with the greatest ultimate values of peak load corresponding to the specimens kept at 40 °C. In detail, at 3 d, the peak load improved from 2.683 kN at 5 °C to 2.723 kN at 20 °C, 3.366 kN at 40 °C, and finally to 3.565 kN at 60 °C with a final ascent of 32.9%. However, at 60 d, the peak load of concrete stored at 5 °C, 20 °C, 40 °C and 60 °C was 3.911 kN, 4.092 kN, 4.781 kN, and 4.491 kN, respectively. The peak load of concrete exposed to 60 °C was only 12.9% and 8.9% greater than that of concrete kept at 5 °C and 20 °C, respectively, and even was 6.5% smaller than that of concrete exposed to 40 °C.
Besides, the post-peak curvature of the curve, which represented the brittleness of the concrete, was related to the curing condition and age. This can be attributed to the improvement of the interfacial transition zone (ITZ), in which the stress concentration was decreased and more new hydration products were accumulated as the curing age was prolonged. Consequently, the bridging effect of the aggregate decreased and the fracture mode of concrete gradually transformed from the interfacial transition zone to aggregate being broken. Particularly, with further strengthening of ITZ at 60 d of curing age, the fracture path at high temperature was directly through the aggregate, which was similar to that of 28 d. As a result, the characteristic of load-CMOD curves in the unloading zone at 28 and 60 d followed the same pattern.

3.2. Fracture Energy

Fracture energy ( G F ) represents the energy required to generate new cracks per unit area during crack propagation, which is applicable to energy release rate criterion. The simplest method to calculate fracture energy is the fracture work method. Thus, the fracture energy can be evaluated using Equation (1). Note that for a specimen that is not large, the effect of its weight is negligible. Thus, the own weight of the specimen was ignored when evaluating the fracture energy. Besides, the fracture experiment can never reach the zero load level [30]. Therefore, the far-tail constant value was usually used to determine the true fracture energy [31]. In the present paper, the fracture experiments did not stop before the unloading zone of the load-CMOD curve appeared a full tail. The part that was not measured was extended inversely by the fit-best expression in the evaluation of G F .
G F = W B ( h a 0 )   ,
where W is the fracture work which equals the area below the measured splitting force against CMOD curve; a0 is the length of pre-crack; B and h represent the thickness and height of wedge splitting specimen, respectively.
Figure 4 shows the fracture energy for concrete exposed to dry environments with different temperatures as a function of the age. In this figure, each point denotes the mean value of fracture energy evaluated by the three companion wedge splitting specimens, and the error bars are not presented to avoid displaying a pell-mell plot. In any case, the difference between one replicate and the mean of the same group was not more than 10% concerning the mean.
It can be seen from Figure 4 that the concrete fracture energy increased rapidly during the first 3 d, irrespective of the curing conditions investigated. Over time, fracture energy kept increasing at a reduced rate and gradually stabilized when the age was large enough. For instance, in the case of 5 °C, the fracture energy was 130.4 N∙m−1 after 3 d of hydration, 157.2 N∙m−1 after 7 d of hydration, 174.4 N∙m−1 after 14 d of hydration, 189.4 N∙m−1 after 28 d of hydration, and 204.7 N∙m−1 after 60 d of hydration. The value of fracture energy at 60 d was 8.1% greater than that at 28 d. It means that the fracture energy continuously improved with the increase of age and the growth rate was still relatively great. In other words, in the case of 5 °C, 60 d of curing time were not sufficient to make the concrete achieve the stable state and there was a lot of un-hydrated cement inside the concrete. A similar phenomenon was observed under elevated temperature, but the fracture energy tended to reach a plateau value in a shorter time. Typically, for 60 °C, fracture energy was 173.7 N∙m−1 after 3 d of hydration, 194.4 N∙m−1 after 7 d of hydration, 207.7 N∙m−1 after 14 d of hydration, 220.8 N∙m−1 after 28 d of hydration, and 221.7 N∙m−1 after 60 d of hydration. Obviously, in this case, the growth rate of fracture energy decreased significantly after 14 d and even stopped increasing after 28 d. At high curing temperature, the shorter stable time is mainly due to a higher temperature accelerating the hydration reaction rate of cement.
Figure 4 also reveals that in the early stage, the fracture energy of concrete increased significantly with the increasing temperature; but after 28 d of hydration, the curing temperature had the opposite effect on the fracture energy, that is, the larger later-age value of fracture energy was measured by concrete exposed to the lower temperature, and vice-versa. For instance, at 3 d, the fracture energy of concrete exposed to 60 °C was larger by 10.9%, 20.9%, and 32.9% compared to that of specimens exposed to 40 °C, 20 °C and 5 °C, respectively. However, for the specimens kept at elevated temperatures, the growth rate of the fracture energy decreased faster with the extension of curing time. As a result, the fracture energy difference between each temperature gradually decreased with time elapsing. In detail, after 28 d, the fracture energy at 60 °C reached 220.8 N∙m−1, which was 4.7%, 10.2%, and 16.6% higher than that of concrete at 40 °C, 20 °C and 5 °C, respectively. Further, after about 41 d of hydration, the fracture energy curves of concrete kept at 60 °C and 40 °C crossed each other, indicating that from 41-day onwards, the fracture energy of concrete exposed to 40 °C was larger than that of concrete exposed to 60 °C. Moreover, it can be easily inferred from the growth rate of fracture energy at 20 °C and 5 °C that, with the further increase of age, the curves at these two temperatures must intersect that at a higher temperature, and the values of fracture energy at these two temperatures certainly exceed that of concrete kept at the higher temperature. The maximum fracture energy limit was measured by concrete cured at 5 °C. Accordingly, the fracture energy of concrete cured at different temperatures has a temperature crossover effect. Considering the early growth rate and later-age value of fracture energy, around 40 °C was the optimum curing temperature propitious to the fracture energy development of concrete in dry environments. This optimal temperature was related to the faster hydration rate and higher hydration degree of the cementitious material, as well as to the microstructure of dense concrete with finer pores distribution [32].

3.3. Effective Fracture Toughness

Fracture toughness characterizes the cracking resistance of concrete, which is usually used for the stress intensity factor criterion. A smaller value of fracture toughness indicates that the concrete is apt to fracture abruptly before the occurrence of obvious unrecoverable deformation. The effective fracture toughness ( K I C ) is calculated with the following equation [33]:
K I C = F smax B h · 3.675 [ 1 0.12 ( α 0.45 ) ] ( 1 α ) 3 / 2   ,       α = a c h   ,
where F s m a x is the horizontally component of peak load; the meaning of h and B is the same as in Equation (1); a c   is the critical effective crack length, which is evaluated by the following equation [33]:
a c = ( h + h 0 ) ( 1 13.18 9.16 + C M O D c · E · B / F smax ) h 0   ,
where h 0 is the thickness of clip gauge holder; C M O D c is the crack opening displacement corresponding to F s m a x ; E is the tensile Young’s modulus.
Figure 5 depicts the test results of effective fracture toughness against age under four curing conditions investigated. Although each point in Figure 5 denotes the mean values of the three replicate samples, the error bars are not shown again for the sake of brevity. Interestingly, the scattering of data observed in effective fracture toughness was smaller when compared with the case of fracture energy.
During the unstable propagation, redundant cracks appeared and the propagation path of the main crack became more random; however, the energy consumed by these extra cracks was difficult to calculate, so these energies were ignored when evaluating fracture energy. As a result, the fracture energy produced larger randomness.
As can be presented in Figure 5, for each curing condition investigated, the effective fracture toughness was closely related to age and its value increased with age, which was the same as fracture energy with age. In the beginning, effective fracture toughness improved significantly with the growing age, because at this stage the reaction rate of cement hydration was quite fast. The growth rate increased by degrees and then reduced after maximizing. Subsequently, effective fracture toughness increased slightly with age at a reducing rate and finally reached a constant as the age was further extended. Typically, for 5 °C, the effective fracture toughness continuously increased from 0.889 MPam0.5 after 3 d of hydration to 1.043 MPam0.5 after 7 d of hydration, 1.113 MPam0.5 after 14 d of hydration, 1.204 MPam0.5 after 28 d of hydration, and finally 1.306 MPam0.5 after 60 d of hydration, with a significant increase of 0.417 MPam0.5 or 46.9%. Similarly, for 60 °C, the effective fracture toughness was 1.164 MPam0.5 at the age of 3 d, 1.304 MPam0.5 at the age of 7 d, 1.395 MPam0.5 at the age of 14 d, 1.490 MPam0.5 at the age of 28 d, and 1.509 MPam0.5 at the age of 60 d. The fracture toughness at the age of 60 d was only 1.3% greater than that at the age of 28 d. This also demonstrated that it takes a shorter time for the effective fracture toughness to reach the constant value under higher temperatures.
Figure 5 also shows that, as observed in the fracture energy, there was also a temperature crossover effect in the effective fracture toughness of concrete in dry environments. As the curing temperature increased, concrete effective fracture toughness improved dramatically during the early ages, but this situation did not hold after 28 d, in which greater ultimate value of effective fracture toughness was acquired from the concrete kept at a lower temperature, and vice-versa. Specifically, at the age of 3 d, the fracture toughness of concrete kept at 60 °C was 1.164 MPam0.5, which was 5.7% greater than at 40 °C, 21.1% greater than at 20 °C, and 30.9% greater than at 5 °C. Evidently, in the early days, higher temperatures promoted the rapid development of concrete effective fracture toughness. However, at the elevated temperature, the increasing rate of fracture toughness of concrete decreased faster with the extension of curing time. As a result, a larger later-age value of the effective fracture toughness was measured by concrete kept at a lower temperature. For example, for 60 °C, effective fracture toughness increased very litter beyond 14 d and almost reached a plateau value. In contrast, the specimens kept at a lower temperature (5 °C and 20 °C) had a higher increasing rate of effective fracture toughness. Representatively, at the age of 60 d, the fracture toughness of the concrete kept at 60 °C was only greater 15.5% and 4.4% when comparing concrete kept at 5 °C and 20 °C, respectively, and was smaller 2.3% when comparing concrete kept at 40 °C. In other words, the difference in the fracture toughness between different temperatures was decreasing as the curing age was prolonged. The fracture energy curves of concrete kept at 40 °C and 60 °C crossed each other at about 43 d, demonstrating that the effective fracture toughness of concrete cured at 40 °C was larger than that of concrete at 60 °C beginning from the 43rd day. Considering the increasing rate of effective fracture toughness at 5 °C and 20 °C, we can conclude that with the further extension of curing time, the curves at 5 °C and 20 °C will doubtlessly cross the curves at the higher temperature. This clearly showed that the optimum temperature propitious to the fracture energy development of concrete in dry environments was about 40 °C, which was the same as that for fracture energy.

4. Discussion

As mentioned earlier, during the first 3 d, the GF and KIC of concrete improved quickly with increasing age owing to the fast hydration rate of cement in this stage. The initial growth rate of concrete fracture parameters increased progressively and then reduced after maximizing, accompanying a steeper curve. As the curing temperature increased, the duration for this stage became shorter. In the later stage, the rate of hydration went down, resulting in that the concrete fracture parameters developed overtime at a smaller growth rate. In general, there should be the third stage, in which the fracture parameters of concrete tended to their stable values, as the age was further extended. However, at low temperatures, the third stage was not seen or was not notable because this study only investigated the age of up to 60 d, meaning that there was a lot of un-hydrated cement inside the concrete under these curing temperatures. This variation of concrete fracture parameters regarding the age was consistent with other independent investigations [34]. For example, Beygi et al. [35] found that with the increase of test age from 3 to 90 d, GF and KIC increase from 0.961 MPam0.5 to 1.448 MPam0.5 and from 99.7 N∙m−1 to 126.5 N∙m−1, respectively. Lee et al. [36] demonstrated that the fracture energy shows a rapid increase during earlier and then starts to converge to a certain extent of 173.1 N∙m−1 at 28 d. The main reason for the increase of concrete GF and KIC with age was the strengthening of the ITZ between the paste and aggregate. ITZ is the most sensitive area inside the concrete, where the largest number of micro-cracks are formed [37]. In other words, the failure of concrete usually depends on the strength of its weakest area. At an early age, there was a lot of un-hydrated cement in the ITZ, and it resulted in high porosity in this zone [38]. The bridging effect of the aggregate was very strong causing the cracks to propagate along with the interface, and a large number of aggregates were extracted from the matrix, as presented in Figure 6a. As the reaction of cement hydration progressed, an increasing number of hydration products accumulated in the ITZ and the ITZ pores were stuffed with hydration products, indicating that the size and content of pores in ITZ and cement paste decreased. The ITZ and cement paste also became stronger. As a result, the bridging effect of the aggregate became weaker and a growing number of aggregates were broken. The fracture mode under load also changed from around aggregate or bond zones through the aggregate directly, as presented in Figure 6b. Further, the aggregate strength was greater than that of the ITZ and cement paste, demonstrating that more energy was needed in order to get over the enhanced ITZ and cement paste and the aggregates. Consequently, the greater values of fracture energy and effective fracture toughness were obtained at later ages. However, as the strength of the ITZ and cement paste further improved, the fracture pattern did not alter dramatically, where an only increasing number of aggregates were extracted. Therefore, effective fracture toughness and fracture energy did not increase significantly, but gradually tended to their stable values.
More importantly, as is evident from the data in Figure 5 and Figure 6, the effective fracture toughness and fracture energy of concrete cured at elevated temperatures developed at a faster speed at the early stage. For instance, after 3 d of hydration, the GF and KIC of concrete cured at 60 °C was 20.9% and 21.1% larger respectively than that of concrete cued at 20 °C. This promotion effect of temperature on the early fracture parameters of concrete is related to the accelerated hydration reaction rate of cement, and the finer pore distribution and denser microstructure [39]. Over time, however, the rate of growth of the fracture parameters of concrete kept at high temperatures also decreased at a higher rate, which resulted in these samples obtained the smaller ultimate values of GF and KIC than those of samples kept at reduced temperatures. For example, after 60 d of hydration, the difference in the GF and KIC between the samples exposed to 60 °C and 20 °C was reduced to 4.2% and 3.3%, respectively. Even the values of GF and KIC at 60 °C were less than that at 40 °C beginning from the 43rd day and 41st day, respectively. Further, the growth rate of fracture parameters at 5 °C and 20 °C also indicated that with the further extension of curing time, the curves at 5 °C and 20 °C will doubtlessly cross the curves at the higher temperature. Namely, although a higher temperature accelerated the rate of hydration reaction of cement and promoted the development of GF and KIC in the early stage, it harmed the development of the ultimate value of fracture parameters of concrete. The GF and KIC of concrete showed a temperature crossover effect, and the optimum temperature propitious to their development was approximately 40 °C. Such a trend was in line with previous observations found by other scholars with a slightly different method. Oswaldo et al. [40] claimed that curing at high temperatures was conducive to rapid strength gain, but at later ages, the greatest strength was measured by concrete cured at 20 °C. Boubekeur [41] found that the concrete compressive strength cured at 50 °C was 7% smaller than that of concrete stored at normal temperature after 28 d. Lee et al. [42] demonstrated a 15% reduction in the concrete compressive strength cured at 60 °C after 14 d compared to that cured at 40 °C. Nasir et al. [43] clarified that after 28 d the tensile strength improved with the pouring temperature up to 32 °C, but decreased these properties as a further increase in temperature.
The adverse effect of high-temperature on the later-age fracture properties of concrete makes us wonder: What happened at the microscopic level at a high-temperature? We concluded that this adverse effect of high-temperature on the effective fracture toughness and fracture energy of concrete was related to some different mechanisms. Firstly, this phenomenon is caused by the non-homogeneous dispersion of hydration products inside the pores of the hardened cement paste [44]. The hydration reaction of cement was accelerated at elevated temperature, so there was neither sufficient time for the hydration products to disperse surrounding nor sufficient time for them to precipitate and distribute evenly. Consequently, more and more hydrated products were concentrated surrounding the hydrating or un-hydrated particles of cement, resulting in a more non-homogeneous distribution of hydrated products and causing the concrete to become a porous structure [45]. Secondly, the change in the C-S-H apparent density at high-temperature was another important reason for the decrease of later-age values of concrete fracture parameters [46]. Gallucci et al. [47] clarified that there was a remarkable enhancement in the C-S-H apparent density in the situation of elevated temperature, which came from the different assembly of the C-S-H. Owing to this increase, the filling space of C-S-H was reduced, leading to that the microstructure of the concrete was much coarser and porous, which had a detrimental effect on the concrete fracture parameters. Other mechanisms that resulted in the temperature crossover effect were cumulative of compact and low infiltration hydration products surrounding the cement particles and the delayed diffusion of the hydrate in cement secondary hydration reaction [40]. Namely, the elevated temperature might have resulted in the rapid evaporation of uncombined water in the concrete, which restrained the further spread of cement and limited the progress of hydration reaction, thereby restricting the forming of more C-S-H and the development of fracture parameters. Finally, the deviation of thermal expansion coefficients among the concrete components was also related to the negative effect [48]. In the situation of high-temperature, the concrete would expand in volume. The deformation of each constituent of concrete is not equal because of the difference in thermal expansion coefficients, which will cause a great stress build-up in the air void concentration area or the ITZ. When this stress exceeds the matrix tensile strength, micro-cracks begin to emerge in weak areas, especially those at the interface of the cement paste and the aggregate [49]. What is worse, due to the capillary action, these micro-cracks will become an ideal moisture path and increase the mobility of moisture inside the concrete, which can generate a pressure of expansion of the water vapor due to swelling of water vapor more quickly than getting away from the sample, leading to further micro-cracking. As a result, the fracture mode of concrete at elevated temperature has altered due to higher porosity and micro-cracking, which means that a decreasing number of aggregates were broken, as presented in Figure 7. In short, all the above factors, in particular the high porosity, together deteriorated the properties of concrete at later-age and induced a reduction in the ultimate values of the breaking fracture and the fracture toughness of the concrete at high temperature. On the other hand, concrete stored under low temperature (5 °C and 20 °C) continuously underwent the favorable effect, with a very slow hydration rate, which left the dissolved ions enough time to diffuse and resulted in a more uniform hydration products distribution and lower coarse porosity [50].

5. Conclusions

In the current research, the fracture properties of concrete in dry environments with different temperatures were investigated using the wedge splitting specimens. Four different temperatures (5 °C, 20 °C, 40 °C, and 60 °C) were considered, which represented cold, normal, hot, and extremely hot weather, respectively. The complete load-CMOD curves of specimens were obtained at 3, 7, 14, 28, and 60 d. The key fracture parameters of concrete were also evaluated. The following conclusions can be drawn from the experimental data:
  • In a dry environment, the gain in fracture energy of the concrete strongly depended on the curing temperature. An elevated temperature was beneficial to the rapid development of concrete fracture energy at an early age. However, this situation did not hold at later ages, in which a higher value of the fracture energy at a later age was obtained by concrete stored at lower temperatures, and vice versa. Generally, at 60 d, the fracture energy of concrete cured at 60 °C was only larger 7.7% and 3.2% when comparing concrete stored at 5 °C and 20 °C, respectively, and even was smaller 2.8% when comparing concrete stored at 40 °C. Considering the early growth rate and later-age value of fracture energy, the optimum curing temperature for fracture energy of concrete under dry condition was around 40 °C.
  • In the case of the dry condition, the effective fracture toughness improved significantly as the increase of curing temperature in the early stage, but the influence of temperature on the concrete fracture toughness reversed after 28 d, wherein a relatively small ultimate value of effective fracture toughness was measured by the samples stored at the higher temperature. The temperature crossover effect was observed in concrete effective fracture toughness. From the temperature investigated, the most suitable curing temperature for the development of effective fracture toughness of concrete in dry environments was still 40 °C.
  • For a given curing condition, both the effective fracture toughness and fracture energy improved speedily with age at the beginning. After the growth rate reached their maximum value, these two fracture parameters increased slightly with age at a reducing rate, and eventually tended to their stable values as the age was further extended. Further, the effective fracture toughness and fracture energy tended to stabilize in a shorter time with the increasing temperature.
It should be noted that the aforementioned conclusions are only valid for the concrete studied in this paper, and the general conclusions for other types of concrete need further study.

Author Contributions

Conceptualization, Z.M.; formal analysis, Z.M.; funding acquisition, Q.L. and Y.H.; investigation, Z.M.; methodology, Z.M.; project administration, C.L. and Y.Q.; resources, C.L. and Y.Q.; supervision, Y.H.; writing—original draft, Z.M.; writing—review and editing, Q.L. and Y.H. All authors have read and agreed to the published version of the manuscript.

Funding

This research was funded by National Natural Science Foundation of China (51979145, 51839007), the Fundamental Research Funds for the Central Universities, CHD (300102219305), the Open Research Fund Program of State Key Laboratory of Hydroscience and Engineering (sklhse-2020-D-01), and the Research Projects of China Three Gorges Corporation (Contract numbers: BHT/0806 and WDD/0427).

Conflicts of Interest

The authors declare no conflicts of interest.

References

  1. Jennings, H.M.; Thomas, J.J.; Gevrenov, J.S.; Constantinides, G.; Ulm, F.J. A multi-technique investigation of the nanoporosity of cement paste. Cem. Concr. Res. 2007, 37, 329–336. [Google Scholar] [CrossRef] [Green Version]
  2. Zhu, H.; Hu, Y.; Li, Q.B.; Ma, M. Restrained cracking failure behavior of concrete due to temperature and shrinkage. Constr. Build. Mater. 2020, 244, 118318. [Google Scholar] [CrossRef]
  3. Liu, Y.B.; Presuel-Moreno, F. Effect of elevated temperature curing on compressive strength and electrical resistivity of concrete with fly ash and ground-granulated blast-furnace slag. ACI Mater. J. 2014, 111, 531–541. [Google Scholar]
  4. Zhu, H.; Li, Q.; Ma, R.; Yang, L.; Hu, Y.; Zhang, J. Water-repellent additive that increases concrete cracking resistance in dry curing environments. Constr. Build. Mater. 2020, 249, 118704. [Google Scholar] [CrossRef]
  5. Mi, Z.X.; Hu, Y.; Li, Q.B.; Gao, X.F.; Yin, T. Maturity model for fracture properties of concrete considering coupling effect of curing temperature and humidity. Constr. Build. Mater. 2019, 196, 1–13. [Google Scholar] [CrossRef]
  6. Castellano, C.C.; Bonavetti, V.L.; Donza, H.A.; Irassar, E.F. The effect of w/b and temperature on the hydration and strength of blastfurnace slag cements. Constr. Build. Mater. 2016, 111, 679–688. [Google Scholar] [CrossRef]
  7. Cakir, O.; Akoz, F. Effect of curing conditions on the mortars with and without GGBFS. Constr. Build. Mater. 2008, 22, 308–314. [Google Scholar] [CrossRef]
  8. Shoukry, S.N.; William, G.W.; Downie, B.; Riad, M.Y. Effect of moisture and temperature on the mechanical properties of concrete. Constr. Build. Mater. 2011, 25, 688–696. [Google Scholar] [CrossRef]
  9. Zhang, J.Y.; Cusson, D.; Monteiro, P.; Harvey, J. New perspectives on maturity method and approach for high performance concrete applications. Cem. Concr Res. 2008, 38, 1438–1446. [Google Scholar] [CrossRef] [Green Version]
  10. Tanyildizi, H. Fuzzy logic model for prediction of mechanical properties of lightweight concrete exposed to high temperature. Mater. Des. 2009, 30, 2205–2210. [Google Scholar] [CrossRef]
  11. Escalante-Garcia, J.I.; Sharp, J.H. The microstructure and mechanical properties of blended cements hydrated at various temperatures. Cem. Concr. Res. 2001, 31, 695–702. [Google Scholar] [CrossRef]
  12. Jiang, C.J.; Yang, Y.; Wang, Y.; Zhou, Y.N.; Ma, C.C. Autogenous shrinkage of high performance concrete containing mineral admixtures under different curing temperatures. Constr. Build. Mater. 2014, 61, 260–269. [Google Scholar] [CrossRef]
  13. Care, S. Effect of temperature on porosity and on chloride diffusion in cement pastes. Constr. Build. Mater. 2008, 22, 1560–1573. [Google Scholar] [CrossRef]
  14. Patel, H.H.; Bland, C.H.; Poole, A.B. The microstructure of concrete cured at elevated temperature. Cem. Concr. Res. 1995, 25, 485–490. [Google Scholar] [CrossRef]
  15. Michael, G.; Lars, W. A method based on isothermal calorimetry to quantify the influence of moisture on the hydration rate of young cement pastes. Cem. Concr. Res. 2010, 40, 867–874. [Google Scholar]
  16. Flatt, R.J.; Scherer, G.W.; Bullard, J.W. Why alite stops hydrating below 80% relative humidity. Cem. Concr. Res. 2011, 41, 987–992. [Google Scholar] [CrossRef]
  17. Aparicio, S.; Sagrario, M.R.; Miguel, M.A.; Jose, V.F. The effect of curing relative humidity on the microstructure of self-compacting concrete. Constr. Build. Mater. 2016, 104, 154–159. [Google Scholar] [CrossRef]
  18. Saengsoy, W.; Nawa, T.; Termkhajornkit, P. Influence of relative humidity on compressive strength of fly ash cement paste. J. Struct. Constr. Eng. 2008, 73, 1433–1441. [Google Scholar] [CrossRef] [Green Version]
  19. Lau, D.; Buyukozturk, O. Fracture characterization of concrete/epoxy interface affected by moisture. Mech. Mater. 2010, 42, 1031–1042. [Google Scholar] [CrossRef]
  20. Mi, Z.X.; Hu, Y.; Li, Q.B.; An, Z.H. Effect of curing humidity on the fracture properties concrete. Constr. Build. Mater. 2018, 169, 403–413. [Google Scholar] [CrossRef]
  21. Yu, B.J.; Ansari, F. Method and theory for nondestructive determination of fracture energy in concrete structures. Aci Struct. J. 1996, 93, 602–613. [Google Scholar]
  22. Li, Q.B.; Guan, J.F.; Wu, Z.M.; Dong, W.; Zhou, S.W. Equivalent maturity for ambient temperature effect on fracture parameters of site-casting dam concrete. Constr. Build. Mater. 2016, 120, 293–308. [Google Scholar] [CrossRef]
  23. Huang, Y.B.; Qian, J.S. The influence on high strength concrete mechanical properties by age and curing condition. Bull. Chin. Ceram. Soc. 2007, 26, 427–430. [Google Scholar]
  24. Mi, Z.X.; Hu, Y.; Li, Q.B.; Zhu, H. Elevated temperature inversion phenomenon in fracture properties of concrete and its application in maturity model. Eng. Fract. Mech. 2018, 199, 294–307. [Google Scholar] [CrossRef]
  25. Mechtcherine, V. Fracture mechanical behavior of concrete and the condition of its fracture surface. Cem. Concr. Res. 2009, 39, 620–628. [Google Scholar] [CrossRef]
  26. Bretschneider, N.; Slowik, V.; Villmann, B.; Mechtcherine, V. Boundary effect on the softening curve of concrete. Eng. Fract. Mech. 2011, 78, 2896–2906. [Google Scholar] [CrossRef]
  27. Zhao, Z.F.; Kwon, S.H.; Shah, S.P. Effect of specimen size on fracture energy and softening curve of concrete: Part, I. Experiments and fracture energy. Cem. Concr. Res. 2008, 38, 1049–1060. [Google Scholar] [CrossRef]
  28. DL/T 5150-2001, Test Code for Hydraulic Concrete; China Electric Power Press: Beijing, China, 2006.
  29. ASTM C 496/C496M-17, Standard Test Method for Splitting Tensile Strength of Cylindrical Concrete Specimens; ASTM International: West Conshohocken, PA, USA, 2017; pp. 1–5.
  30. Lee, J.; Lopez, M.M. An experimental study on fracture energy of plain concrete. Int. J. Concr. Struct. Mater. 2014, 8, 129–139. [Google Scholar] [CrossRef] [Green Version]
  31. Elices, M.; Guinea, G.V.; Planas, J. Measurement of the fracture energy using three-point bend tests: Part 3–Influence of cutting the P-δ tail. Mater. Struct. 1992, 25, 327–334. [Google Scholar] [CrossRef]
  32. Kim, J.; Han, S.H.; Song, Y.C. Effect of temperature and aging on the mechanical properties of concrete Part I: Experimental results. Cem. Concr. Res. 2002, 32, 1087–1094. [Google Scholar] [CrossRef]
  33. Xu, S.L.; Reinhardt, H.W. Determination of Double-K criterion for crack propagation in quasi-brittle fracture, Part III: Compact tension specimens and wedge splitting specimens. Int. J. Fract. 1999, 98, 179–193. [Google Scholar] [CrossRef]
  34. Bella, C.D.; Michel, A.; Stang, H. Early age fracture properties of microstructurally-designed mortars. Cem. Concr. Compos. 2017, 75, 62–73. [Google Scholar] [CrossRef] [Green Version]
  35. Beygi, M.H.A.; Kazemi, M.T.; Nikbin, I.M.; Amiri, J.V. The effect of aging on the fracture chracteristics and ductility of self-compacting concrete. Mater. Des. 2014, 55, 937–948. [Google Scholar] [CrossRef]
  36. Lee, Y.; Kim, J.K. Fracture characteristics of concrete at early ages. Int. J. Concr. Struct. Mater. 2006, 18, 191–198. [Google Scholar]
  37. Nezerka, V.; Bily, P.; Hrbek, V.; Fladr, J. Impact of silica fume, fly ash, and metakaolin on the thickness and strength of the ITZ in concrete. Cem. Concr. Compos. 2019, 103, 256–262. [Google Scholar] [CrossRef]
  38. Elsharief, A.; Cohen, M.D.; Olek, J. Influence of aggregate size, water cement ratio and age on the microstructure of the interfacial transition zone. Cem. Concr. Res. 2003, 33, 1837–1849. [Google Scholar] [CrossRef]
  39. Lothenbach, B.; Winnefeld, F.; Alder, C.; Wieland, E.; Lunk, P. Effect of temperature on the pore solution, microstructure and hydration products of Portland cement pastes. Cem. Concr. Res. 2007, 37, 483–491. [Google Scholar] [CrossRef]
  40. Oswaldo, B.D.; Lauren, Y.Z.; Jose, I.E.G. Influence of the long term curing temperature on the hydration of alkaline binders of blast furnace slag-metakaolin. Constr. Build. Mater. 2016, 113, 917–926. [Google Scholar]
  41. Boubekeur, T.; Ezziane, K.; Kadri, E.H. Estimation of mortars compressive strength at different curing temperature by the maturity method. Constr. Build. Mater. 2014, 71, 299–307. [Google Scholar] [CrossRef]
  42. Lee, C.; Lee, S.; Nguyen, N. Modeling of compressive strength development of high-early-strength- concrete at different curing temperatures. Int. J. Concr. Struct. Mater. 2016, 10, 205–219. [Google Scholar] [CrossRef] [Green Version]
  43. Nasir, M.; Al-Amoudi, O.S.B.; Al-Gahtani, H.J.; Maslehuddin, M. Effect of casting temperature on the strength and density of plain and blended cement concretes prepared and cured under hot weather conditions. Constr. Build. Mater. 2016, 112, 529–537. [Google Scholar] [CrossRef]
  44. Tan, K.F.; John, M.N. Performances of concrete under elevated curing temperature. J. Wuhan Univ. Technol. -Mater. Sci. Ed. 2004, 19, 65–67. [Google Scholar]
  45. Paul, M.; Glasser, F.P. Impact of prolonged warm (85℃) moist cure on Portland cement paste. Cem. Concr. Res. 2000, 30, 1869–1877. [Google Scholar] [CrossRef]
  46. Sajedi, F.; Razak, H.A. Effects of curing regimes and cement fineness on the compressive strength of ordinary Portland cement mortars. Constr. Build. Mater. 2011, 25, 2036–2045. [Google Scholar] [CrossRef] [Green Version]
  47. Gallucci, E.; Zhang, X.; Scrivener, K.L. Effect of temperature on the microstructure of calcium silicate hydrate (C-S-H). Cem. Concr. Res. 2013, 53, 185–195. [Google Scholar] [CrossRef]
  48. Baoju, L.; Youjun, X.; Shiqiong, Z.; Jian, L. Some factors affecting early compressive strength of steam-curing concrete with ultrafine fly ash. Cem. Concr. Res. 2001, 31, 1455–1458. [Google Scholar] [CrossRef]
  49. Yao, W.; Hu, X.; Liu, H.W.; Xia, K.W. Quantification of thermally induced damage and its effect on dynamic fracture toughness of two mortars. Eng. Fract. Mech. 2017, 169, 74–88. [Google Scholar] [CrossRef]
  50. Komonen, J.; Pennttala, V. Effect of high temperature on the pore structure and strength of plain and polypropylene fiber reinforced cement pastes. Fire Technol. 2003, 39, 23–34. [Google Scholar] [CrossRef]
Figure 1. The fracture test specimen: (a) principle of wedge splitting test method; (b) the dimension of the specimen.
Applsci 10 04734 g001
Figure 2. The fracture experiment set-up.
Applsci 10 04734 g002
Figure 3. Load-crack mouth opening displacement (CMOD) curves under dry environments with different temperatures: (a) at 5 °C; (b) at 20 °C; (c) at 40 °C; (d) at 60 °C.
Applsci 10 04734 g003
Figure 4. Fracture energy for concrete exposed to dry environments with different temperatures.
Applsci 10 04734 g004
Figure 5. Effective fracture toughness for concrete exposed to dry environments with different temperatures.
Applsci 10 04734 g005
Figure 6. The fracture surface of concrete at different ages: (a) at 3 d; (b) at 60 d.
Applsci 10 04734 g006
Figure 7. The fracture surface of concrete at different temperatures: (a) at 5 °C; (b) at 60 °C.
Applsci 10 04734 g007
Table 1. Chemical composition of cementitious materials (weight/%).
CompositionCaOSiO2Al2O3MgONa2OSO3Fe2O3K2OOthers
Cement47.8725.1211.295.520.662.952.390.603.60
Fly ash3.2252.4329.011.080.750.439.371.362.35
Table 2. Mechanical properties of concrete under different temperature at 28 d.
Curing Temperature5 °C20 °C40 °C60 °C
Compressive strength (MPa)31.8334.6436.7936.44
Elastic modulus (GPa)23.3626.7229.2628.88

