Article

Ballasted Track Status Evaluation Based on Apparent Track Stiffness Index

Korea Railroad Research Institute (KRRI), 176, Cheoldobangmulgwan-ro, Uiwang-si, Gyeonggi-do 16105, Korea
*
Author to whom correspondence should be addressed.
Appl. Sci. 2020, 10(14), 4729; https://doi.org/10.3390/app10144729
Submission received: 5 June 2020 / Revised: 8 July 2020 / Accepted: 8 July 2020 / Published: 9 July 2020
(This article belongs to the Special Issue Monitoring and Maintenance Systems for Railway Infrastructure)

Abstract

:
Currently, maintenance work for ballasted track is performed based on the Track Quality Index (TQI) without a fundamental cause investigation for track irregularity. In this study, a new evaluation standard for ballasted track status is proposed to overcome the limitations of current maintenance work. The new evaluation standard is based on the stiffness index. The stiffness index is defined as the difference between the average and standard deviation of the apparent track stiffness determined by a light falling weight deflectometer (LFWD). After some field tests and analysis, it is shown that the stiffness index has a strong correlation not only with TQI but also with maintenance history. In verification results, the new evaluation standard estimated the ballasted track status quite well.

1. Introduction

Ballasted track has the advantages of low initial construction cost, low noise and vibration, and flexible handling of ground settlement. However, differential settlement can occur in ballasted track because this type of track is prone to plastic deformation, which leads to track irregularity and requires periodic maintenance. The first stage of Gyeongbu high-speed railway, i.e., the Gwangmyeong–Dongdaegu section, was constructed with ballasted tracks. Fifteen years have passed since Korea Train eXpress (KTX) opened, and with the increase in the train passing tonnage following the opening of the Super Rapid Train (SRT), the maintenance cycle of the ballasted track has become shorter and the associated costs have increased.
The maintenance of high-speed rail ballasted tracks in South Korea is performed based on the amplitude of track irregularities. The Railway Track Maintenance Guidelines [1] prescribe obtaining monthly measurements of track irregularities such as vertical track irregularity, cross level irregularity, twist, and gauge irregularity using a track inspection vehicle with versine method for a chord of a certain length. In high-speed rail, the control standard is set by measuring versine for 10 m and 30 m chords. In addition to the track irregularity amplitude, the Track Quality Index (TQI) is used as a measure to evaluate the quality of the overall track geometry. TQI is the standard deviation calculated over a 200 m long section of the track irregularities. It can be regarded as a statistical expression of the differential settlement of the track over a certain section.
TQI is not a fundamental countermeasure against the cause of ballasted track deterioration, only a follow-up measure to the final differential settlement. When maintenance work is performed on a section with a significant TQI, although the TQI value of the section decreases, the abrasion of the ballast increases. Abraded ballast aggregates expedite track irregularity; thus, maintenance work is performed to reduce it, and the abrasion of the ballast increases further. As this phenomenon is repeated, a problem occurs in that the maintenance cycle for a specific section becomes increasingly short. In this context, the train may even derail in serious cases when timely maintenance work cannot be performed.
Vertical track irregularities occur owing to the differential settlement of ballasted tracks. The irregularity can be predicted well in time if the settlement of ballasted tracks can be predicted. It is known that determinants including ballast condition, track stiffness, and external load affect the settlement of ballasted tracks. Ballast fouling affects the railroad effectiveness and structural capacity [2,3]. Ballast particle size distribution and the number of load cycles cause ballast deformations [4]. Axle loads and train speed lead to ballast track deformation. The conditions of all layers under the sleepers (i.e., ballast thickness, ballast fouling, sub-ballast properties, etc.) affect the quality of ballast railway tracks [5]. Track stiffness directly influences the ballast settlement [6]. Of these, the stiffness of the ballasted track is directly related to the behavior of the track. This aspect has been researched actively. Lichtberger [7] suggested that the settlement progress rate is inversely proportional to the square of the vertical track rigidity, and that the standard deviation of the longitudinal level of track irregularity is inversely proportional to the track stiffness. Milosavljevic [8] compared and reviewed track irregularity prediction models and concluded that vertical track stiffness has a direct effect on track irregularity. Puzavac et al. [9] reported through a literature review that track stiffness is dominant in track behavior, and that maintenance by tamping, etc., without a cause analysis for track irregularity is only a short-term solution and induces an increase in maintenance costs in the long run. In the European research project (EUropean Research to Optimise BALlasted Track, EUROBALT) [6] for the improvement of the design, construction, and maintenance efficiency of ballasted tracks, optimal track stiffness was proposed based on the correlation between track stiffness and the standard deviation of track irregularity. Berggren [10] also developed a measurement vehicle for continuous ballasted track stiffness evaluation. In Japan, track stiffness was measured using a falling weight deflectometer (FWD) in a sleeper [11].
In Korea, ballast compaction is performed using equipment such as multiple tie tampers during track laying and maintenance to ensure sufficient stiffness [1]. Kim et al. [12] used ground-penetrating radar and a light falling weight deflectometer (LFWD) on the Gyeongbu line to evaluate the adequacy of the ballasted track maintenance work. Choi et al. [13] evaluated the apparent stiffness of ballasted track by applying a load to the sleeper using the LFWD while the sleeper was connected. They reviewed the applicability of the apparent stiffness as an index to represent the ballasted track status. The apparent track stiffness is a ratio of the maximum displacement to the maximum load that occurs in the sleeper. The apparent track stiffness is a concept different from the general track stiffness in the case of a hanging sleeper. The sleeper is connected to rail during testing; thus, the apparent track stiffness cannot include the effect of the ballast and subgrade layers. In spite of this limitation, the apparent stiffness measurement using LFWD was found to be simple to measure and easy to carry; moreover, it can better represent the track condition for a train passing.
In this study, we propose a new evaluation standard for ballasted track status to overcome the limitations of the existing maintenance work that has been performed based on TQI without a fundamental cause investigation for track irregularity. The new ballasted track status evaluation standard is based on apparent track stiffness; this is related to track stiffness, which affects track irregularity directly. The concept of the stiffness index, defined as the difference between the average and standard deviation of apparent track stiffness, is introduced, and the correlation among the stiffness index, TQI, and cumulative tamping length is analyzed to propose an evaluation standard for the ballasted track status based on the stiffness index.

2. Main Concepts

2.1. Apparent Track Stiffness

2.1.1. Light Falling Weight Deflectometer (LFWD)

The LFWD is a portable, simplified version of the FWD to measure the displacement and load (refer to Figure 1). A geophone and load cell are in the LFWD unit. So, the displacement and external load at the sleeper can be measured using them. The elastic modulus or stiffness of the ground can be calculated from the load and displacement. The elastic modulus is directly linked to the bearing capacity and compaction of the roadbed or used to evaluate the stiffness. Choi et al. [13] applied LFWD to ballasted tracks and used it to evaluate the stiffness of the ballasted track. The stiffness is the so-called apparent track stiffness (kap), expressed as Equation (1), because displacement is measured by applying load to the sleeper while the sleeper and fastener are connected. Figure 1a,b shows the LFWD equipment and field test, respectively, and Figure 1c illustrates the load and displacement measured using LFWD. For a hanging sleeper, the displacement measured reflects the hanging level of the sleeper. That is, the hanging level is proportional to the displacement. Consequently, small apparent stiffness would indicate a hanging sleeper, whereas significant apparent stiffness can be classified as a supported sleeper.
k a p = P m a x δ m a x

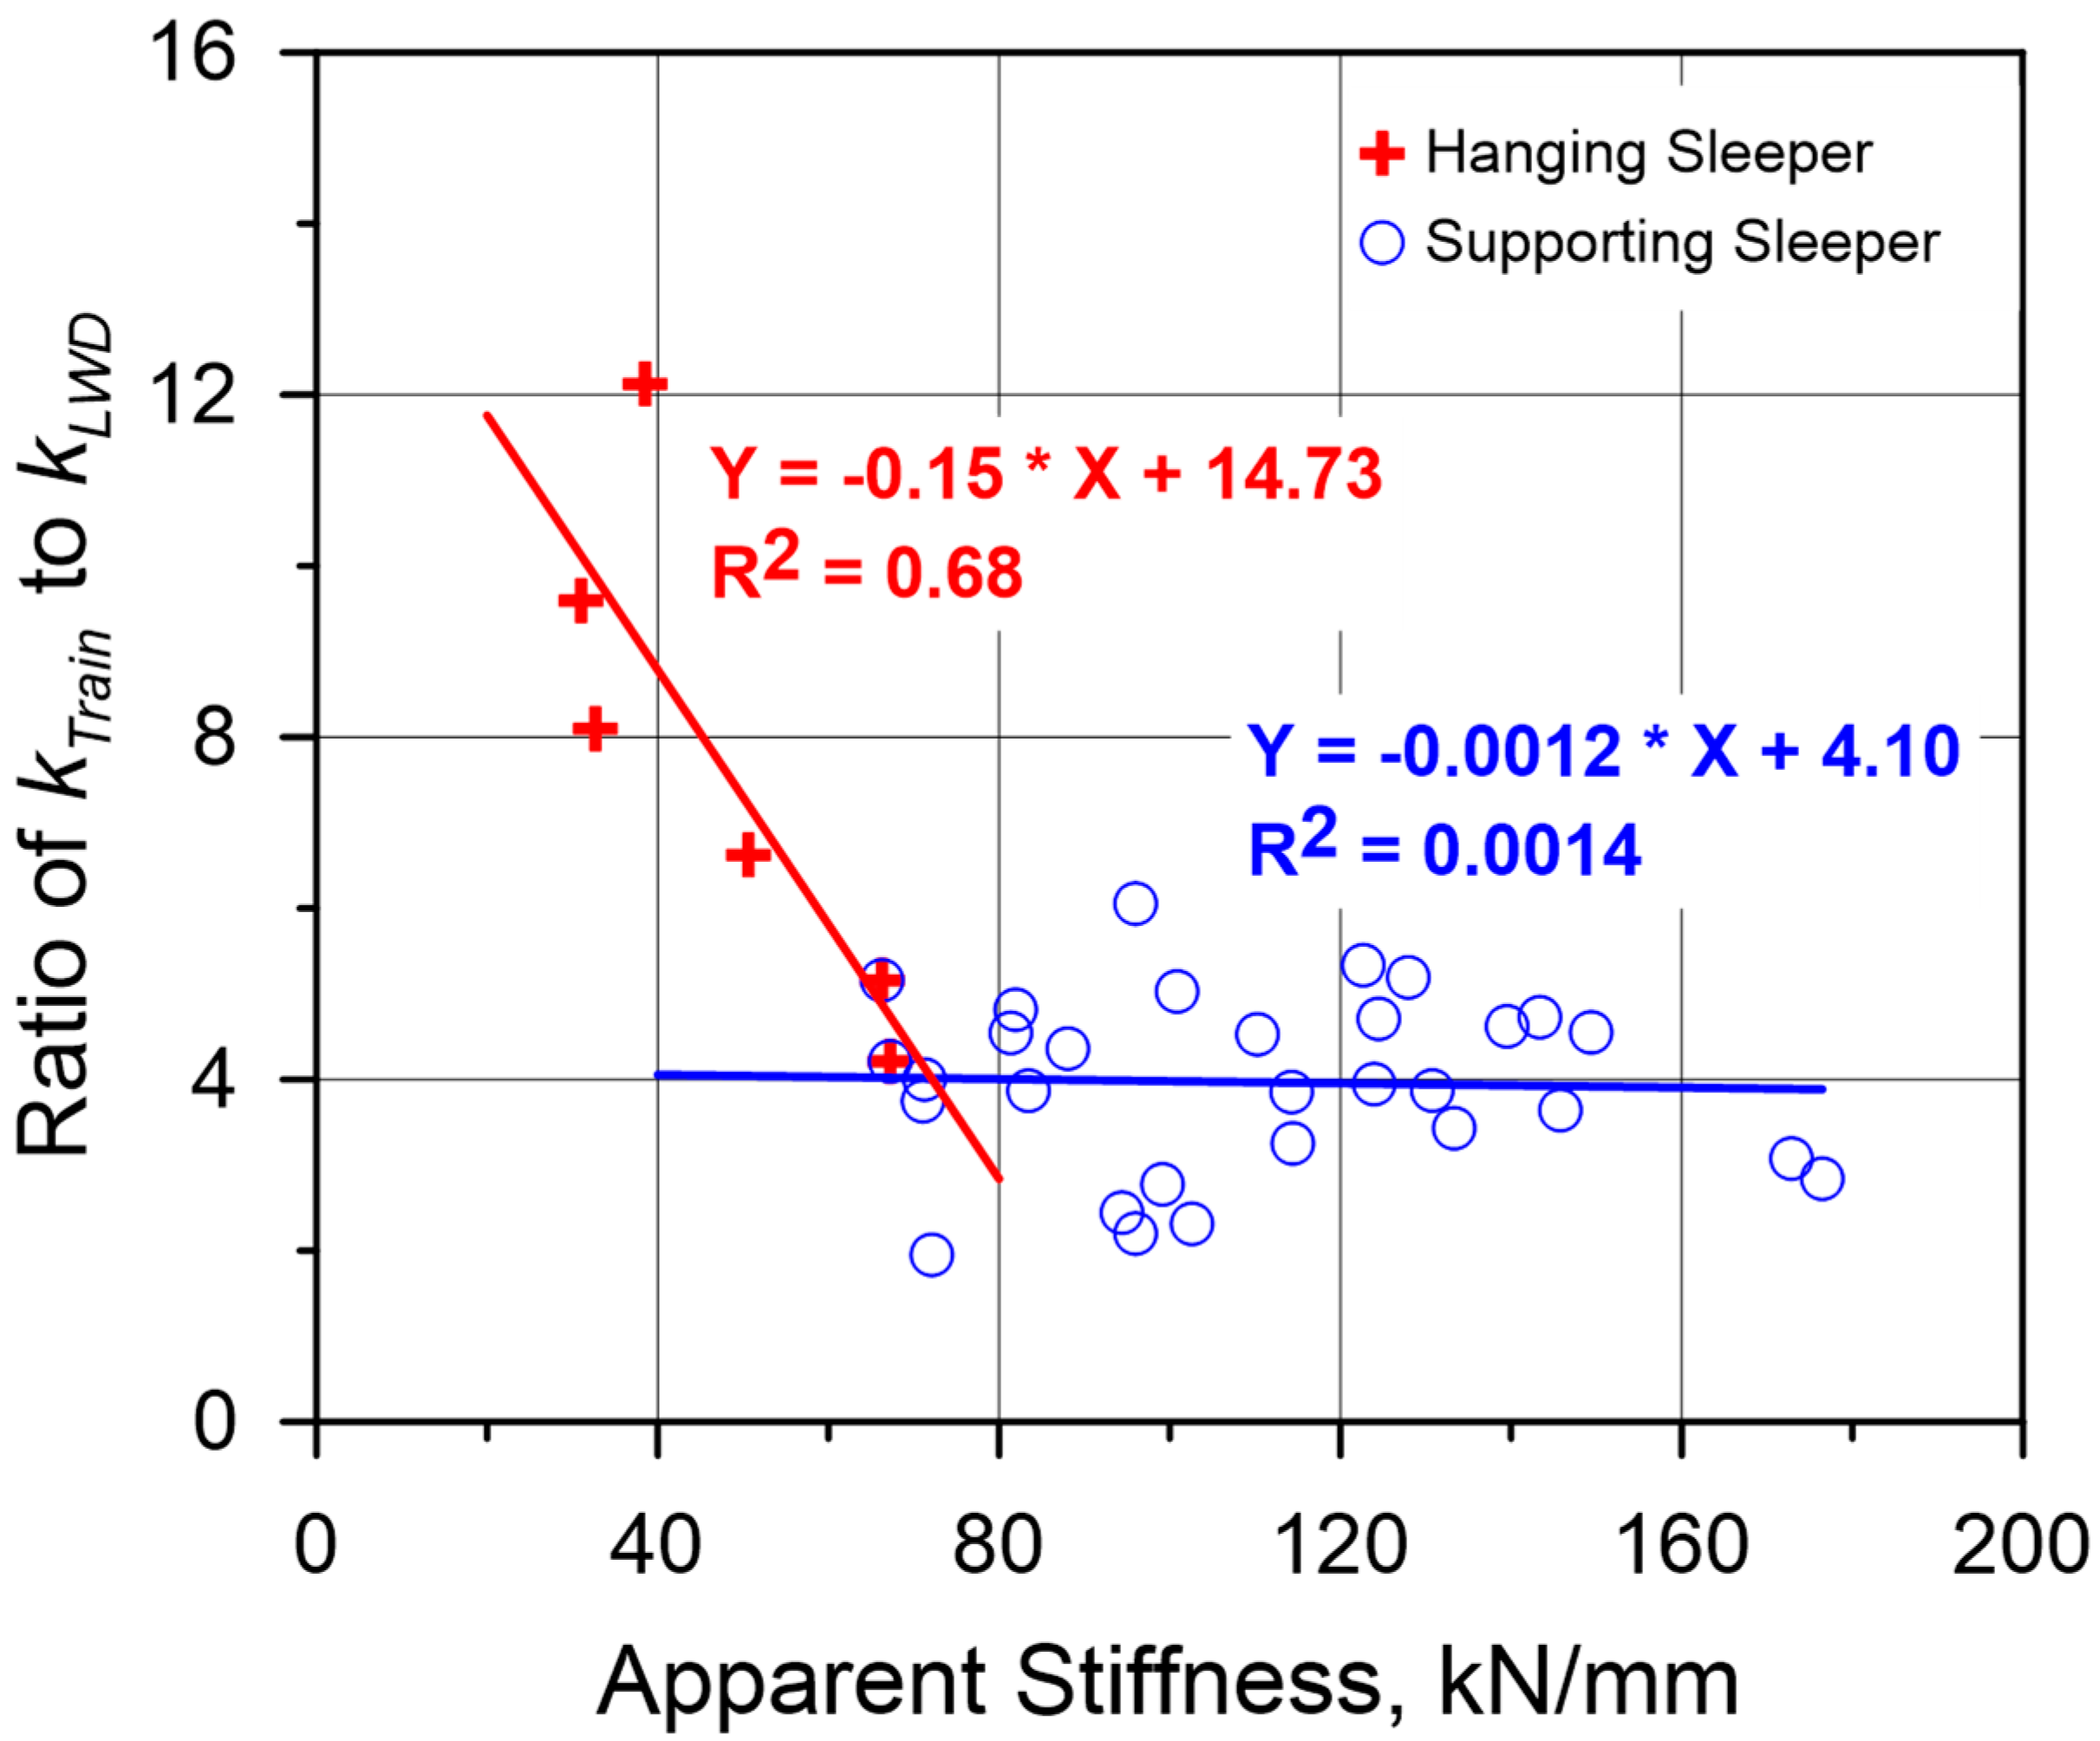
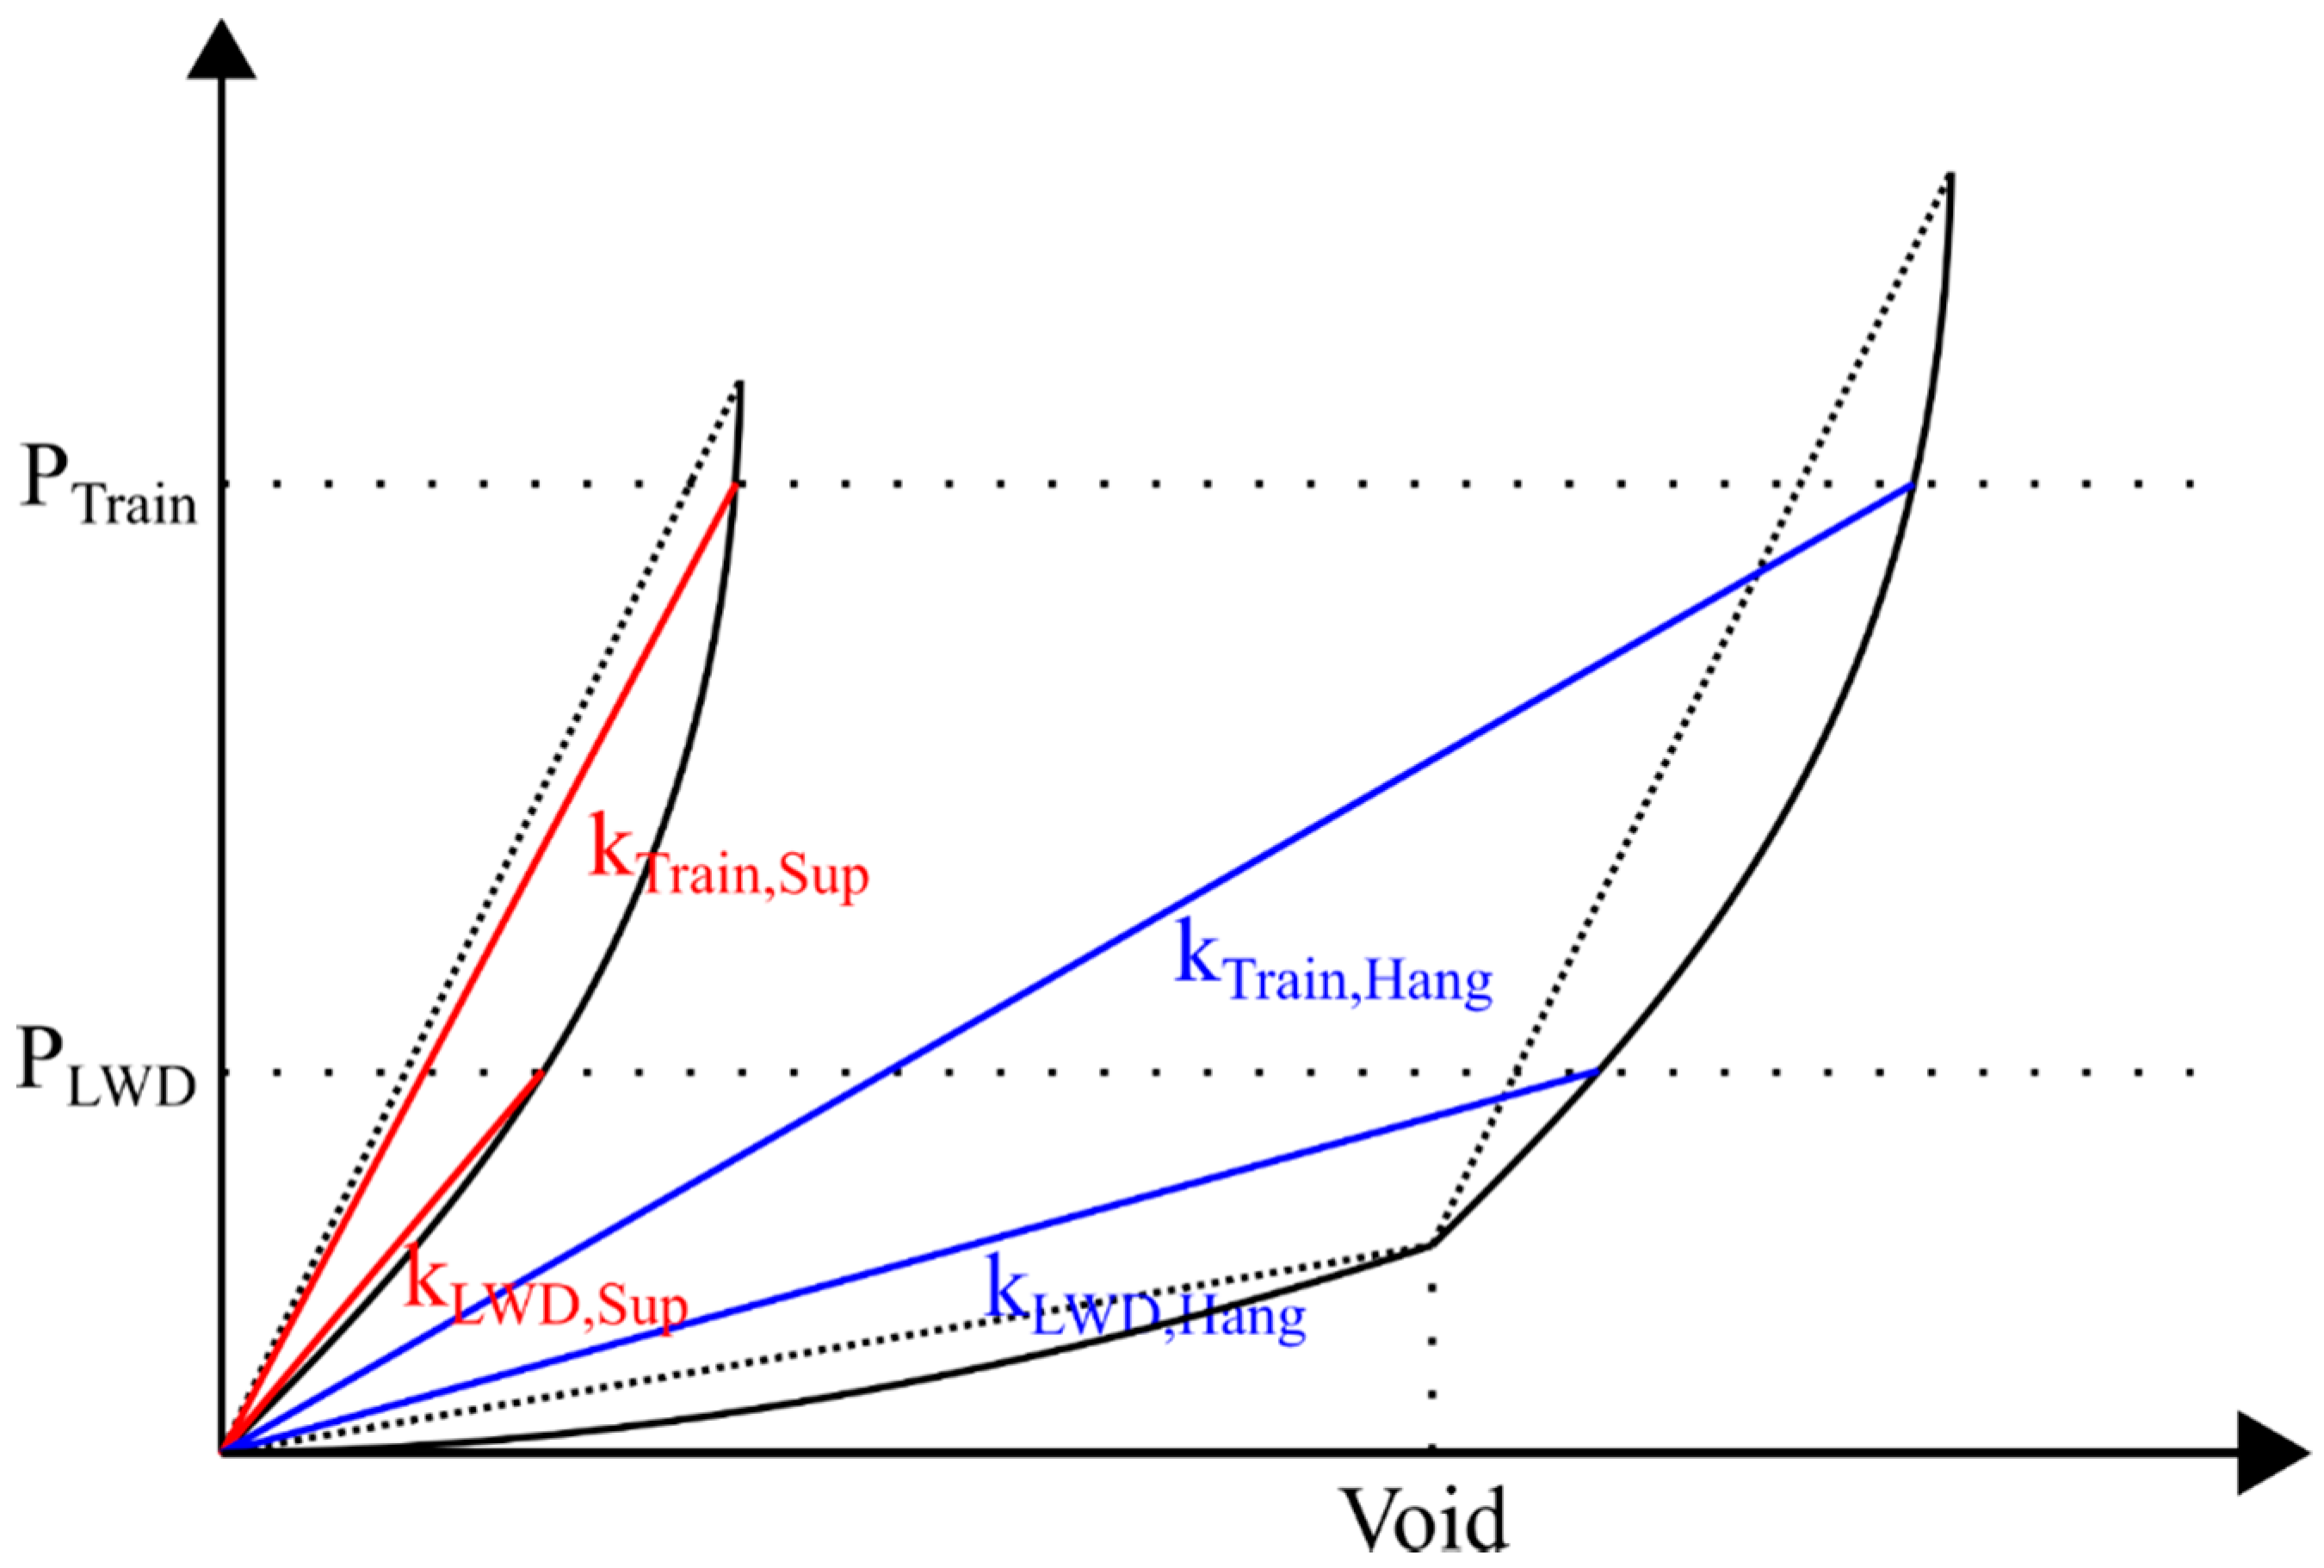
2.1.2. Classification of Supporting and Hanging Sleepers Using LFWD

Park et al. [14] measured and compared the apparent stiffness under the LFWD load (10 kN) and under train load (80 kN) to look into the effect of loading level on track stiffness. The apparent stiffness under train load was calculated using the ratio of the maximum train wheel load measured between sleepers to the maximum sleeper displacement. The comparison between the stiffness values (kTrain/kLWD) resulted in a significant correlation. Figure 2 shows the result of calculating the ratio of the two sets of apparent stiffness. In the graph, the x-axis is the apparent stiffness measured by the LFWD and the y-axis is the ratio between the stiffness values (kTrain/kLWD). As can be seen from the graph, the sleepers could be divided into two groups based on the stiffness measurement: supporting sleepers which have relatively great stiffness and hanging sleepers which have relatively smaller stiffness. The ratio appears to be constant at about 4 for the relatively great stiffness, whereas the ratio increases as the apparent stiffness decreases for relatively smaller apparent stiffness. That is, the ratio is distributed like a bi-linear function. This is because as the degree of sleeper hanging increases, the difference in the stiffness based on the load size also increases [15]. Figure 3 shows the load–deflection characteristics of ballasted track. In the case of a supporting sleeper, which means there is no void under the sleeper, the difference according to load level (kTrain,Sup/kLWD,sup) is small. In the case of a hanging sleeper, which means there is a void under the sleeper, the bigger the void, the bigger the difference according to load level (kTrain,Hang/kLWD,Hang).
In Figure 2, when the sleepers are divided into hanging and supporting sleeper groups, a trend line for each group can be drawn. R2 is the coefficient of determination. The R2 of the hanging sleeper group was 0.68. This means that the ratio of ktrain to kLWD could be calculated with a probability of 68% when using the apparent stiffness kLWD and trend line. On the other hand, the R2 of the supporting sleepers was 0.0014. This very low R2 value indicates that ktrain is almost independent of kLWD for supporting sleepers. The ratio of ktrain to kLWD is about 4 regardless of the apparent stiffness kLWD. The two trend lines (i.e., hanging sleepers and supporting sleepers) intersect at apparent stiffness of 70 to 80 kN/mm.

2.2. Field Test

2.2.1. Field Test Overview

The apparent stiffness was measured using LFWD at the current high-speed railway track site. The details of the field test are listed in Table 1. Field tests on the operating line can be performed only at night when no trains are running. Furthermore, considering the overlap with other maintenance work and the safety protocol needed in the field, the time window to perform the test was very limited. Given these temporal and spatial limitations, the field test location was selected while ensuring that the bridge, earthwork, and tunnel were located a small distance from one another.

2.2.2. Apparent Stiffness Distribution Characteristics

A total of 7994 sleepers were tested. The results showing the relative frequency by size of the apparent stiffness are presented in Figure 4. The relative frequency graph is displayed in the form of a bimodal distribution with two peak points. The ballasted track sleepers are divided into hanging and supporting sleepers based on the size of the apparent stiffness. Therefore, the distributions indicating the hanging sleeper sections with small apparent stiffness and the supporting sleeper sections with significant apparent stiffness were combined to show the resulting bimodal distribution.
As mentioned earlier, the apparent stiffness by LFWD reflects not only the track stiffness but also substructure characteristics. Therefore, the distribution characteristics of the apparent stiffness may vary depending on the substructure. The relative frequency by apparent stiffness was classified by substructure and illustrated in a graph. For earthwork, the bimodal distribution was clearly shown, whereas at the bridge, the hanging sleeper group vaguely showed a unimodal distribution. In the tunnel, the hanging and supporting sleeper groups were not as clearly distinguished as in the earthwork; however, they still appeared in the form of a bimodal distribution and distributed over a wider area than did those for the earthwork.
Table 2 lists the number of sleepers for which the apparent stiffness was measured at each substructure, the calculation of the average apparent stiffness, and the standard deviation. As can be seen from the data in the table, the average magnitude of the apparent stiffness was in the order of tunnel > bridge > earthwork. In the tunnel, the average apparent stiffness and the standard deviation were the largest. In the earthwork, the hanging and supporting sleeper groups are combined as a bimodal distribution. Therefore, the average apparent stiffness is smaller and the standard deviation is slightly larger than those for the bridge, which is in a unimodal distribution.
The apparent stiffness reflects not only the track stiffness and substructure characteristics but also the degree of sleeper hanging. Therefore, to investigate the effect of the substructure on the magnitude of the apparent stiffness, the average and standard deviation were calculated only for the supporting sleeper. The results are listed in Table 3. The supporting sleeper was set as a sleeper having an apparent stiffness of 80 kN/mm or more. When the earthwork and bridge were compared, it was found that the average and standard deviation of the bridge were slightly larger. In addition, the tunnel was clearly distinguished from other structures, showing the largest average and standard deviation. The same conclusion was drawn from the results of estimating the population mean considering the number of sleepers at each substructure. The 95% confidence interval of the population mean from the sample mean and sample standard deviation for each substructure was found to be 132 to 135 kN/mm in the earthwork, 135 to 138 kN/mm in the bridge, and 174 to 182 kN/mm in the tunnel. In general, the value of the substructure stiffness of the ballasted track was in the order of tunnel > bridge > earthwork. Therefore, it can be speculated that the apparent track stiffness reflects the stiffness of not only the ballasted track but also the substructure. However, further analysis is needed on how the substructure affects apparent stiffness.
Table 4 lists the results of comparing the numbers of supporting and hanging sleepers for each substructure. The ratio of the numbers of supporting sleepers and hanging sleepers is 1:0.67 for earthwork, 1:0.27 for the bridges, and 1:0.27 for the tunnels. As mentioned earlier, owing to space–time limitations, the tests were performed mainly on sections where the bridge, earthwork, and tunnel are all adjacent. In general, for bridge–earthwork and earthwork–tunnel joints, the stiffness of the lower part constantly changes; therefore, these parts tend to be structurally vulnerable, and a majority of hanging sleepers are seen in this type of location. This could be the reason why the ratio of hanging sleepers in earthwork is relatively high.
For bridges or tunnels, considering that the number of tests performed at the center of these parts was relatively small owing to space–time limitations, the ratio of hanging sleepers in the entire section of the bridge or tunnel is considered to be smaller than the calculation result in this study. This indicates that maintenance of bridges or tunnels is required mainly for the connection parts where the hanging sleepers show intensive distribution. Furthermore, earthwork has relatively evenly distributed hanging sleepers, which implies that maintenance is required over a wide area of earthwork.

3. Ballasted Track Status Test Indicator

3.1. Apparent Track Stiffness vs. TQI

The apparent stiffness average and standard deviation in the measurement section were used to determine the usability of the apparent track stiffness as an indicator of track status.
The status of each sleeper can be distinguished between the supporting and hanging sleepers using the value of the apparent track stiffness for each sleeper. The apparent stiffness average should be used to evaluate the overall status of the ballasted track in a specific section. The larger the apparent stiffness average, the better the overall track quality of the section.
Another indicator of the ballasted track status in a specific section is the standard deviation of apparent stiffness. The apparent stiffness standard deviation indicates how uniform the track quality is in the measurement section. When the standard deviation is significant, the relative difference in track quality for each sleeper is significant; when the standard deviation is small, the relative difference is small.
To verify the usability of apparent stiffness as a track status evaluation index, its correlation with TQI was analyzed. TQI is the standard deviation of vertical track irregularity and is an index that can quantitatively indicate the overall track status of a specific section. According to the Railway Track Maintenance Guidelines [1], track maintenance is divided into five steps by the absolute value difference between the reference line and the vertical track irregularity measurement or the standard deviation of the vertical track irregularity in a 200 m section. It can be said that the difference in the absolute value between the reference line and the vertical track irregularity measurement reflects the individual sleeper status rather than the overall track status within a specific section. Because the standard deviation of vertical track irregularity can be said to reflect the overall track status in the measurement section, we used TQI, the standard deviation of vertical track irregularity, to analyze the correlation with the apparent stiffness mean in this study. Because TQI is measured on the left and right rails, the average value of TQI calculated at the left and right rail positions was calculated as the representative TQI of the section. In Korea, track irregularity is measured once a month using a comprehensive track recording car. Because the date on which the measurement was obtained and the date on which the LFWD test was performed were not exactly the same, the data measured by the comprehensive track recording car at the LFWD measurement time and the closest matching time were used to calculate TQI.
Figure 5 depicts the correlation between apparent stiffness and TQI. In the figure, R2 is the coefficient of determination. R2 is between 0 and 1; as R2 gets closer to 1, the two variables become more dependent. As a result of comparing the apparent stiffness average and TQI, the overall correlation was found to be very low, with R2 of 0.23. As seen already, it is more appropriate to compare the average and TQI by substructure classification because the apparent stiffness distribution characteristics are different for each substructure. As a result of the comparison with categorization by substructure, the R2 value was 0.30 for earthwork, 0.10 for bridges, and 0.58 for tunnels. The tunnels showed some correlation, whereas the earthwork and the bridges showed low correlation. As a result of comparing the standard deviation of apparent stiffness and TQI, it was found that there was even less correlation for the standard deviation than for the mean.

3.2. Apparent Track Stiffness vs. Cumulative Tamping Length

The cumulative tamping length is the total length of the compaction work performed by equipment or human resources in a target section during the analysis period. For the ballasted track of the Gyeongbu high-speed rail, frequent maintenance (tamping) is being performed except for on some sections that are in good condition. It can be said that ballasted track status evaluation is required in the normal–bad areas that require maintenance more often than the good areas that do not require maintenance. However, track irregularity measured in these sections is significantly affected by maintenance. Therefore, the cumulative tamping length was used as another indicator to represent the current track status. It was necessary to normalize the cumulative tamping length because the section length where LFWD measurement was performed was different. Its correlation with apparent track stiffness was analyzed using the converted cumulative tamping length, a value obtained by dividing the cumulative tamping length of each section by the length of the corresponding section, followed by another division by the total period of data collection (2011–2018).
Figure 6 depicts the correlation between apparent stiffness and cumulative tamping length. As in the correlation analysis of apparent track stiffness and TQI, there is no clear correlation between the apparent track stiffness mean or standard deviation and cumulative tamping length (2011–2018). In the tunnels, R2 was 0.54, which is relatively high; in the earthwork and bridges, the values were smaller at 0.45 and 0.29, respectively. The correlation with the standard deviation of apparent stiffness was also found to be low. This relatively low correlation indicates that the apparent stiffness could affect the ballast track behavior; that is, various factors play a role in ballast track deterioration. The average and standard deviation of the apparent stiffness would be a relative weak index to represent ballast condition. Therefore, a better index was investigated in the following section.

3.3. Track Stiffness Index

Based on the analysis of the correlation between the apparent stiffness average and standard deviation, TQI, and cumulative tamping length, it was concluded that the average apparent stiffness or standard deviation could not be used as a status evaluation indicator. For the mean, it can be said that there was some correlation in the tunnels; however, there was low correlation in the earthwork and bridges. For the standard deviation, there was no direct correlation in any section.
Although the standard deviation was not directly related to track quality, it was judged that the track quality could be represented well if the standard deviation was combined with the apparent stiffness average. The larger the average and the smaller the standard deviation, the more evenly distributed the supporting sleepers, indicating better quality of the track. In addition, when the mean of the apparent stiffness is small and the standard deviation is relatively large, there are more hanging sleepers than supporting sleepers. Therefore, the concept of the track stiffness index, which can represent the track status by simultaneously considering the average and standard deviation of the apparent track stiffness, was introduced. The track stiffness index is defined as the difference between the average and standard deviation of the apparent track stiffness. As per this definition, the track status is good when the average is significant (e.g., 100 kN/mm or greater) and the standard deviation is small, and the track status is bad when the average is small and the standard deviation is relatively larger.
S t i f f n e s s   I n d e x = α · A v e r a g e ( 1 α ) · S D
Because the effects of the average and standard deviation on track status evaluation are different, each factor is multiplied by a weight. To derive the track stiffness index that has the largest correlation with TQI and cumulative tamping length as a track status evaluation index, the weight α of the average was changed in the range from 0.5 to 1, and the correlations with TQI and cumulative tamping length were compared and represented in Table 5. The result of the comparison of the correlation coefficient with the apparent stiffness average is shown in Figure 7. As can be seen from the graph, the correlation coefficient between the stiffness index and TQI increases until α is 0.6 and then decreases gradually. In addition, the correlation coefficient between the stiffness index and tamping length decreases slightly when α is 0.5 and then increases gradually; however, the increase is smaller than that in TQI. Therefore, when α was 0.6, the track stiffness index was determined to be the most suitable to be used as the track status evaluation index.
The results are shown in Figure 8 and Figure 9. Based on the analysis of the correlation between the track stiffness index and TQI, it can be observed that R2 is significantly increased compared with the case of using the average alone. For the earthwork and tunnels, the correlation coefficients increased significantly to 0.58 and 0.61, respectively. However, regardless of the substructure, the result of analyzing the correlation at once showed R2 values as small as 0.39, which means that it is appropriate to analyze the correlation by substructure categorization because the characteristics of the substructure are reflected in the apparent track stiffness as described above. For the bridges, R2 slightly increased to 0.24, although the correlation was still very low.
Based on the correlation between the track stiffness index and cumulative tamping length, the results of analyzing all the data at once showed a very low correlation. Furthermore, compared with the case of using the average alone, it was confirmed that the R2 value of bridges rose significantly to 0.50. In contrast, the R2 of the earthwork rose slightly to 0.48 and that of the tunnels decreased slightly to 0.45. In the case of tunnels, the number of field test locations was relatively small in comparison with others. More field tests are needed to develop a more accurate correlation.

4. Track Status Evaluation Based on the Track Stiffness Index

4.1. Track Status Evaluation Standard

As described already, track irregularity management standards are proposed in the Railway Track Maintenance Guidelines of the Korea Rail Network Authority [1]. Among them, management standards for the standard deviation of vertical track irregularity are divided into three stages (see Table 6).
Track status can be classified based on the track stiffness index using the TQI standard presented in the Railway Track Maintenance Guidelines. For the TQI standard value, the limit values are presented only for the following three types: construction value, target value, and warning value. Most ballasted tracks typically in use for high-speed rails are considered to have TQIs between the target value and warning value. Therefore, the track status was divided into five levels for a deeper and more detailed classification of the section. Level 1 indicates significantly good status, with the score corresponding to the construction value. Level 2 indicates good status, with the score corresponding to the target value. This is the standard required after maintenance work. Level 3 indicates normal status, which allows for routine operations. Level 4 indicates bad status and is a level below the warning stage. This level requires continuous monitoring of the track status. Finally, Level 5 indicates significantly bad status of the track. It corresponds to the warning value. Therefore, Level 5 status of the track calls for immediate actions to be taken to restore the track status to the target level.
In Section 3, it was reported that there was a significant relationship among the track stiffness index, TQI, and cumulative tamping length. Therefore, after deriving the track stiffness index value according to the TQI criteria, the track status evaluation standard based on the track stiffness index and cumulative tamping length is presented in Table 7.

4.2. Track Status Evaluation Standard Verification

Based on an additional field survey, the track status evaluation standard based on the track stiffness index was verified. The site where the verification was performed was a section that had never been field tested before. The section had two earthwork structures and one bridge. For each section, Table 8 lists the measured apparent stiffness result from the field test, track measurement data, TQI, and cumulative tamping length derived from the maintenance data. Next, the track status was classified based on the data. As can be seen from the data in the table, the track status of the earthwork based on the track stiffness index and that based on TQI were consistent. However, the track status of the bridge based on the track stiffness index was worse. As seen earlier, this difference is attributed to the fact that the bridges had a significantly smaller correlation between the track stiffness index and TQI than did the earthwork or tunnels. Based on the comparison of the track status based on the track stiffness index and cumulative tamping length, it was found that the bridges showed consistency; however, the earthwork showed consistency at one location only. This discrepancy occurred because the correlation between the track stiffness index and cumulative tamping length was not significantly high. Therefore, it is thought that if additional data, including additional field survey sections, can be accumulated, the accuracy of the track status evaluation can be improved.

5. Conclusions

In this study, the apparent track stiffness measured using LFWD and a track stiffness index combining the mean and standard deviation of the apparent track stiffness were introduced to propose a new track status evaluation standard. The correlations between the track stiffness index, TQI, and cumulative tamping length were analyzed. The conclusions are as follows:
  • The investigation of the apparent stiffness distribution for each substructure confirmed that not only the rail, sleeper, and track stiffness but also substructure characteristics were reflected in the apparent stiffness. Therefore, it is necessary to classify sections by substructure to evaluate the track status based on apparent stiffness.
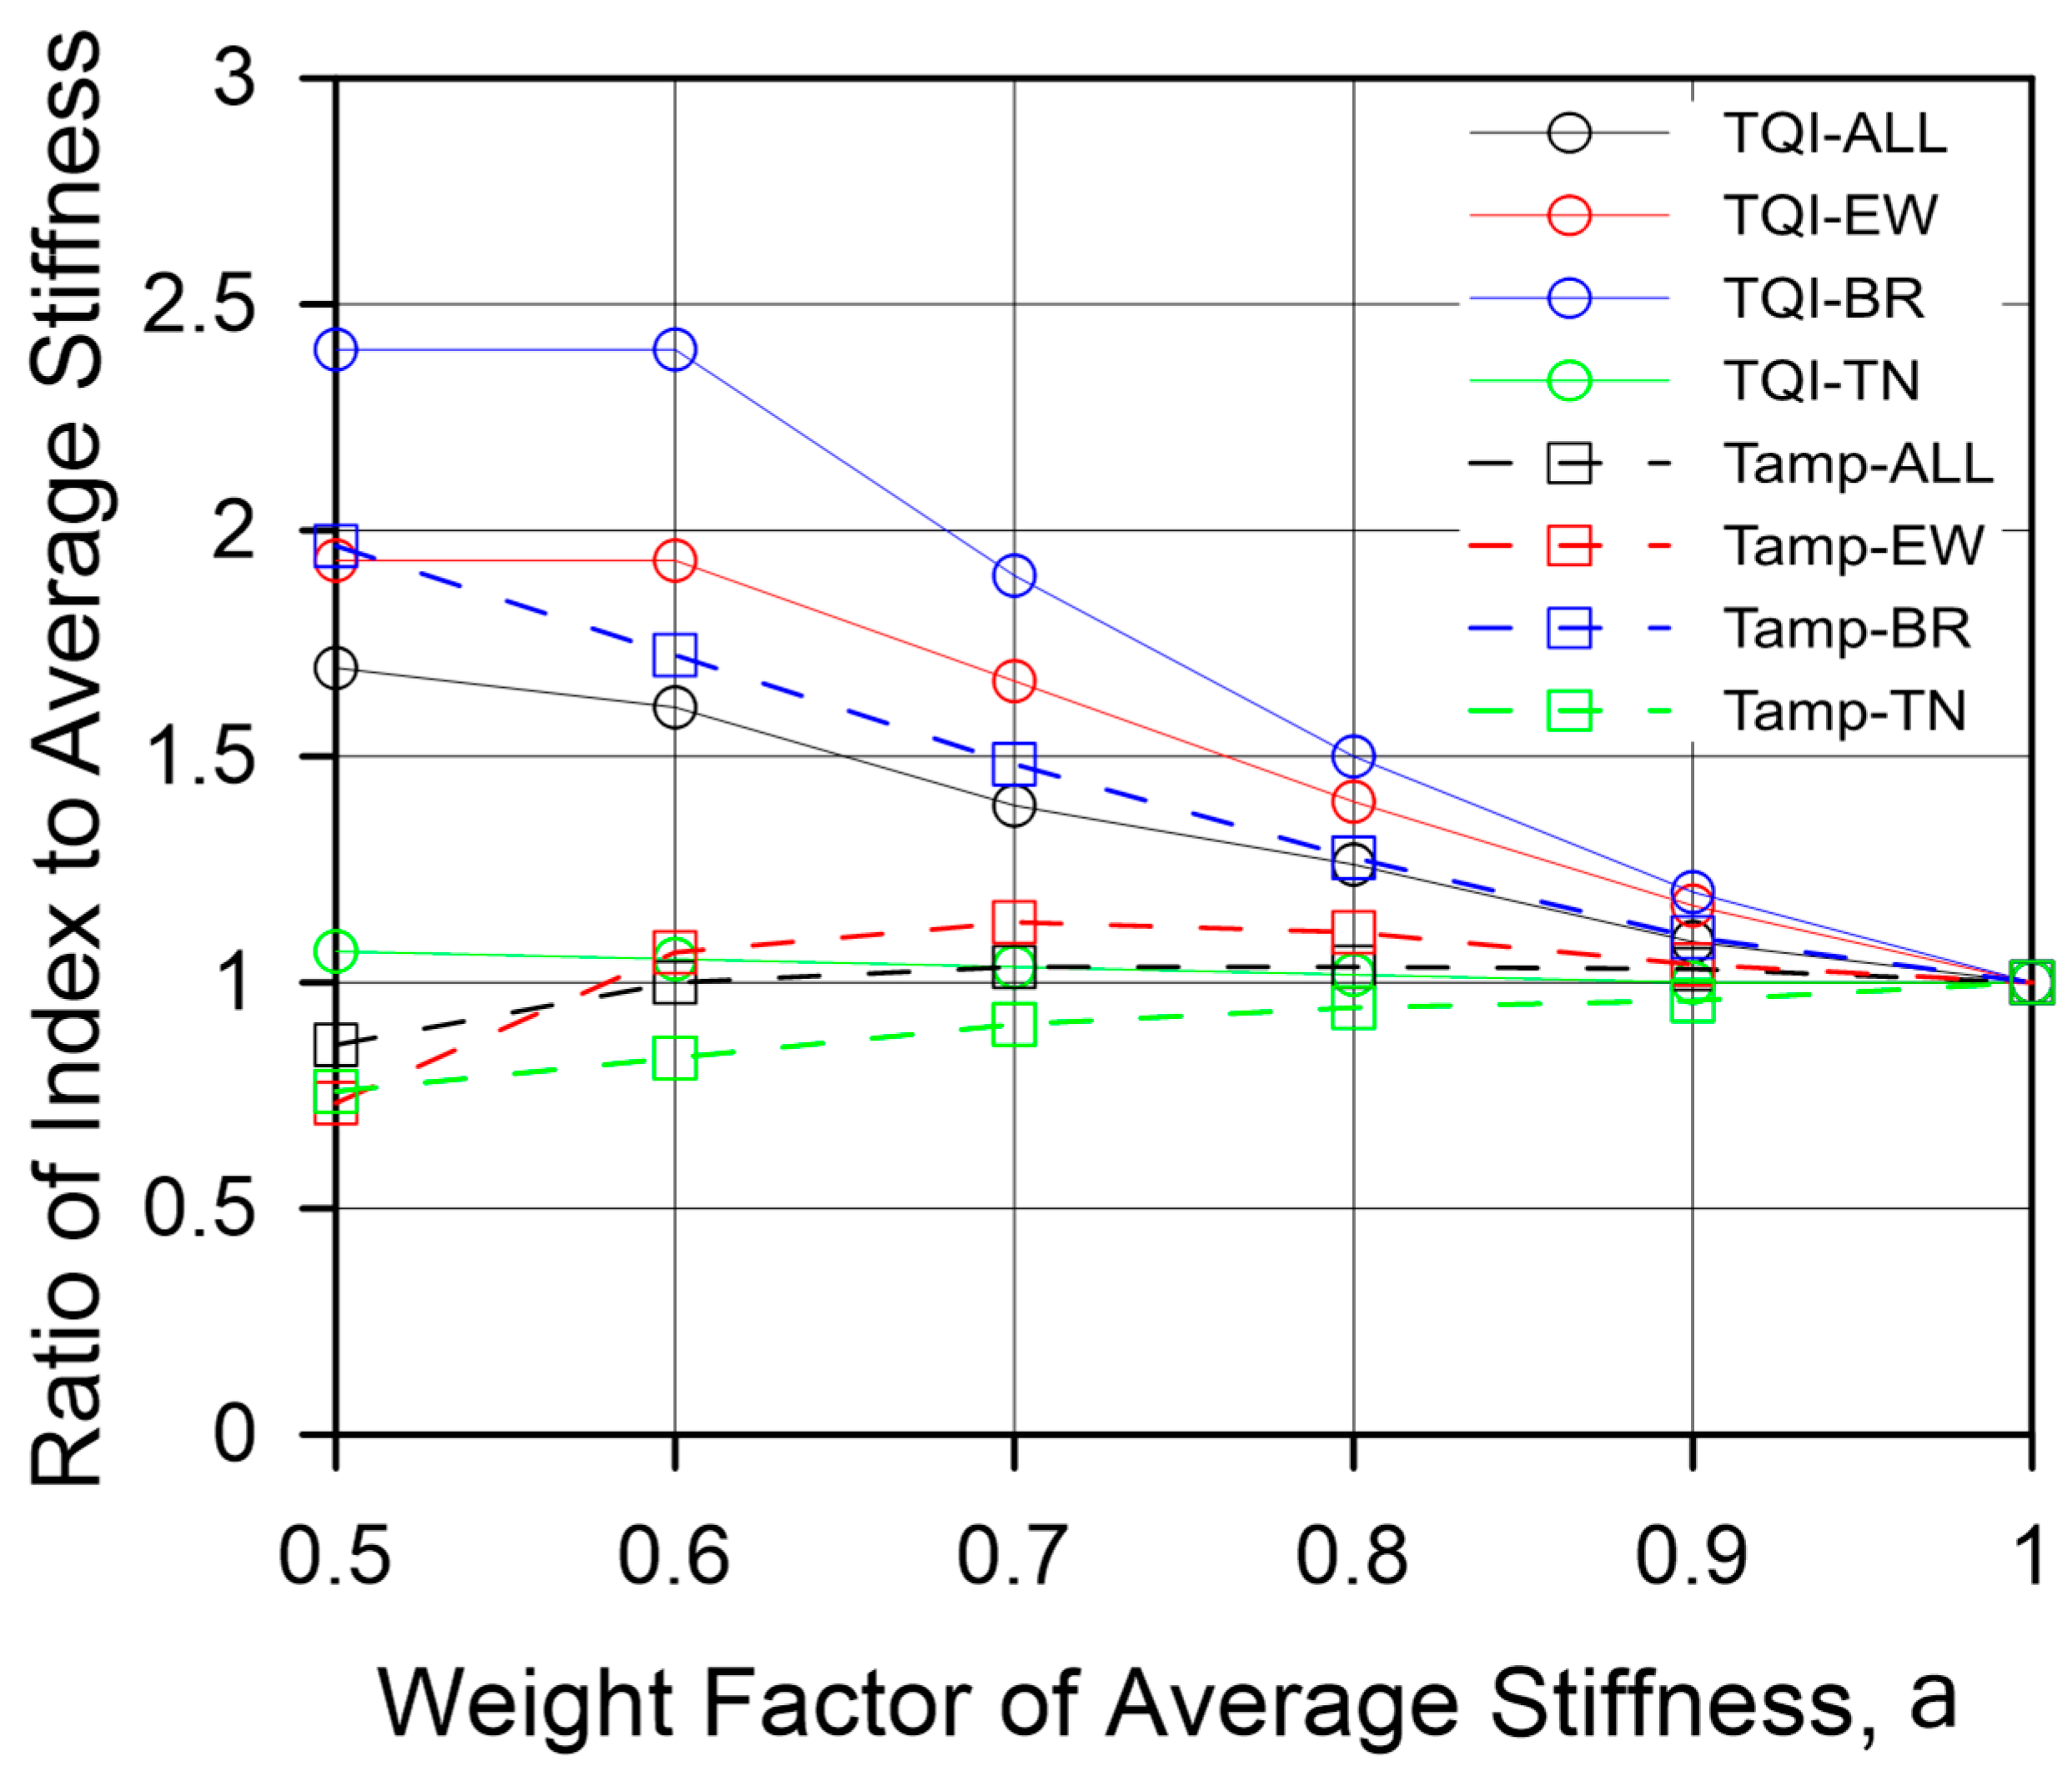
  • The correlation among the average apparent track stiffness, TQI, and cumulative tamping length was found to be very poor, whereas the correlation with the track stiffness index combining average and standard deviation was very high. Therefore, the average apparent track stiffness and standard deviation must be considered simultaneously to properly evaluate the status of the track.
  • Based on the track stiffness index, TQI, and cumulative tamping length correlation, the standards for evaluating the track status in terms of five levels using the track stiffness index were presented. The standards vary with the substructure type. For bridges, the stiffness index values for each level are 184, 128, 81, and 51 kN/mm. For tunnels, the stiffness index values for each level are 137, 87, 50, and 28 kN/mm. For earthwork, the stiffness index values for each level are 90, 67, 47, and 33 kN/mm.
  • Based on the verification of the evaluation standard presented on the basis of additional field surveys, it was found that the status of the track based on the track stiffness index and that based on the TQI showed consistency for the earthwork sections. For the bridges, the correlation between the track stiffness index and TQI was relatively low, and the evaluated track status was also inconsistent.
  • On the other hand, the status of the track based on the track stiffness index and that based on the cumulative tamping length showed consistency for one of the earthwork sections and a bridge section. This means that the stiffness index can reflect not only TQI but also the cumulative tamping length. Besides this, it is thought that inconsistency can be overcome when the correlation increases by accumulating more data through additional field surveys.
The extent to which the characteristics of the substructures are reflected in the apparent stiffness has not been clearly defined in this study. Therefore, there is a disadvantage in that evaluation has to be performed for each substructure to obtain the status of the track. Further studies are need to clarify the mechanism of apparent stiffness so that a unified track status evaluation standard can be formulated for all substructures. More statistical analysis is needed to understand the nonlinearity and low correlation.

Author Contributions

Conceptualization, Y.-T.C., S.H.H.; data collection, B.P., Y.-T.C., S.H.H.; data analysis, B.P., Y.-T.C.; manuscript writing, B.P.; manuscript review and editing, Y.-T.C.; funding acquisition, S.H.H. All authors have read and agreed to the published version of the manuscript.

Funding

This research was supported by the Ministry of Science and Information and Communications Technologies, Korea.

Conflicts of Interest

The authors declare no conflict of interest.

References

  1. Korea Rail Network Authority. Railway Track Maintenance Guidelines; Korea Rail Network Authority: Daejeon, Korea, 2015. [Google Scholar]
  2. Leng, Z.; Al-Qadi, I.L. Railroad ballast evaluation using ground-penetrating radar: Laboratory investigation and field validation. Transp. Res. Rec. 2010, 2159, 110–117. [Google Scholar] [CrossRef] [Green Version]
  3. Zhang, Y.; Venkatachalam, A.S.; Xie, Y.; Wang, G.; Xia, T. Data analysis technique to leverage ground penetrating radar ballast inspection performance. In Proceedings of the IEEE Radar Conference, Cincinnati, OH, USA, 19–23 May 2014; pp. 463–468. [Google Scholar]
  4. Indraratna, B.; Khabbaz, H.; Salim, W.; Christie, D. Geotechnical properties of ballast and the role of geosynthetics in rail track stabilization. Proc. Inst. Civ. Eng. Ground Improv. 2006, 10, 91–102. [Google Scholar] [CrossRef] [Green Version]
  5. Smekal, A.; Berggren, E.G.; Silvast, M. Monitoring and substructure condition assessment of existing railway lines for upgrading to higher axle loads and speeds. In Proceedings of the 7th World Congress on Railway Research, Montreal, QC, Canada, 4–8 June 2006. [Google Scholar]
  6. Hunt, G.A. EUROBALT optimises ballasted track. Railw. Gaz. Int. 2000, 156, 813–816. [Google Scholar]
  7. Lichtberger, B. Track Compendium: Formation, Permanent Way, Maintenance, Economics; Eurail Press: Hamburg, Germany, 2005; pp. 48–54. [Google Scholar]
  8. Milosavljevic, L.; Popovic, Z.; Lazarevic, L. Track stiffness and the vertical track geometry deterioration modeling. Mech. Eng. 2012, 10, 157–162. [Google Scholar]
  9. Puzavac, L.; Popovic, Z.; Lazarevic, L. Influence of track stiffness on track behaviour under vertical load. Promet-Traffic Transp. 2012, 24, 405–412. [Google Scholar] [CrossRef]
  10. Berggren, E.G. Railway Track Stiffness: Dynamic Measurement and Evaluation for Efficient Maintenance. Ph.D. Thesis, KTH Royal Institute of Technology, Stockholm, Sweden, 2009. [Google Scholar]
  11. Furukawa, A. Recent tendencies in ballasted track maintenance. Q. Rep. Railw. Tech. Res. Inst. 2016, 57, 80–84. [Google Scholar] [CrossRef]
  12. Kim, D.S.; Kwon, S.S.; Lee, S.H.; Hwang, S.K.; Park, T.S. Study on the appropriateness of track maintenance works through the evaluation of trackbed conditions. J. Korean Soc. Railw. 2008, 11, 334–341. [Google Scholar]
  13. Choi, Y.T.; Hwang, S.H.; Jang, S.Y.; Park, B.; Shim, G.S. Evaluation of applicability of apparent track stiffness measured by light-weight deflectometer as a ballasted track condition index. J. Korean Geo-Environ. Soc. 2018, 19, 37–44. [Google Scholar]
  14. Park, B.; Choi, Y.T.; Hwang, S.H. Evaluation of apparent track stiffness according to loading level: Light-weight deflectometer and train loading. J. Korean Soc. Railw. 2018, 21, 690–700. [Google Scholar] [CrossRef]
  15. Sussmann, T.R.; Ebersohn, W.; Selig, E.T. Fundamental non-linear track load-deflection behavior for condition evaluation. Transp. Res. Rec. 2001, 1742, 61–67. [Google Scholar] [CrossRef]
Figure 1. Light falling weight deflectometer (LFWD) testing: (a) LFWD equipment; (b) Field test; (c) Measured data.
Applsci 10 04729 g001
Figure 2. Change in the ratio of kTrain to kLWD according to level of apparent stiffness.
Applsci 10 04729 g002
Figure 3. Load–deflection characteristics of ballasted track [15].
Applsci 10 04729 g003
Figure 4. Relative frequency of apparent stiffness: (a) All; (b) Earthwork; (c) Bridge; (d) Tunnel.
Applsci 10 04729 g004
Figure 5. Apparent stiffness versus Track Quality Index (TQI): (a) Average vs. TQI; (b) Standard deviation vs. TQI.
Applsci 10 04729 g005aApplsci 10 04729 g005b
Figure 6. Apparent stiffness versus normalized tamping length: (a) Average vs. tamping length; (b) Standard deviation vs. tamping length.
Applsci 10 04729 g006
Figure 7. Ratio of the stiffness index to average stiffness according to α.
Applsci 10 04729 g007
Figure 8. Track stiffness index (α = 0.6) versus TQI: (a) All; (b) Earthwork; (c) Bridge; (d) Tunnel.
Applsci 10 04729 g008aApplsci 10 04729 g008b
Figure 9. Track stiffness index (α = 0.6) versus cumulative tamping length: (a) All; (b) Earthwork; (c) Bridge; (d) Tunnel.
Applsci 10 04729 g009
Table 1. Details of field testing.
Year of MeasurementSection NameStructure CategoryLocation
2017Sandong Bridge 3BR 1 -EW 2T1 092k050-092k340
Yongwa tunnel–Sandong Bridge 1TN 3 -EW-BRT1 089k200-089k580
Seolgyae BridgeBR-EWT1 195k240-195k510
T2 195k240-195k530
Palgok overpass–Banwol tunnelBR-EW-TNT1 035k850-036k415
Pyeongtaek overpassBR-EWT1 075k050-075k272
Paengseong overpass 2–Wunyong overpass 1BR-EW-BRT1 077k740-078k530
Shinjeong Bridge–Wunju tunnelBR-EW-TNT1 111k750–112k050
Galhang overpass–Geumoh tunnelBR-EW-TN T2 241k160-241k460
Daejeonbuk connection lineBR-EWT2 153k814-154k012
Seobong tunnel 2TNT1 053k250-054k350
2018Galhang overpass–Geumoh tunnelBR-EW-TNT2 241k160-241k460
Shinhue overpassBRT2 085k400-085k640
Godeung tunnelEW-TNT1 107k300-107k600
Pungsae BridgeEWT2 099k600-099k635
Paengseong overpass 1EW-BRT2 075k490-075k690
Geumgang BridgeEW-BR T1 182k950-183k480
Yongwa tunnelTN-EWT1 089k200-089k350
T2 089k200-089k236
2019Geumgang BridgeEW-BRT1 182k950-183k480
Pungsae Bridge–Godeung tunnelBR-EW-TNT1 107k032-107k479
Wunyong overpass 2EWT2 081k850-081k729
Shinhue overpassEWT2 086k440-086k731
Pungsae BridgeEW-BRT2 100k240-100k389
1 BR, Bridge; 2 EW, Earthwork; 3 TN, Tunnel.
Table 2. Apparent stiffness average and standard deviation for sleepers.
StructureApparent Stiffness (kN/mm)Number of Measurement Sleepers
AverageStandard Deviation
Earthwork 98544404
Bridge118502404
Tunnel156671186
All112587994
Table 3. Apparent stiffness average and standard deviation for supporting sleepers.
StructureApparent Stiffness (kN/mm)Number of Measurement Sleepers
AverageStandard Deviation
Earthwork133402632
Bridge136391887
Tunnel17751 935
All142455454
Table 4. Number of supporting sleepers versus hanging sleepers.
StructureNumberRatio of Hanging Sleepers to Supporting Sleepers
Supporting SleepersHanging Sleepers
Earthwork263217720.67
Bridge1887 5170.27
Tunnel 935 2510.27
All545425400.47
Table 5. R2 according to α.
Categoryα
0.50.60.70.80.91.0
TQIAll0.390.370.320.290.250.23
Earthwork0.580.580.500.420.350.30
Bridge0.240.240.190.150.120.10
Tunnel0.620.610.600.590.580.58
Tamping lengthAll0.250.290.300.300.300.29
Earthwork0.330.480.510.500.470.45
Bridge0.570.500.430.370.320.29
Tunnel0.410.450.490.510.520.54
Table 6. Track irregularity management standard.
Management StageLimits
Construction value
(CV)
Value required when a new track is constructedN_SD_10m 1 ≤ 1.0
N_SD_20m 2 ≤ 1.3
Target Value
(TV)
Value required after maintenance work on a track
(L < 100 m)
N_SD_10m ≤ 1.3
N_SD_20m ≤ 1.7
Warning Value
(WV)
Meaning of this stage:
- To examine the cause of the defect and the associated characteristics
- To monitor the progress status of lateral track irregularity
N_SD_10m ≥ 1.9
N_SD_10m ≥ 2.6
1 N_SD_10m is the standard deviation of versine for a 10 m chord over a 200 m long section.2 N_SD_20m is the standard deviation of versine for a 20 m chord over a 200 m long section.
Table 7. Track status evaluation standard.
Railway Track Maintenance Guidelines
Management Stage
TQIStiffness Index
(kN/mm)
Cumulative Tamping Length
(m/m/year)
Status
BridgeTunnelEarthworkBridgeTunnelEarthwork
Construction value1.318413790---Very Good
Target value1.71288767-3.0-Good
(Target+Warning)/22.28150471.515.42.2Normal
-2.651283312.128.414.8Bad
Warning value≥ 2.6≤ 51≤ 28≤ 33≥ 12.1≤ 28.4≥ 14.8Very Bad
Table 8. Verification results of the track status evaluation standard.
Station (m)StructureApparent Stiffness (kN/mm)Stiffness Index
(kN/mm)
TQICumulative Tamping LengthTrack Status
AverageStandard DeviationStiffness IndexTQITamping
081k580~729Earthwork9356372.42.0BadBadNormal
086k440~731Earthwork10039602.22.1NormalNormalNormal
100k240~389Bridge11453601.72.6BadGoodBad

