Article

Seismic Behavior of RC Beam Column Joints with 600 MPa High Strength Steel Bars

Key Laboratory of C & PC Structures of Ministry of Education, National Prestress Engineering Research Center, Southeast University, Nanjing 211189, China
*
Author to whom correspondence should be addressed.
Appl. Sci. 2020, 10(13), 4684; https://doi.org/10.3390/app10134684
Submission received: 15 May 2020 / Revised: 23 June 2020 / Accepted: 30 June 2020 / Published: 7 July 2020

Abstract

:
This paper presents an experimental investigation of the seismic performance of interior beam–column joints with beams reinforced with Grade 600MPa longitudinal steel bars. Six full-scale reinforcement concrete (RC) interior joints are designed with different axial compression ratios and longitudinal reinforcement ratios, which are tested under reversed cyclic loading. Failure modes, hysteretic curves, skeleton curves, energy dissipation capacity, and the ductility of joints are investigated systematically. Moreover, the effect of the different axial compression ratios and longitudinal reinforcement ratios on the seismic behavior of the joints are deeply studied. Comparisons performed between specimens demonstrate that among the beam–column joints with 600 MPa high strength steel bars, specimens with high reinforcement ratios have better energy dissipation capacity, slower stiffness degradation, and lower ductility. Moreover, with the increase of the axial compression ratios, the energy dissipation capacity and ductility become weaker. The test results show the favorable seismic properties of beam–column joints equipped with 600 MPa high strength steel bars, which can be regarded as the research basis of the popularization and application of 600 MPa high strength steel bars in reinforcement concrete frame structures.

1. Introduction

Reinforcement concrete frame systems are widely used in concrete structures for earthquake-resistant design because of their structural efficiency and architectural flexibility [1,2,3,4]. However, large beam and column sections often make it difficult for architectural designs to meet the structural requirements. Hence, beam and column sections are often designed to be as compact as possible to provide more available space in buildings, which often encounter steel congestion at beam–column joints [5,6,7]. Now, congested reinforcement has become the key problem for several complications, including the honeycombing phenomenon and hard concrete placement during construction, which will reduce the quality of the construction.
In an attempt to solve these problems, a great amount of attention has been recently paid to the use of high strength materials, including high strength concrete [8,9,10,11,12,13,14] and high strength steel bars [15,16,17,18,19] in designs and constructions. The use of high-strength steel bars not only reduces the consumption of steel bars, which is convenient for construction, but also reduces construction cost, with a greater impact on building structures in highly seismic regions [20,21].
Nevertheless, the ACI Committee 318 [22] and Ministry of Housing and Urban-Rural Development of the People’s Republic of China [23] restricted the employment of high strength steel bars, stating that with the development of yield strength, higher shear and bond stresses may cause brittle failure. Further experimental research is required to evaluate the seismic performance of longitudinal high strength steel bars used in different frame elements, including interior beam–column joints. The main challenges in the design of interior beam–column joints with high strength steel bars are the bond and shear failures, which are mainly caused by insufficient anchorage length and higher strains [6,24].
Four full-scale exterior and interior beam–column joints with 600 MPa yield strength steel bars, were investigated and compared by Hwang et al. [25]. The importance of the sufficient development length of steel bars in compression and tension for deformation capacity and energy dissipation capacity were demonstrated and emphasized. In order to study the seismic behavior of reactive powder concrete beam–column joints reinforced with high strength steel bars, an experimental investigation was carried out by Wang et al. [26]. A total of five exterior joint specimens were tested, including two specimens with HRB600 steel bars. There are lower degradation of strength and stiffness, residual deformation, but higher deformation capacity and energy dissipation capacity in the beam–column joints with HRB600 steel bars. Five exterior beam–column joints reinforced with Grades 500 MPa and 700 MPa steel bars were tested to study the seismic behavior of Alaee et al. [27]. The results showed that utilizing high strength steel bars resulted in a slight decrease in bond strength and energy dissipation capacity. After that, seismic performance of exterior beam–column joints with high strength steel bars of Grade 600 MPa and high strength concrete of 70 MPa were discussed by Aavi-Dehkordi et al. [15]. It was reported that failure mode, energy dissipation capacity, pinching behavior, and stiffness of joints with high strength steel bars were similar to those with nominal steel bars. Furthermore, the combination of high strength steel bars and strength concrete can improve the cumulative energy dissipation. Three full-scale reinforcement concrete frame subassemblies with high strength materials were tested to evaluate the seismic performance by Kang et al. [28]. The results showed joints with high strength steel bars and concrete exhibited excellent lateral deformation capacity. Analytical investigations of reinforced concrete beam–column joints constructed using high-strength materials were conducted by Alaee and Li [29] to analyze the shear deformation and bond-slip behavior of the joints. On the basis of the results, they concluded the high strength material grades could be included in the allowable limit of reinforcement for reinforcement concrete beam–column joints.
Although preceding scholars have done a high amount of remarkable research, still many parameters are not analyzed clear. The performance of beam–column joint reinforced with high strength steel bars should be investigated for different seismic requirements. Further research is required for the use of longitudinal steel bars with a yield strength of greater than 500 MPa to expand the current limit of allowable strength of steel bars in reinforcement concrete frame structures. Hence, the interior beam–column joints with beam reinforced with Grade 600 MPa longitudinal steel bars were designed, fabricated and tested. The seismic behavior of beam–column joints is discussed using the longitudinal reinforcement ratio, axial compression as variable parameters. The load transfer mechanism, failure mode, ductility, energy dissipation capacity, and strength of beam–column joints are investigated under cyclic loading for different seismic requirements. The results of this study are expected to provide evidence that the comprehensive seismic behaviors of the beam–column joints equipped with 600 MPa high strength steel bars can satisfy the seismic requirements.

2. Experimental Investigation

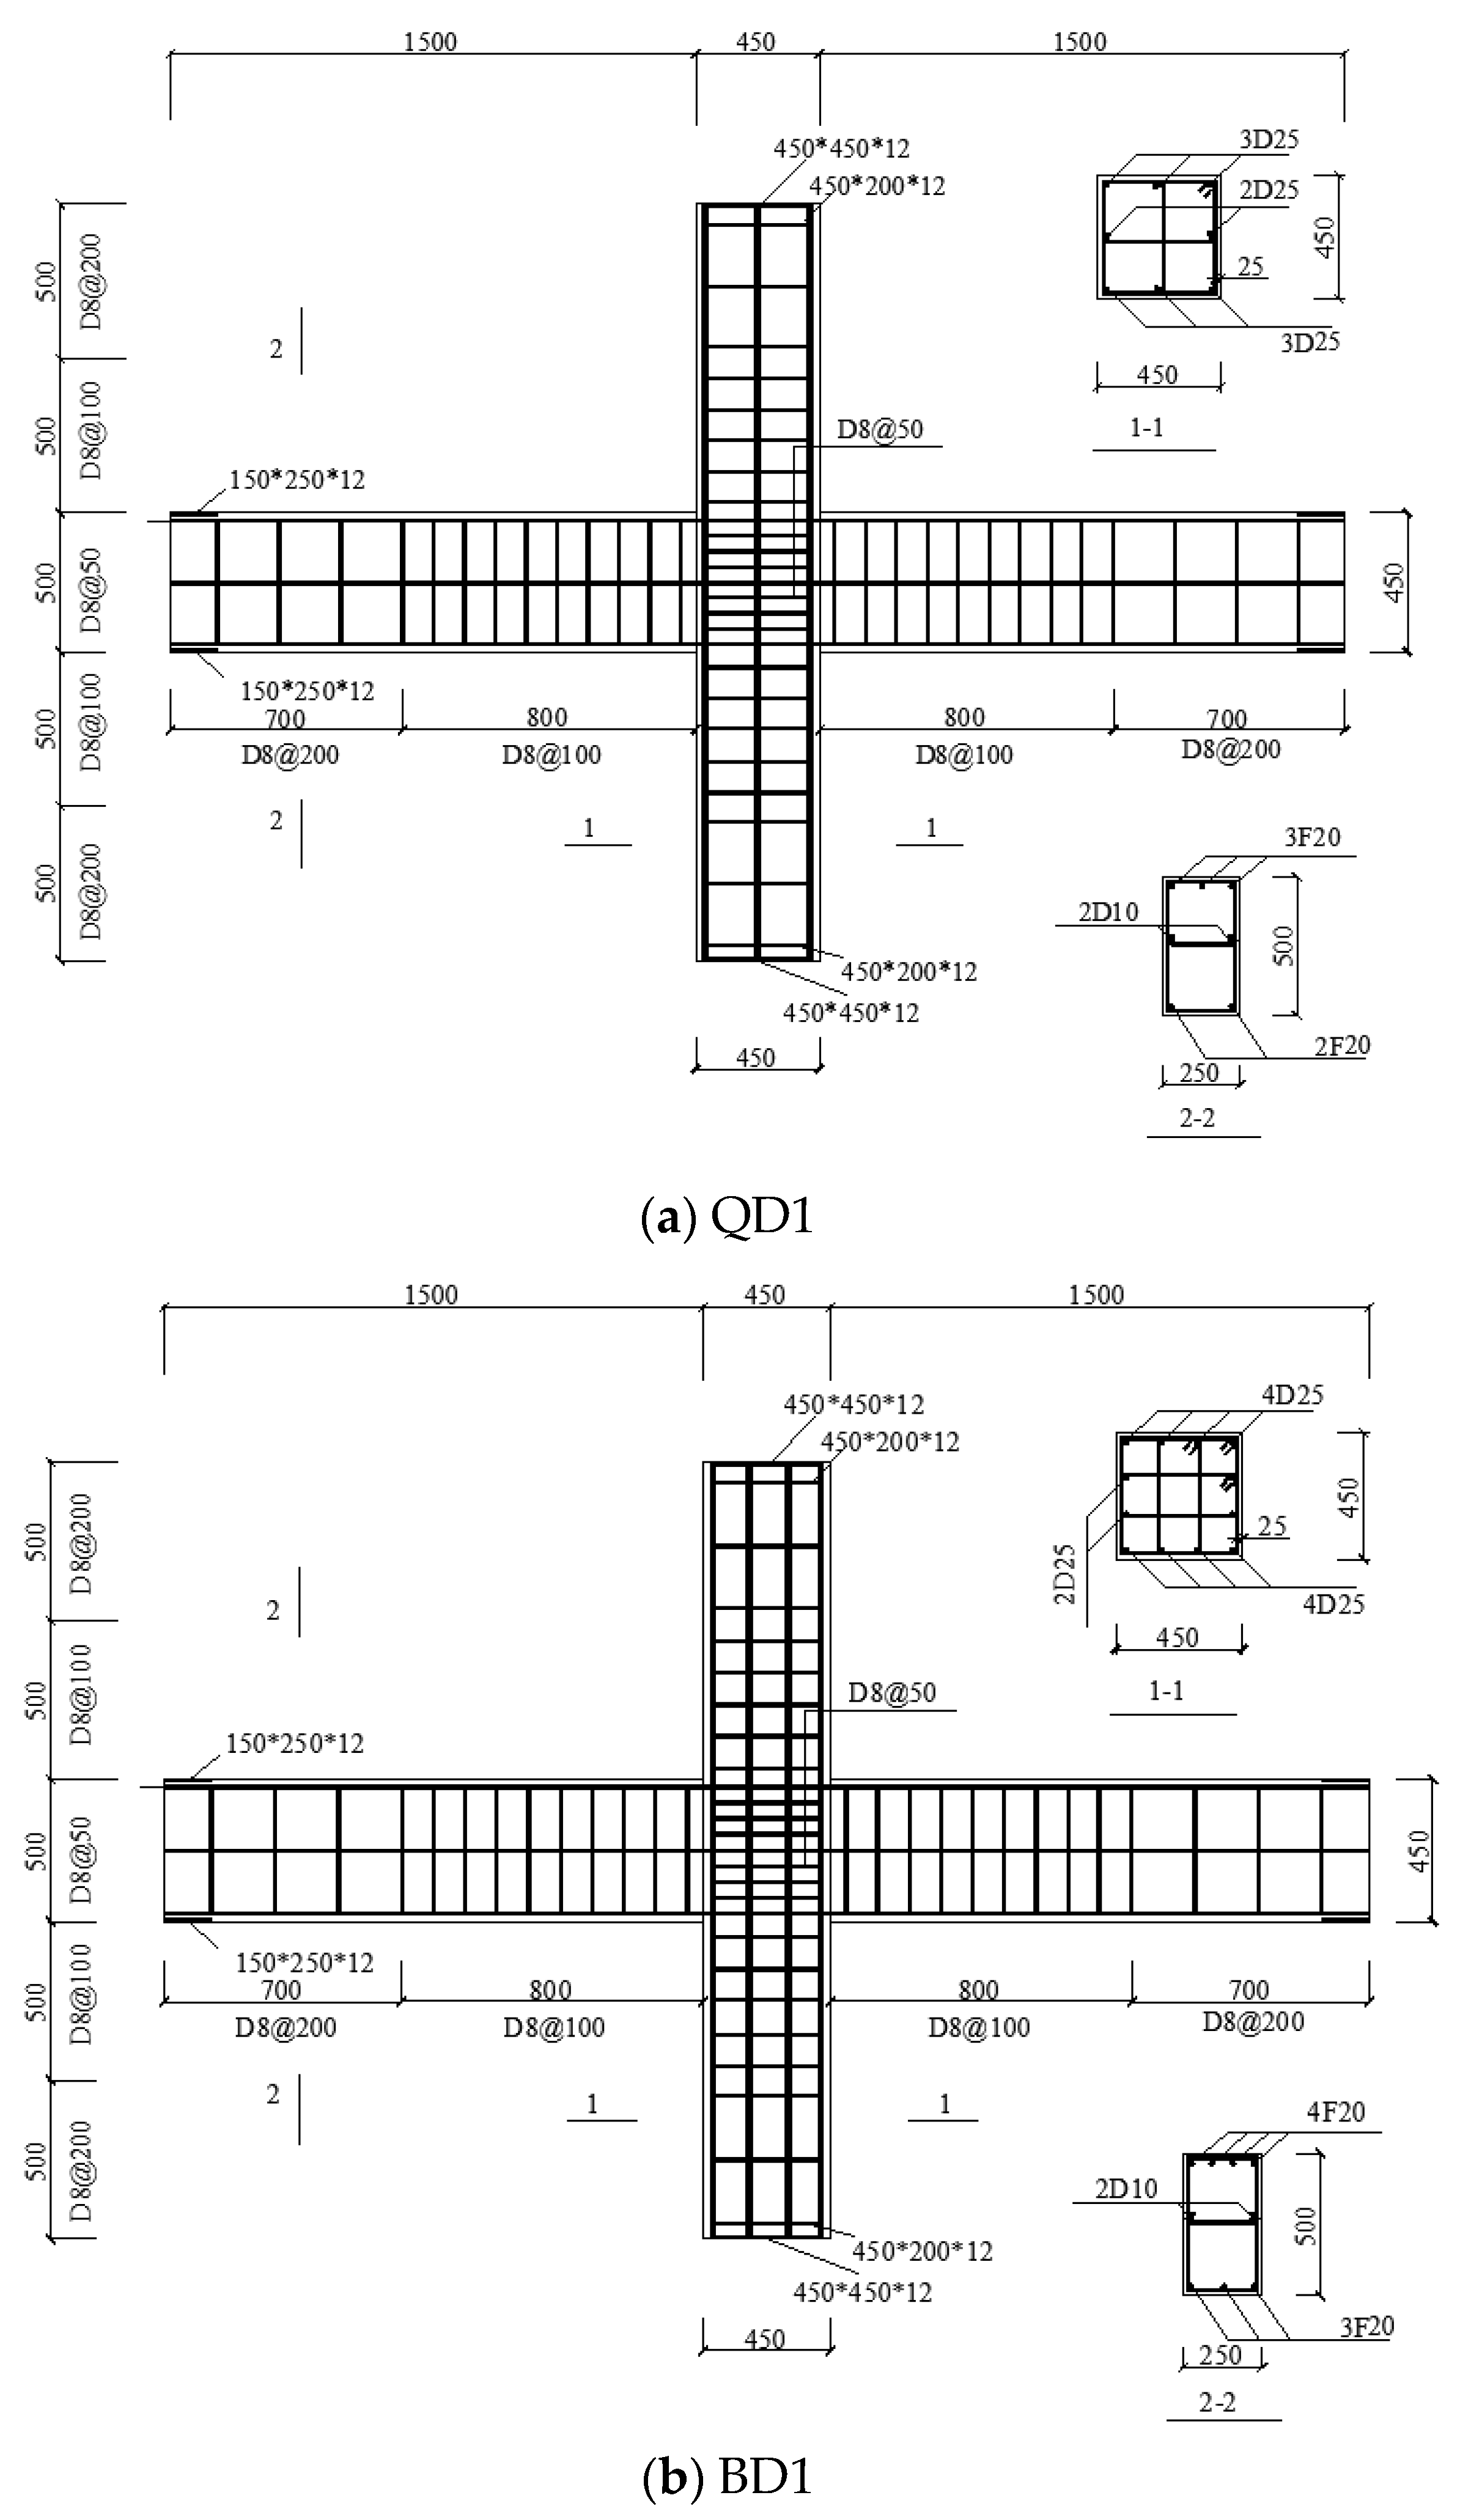
2.1. Description of Specimens

In the experimental investigations, joint specimens originated from five-story frame structures with different site categories, seismic fortification intensities, and anti-seismic grades, designed with Chinese Codes GB50010-2010 [23] and GB50011-2010 [29]. Moreover, the sizes of beam and column sections are kept as close as possible to the ones in the actual frame to avoid the influence of size effects. The dimensions of beams and columns are 250 × 500 × 1500 mm and 450 × 450 × 2500 mm, respectively.
In the beams, the main longitudinal reinforcements whose nominal yield strength is 600 MPa are 20 mm and 16 mm in diameter with a 25 mm concrete cover. HRB400 grade bars are used as stirrups and longitudinal reinforcement in the columns. Considering that the resistance of cracking and shear behaviors can be enhanced by closed stirrups in reinforced concrete frame beams and columns, they are put in place with the spacing of 200 mm. Differently, for the joint region, the spacing is reduced to 50 mm and 100 mm for columns and beams, respectively. The grades of the concrete compressive strength in every specimen are C30, and the average cubic compressive strength and elastic modulus of concrete are 24.1 MPa and 27,400 MPa, respectively. The specimens were labeled with QD1, QD2, QD3, BD1, BD2, and BD3 in Table 1, and the details of QD1 and BD1 are shown in Figure 1. The steel bars are denoted by D and F, which represent grade HRB400 and HRB600 steel bars, respectively. Also, six specimens that are tested under reversed cyclic loading are designed with different axial compression ratios and longitudinal reinforcement ratios. The different parameter variations are described in Table 2.

2.2. Material Properties

With the aim to accurately measure the strength of the specimens used in concrete, three reserved 150-mm cubic concrete blocks were studied. The specimens QDs are made of concrete, with compression strength equal to 25.7 MPa, while the compression strength for specimens BDs is 22.5 MPa. Similarly, three steel bars, which were sampled from steel bars with different diameters and grades, were tested, as shown in Table 3.

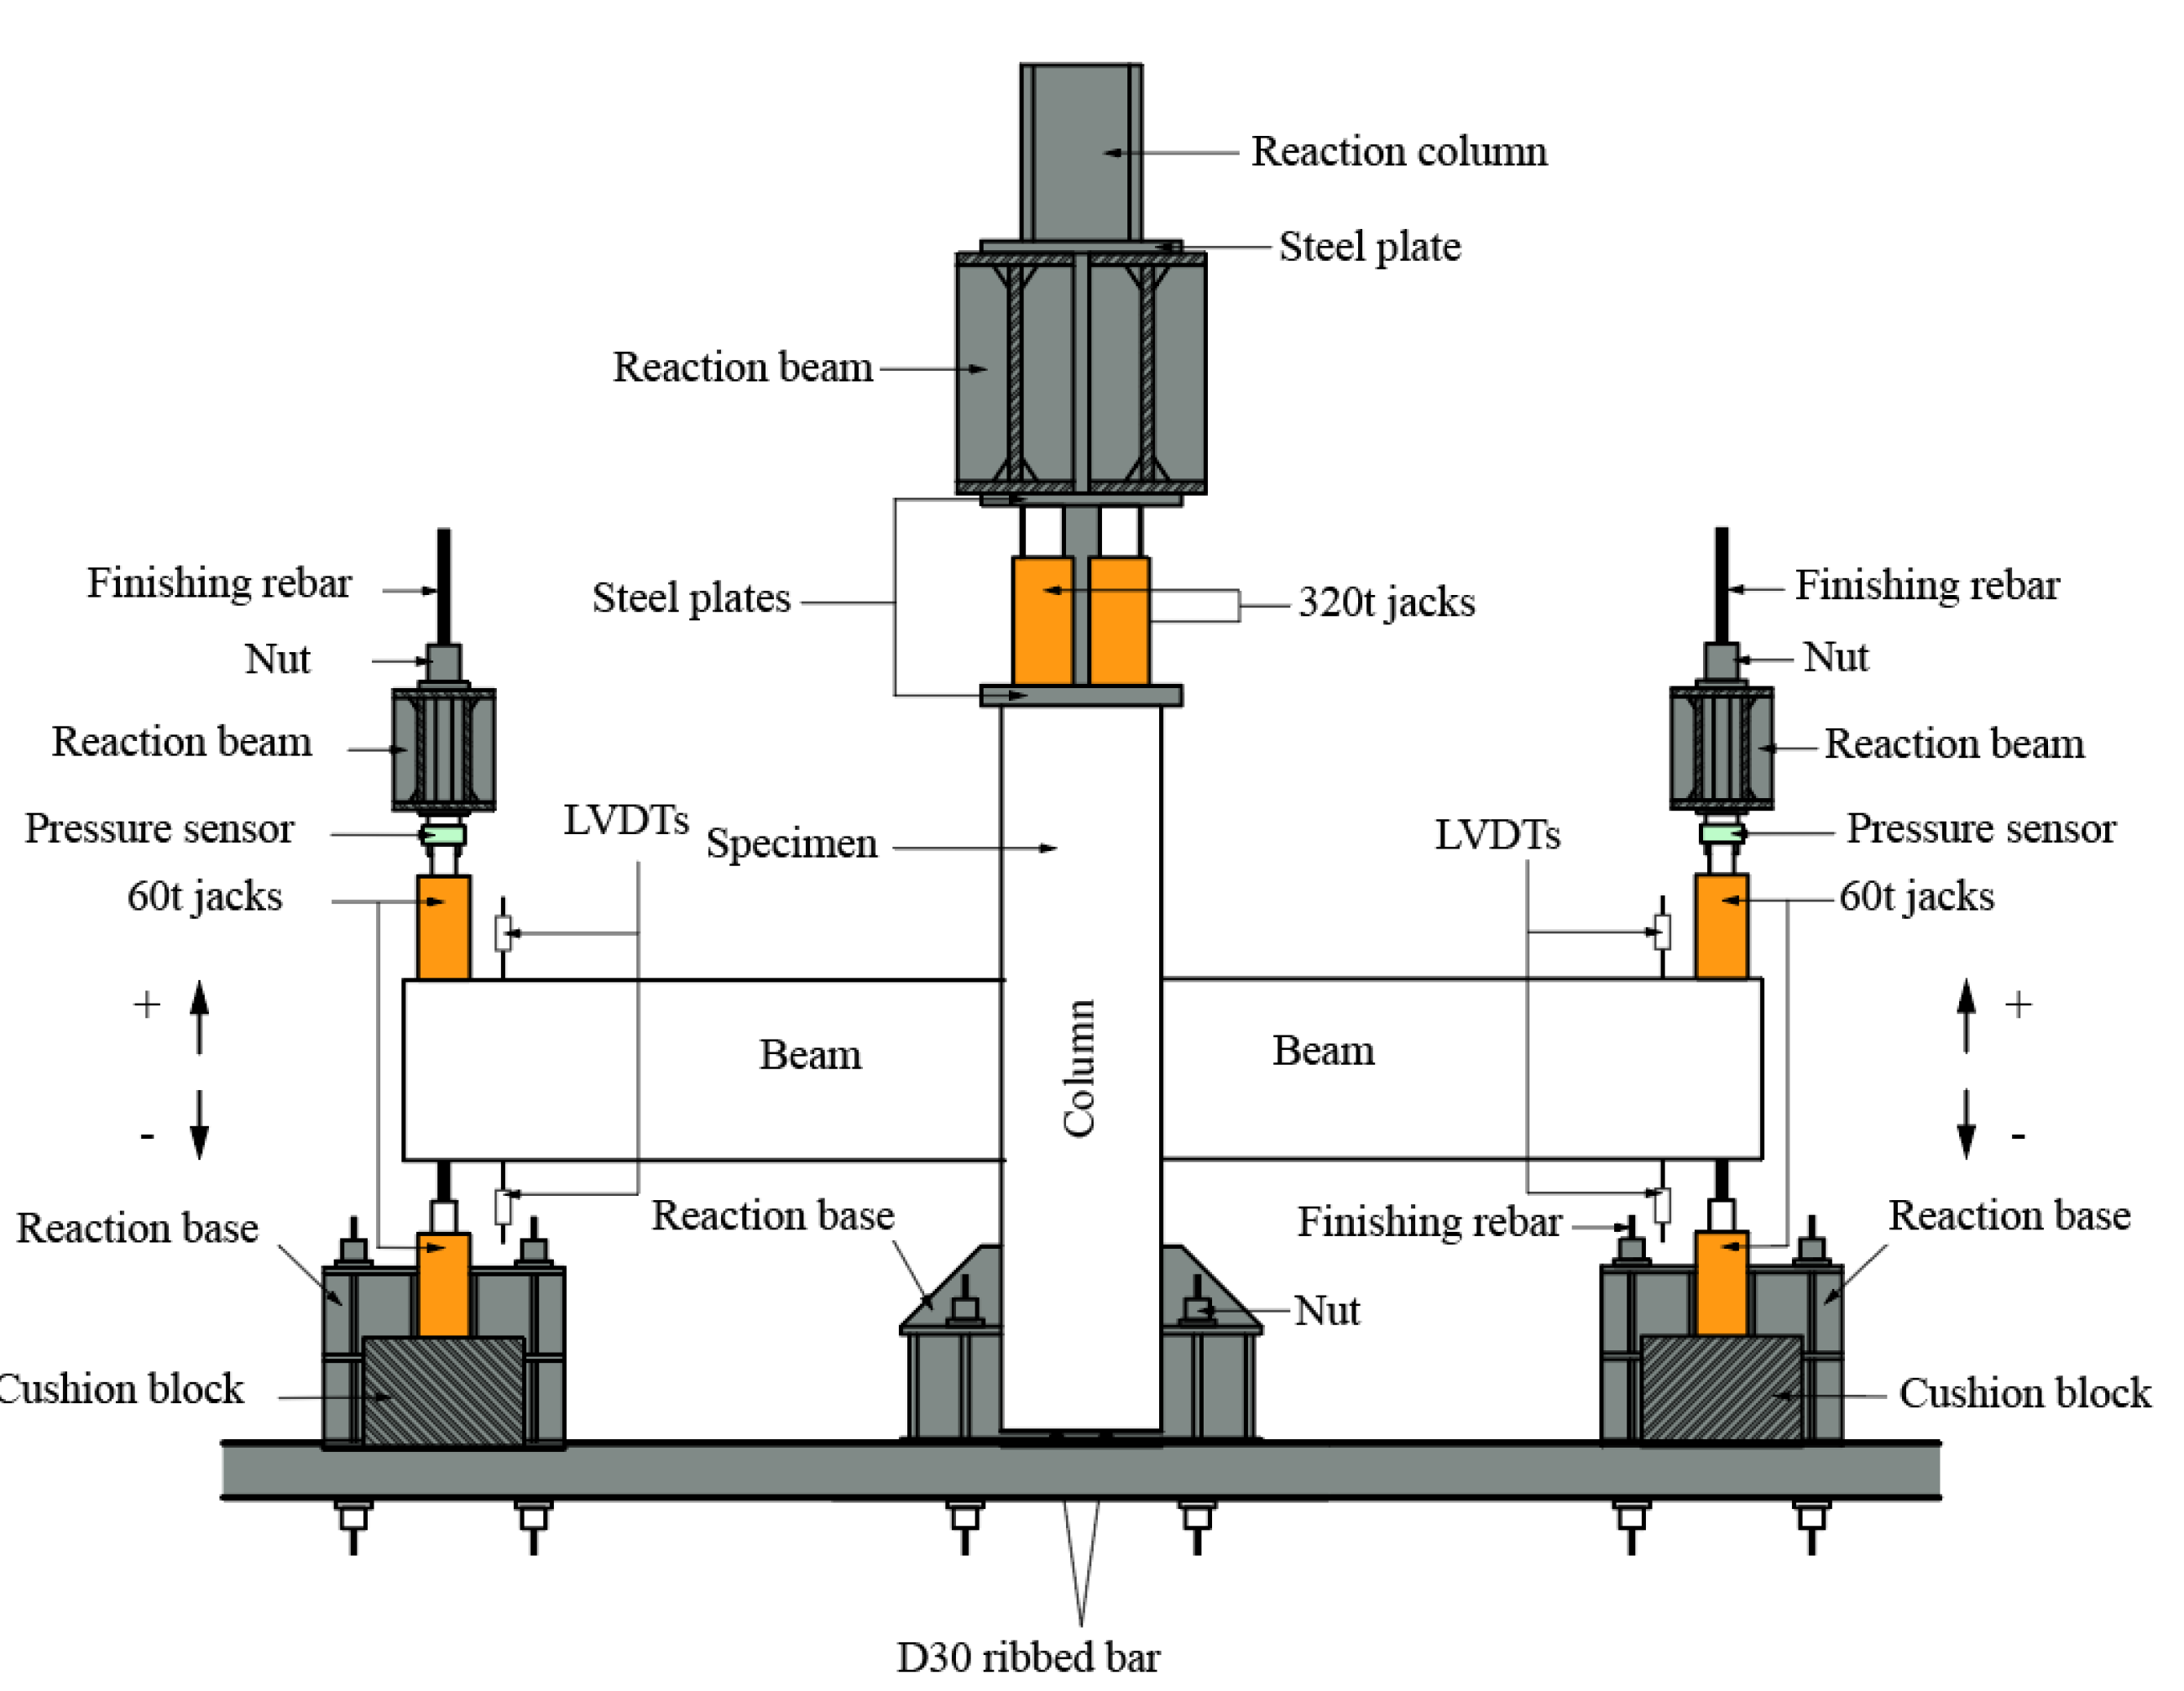
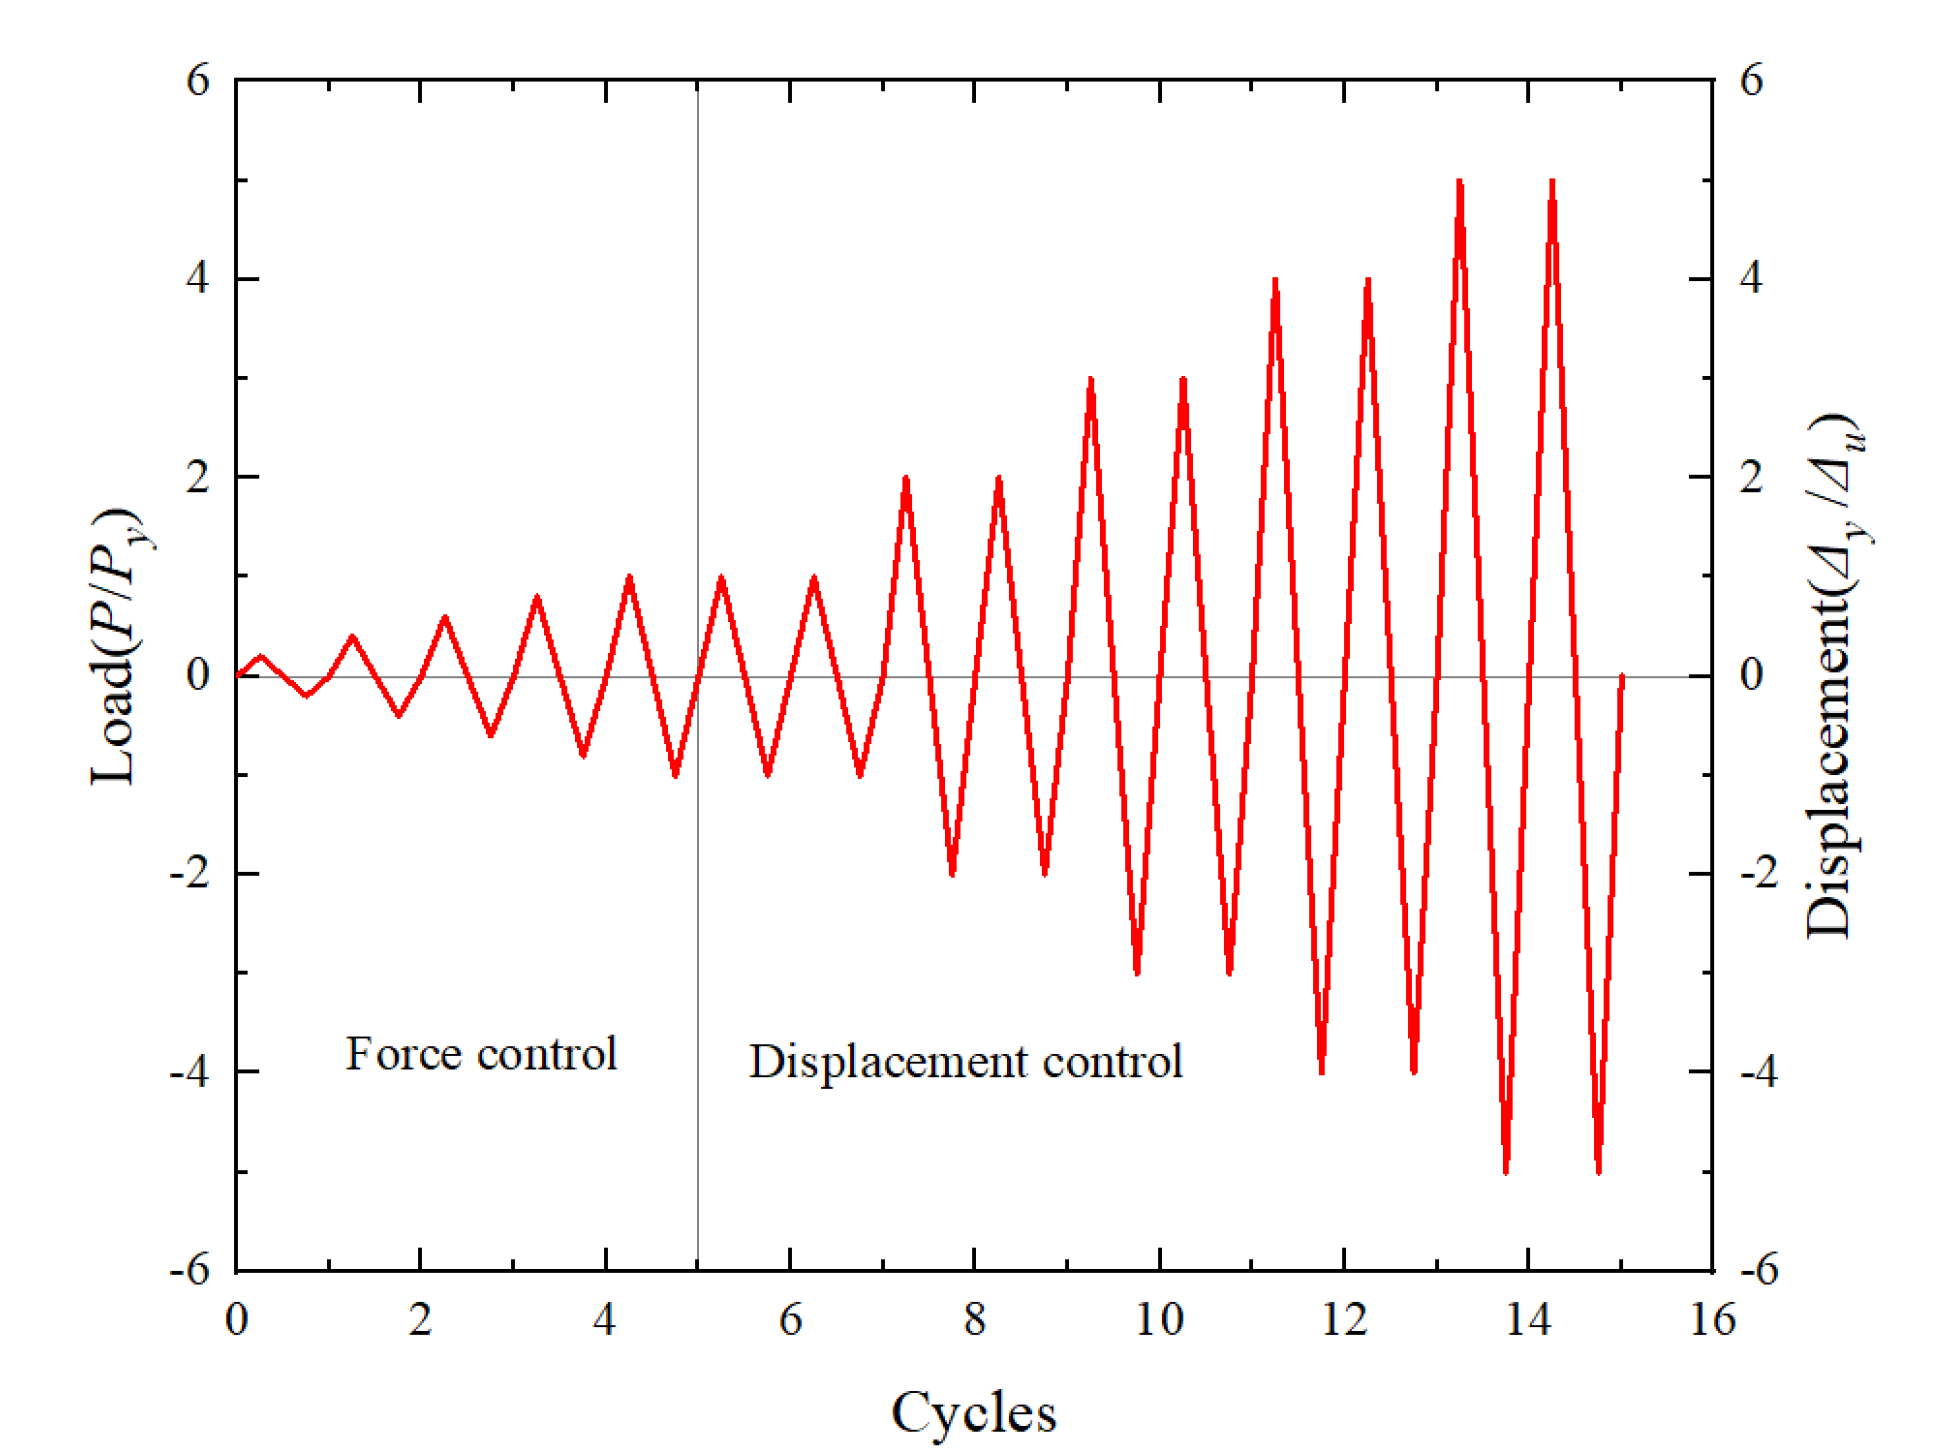
2.3. Test Setup and Loading System

As shown in Figure 2, the top of the column is supported by two I-beams, which are clamped to the base by welded steel plates to simulate the hinge. The two ribbed bars which are implanted at the base of the column in 30-mm diameter welded on the steel plate, support the column, which allows small rotation of the base. The ends of the beam are instead free. There is a 320 t manual hydraulic jack on the top of the column to provide the axial compression. Further, the reversed cyclic loading was applied by four 60 t jacks at the bottom and top of the beam ends. These jacks are divided into two groups, and the two jacks at the upper left and the lower right provided the counterclockwise load. The loads at the ends of beams were measured with the aid of pressure sensors. Linear variable displacement transducers (LVDTs), which were used to measure the displacement of the beam, were placed on the beams approximately at the distance of 100 mm away from the 60 t jacks. Figure 3 shows the general configuration of the test setup.
Each specimen was tested with the same procedure. At the beginning of the test, the axial compression N was applied to the top of the columns and kept unchanged. Then, the cyclic loads on beams were applied following the loading sequence shown in Figure 4. The loading history consisted of two phases: (a) with the reference of the designed yielding load, the loading was controlled by force, and the loading circle was conducted with one cycle at each level; (b) after the joint reached to the yield state with the applied force Py, the controlled displacement was applied with an increment of yield displacements Δy. Two full cycles were applied until the specimens failed at each displacement level. The specimen was loaded at a rate of 12 mm/min in phase (a) and 50 mm/min in phase (b), thus ensuring a smooth and quasi-static loading.

3. Experimental Results and Discussion
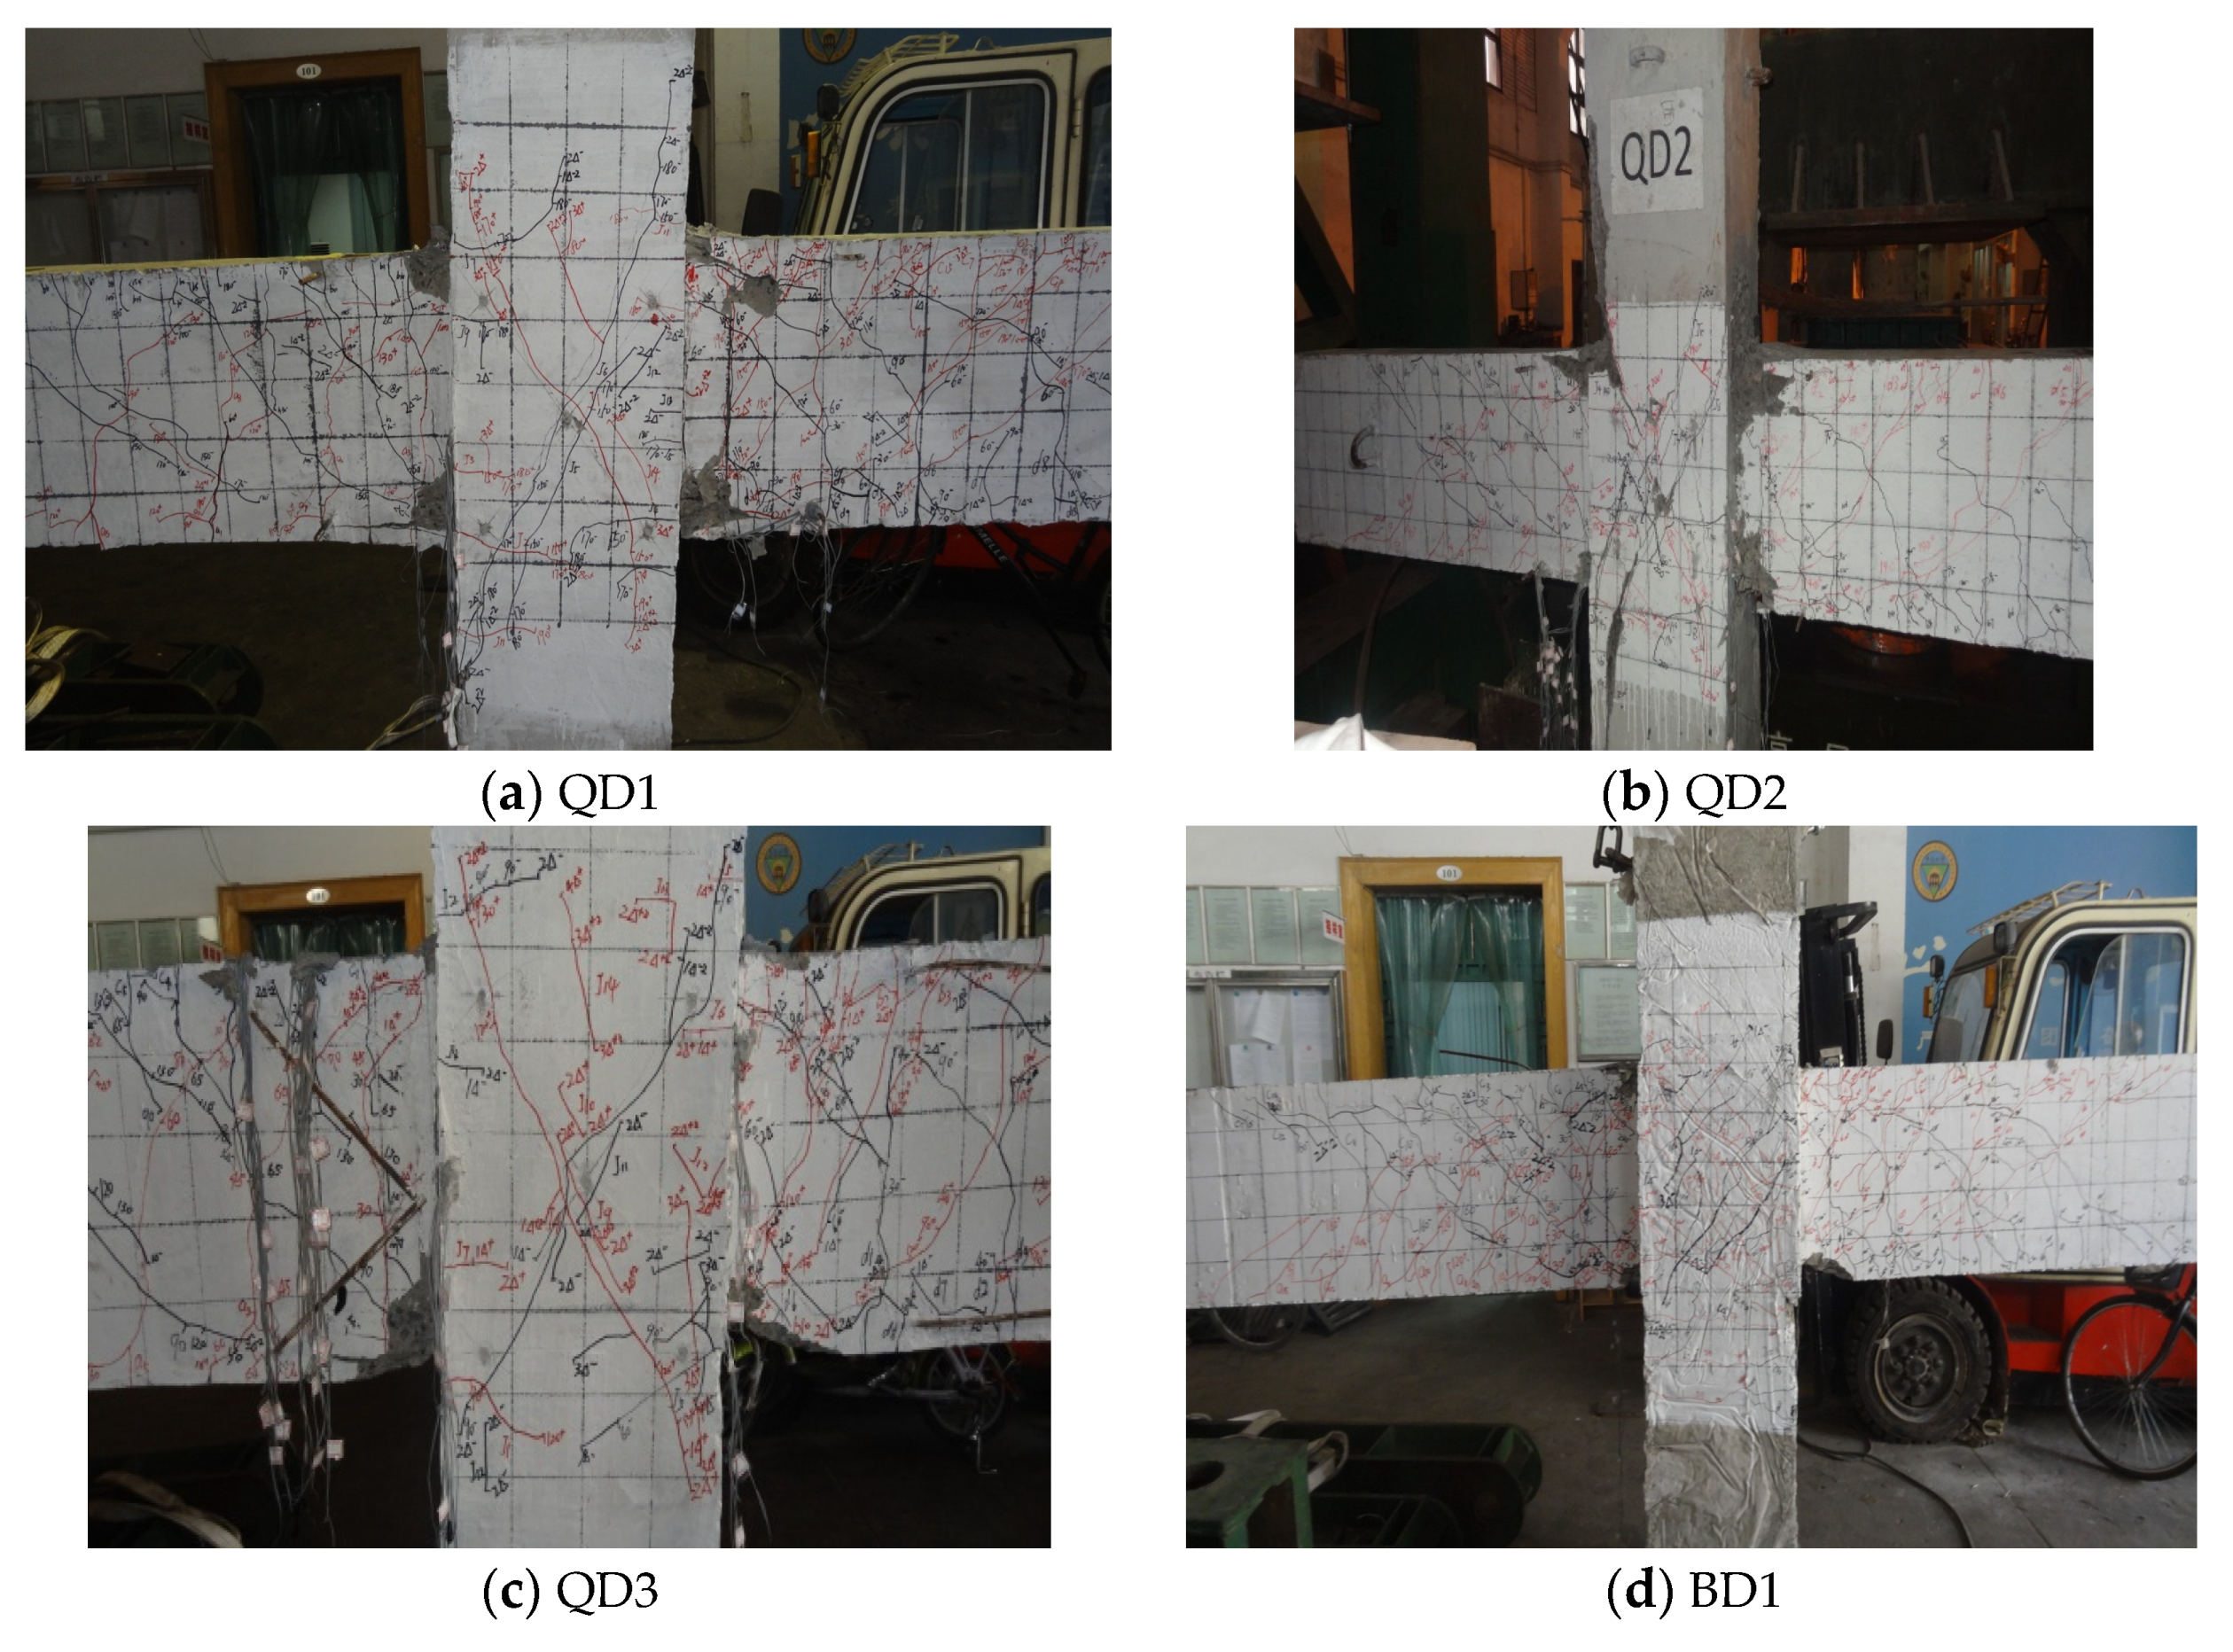
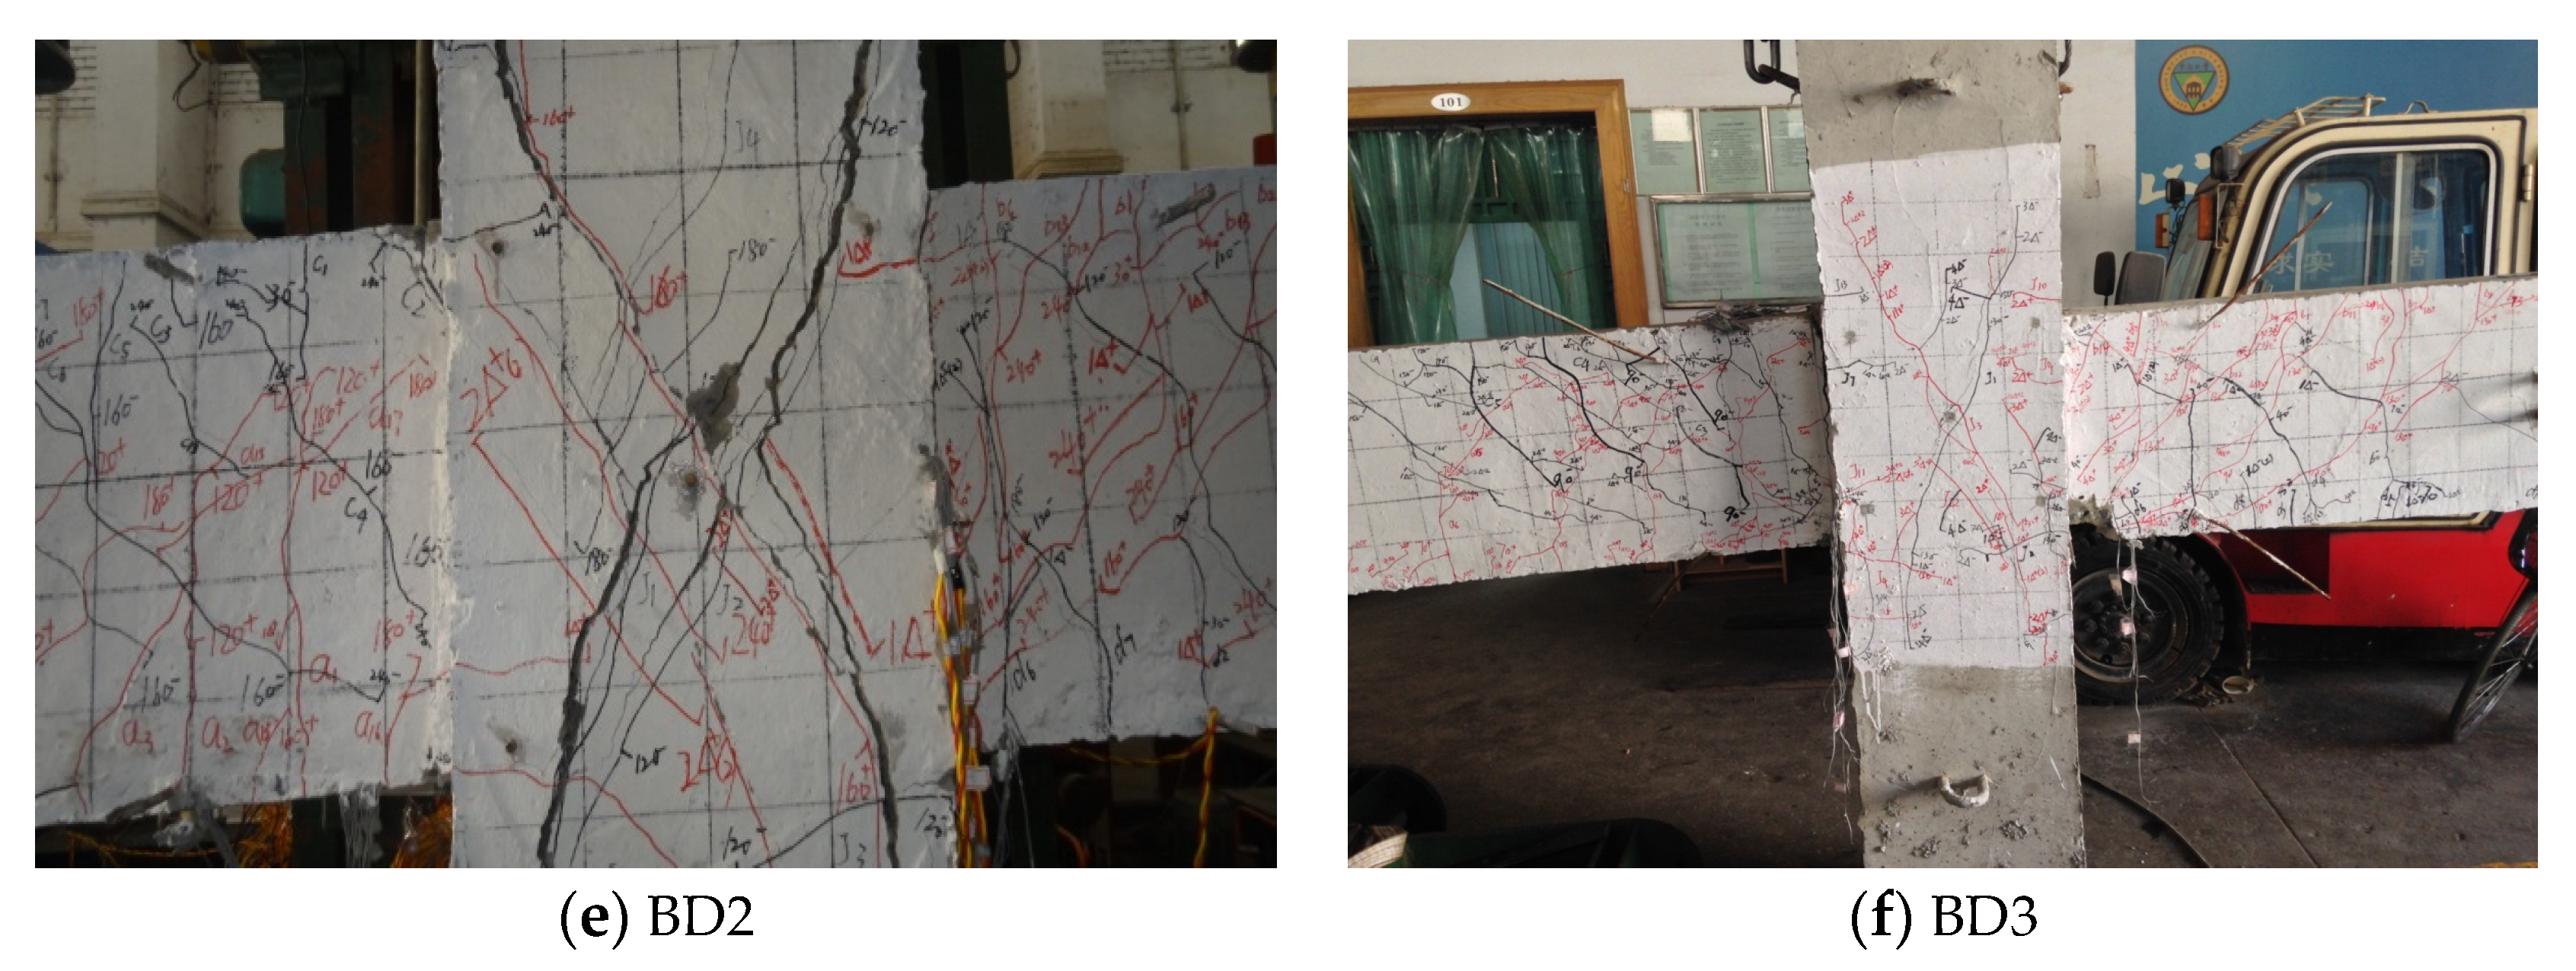
3.1. Failure Mode

The final failure modes of the six specimens at the end of the cyclic loading test are compared in Figure 5. For QD1, after the loading cycle of 1Δy level in the displacement control stage, there was an evident crack at the top of the beam end, which was about 1 mm wide. During the loading cycle of 2Δy level, the concrete crack at the upper end of the beam was enlarged, with a width of about 7 mm. During the loading cycle of 3Δy level, the concrete at the end of the beam had seriously fallen off, with the residual deformation after unloading being very large. The failure mode of QD1 is shown in Figure 5a. As shown in Figure 5b, QD2 exhibited similar behavior with QD1, but the cracking propagation was much more severe than the one encountered in QD1. The concrete at the beam end fell off, exposing the longitudinal steel bars and the stirrups. For QD3, the concrete bulged at the lower end of the beam. During the loading cycle of 4Δy level, the concrete on the column surface above the beam bulged, and local peeling occurred, as shown inFigure 5c.
For BD1, after the loading cycle of 1Δy level in the displacement control stage, a large crack with a width of 1 mm appeared in the bottom of the beam and expanded further. During the loading cycle of 2Δy level, concrete peeling occurred at the bottom area of the beam. During the loading cycle of 3Δy level, the spalling phenomenon of concrete at the bottom of the beam was more evident, and the crack width at the back of the joint deepened. The failure mode of BD1 is shown in Figure 5d. For BD2 in Figure 5e, during the loading cycle of 3Δy level, the concrete fell off in a large range, and the stirrups could be seen clearly. For BD3 in Figure 5f, during the loading cycle of 4Δy level, the concrete at the bottom of the beam peeled off, the beam stirrups could be seen, and the crack long was about 20–30 mm.
It is observed that for the six specimens, the main cracking occurred at the beam ends near the column face, where there were plastic hinges. With the development of cracks, severe concrete spalling occurred at the bottoms of the beam ends near the column. The crushing of concrete at the bottom of the beam ends was more severe than that at the tops, which can be due to the fact that there are more steel bars at the tops of the beams than at the bottoms. Moreover, the damage of joint panels of QD2, BD1, and BD2 is more serious than that of other specimens. First diagonal cracks in these joint panels mainly started to appear after the loading cycle of 1Δy level in the displacement control stage. Then, wider diagonal cracks in the joint panels occurred and spread along the two diagonal lines. At last, the peeling of concrete cover occurred at the intersections of two major diagonal cracks for specimens QD2, BD1 and BD2.

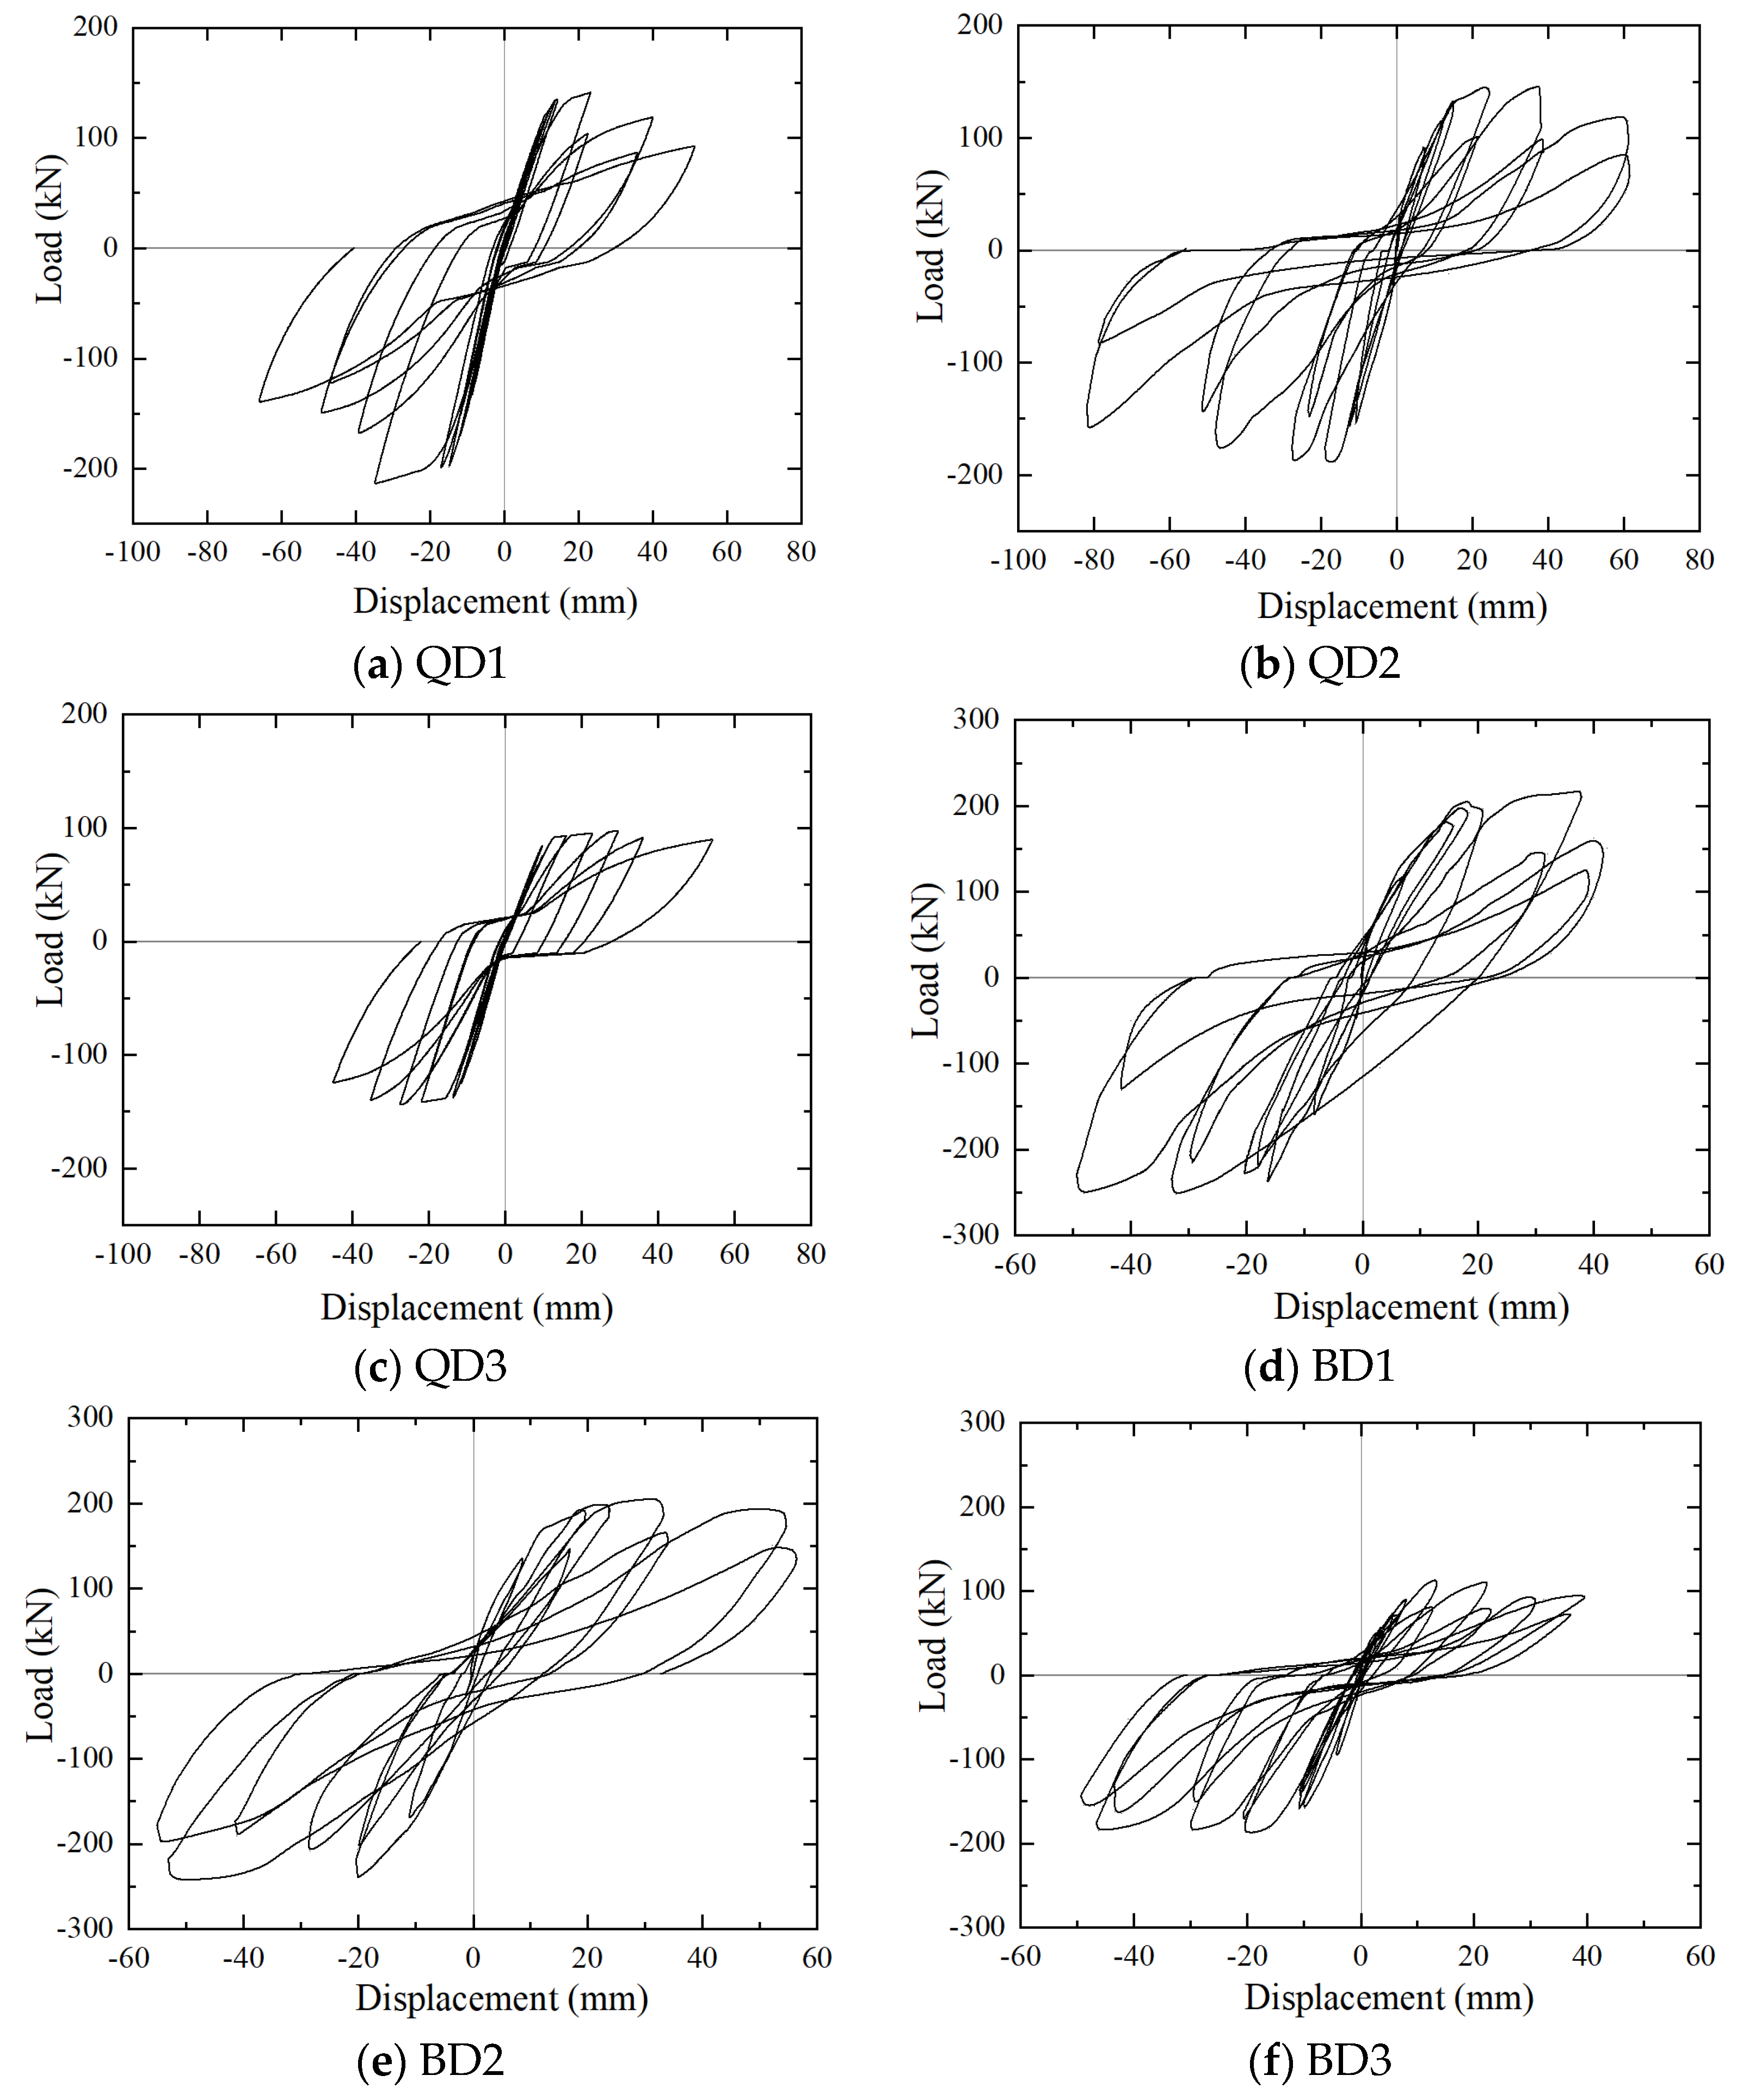
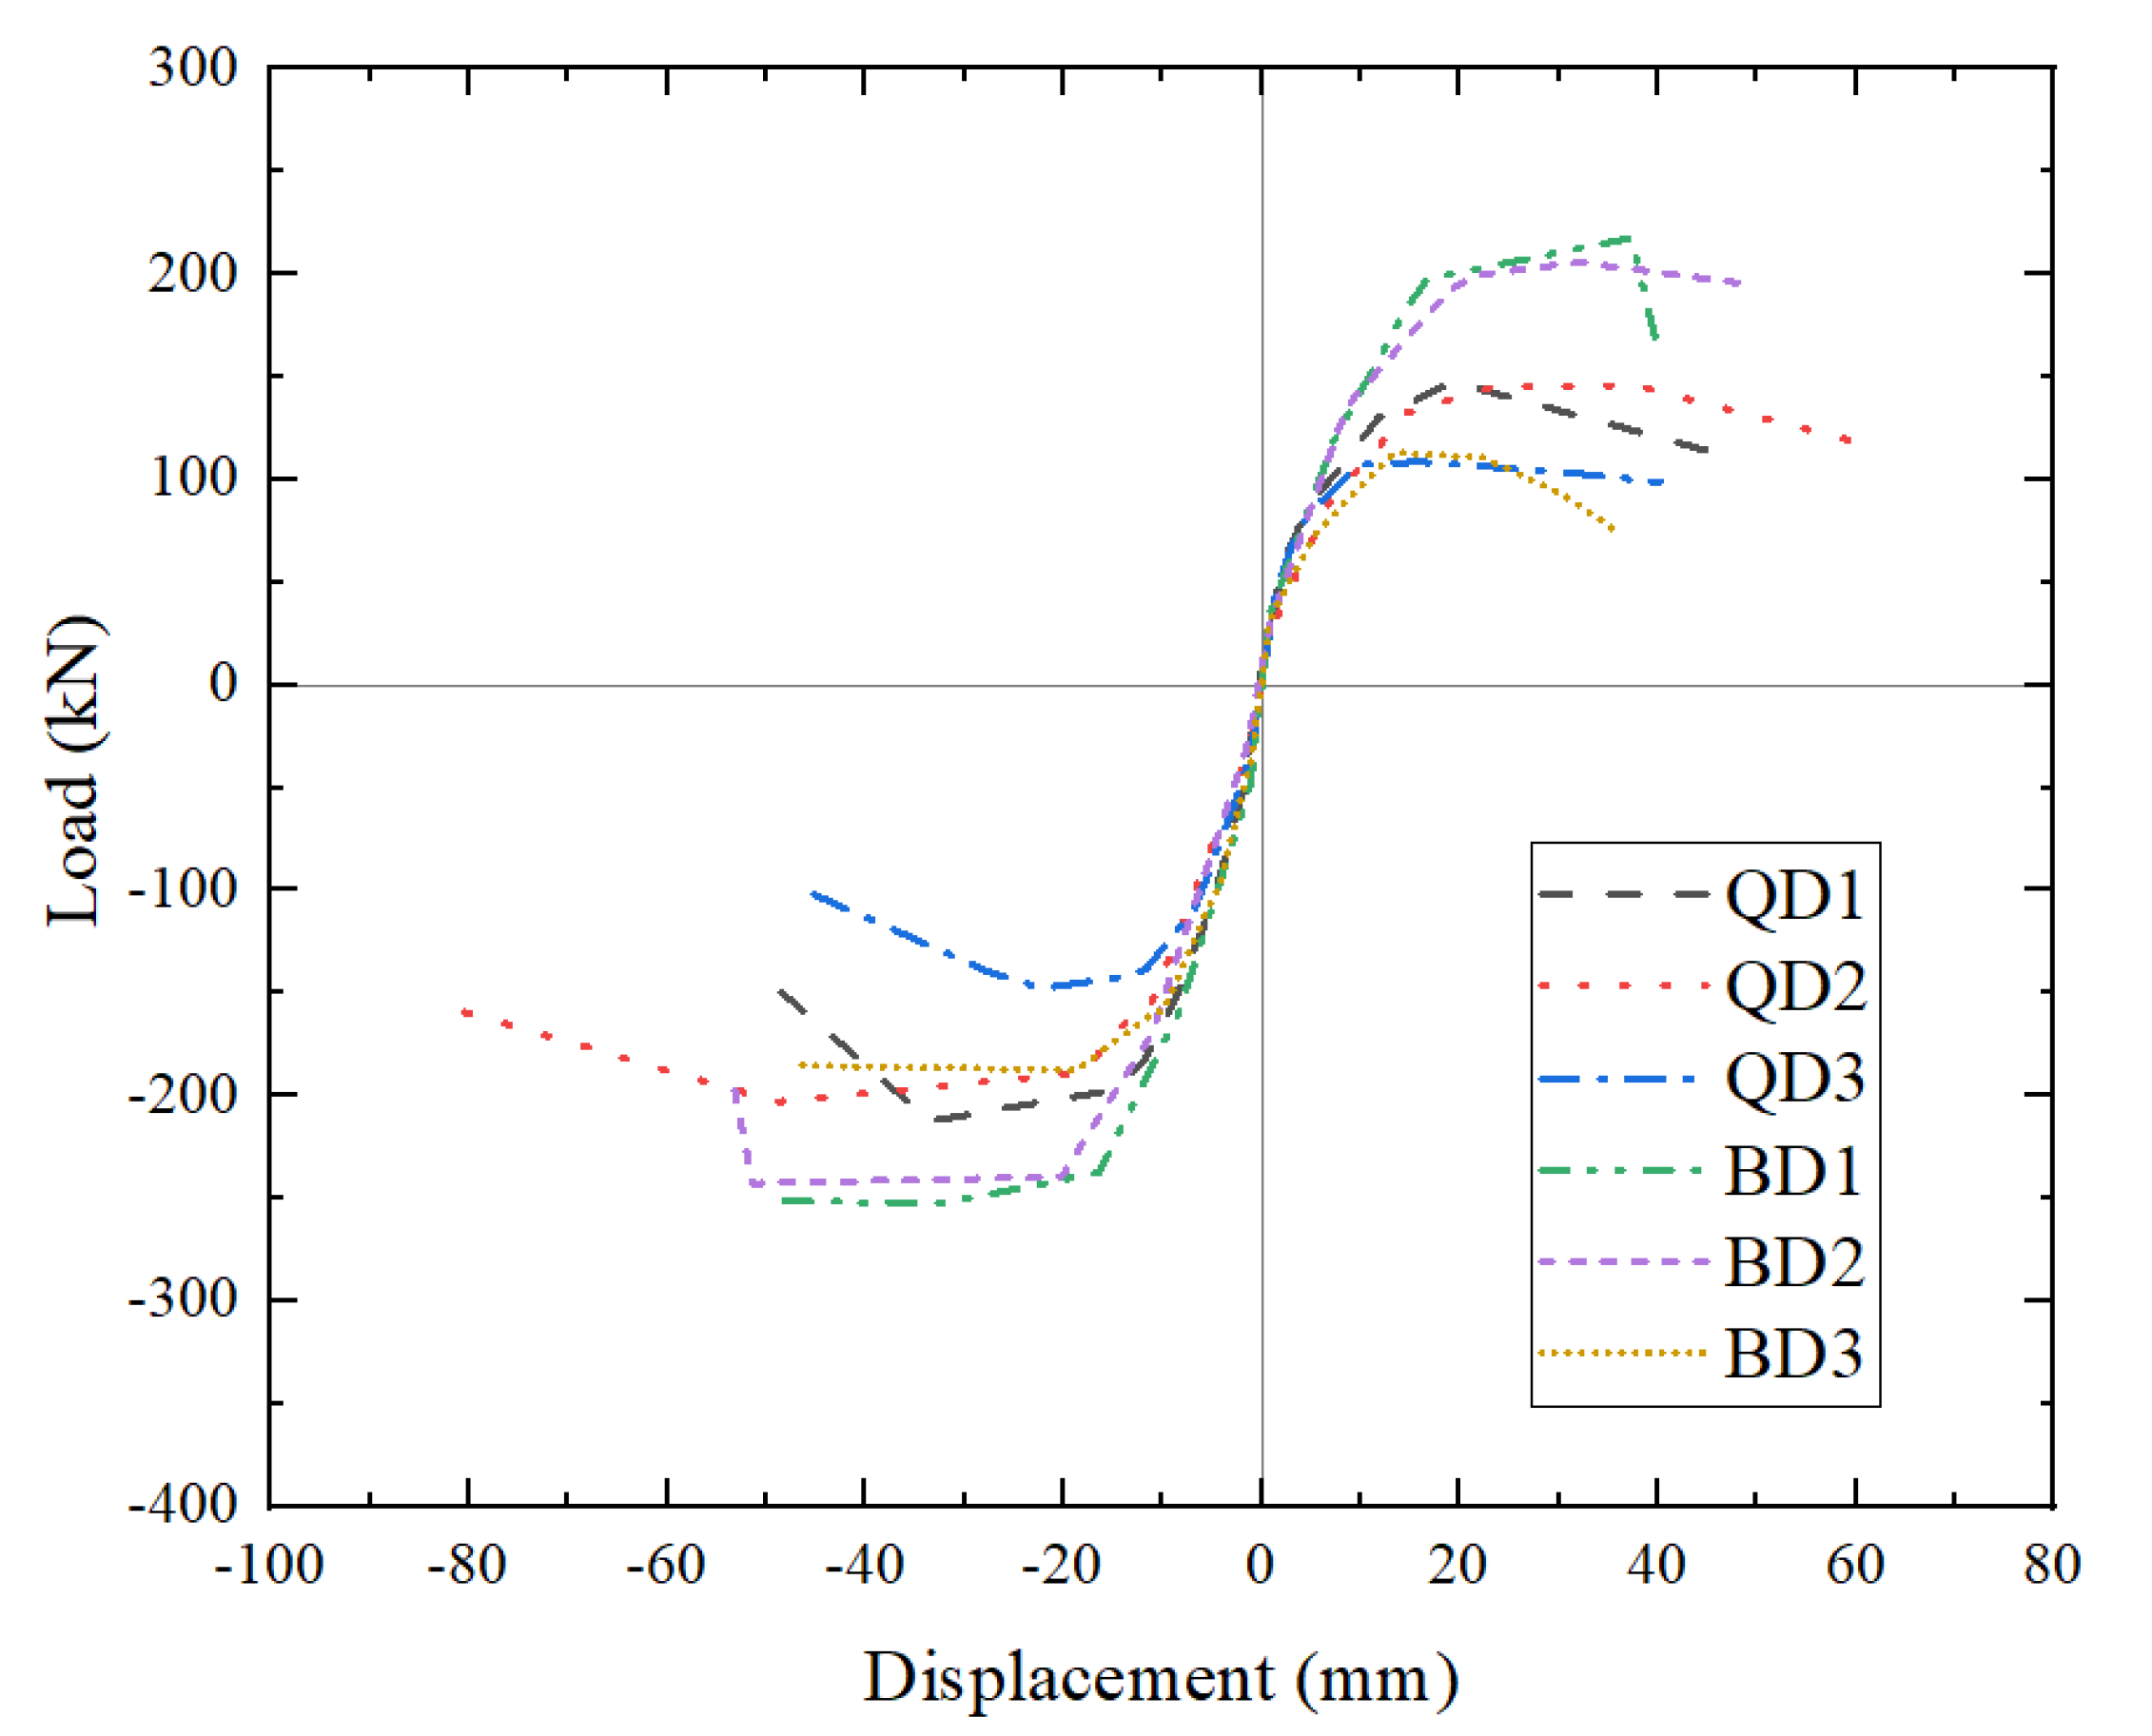
3.2. Hysteretic Curves and Skeleton Curves

Figure 6 shows the hysteretic curves of the six specimens. The curves maintain excellent linear elastic properties, and the hysteresis rings are close to straight lines with low energy consumption before the first cracking. With the cracks appearing and developing, the skeleton curves turn nonlinear, and the slopes of the curves decrease gradually. A noticeable reduction in stiffness can be observed after the yield of beams, and the curves follow a downward trend until the specimens failed, which is caused by the concrete crushing. Compared with BD1, BD2, and BD3, the specimens QD1, QD2, and QD3 exhibit a more significant pinch phenomenon of the hysteresis curve, which shows that the pinch behavior of beam–column joints with high-strength steel bars is commonly more severe. With the same reinforcement ratio, the ductility of the specimen QD1 with higher axial compression is weaker than that of specimen QD2 with a lower axial compression ratio. Because the shear stresses of QD3 and BD3 are relatively small, it can be seen from the hysteresis curve that their ductility is higher, while their energy dissipation capacity is poor.
Figure 7 compares the skeleton curves of the six specimens. QD2 experiences a longer yield stage than QD1 because of different axial compression ratios, which indicates better deformation capacity. Similarly, BD1 has a similar ultimate load as BD2, but BD1 has a lower ductility than BD2. QD3 has a smaller axial compression ratio and a longitudinal reinforcement ratio, so the yield load and ultimate load are lower than those of QD1 and QD2. However, the ductility of QD3 is more adequate than that of QD1 and QD2. The deformation capacities of all the specimens in the downward direction are found to be inferior to those in the upward direction. Under the same conditions, the yield and ultimate loads of QD1, QD2, and QD3 are less than the ones of BD1, BD2, and BD3, while their performance of ductility is slightly better.
With the increase of the displacement, the corresponding load is taken as failure load when the load decreases to 85% of the maximum load. Table 4 illustrates that the yield load and ultimate load of BD1 and BD2 are higher than those of QD1 and QD2. This is mainly attributed to the higher axial compression ratios. It can be seen that the strength of reinforcement increases with the reinforcement ratios. Furthermore, the ratio of yielding strength to the ultimate strength under upward loading is higher than that under downward loading. In addition, the ratio increases with the decrease of the reinforcement ratio.

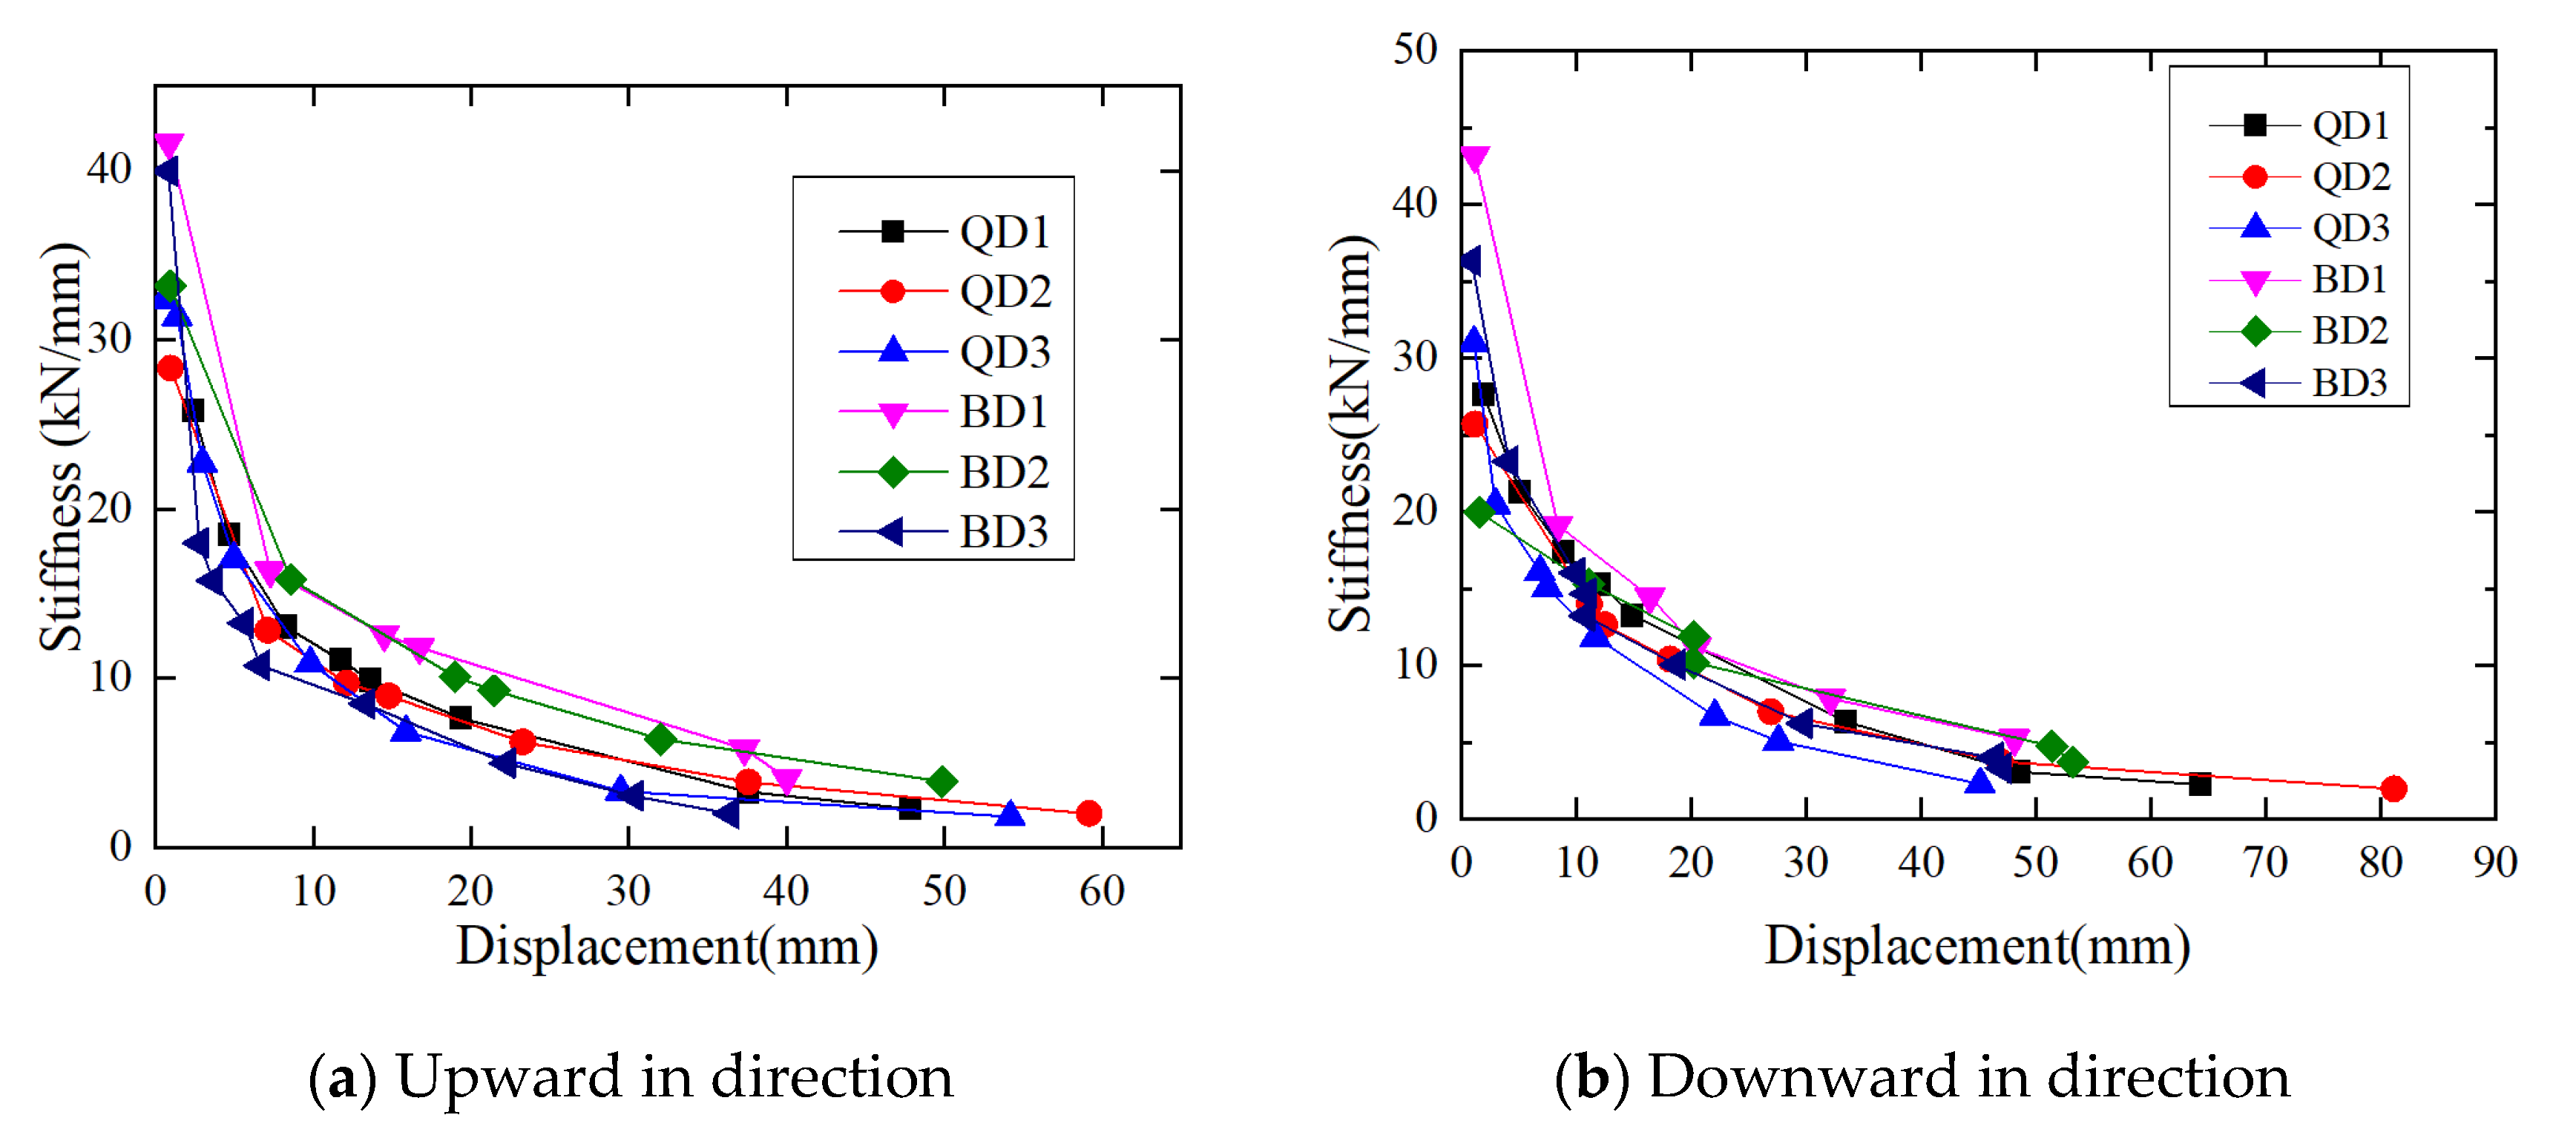
3.3. Stiffness Degradation

In order to evaluate the stiffness reduction level of the specimen, the secant stiffness (K) is defined, which is calculated by [30]:
K i = ( | + F i | + | F i | ) / ( | + X i | + | X i | ) ,
where +Fi and −Fi are the positive and negative maximum loads, respectively, and +Xi and −Xi are the corresponding displacements.
Since an asymmetrical reinforcement was used in this test, the extreme loads and displacements of each loading stage are different for upward and downward loading. Therefore, the secant stiffness in both positive and negative directions are adopted for the analysis. It is noted that the stiffness decreases continuously as the displacement levels increase, which is determined by the increasing cumulative damage in the tested specimens. The specimens experience severe stiffness degradation at the end of all tests. Figure 8 illustrates the trend of the stiffness degradation of six specimens, which show to be similar. In the elastic stage, the stiffness degradation is fast, and after yielding, it becomes smaller with the increase of displacement. The stiffness curves of QD1 and QD2, and BD1 and BD2 are very similar, and the degradation trend is slower than the one of QD3 and BD3, respectively. This phenomenon indicates that the specimen with higher reinforcement ratios has lower rates of stiffness degradation. Moreover, there is little relevance between the axial compression ratios and stiffness degradation.

3.4. Ductility Comparison

Displacement ductility coefficient μ is used to characterize the ductility of joints, which is calculated by [30]:
μ = Δ u Δ y ,
where Δu is the displacement when the load falls to 85% of the maximum load, and Δy is the yield displacement of the specimen. The ductility of each stage is listed in Table 5. It can be seen that the ductility coefficients of the series QD are bigger than that of the series BD and the ductility of the specimens increases with the decrease of the reinforcement ratio. The ductility coefficients of the specimens QD3 and BD3 are over 4, showing that the joints have adequate ductility and excellent seismic performance. Except for BD1 and BD2, the ductility coefficients of other specimens are over 3, which meets the requirements of current codes (GB50011-2010) [29].

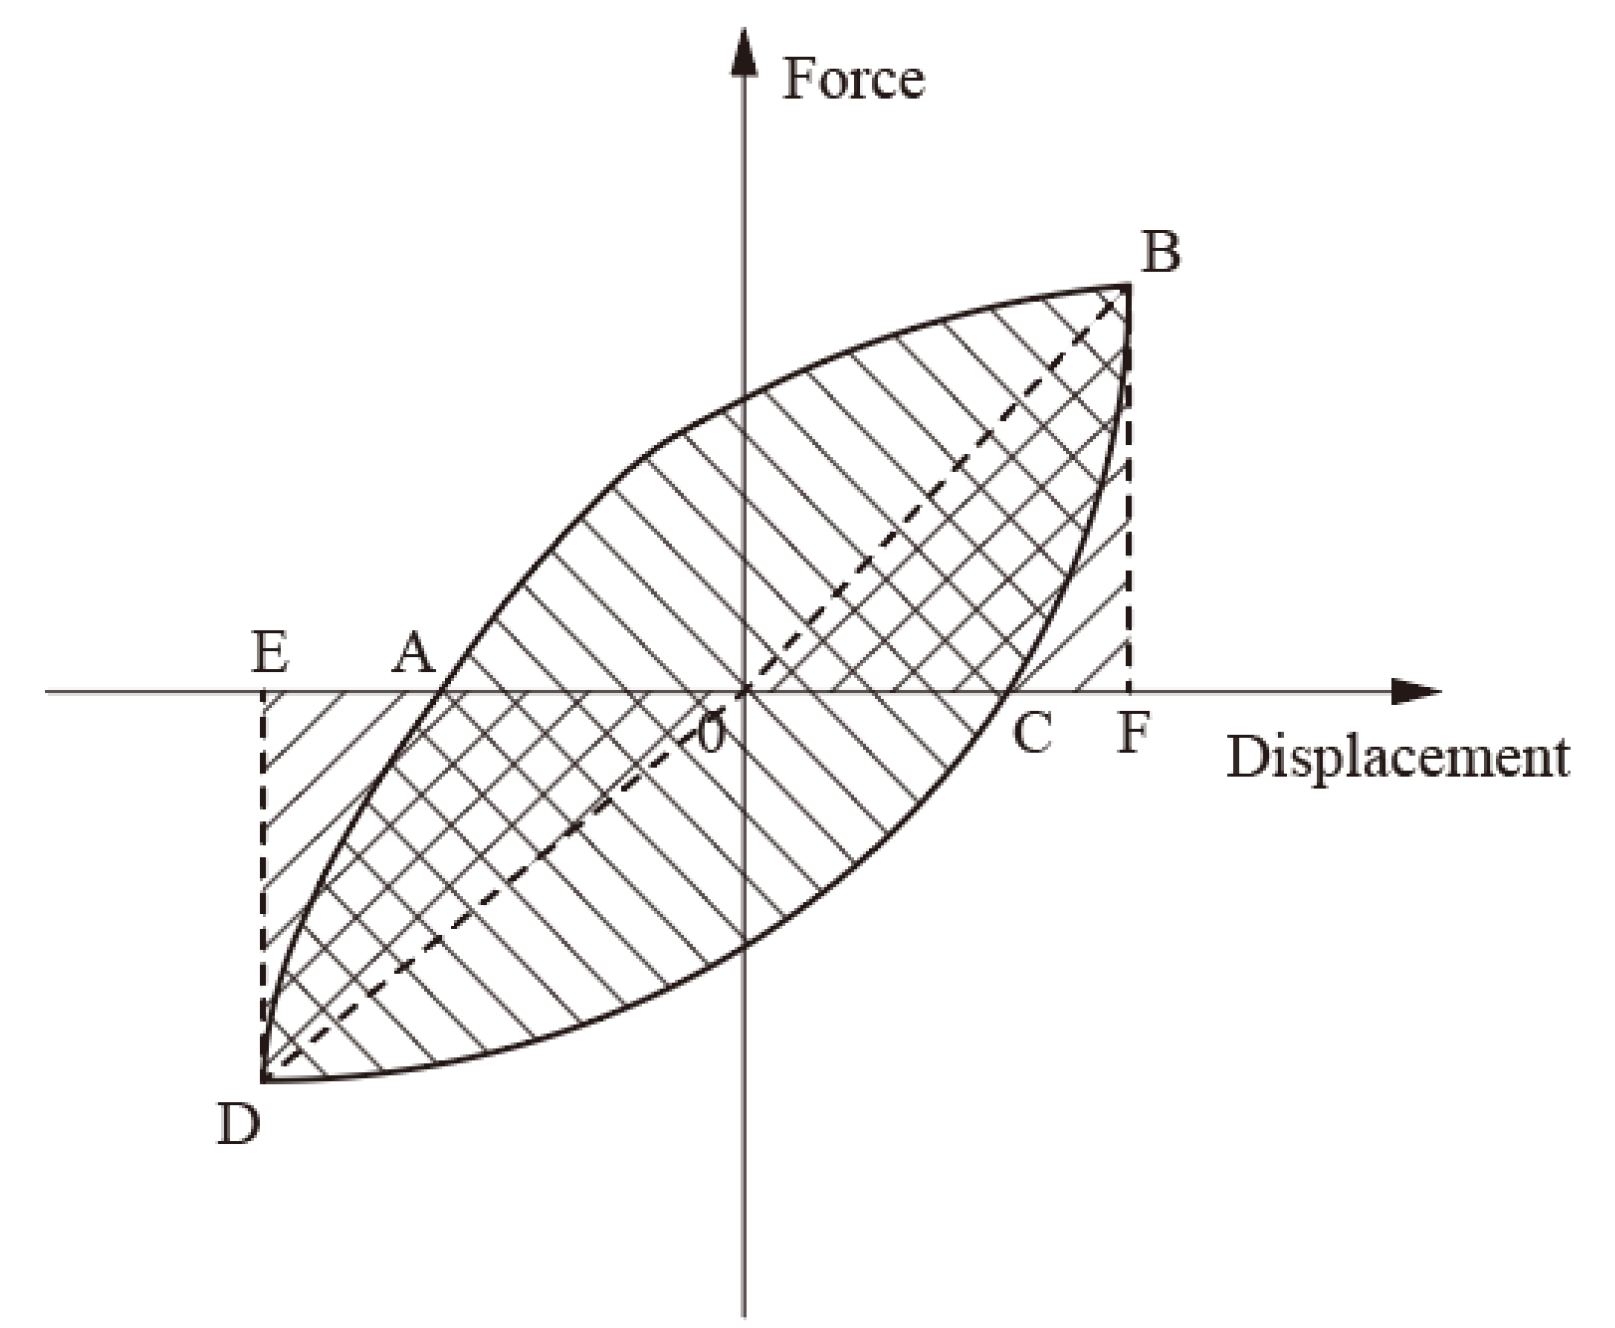
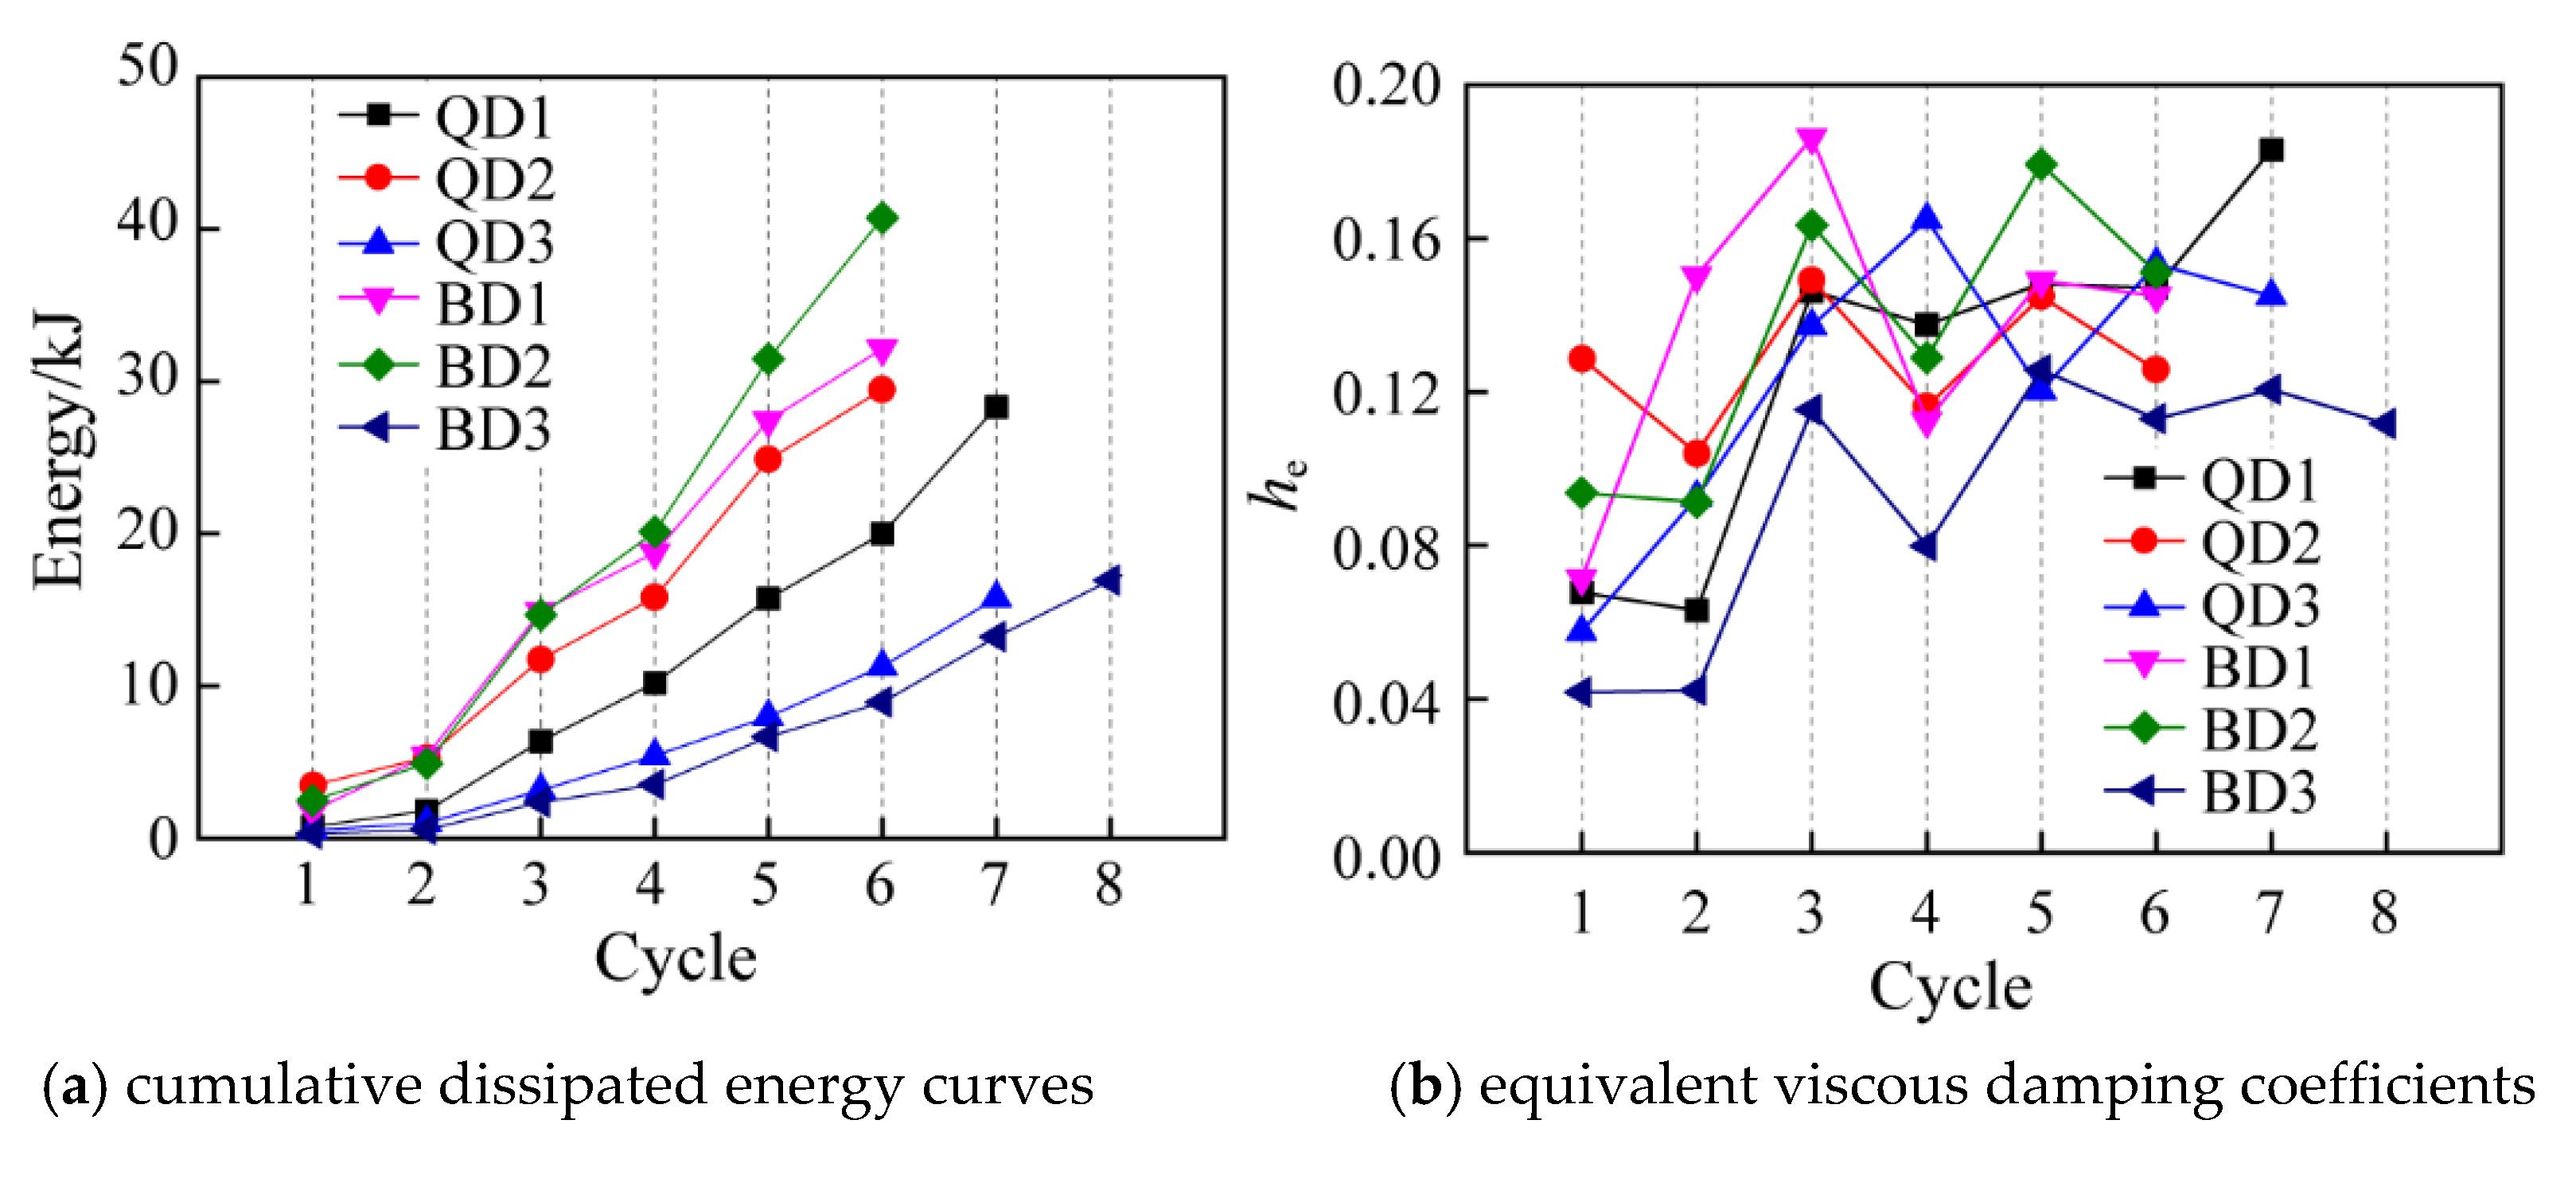
3.5. Energy Dissipation

The energy dissipation capacity is a significant parameter in the understanding of the frame structures. Our study uses two parameters to investigate the energy dissipation ability of beam–column joints, including cumulative dissipated energy and equivalent viscous damping coefficient. The dissipated energy is calculated as the area underneath the hysteretic curve. As shown in Figure 9, the dissipated energy for each cycle is equal to the area enclosed by the hysteresis loop ABCDA, SABCDA. Cumulative dissipated energy increases with displacements for each specimen, as shown in Figure 10a. It can be noted that dissipated energy increases with the reinforcement ratio. The dissipated energy of BD1 and BD2 are larger than those of BD3 and QD3. Moreover, the axial compression ratio has a negative influence on the cumulative dissipated energy of specimens, which can be found from the comparison between BD2 and BD1, or QD2 and QD1.
The energy dissipation capacity of the specimen can also be expressed by an equivalent viscous damping ratio he, a major index to measure the seismic performance of the specimen. It is calculated by [30]:
h e = 1 2 π S A B C D A S Δ O B F + S Δ O D E ,
where SABCDA is the area enclosed by the hysteresis loop ABCDA. SΔOBE and SΔODF are the areas of the triangles OBF and ODE, respectively, as shown in Figure 9. The parameter can reflect the relationship between the dissipated energy and elastic energy in the loading cycle.
Figure 10b illustrates that the equivalent viscous damping coefficients of all specimens are generally on the rise. In contrast, the development of pinching behavior leads to a slower upward trend, even a downward trend. Before the first cycle of 2Δy level, he of BD1 is greater than that of BD2, while he of BD2 is greater than that of BD1 after the second cycle of 2Δy level. This indicates that the pinching phenomenon of BD1 increases with the displacement. In general, BD1 and BD2 perform better than QD1 and QD2, which indicates that the increase of reinforcement ratio in a certain range can help to improve the energy dissipation capacity.

4. Conclusions

This paper comprehensively introduces the test phenomenon of Grade 600 MPa steel bars reinforced concrete frame beam–column joints by cycle loading on six specimens. The hysteretic curve, skeleton curve, energy dissipation, and ductility of each specimen are investigated. Moreover, it compares the influence of different reinforcement ratios and axial compression ratios on the seismic behavior of the joints. The hysteretic curve of the beam–column joints with high strength steel bars is generally in inverse S shape. It is noteworthy that the ductilities of QD3 and BD3 are high, but the corresponding energy dissipation capacities are poor because of the lower reinforcements ratios. It can be conducted that the energy dissipation capacities of the joints with higher reinforcement ratios are better than those of the joints with lower reinforcement ratios. Furthermore, the energy dissipation of the joints with lower axial compression ratios is better. In contrast, the ductility of the joints with lower reinforcement ratios is superior. Moreover, the influence of the axial compression ratio is negative for the ductility. The stiffness degradation speed of the joints with a higher reinforcement ratio is slower, while the effect of the axial compression is small. It is remarkable that the damages in joint panels of BD1 and BD2 are evident, and the corresponding ductilities are smaller than others. The phenomenon can reflect that there are higher shear demands beyond the requirement provided by current codes in a high-intensity region, which can be solved by the use of high strength concrete materials.

Author Contributions

Conceptualization and Supervision, J.F. and J.C.; Investigation, J.Y., Q.Z.; writing—original draft preparation, S.W. and M.M.; All authors have read and agreed to the published version of the manuscript.

Funding

The work presented in this manuscript was supported by the National Key Research and Development Program of China (2018YFC0705800) and Postgraduate Research & Practice Innovation Program of Jiangsu Province (SJKY19_0091).

Acknowledgments

The authors gratefully acknowledge the financial support of the National Key Research and Development Program of China and Postgraduate Research & Practice Innovation Program of Jiangsu Province.

Conflicts of Interest

The authors declare no conflict of interest.

References

  1. Kim, J.; LaFave, J.M. Key influence parameters for the joint shear behaviour of reinforced concrete (RC) beam–column connections. Eng. Struct. 2007, 29, 2523–2539. [Google Scholar] [CrossRef]
  2. Liu, Y.; Zhou, B.; Cai, J.; Lee, D.S.-H.; Deng, X.; Feng, J. Experimental study on seismic behavior of precast concrete column with grouted sleeve connections considering ratios of longitudinal reinforcement and stirrups. Bull. Earthq. Eng. 2018, 16, 6077–6104. [Google Scholar] [CrossRef]
  3. Liu, Y.; Cai, J.; Deng, X.; Cao, Y.; Feng, J. Experimental study on effect of length of service hole on seismic behavior of exterior precast beam-column connections. Struct. Concr. 2018, 20, 85–96. [Google Scholar] [CrossRef] [Green Version]
  4. Alaee, P.; Li, B. Analytical Investigations of Reinforced Concrete Beam–Column Joints Constructed Using High-Strength Materials. J. Earthq. Eng. 2018, 24, 774–802. [Google Scholar] [CrossRef]
  5. Behnam, H.; Kuang, J.; Huang, Y. Exterior RC wide beam-column connections: Effect of beam width ratio on seismic behaviour. Eng. Struct. 2017, 147, 27–44. [Google Scholar] [CrossRef]
  6. Favvata, M.J.; Karayannis, C.G. Influence of pinching effect of exterior joints on the seismic behavior of RC frames. Earthq. Struct. 2014, 6, 89–110. [Google Scholar] [CrossRef]
  7. Shafaei, J.; Hosseini, A.; Marefat, M.S. Seismic retrofit of external RC beam–column joints by joint enlargement using prestressed steel angles. Eng. Struct. 2014, 81, 265–288. [Google Scholar] [CrossRef]
  8. Yang, I.-H.; Park, J.; Bui, T.Q.; Kim, K.-C.; Joh, C.; Lee, H. An Experimental Study on the Ductility and Flexural Toughness of Ultrahigh-Performance Concrete Beams Subjected to Bending. Materials 2020, 13, 2225. [Google Scholar] [CrossRef]
  9. Bywalski, C.; Kaźmierowski, M.; Kamiński, M.; Drzazga, M. Material Analysis of Steel Fibre Reinforced High-Strength Concrete in Terms of Flexural Behaviour. Experimental and Numerical Investigation. Materials 2020, 13, 1631. [Google Scholar] [CrossRef] [Green Version]
  10. Ahmed, T.W.; Ali, A.A.M.; Zidan, R.S. Properties of high strength polypropylene fiber concrete containing recycled aggregate. Constr. Build. Mater. 2020, 241, 118010. [Google Scholar] [CrossRef]
  11. Ashtiani, M.S.; Dhakal, R.P.; Scott, A.N. Seismic Performance of High-Strength Self-Compacting Concrete in Reinforced Concrete Beam-Column Joints. J. Struct. Eng. 2014, 140, 04014002. [Google Scholar] [CrossRef] [Green Version]
  12. Lee, H.-S.; Jang, H.-O.; Cho, K. Evaluation of Bonding Shear Performance of Ultra-High-Performance Concrete with Increase in Delay in Formation of Cold Joints. Materials 2016, 9, 362. [Google Scholar] [CrossRef] [Green Version]
  13. Restrepo, J.I.; Seible, F.; Stephan, B.; Schoettler, M.J. Seismic Testing of Bridge Columns Incorporating High-Performance Materials. ACI Struct. J. 2006, 103, 496–504. [Google Scholar] [CrossRef]
  14. Li, B.; Leong, C.L. Experimental and Numerical Investigations of the Seismic Behavior of High-Strength Concrete Beam-Column Joints with Column Axial Load. J. Struct. Eng. 2015, 141, 04014220. [Google Scholar] [CrossRef]
  15. Alavi-Dehkordi, S.; Mostofinejad, D.; Alaee, P. Effects of high-strength reinforcing bars and concrete on seismic behavior of RC beam-column joints. Eng. Struct. 2019, 183, 702–719. [Google Scholar] [CrossRef]
  16. Guo, Z.; Ma, Y.; Wang, L.; Zhang, J.; Harik, I.E. Corrosion Fatigue Crack Propagation Mechanism of High-Strength Steel Bar in Various Environments. J. Mater. Civ. Eng. 2020, 32, 04020115. [Google Scholar] [CrossRef]
  17. Li, L.; Zheng, W.; Wang, Y. Strain Penetration of High-Strength Steel Bars Anchored in Reinforced Concrete Beam-Column Connections. Struct. Eng. Mech. 2019, 72, 367–382. [Google Scholar] [CrossRef]
  18. Kim, C.; Kim, S.; Kim, K.-H.; Shin, D.; Haroon, M.; Lee, J.-Y. Torsional Behavior of Reinforced Concrete Beams with High-Strength Steel Bars. ACI Struct. J. 2019, 116, 251–263. [Google Scholar] [CrossRef]
  19. Zhang, J.; Li, X.; Cao, W.; Yu, C. Cyclic behavior of steel tube-reinforced high-strength concrete composite columns with high-strength steel bars. Eng. Struct. 2019, 189, 565–579. [Google Scholar] [CrossRef]
  20. Lee, H.J.; Chang, C.-J. High-Strength Reinforcement in Exterior Beam-Column Joints under Cyclic Loading. ACI Struct. J. 2017, 114, 1325–1338. [Google Scholar] [CrossRef]
  21. Tavallali, H.; Lepage, A.; Rautenberg, J.M.; Pujol, S. Concrete Beams Reinforced with High-Strength Steel Subjected to Displacement Reversals. ACI Struct. J. 2014, 111, 1037–1047. [Google Scholar] [CrossRef]
  22. ACI Committee 318. Building Code Requirements for Structural Concrete (ACI 318-14) and Commentary (318R-14); American Concrete Institute: Farmington Hills, MI, USA, 2014. [Google Scholar]
  23. MOHURD (Ministry of Housing and Urban-Rural Development of the People’s Republic of China). Code for Design of Concrete Structures (2015 Version), GB 50010-2010; China Architecture & Building Press: Beijing, China, 2015. (In Chinese)
  24. Hwang, S.-J.; Lee, H.-J.; Liao, T.-F.; Wang, K.-C.; Tsai, H.-H. Role of Hoops on Shear Strength of Reinforced Concrete Beam-Column Joints. ACI Struct. J. 2005, 102, 445–453. [Google Scholar] [CrossRef]
  25. Hwang, H.-J.; Park, H.-G.; Choi, W.-S.; Chung, L.; Kim, J.-K. Cyclic Loading Test for Beam-Column Connections with 600 MPa (87 ksi) Beam Flexural Reinforcing Bars. ACI Struct. J. 2014, 111, 913–924. [Google Scholar] [CrossRef]
  26. Wang, D.; Ju, Y.Z.; Zheng, W.Z. Strength of Reactive Powder Concrete Beam-Column Joints Reinforced with High-Strength (HRB600) Bars Under Seismic Loading. Strength Mater. 2017, 33, 139–151. [Google Scholar] [CrossRef]
  27. Alaee, P.; Li, B. High-strength concrete exterior beam-column joints with high-yield strength steel reinforcements. Eng. Struct. 2017, 145, 305–321. [Google Scholar] [CrossRef]
  28. Kang, T.H.-K.; Kim, S.; Shin, J.H.; LaFave, J.M. Seismic Behavior of Exterior Beam-Column Connections with High-Strength Materials and Steel Fibers. ACI Struct. J. 2019, 116, 31–43. [Google Scholar] [CrossRef]
  29. MOHURD (Ministry of Housing and Urban-Rural Development of the People’s Republic of China). Code for Seismic Design of Buildings (2016 Version), GB 50011-2010; China Architecture & Building Press: Beijing, China, 2016. (In Chinese)
  30. MOHURD (Ministry of Housing and Urban-Rural Development of the People’s Republic of China). Specification of Testing Methods for Earthquake Resistant Building, JGJ/T101-2015; China Architecture & Building Press: Beijing, China, 2015. (In Chinese)
Figure 1. Reinforcement details of specimens (a) QD1; (b) BD1 (mm).
Applsci 10 04684 g001
Figure 2. Schematic configuration of the test setup.
Applsci 10 04684 g002
Figure 3. General view of the test setup.
Applsci 10 04684 g003
Figure 4. Loading sequence.
Applsci 10 04684 g004
Figure 5. Failure modes of the six specimens. (a) QD1; (b) QD2; (c) QD3; (d) BD1; (e) BD2; (f) BD3.
Applsci 10 04684 g005aApplsci 10 04684 g005b
Figure 6. Hysteretic curves for six specimens. (a) QD1; (b) QD2; (c) QD3; (d) BD1; (e) BD2; (f) BD3.
Applsci 10 04684 g006
Figure 7. Skeleton curves.
Applsci 10 04684 g007
Figure 8. Stiffness degradation of the six specimens in two directions. (a) upward in direction; (b) downward in direction.
Applsci 10 04684 g008
Figure 9. Hysteretic loop.
Applsci 10 04684 g009
Figure 10. Energy dissipation curves for six specimens. (a) cumulative dissipated energy; (b) equivalent viscous damping coefficient.
Applsci 10 04684 g010
Table 1. Classification of specimens.
SeriesQDBD
Site category
Seismic fortification intensity78
Ground acceleration value0.1 g0.2 g
Anti-seismic grade
Table 2. Layout of test specimens.
SpecimenQD1QD2QD3BD1BD2BD3
BeamTop bars (area ratio %)3F20
(0.820)
3F20
(0.820)
3F16
(0.520)
4F20
(1.100)
4F20
(1.100)
4F16
(0.696)
Bottom bars (area ratio %)2F20
(0.546)
2F20
(0.546)
2F16
(0.346)
3F20
(0.820)
3F20
(0.820)
2F16
(0.348)
StirrupsD8@100D8@100D8@100D8@100D8@100D8@100
ColumnSteel Bars (area ratio %)8D25
(1.940)
8D22
(1.500)
8D20
(1.240)
12D25
(2.910)
12D22
(2.250)
8D20
(1.240)
StirrupsD8@100D8@100D8@100D8@100D8@100D8@100
Axial compression ratios0.3000.2200.2200.3000.2200.220
Table 3. Mechanical properties of steel bars.
Type of ReinforcementD8D20D22D25F16F20
fy1 (MPa)527496481487685633
Es2 (105 MPa)2.01.991.951.961.851.97
1 standard yield strength of reinforcement; 2 elastic modulus.
Table 4. Strength of six specimens in two loading directions.
SpecimenLoading DirectionYield Load fy (kN)Ultimate Load fu (kN)Failure Load f l (kN)fu/fy
QD1up129.82147.54123.901.14
down182.73212.28180.001.16
QD2up120.80145.84124.001.20
down182.79202.95171.701.11
QD3up87.00108.6092.301.25
down133.00147.72125.601.11
BD1up182.28217.54184.901.19
down237.37252.28214.401.06
BD2up186.00205.96175.101.11
down229.85242.46206.101.05
BD3up74.00113.2096.201.53
down158.00187.50159.401.19
Table 5. Ductility of specimens.
SpecimenLoading DirectionΔy (mm)Δu (mm)μ
QD1up1237.573.13
down1546.303.09
QD2up1355.364.26
down1771.404.20
QD3up940.224.47
down1134.123.10
BD1up1440.002.86
down1648.093.00
BD2up1650.993.19
down1853.162.95
BD3up730.334.33
down1047.054.70

