1. Introduction
Modern societies are highly dependent on complex, large-scale, software-intensive systems that operate increasingly within an environment of continuous availability, which is challenging to maintain and evolves in response to the inevitable changes in stakeholder goals and requirements of the systems [
1]. Such software products undergo constant change to adapt to a changing environment [
2]. Therefore, software evolution is an important aspect in the field of software development that has to be addressed properly [
3]. Among other aspects of software quality, software evolution is addressed in the process of quality assurance, which represents the set of activities carried out to ensure that the system has sufficient quality [
4]. Consequently, one of the essential objectives of software engineering is to develop techniques and tools for high-quality software solutions that are stable and maintainable [
5]. Software maintainability is one of the most important aspects when evaluating the quality of a software product [
6] and is one of key stages in the software development lifecycle [
7].
Usually, software maintenance includes activities related to modifications of a software product, such as corrections, improvements or adoptions of the software to changes in the environment, requirements, and functional specifications [
8]. As such, software maintenance is an expensive activity that consumes a major portion of the cost of the total project [
9]. According to studies, it has been observed that, for the entire life cycle of the software product, only 30–40% is consumed in development and about 60–70% is consumed in the maintenance of the product in terms of resources, time, money, and effort [
10,
11]. The efficiency of the maintenance phase depends largely on factors related to documentation and programming quality, system requirements, personnel resources, and process management [
12]. Considering all these factors, the maintainability of a software product is, in general, defined as the ease with which a software system or component can be modified to change or add capabilities, correct faults or defects, improve performance or other attributes, or adapt to a changed environment [
8]. In short, there is a belief that high-quality software is easy to maintain, so minimum time and effort is needed to fix the faults [
7,
13].
The software maintainability estimation is an important aspect of the project planning which involves the determination of a number of factors, including duration, staff, size, cost, and effort to guarantee the control of the maintenance process and reduce the risks and the inefficiencies related to the maintenance work [
13,
14,
15]. The key challenge with software maintainability measurements is that maintainability cannot be measured directly [
14]. For example, the ISO/IEC 25010 standard [
16] specifies software maintainability as one of eight high-level quality characteristics of the software quality. The maintainability of a software product, as defined by the ISO/IEC 25010 quality model, consists of five further sub-categories, namely, modularity, reusability, analysability, modifiability, and testability. A variety of software quality aspects involved in the software maintainability assessment process make the process difficult to measure accurately in its natural environment. Since it is difficult to measure maintainability directly, researchers and practitioners often use various product metrics as their indicators [
17]. The approach is based on observing the effect of different code-level software metrics on maintainability by collecting maintainability data using indirect schemas, such as fault data during system testing, development effort, and maintenance data through subjective evaluation of software [
18]. Besides code-level maintainability measurements, researchers and practitioners use a variety of alternate approaches, e.g., effort, duration, and costs [
15].
In the paper, we aim to demonstrate the performance of maintainability prediction models built on different amounts of historic measurements of software metrics. The goal was not to optimise the prediction models, but to research if additional historic software metric measurement data contribute to the its performance. In iterations of the experiment, we built software maintainability prediction models, whereby each iteration added a layer of software metrics measurements of precedingly released versions of a software project. In the study, we aimed to verify the performance of software maintainability prediction models improved by version-to-version changes in software metric measurements. To achieve our research goals, we followed an example of other similar studies in the field of software quality management, e.g., the study conducted by Kaur and Mishra [
2]. Instead of relying on single release measurements of a software product, our approach considers a history data of software metric changes through time. As in the work of Reddy and Ojha [
19], the maintainability of the software projects used in the study was assessed by the maintainability index. Given the above assumptions, we have raised the following research questions:
RQ1: How do additional layers of software metric measurement data contribute to the performance of future software maintainability prediction?
RQ2: Which software metrics from the C&K metric set have a strong impact on the performance of future software maintainability prediction?
To answer the research questions, we experimented on open-source Java-based software projects with publicly available release history. Based on the related work, we assessed the internal quality of the software projects with the C&K metric set. Since the historic software metrics data measured on previous releases of software provide additional information to machine learning or statistical models, it is intuitive to assume that this additional information will contribute to more successful prediction models. To verify this assumption, software metric measurements extracted from preceding releases of software components were added to the maintainability prediction model gradually to verify whether they improved the prediction.
The contributions of this paper are the following:
Application of machine learning techniques to future software maintainability prediction.
Investigation of the impact of historic software metrics measurement from previous releases on the future software maintainability prediction.
Investigation of the impact of individual C&K software metric changes between historic software releases on the future software maintainability prediction.
The remainder of this paper is structured as follows. First, in
Section 2, we start with an overview of the basic concepts regarding maintainability prediction models and software evolution analysis.
Section 3 introduces a brief literature overview of related works. Next, we outline the data collection and preparation process in
Section 4. Additionally, in
Section 4 we describe the design of the experiment. The results of the research are displayed in
Section 5. The discussion, including the threads to the validity of our research, is presented in
Section 6.
Section 7 concludes the paper and shows the direction for future work.
2. Software Metrics and the Maintainability
The relationship between software design metrics and their maintainability has been proposed and validated by many researchers [
6,
9]. Based on the empirical study by Malhotra and Chug, it has been established that the quality of the software design, as well as code, is very important to enhance software maintainability [
9]. On the code-level, software metrics play the most significant role in building predictive models of software maintainability [
14]. Although researchers have proposed different software metric sets, care should be taken in their selection. Namely, the performance of the software maintainability prediction depends on choosing the right software metric or set of them.
Software size has, typically, been considered as a key attribute of several software products, including object-oriented classes [
20], usually measured by counting the number of lines of code (LOC). Besides the measure of size, early structural measurements included complexity measures by McCabe [
21] and Halstead [
22]. With the shift towards the object-oriented paradigm, additional attributes of the internal quality of software systems came to the fore.
Due to object-oriented paradigms, specific concepts like classes, objects, inheritance, and encapsulation [
23], practitioners started giving importance to the design rather than code aspects of projects, such as coupling, cohesion, polymorphism, and inheritance [
9]. In line with the object-oriented paradigm, researchers Chidamber and Kemerer [
24] presented the theoretical work to define a set of six software metrics (known as the C&K metric set) that can be used for assessment of software internal quality: DIT, WMC, NOC, CBO, RFC, and LCOM.
Table 1 provides a list of C&K software metrics with their detailed descriptions. Because all software metric measurement tools do not provide C&K metric measurements out-of-the-box,
Table 1 additionally provides its counterparts as measured by the tool JHawk, which was used in this study. The proposed set of metrics was later revised by Kitchenham [
25] using the metric-evaluation framework and criticised in some aspects. Based on the C&K metric set and the findings of Kitchenham’s work, Li [
26] proposed an enhanced set of alternative metrics, presented in the following paragraph. Despite critics [
25,
27,
28] for several reasons, e.g., the software metric selection controversy and language binding, the set of measures proposed by Chidamber and Kemerer is probably the most popular predefined set of measures [
9,
29].
In their study, Li and Henry [
31] revised the software metrics suite proposed by C&K in the context of maintainability assessment of software systems. Based on the findings of the study, they proposed a metrics set of 10 object-oriented metrics that are suitable for maintainability assessment; five of the metrics came from the C&K metrics set, and the additional five metrics they proposed by themselves, namely MPC, DAC, NOM, SIZE1, and SIZE2. The proposed metric set preserved all metrics from the C&K metric set except the CBO metric. Besides the C&K metric set, the L&H metric set is the most commonly used one in empirical validations [
9].
Several approaches use polynomial functions to aggregate multiple measurements into one single number [
32]. One of the first approaches suggested and validated was the maintainability index introduced by Oman [
33]. One of the compound metrics defined in the early 1990 s which aimed to have achieved that goal was the maintainability index which represents the relative ease of maintaining the software code [
19]. The value of the maintainability index is computed from the composition of values, including measures of effort and complexity, i.e., McCabe’s cyclomatic complexity [
34]. This maintainability index has evolved into numerous variants, as regards the metrics and weights used in a formula.
Predicting Software Maintainability
In general, software maintainability depends on various aspects of software modification, including correction, improvement, efficiency, and prevention [
14]. The inability to measure maintainability directly and holistically remains the open challenge of software maintainability measurement. Additionally, the lack of a uniform definition of maintainability throughout different quality models leaves room for a variety of measurement approaches. Several prediction models have been proposed by researchers that measure software maintainability through indirect measures, such as change, maintainability index, and change proneness [
14]. The indirect maintainability measures combined with a variety of software metrics that capture the quality of software’s internal quality, represent efficient input for either statistical or machine learning algorithms to make useful prediction models. To establish a relationship between software design metrics as the independent variable and maintainability as the dependent variable, various techniques have been practised in the last two and half decades [
9], including statistical algorithms, machine learning algorithms, nature-inspired techniques, expert judgment, and hybrid techniques [
6,
19].
In 1993, researchers Li and Henry [
31] proposed a prediction model that estimated the maintainability of the software system based on the change metric, which was introduced as a measure of maintenance effort. Paper shows that more frequent changes, reflected in higher values of change metric, indicate lower maintainability of the software. Based on a change metric and a set of L&K metrics, the maintainability prediction model was built with the use of a multivariant regression analysis model. Based on Li and Henry’s metric suite Aggarwal [
35], and later Dubey [
36], proposed additional models based on artificial neural networks. In a similar work, Jha et al. [
37] explored the use of a deep learning model in the maintainability prediction based on a measurement of 28 software metrics and dependent variable of number count of added, deleted, and modified lines of code in a class. The results of the experiment confirmed the efficiency of the proposed deep learning model for software maintainability prediction.
The research of Oman and Hagemeister [
38] proposed the maintainability index, a single-valued, composite metric calculated from software size and complexity metrics [
14]. The study conducted by Coleman and Ash [
39] demonstrated the usability of maintainability index-based maintainability analysis in software-related decision-making. The initially proposed maintainability index model underwent an evolution, and was fine-tuned over time. As more data became available from varying industrial sources, a greater degree of confidence developed in the fit of certain metrics. As a result, the original single, four and five-metrics models gave way to three and four-metric maintainability index models [
40]. The four-metric maintainability index model, compared to the three-metric maintainability index model, includes an additional metric qualifying the quality of the comments in the code. In case comments in the code do not contribute to the maintainability significantly, for example, due to the self-descriptiveness of the code, the three-metric maintainability index model is preferred [
40]. While the metric has been used frequently in the past by practitioners and academics, no study has shown empirically that the metric can be applied to assess the maintainability of object-oriented code [
34]. Although the maintainability index was criticised heavily for this reason [
41,
42], according to the systematic literature review performed by Alsolai and Roper [
14], the proposed alternatives did not reach general acceptance. The maintainability index formula used in the study is depicted in Equation (1).
The software maintainability prediction model used in work conducted by Elish et al. [
43], and Malhotra and Khanna [
44] is based on the change proneness of the class. The change proneness is defined as the likelihood that a change would occur in a class after the release of the software [
45,
46]. A value of change proneness is a Boolean attribute, which means it allocates a state “true” in case the class is likely to change, and state “false” in case a class is unlikely to change in the future. According to the definition of the change proneness, any insertions, deletions, or modifications of program code between two investigated software product versions is considered a change. To allocate a “false” value, the observed class does not undergo any change during the evolution of the software product. On change, the proneness-based maintainability model takes the change process as a dependent variable, whereas measures of the C&K metric suite are taken as independent variables.
3. Software History as an Indicator
The research of the software evolution through the time perspective has been the subject of many studies. The most relevant for this study will be presented below.
In their study, Gezici et al. [
47] conducted multiple case studies to explore the characteristics of mobile applications through their evolution. In the study, a total of 105 releases of 6 mobile applications were analysed in detail. The characteristics of software evolution were observed through internal quality, external quality, and relations between these two. The evolution of internal quality attributes throughout releases of studied software was explored through three laws, namely Lehman’s Increasing Complexity, Continuous Growth, and Decreasing Quality. In the study, the external quality was analysed by adopting DeLone and McLean’s model [
48] of information system success, and measuring community-based metrics collected from the repositories GitHub, SourceForge.net, and SimilarPlay store. Based on the collected data corresponding success, an index was derived for each mobile application.
In a similar work, Frantz et al. [
49] addressed the challenge of choosing the most appropriate integration framework on the market. In the article, researches review the newest stable versions of four open-sources integration frameworks by analysing how they have evolved regarding their adaptive maintainability over the last five years. In the research, change of maintainability was calculated exclusively between the newest stable version of the software product and the release published five years ago. Intermediate releases were not subjected to the study. The maintainability was assessed holistically through 25 software metrics, divided into four groups that cover a wide range of quality attributes of a software product, namely size, coupling, complexity, and inheritance. The maintainability of a software product was assessed as a positive or negative change in individual observed software metrics.
Kaur and Mishra [
2] investigated cognitive complexity as a quantifier of the version to version change-proneness of Java files. The study aimed to test if cognitive complexity is analogous, or even superior, for change-proneness prediction in comparison to some of the other similar previously introduced complexity and change-process prediction measures. As part of the research, an empirical experiment was conducted with multiple successively released versions of two Java-based software projects. The cognitive complexity of Java files has been calculated as consistent with the cognitive weights of its basic control structures.
In their study, Liu et al. [
50] introduced the historical sequence of metrics (HVMS), a structure of joined metrics that highlights the sequential information of file’s changes across versions. The HVMS was used for building the defect prediction model. The HVMS is defined for a particular source file in an observed software product and can be of any length. Consequently, on the level of a specific software project, a specific HVMS is defined for each source file in the project. The aim of the study was to extend the ability of current code metrics and process metrics-based prediction models, that describe the software module’s change over the project evolution incompletely. The HVSM highlights the historical trend that files change in a version sequence. The study shows achieved better performances of defect prediction models.
Farago et al. [
51] studied how some of the version control history-based metrics affect the maintainability of the source code. The main motivation of the researches was to investigate the effect of the development process on the maintainability of the program code. Namely, the authors of the study observed changes in cumulative code churn, the number of modifications, ownership, and age throughout studied successive versions of the software. For the study, four Java-based open-source software systems were included in the survey, namely Ant, JEdit, Log4J, and Xerces. For each software product, 2–5 successive releases were analysed.
In their study, Pati et al. [
3] applied machine learning strategies for temporal analysis of software clone evaluation using software metrics. The focus of the research was to investigate how cloned code fragments, which are, according to the previous studies, considered as a bad smell, affect software quality and maintainability. The authors proposed the modelling approach to the evolution of clones in the software applications. Additionally, they also proposed the model for the prediction of cloned components in subsequent versions of the software. The experiments were conducted on the open-sourced project ArgoUML, for which 19 sequential versions were obtained.
Furthermore, Javed and Alenzi [
5], in their empirical study, researched the evolution of two Java-based open-source software products in the context of defectiveness of the observed software. In the study, the authors obtained four releases of Ant and six releases of jEdit software. For each release of the software product, 19 software metrics were calculated, assessing four dimensions of the internal software quality of the studies released, namely coupling, cohesion, inheritance, and product size. The study confirmed the correlation between good design of software and fewer number of detected defects. Additionally, the study outlined the varying of the number of defects over the studied releases, whereby the study detected the decrease of defects over time.
In their study, Chawla and Chhabra [
52] proposed a quantitative framework for integrated software quality measurement in multi-version systems. The proposed framework aims to establish the measurement framework for ascertaining the relative progression of observed software quality attributes with each successive release. Additionally, the proposed approach can be used to validate the trend analyses of software metrics. In the study, the researchers compared trends of change density, defect density, and vulnerability density with the measured high-level software quality attributes proposed by the QMOOD quality model over the evolution of the studied software product. The experiment was based on four random successive releases of the seventh version of the open-sourced Tomcat server, whereby measured software quality attributes include reusability, flexibility, understandability, functionality, extendibility, and effectiveness.
In their study, Kaur et al. [
53] studied the relationship between code smells and maintainability problems, the change-proneness of software modules in particular. Among others, the researchers aimed to discover which machine learning techniques predict change-prone modules in mobile application software the most accurately, and which predictors of change-proneness are better, code smells or static code metrics. For the study, the change-proneness of a Java-based mobile application named MOVAC were studied throughout four releases of the software.
Several of these studies addressed the assessment of changes in different quality attributes over time. Our focus of research in this paper is directed exclusively toward the maintainability of software products, whereby studying the maintainability change over time is not our primary objective. Rather, we observe how different amounts of historic software metric measurements extracted from previous releases of a software project contribute to the prediction performance of the software maintainability. A summary of related works is shown in
Table 2.
4. Predicting the Change of Software Maintainability with the Historical Software Metrics
Many of the studies listed in an overview of related works examine different aspects of software quality through a time perspective. To predict potential risks that stem from the insufficient software quality accurately, temporal perspective gives a more holistic view on the state of software quality of a software product. Namely, the dynamics of software quality changes in the past set a solid foundation for the prediction of the software maintainability trends in the future. The latter can indicate the progression of software quality attributes’ erosion related to long-term software product sustainability, which, from the technical viewpoint, refers to the longevity of information, system, and infrastructure, and their adequate evolution within changing environmental conditions, which covers inter alia, system maintenance, obsolescence, and data integrity [
1]. The motivation behind this research is to investigate how additional data on quality attribute measurements obtained from previous releases influence the predictive ability of software maintainability prediction models.
To answer our research questions about the ability to predict the maintainability change in the future from the historical changes of software metrics, we performed the experiment, where we analysed multiple widely used open-source projects. The following sections describe the whole methodology of the experiment, from the data collection, data preparation, application of prediction machine learning methods, and the analysis of the results.
4.1. Empirical Data Collection
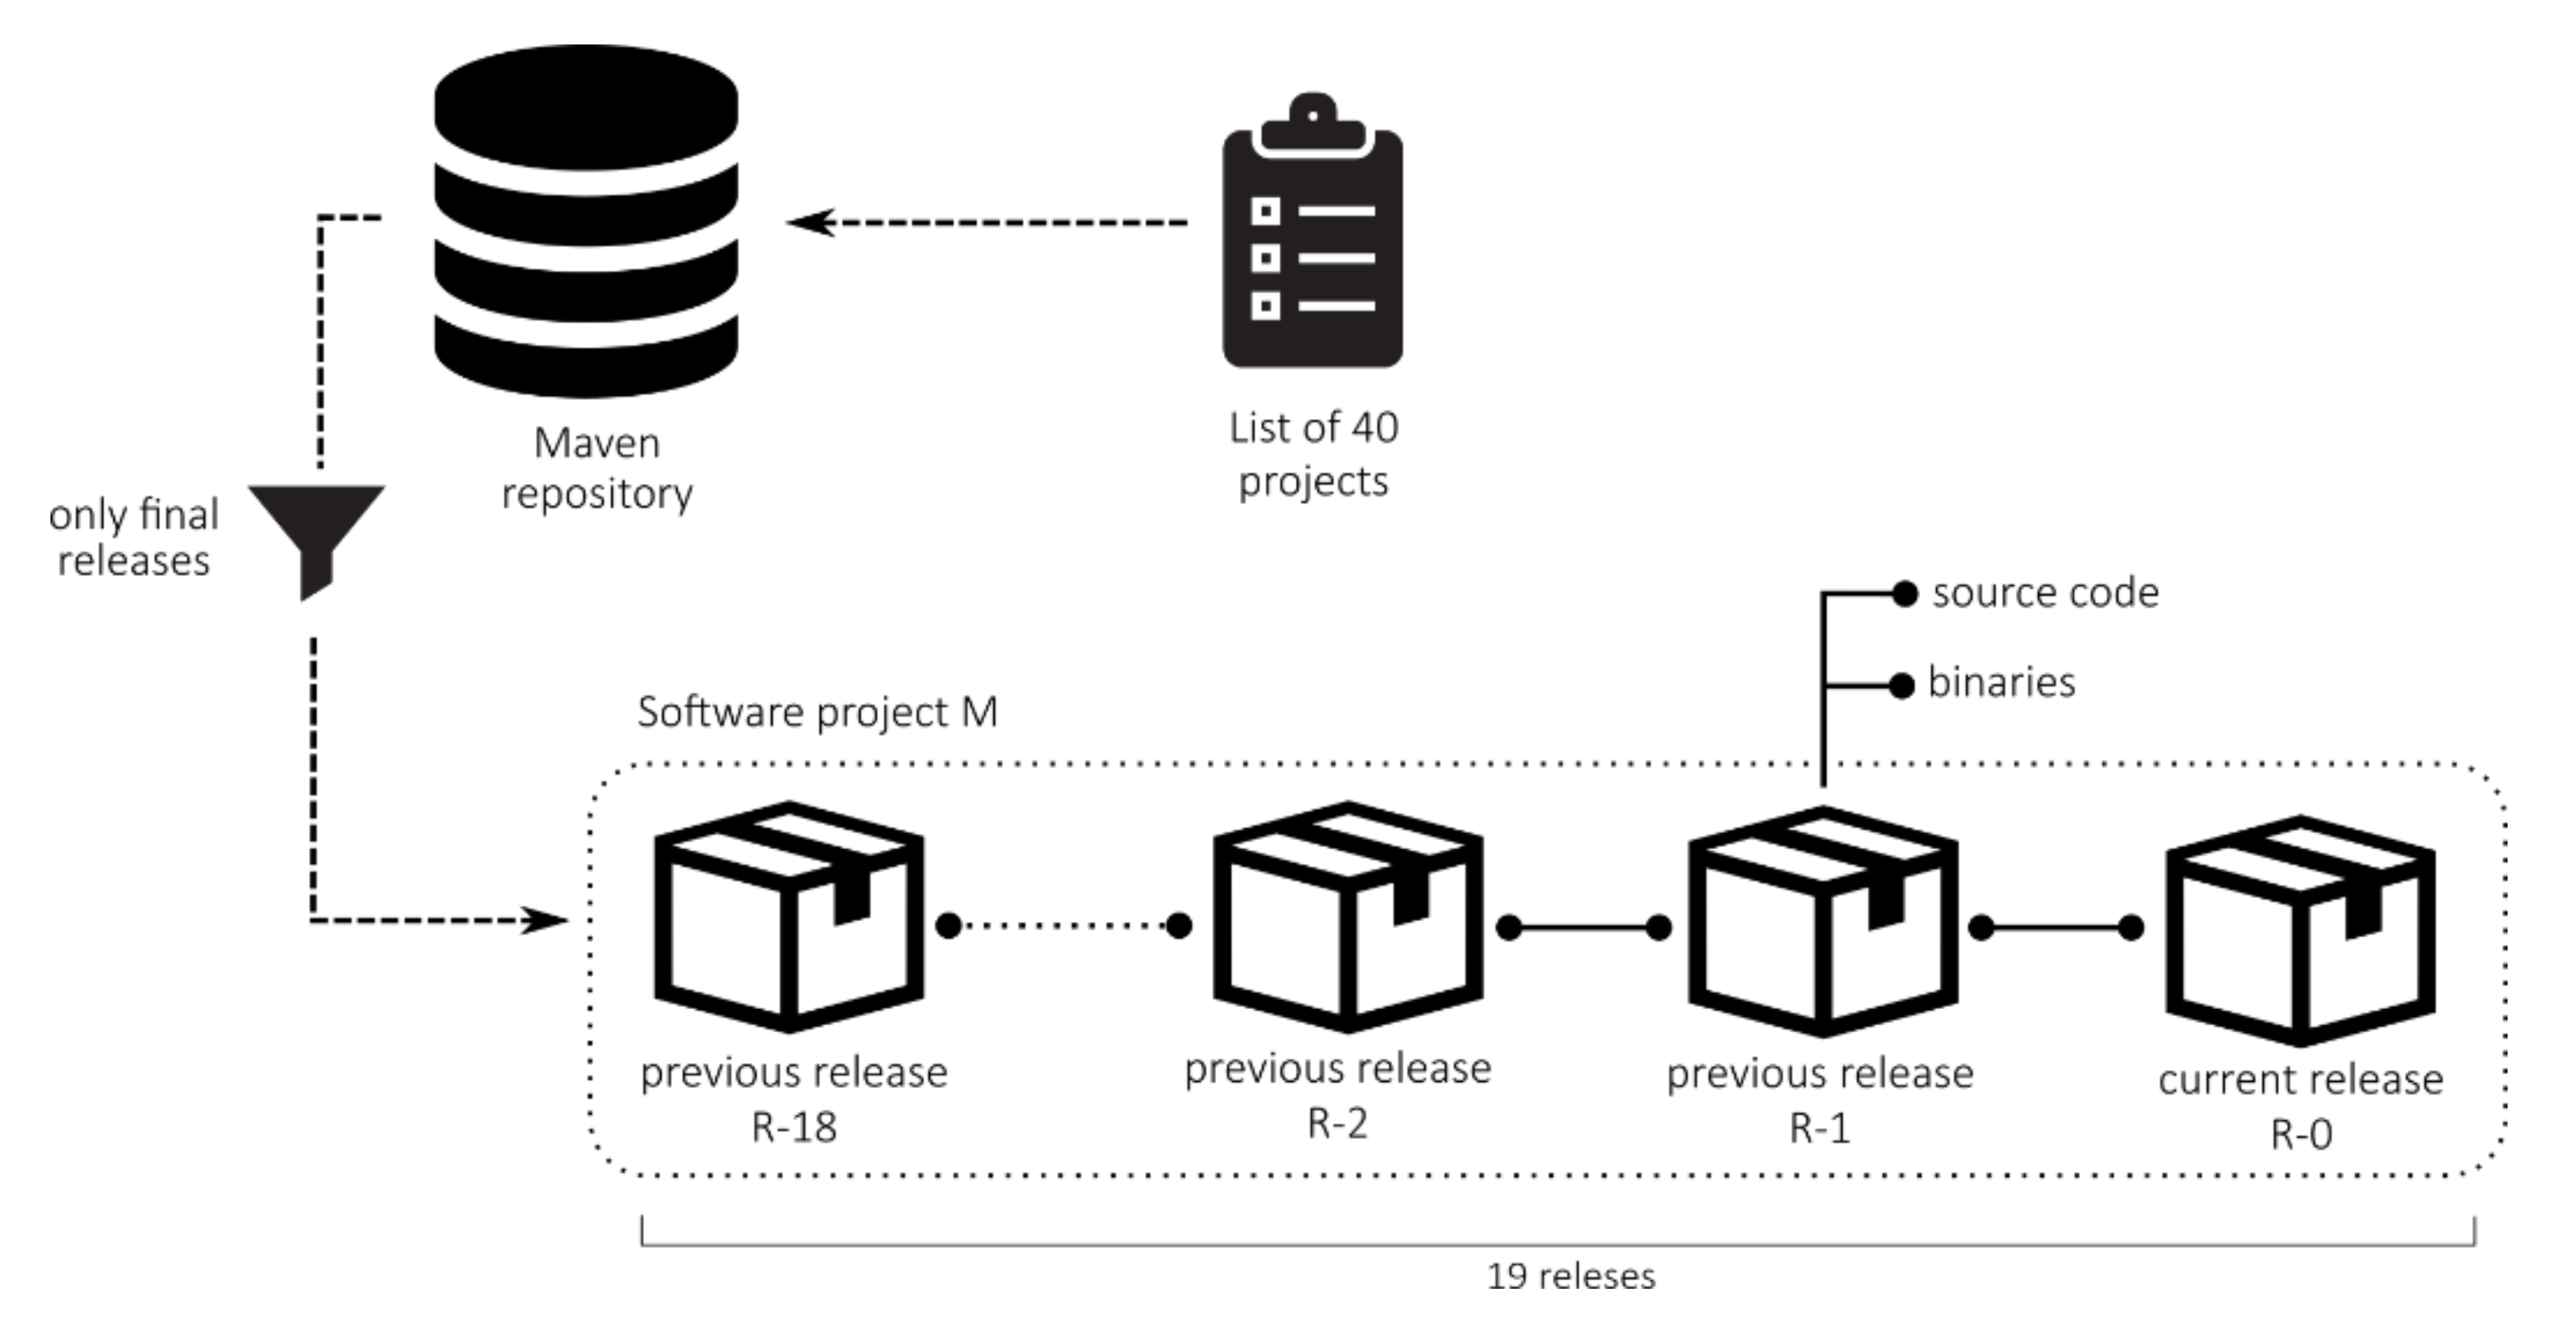
To support our empirical research, first, we generated a dataset based on publicly available Java-based open-source software components. To study the maintainability prediction model based on software metric measurement history of studied software products, multiple releases of software products needed to be obtained and analysed. To get the multiple versions (source codes and build sources) of popular open-source projects, the Maven Repository [
54] was chosen as the source of the projects. The Maven Repository is the de-facto standard remote repository that holds built artefacts and dependencies of varying types. According to the statistics obtained from the official web page, the repository held 16.3 million software components by February 2020. Besides binaries, the majority of software artefacts in the repository are equipped with corresponding source code, and had to be obtained to get all of the needed software metrics. A key advantage of the Maven Repository over other similar software project repositories is in its clear and well-defined structure, which is a prerequisite for automated processing of the analysed software components. Consequently, all project sources required in the study were obtained and processed automatically without any manual processing.
Figure 1 presents the process of obtaining the software projects with all corresponding data from the Maven Repository.
The list of software components used in our research is based on the official list of the widely used projects of the Maven Repository. To obtain the widely used projects of the Maven repository, we used the official list of popular projects [
55], obtained in November 2019. With the use of the list of popular projects, we avoided the dilemma which projects were suitable to choose out of the many published in the Repository. Project selection was based on basic attributes, e.g., the number of downloads, number of lines of code, can be a very subjective task. Previous research shows no statistical variation in the software quality of popular open-sourced projects [
56]. From the list, we extracted software projects that had at least 19 releases, excluding all alpha, beta, and pre-release versions, which were, due to their incompleteness, not included in our research. When removing all projects from the list that did not include a sufficient number of releases, we continued our analysis with 40 software projects. This number of projects included in the study was compromised between the length of a chain of consecutive releases, and the amount of collected data required for the machine learning-based analysis. The larger number of projects used in the study means shorter chains of consecutive releases, which would result in fewer iterations of the experiment in our study. For research purposes, the final project data contained only projects with at least 19 final releases available in the Maven Repository, which was also one of the inclusion criteria for the analysed projects. When determining the scale of releases included in the study, we followed the example of other similar studies, e.g., the study of Pati et al. [
3]. For each release of software projects from the list, we obtained the source code, which was the foundation for further analysis. Only Java source files were considered in the obtained source code.
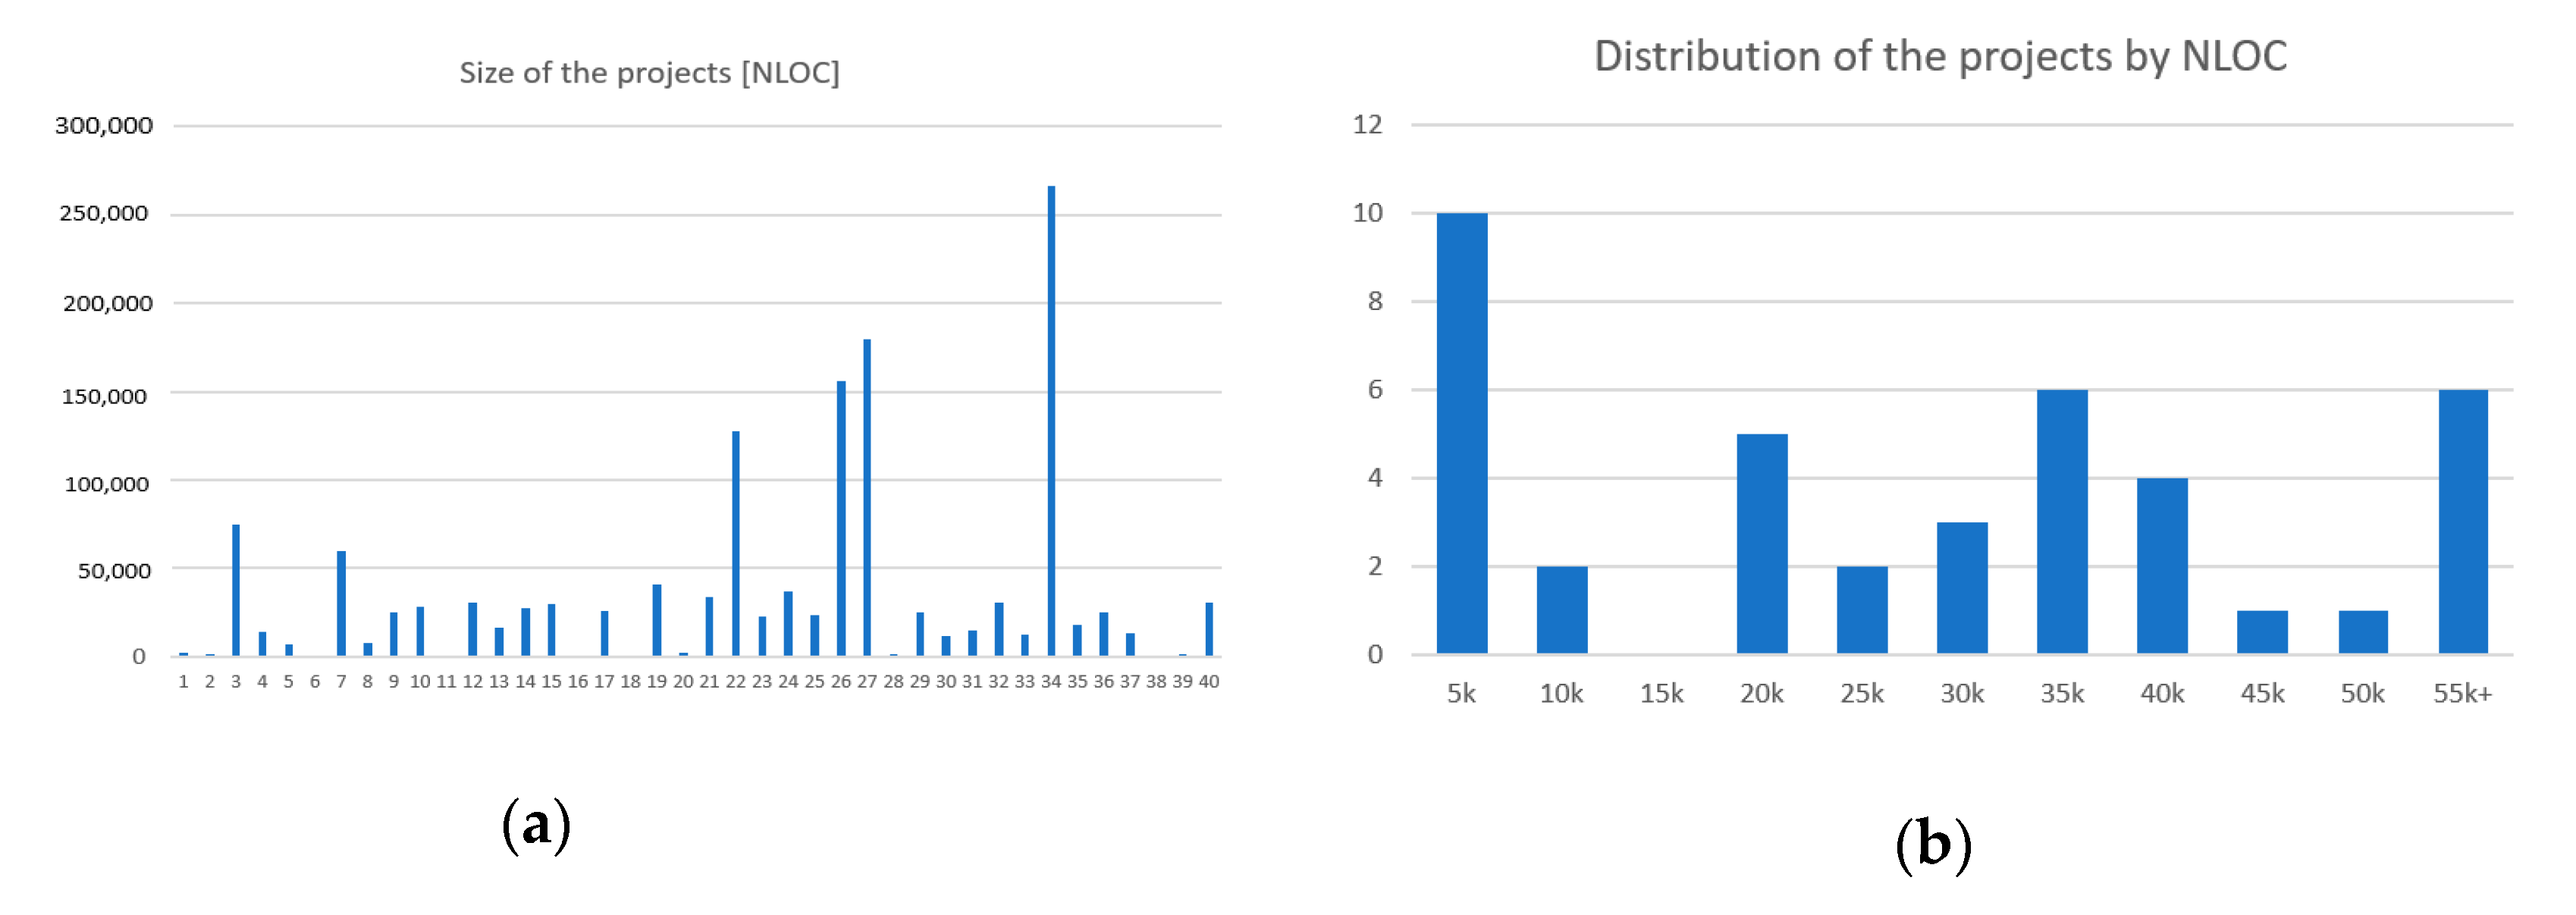
The analysis of projects by size reveals the diversity of projects included in the study. The gathered project source codes varied in size and scope. The size of the project is assessed by the NLOC (Number of Lines of Code) metric. NLOC is defined by the JHawk tool as any non-blank line in a code file that is not a comment [
57]. The smallest project in the dataset contained 382 NLOC written in 8 classes. On the other hand, the largest project in the dataset contained 266,456 lines of code written in 4397 classes. On average, the gathered projects contained 35,601 lines of code in 494 classes. The statistics based on the size of the projects in the dataset are depicted in
Table 3, and the distribution of the projects by lines of code is depicted in
Figure 2. Dataset characteristics regarding the size of the projects can be found in detail in
Appendix A.
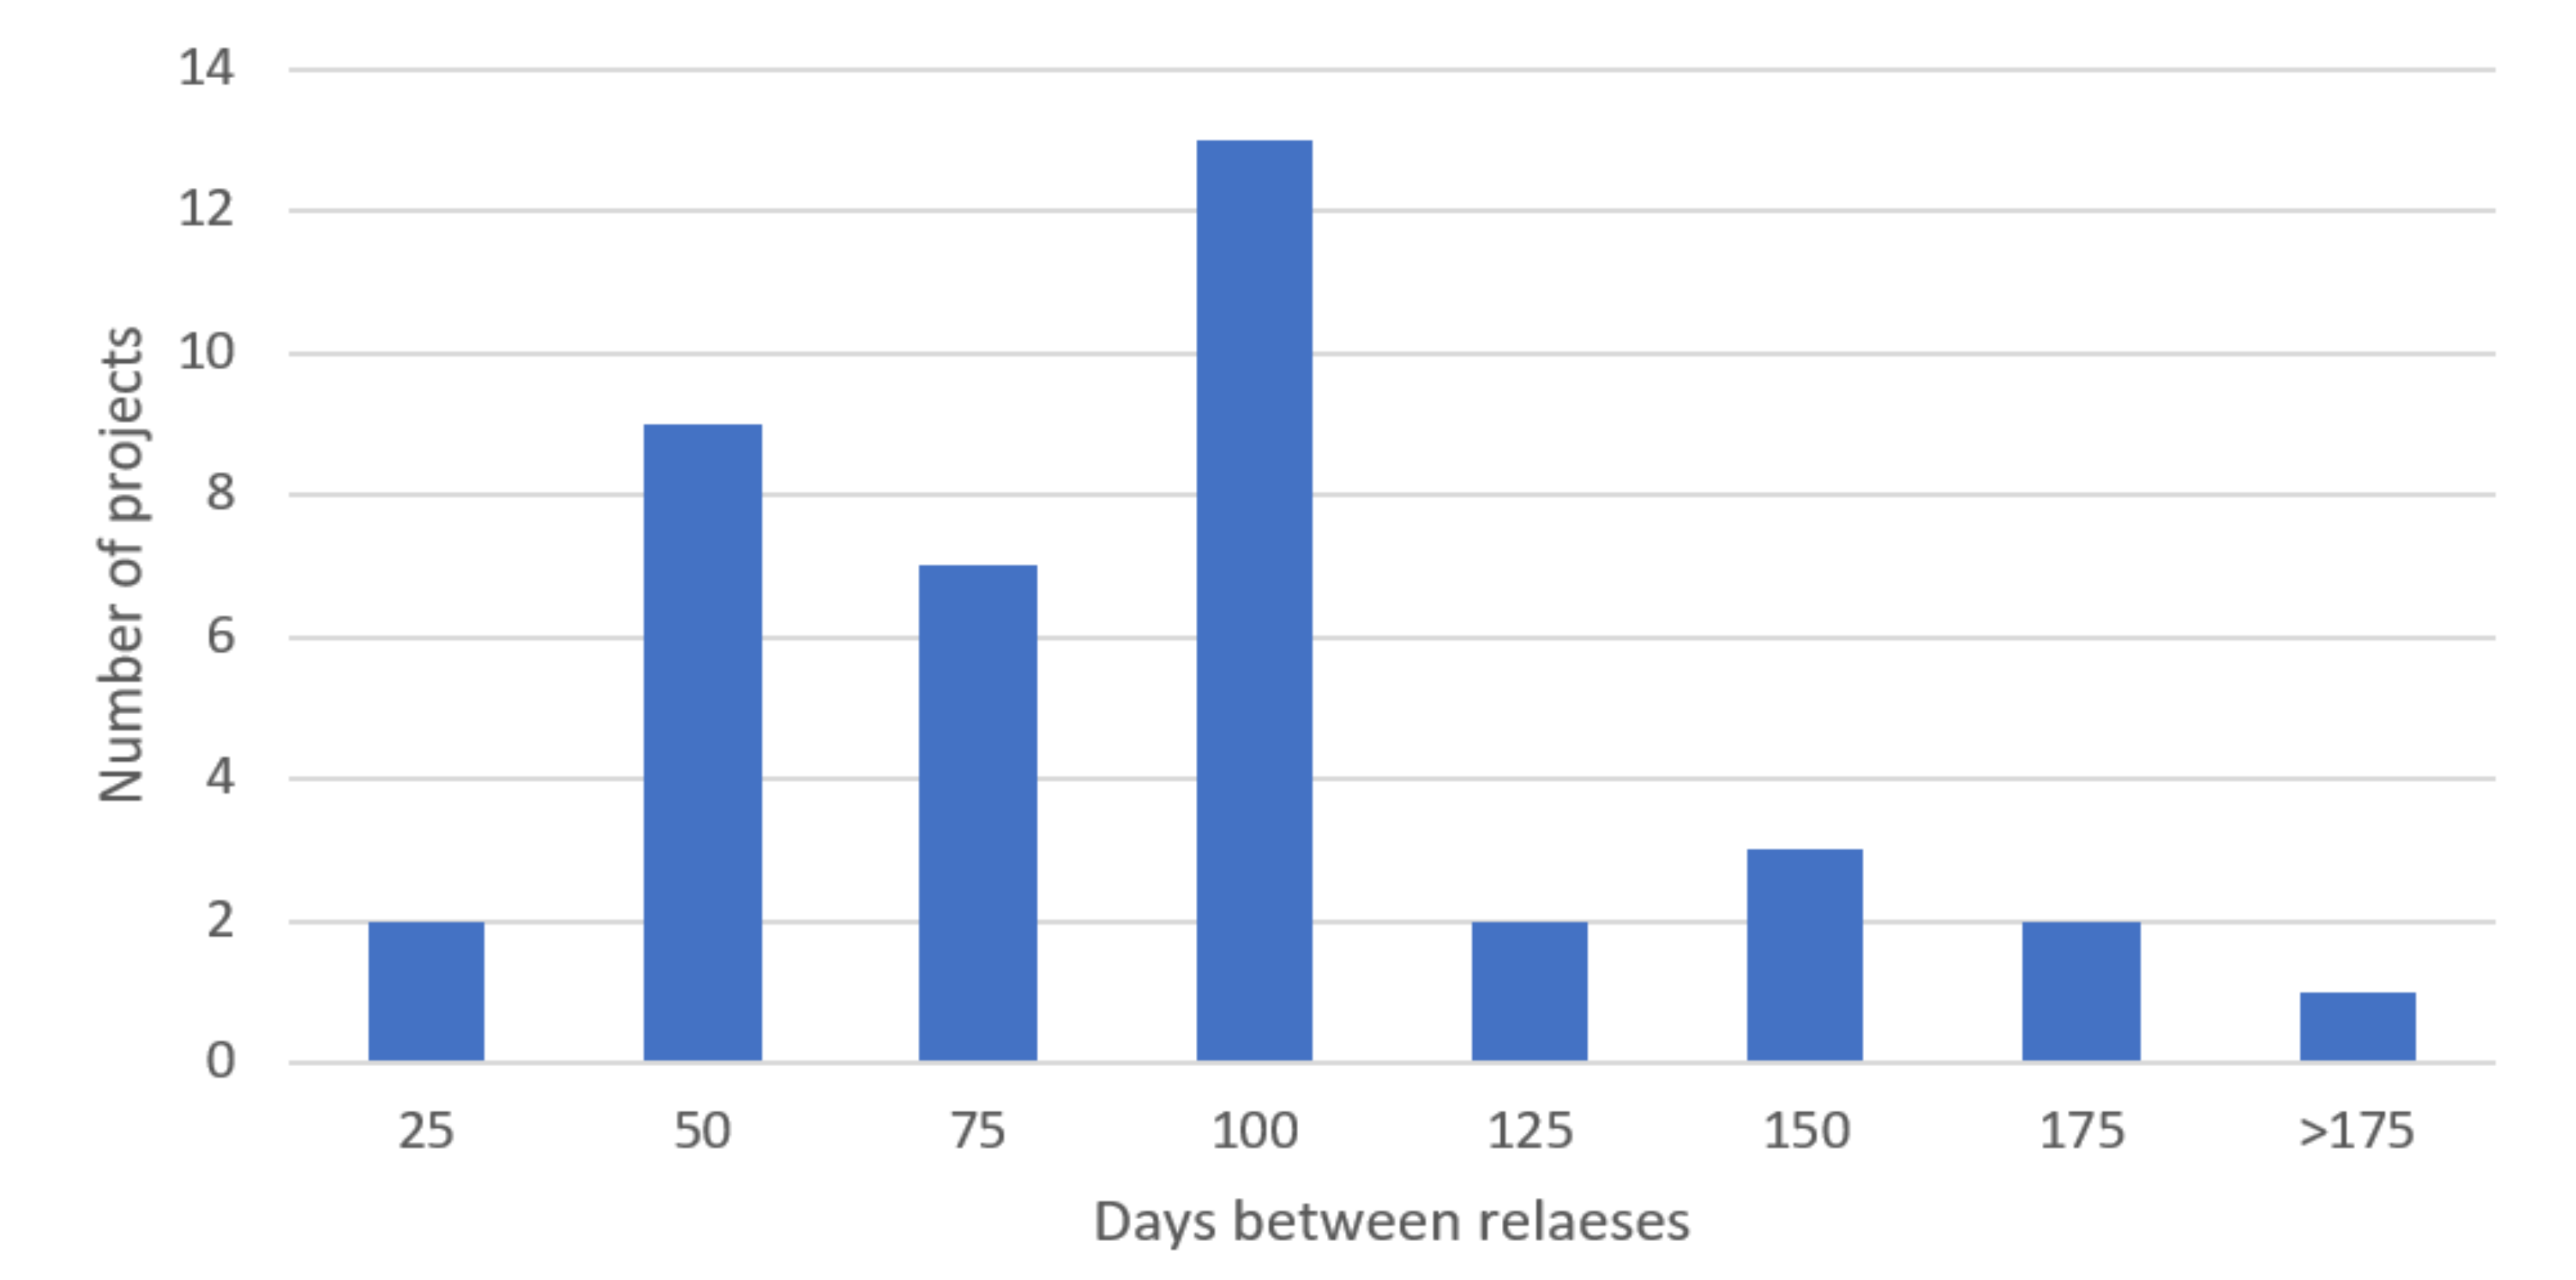
The maximum number of releases obtained in the dataset used in the study was 50, which was restricted by querying the repository. On average, the dataset contains projects with a history of a total of 38.88 releases. The statistics, based on the number of versions and periods between releases of the projects in the dataset, are depicted in
Table 4. On average, 83.45 days passed between individual releases of software components included in the dataset. The shortest period between releases of the projects was 19.2 days and the longest 259.9 days. The distribution of the projects by the period between releases is depicted in
Figure 3. Dataset characteristics regarding the number of releases and periods between releases of the projects can be found in detail in
Appendix B.
4.2. Software Metric Measurements Used
After preparing the dataset of projects, the internal quality was assessed of individual releases of studied software components in the dataset. Similar to the work of Gezici et al. [
47], the internal quality assessment of the projects in our study was based on the C&K set. According to the findings of the systematic literature review conducted by Jabangwe et al. [
58], 79% of primary studies covered in the study rely on the C&K metric set when assessing the internal quality of software components. For the task, the JHawk software [
59], static code analysis and metric measurement tool were applied to measure software metrics and maintainability of the source files. The JHawk tool was chosen because it provided all the necessary software metric measurements. At the same time, it is a tool used commonly in related research [
2,
34]. The JHawk tool in version 6.1.4 was applied for the study.
In the study, the analysed releases of the projects were scanned through for Java classes. For each class found during the scan process, all class level software metrics provided by the tool were measured. Further, the C&K software metrics (or their equivalents) and the maintainability index of the classes were extracted. To avoid manual work during the process, the automation was achieved by the application of the console version of the tool.
Since the JHawk tool does not provide all the software metrics from the C&K metric suite out-of-the-box, some of the metrics in the suite had to be replaced by the equivalents provided by JHawk. Instruction for the software metric alternatives can be found in the documentation published on the homepage [
60] and the official documentation [
57] of the tool. The software metric NOC was replaced by the software metric Subclasses (NSUB), where the only difference between both software metrics is in the name. According to the JHawk’s documentation, the WMC metric can be substituted by software metric number of methods (No. of Methods), which counts the total number of methods in a class, or total cyclomatic complexity (TCC), which represents the sum of complexity of methods in a class. Following the tool guidance, software metric WMC was substituted by TCC, since it expresses the complexity of a class more accurately.
Similarly, the JHawk tools offers two versions of the maintainability index. The first version denoted with MI (maintainability index) follows the four-metric calculation formula, which considers the appropriateness of program code comments. The second version, denoted as MINC (maintainability index no comments), follows the three-metric calculation formula, which ignores the quality of comments in a program code. Based on the studies found in the literature, the maintainability index used in our study was based on the three-metric formula (MINC). Modern approaches in software engineering advocate the self-expressiveness of the program code, and push the consistency of commenting in the background [
61]. Whereas we have included current software in the dataset, it is assumed that the software coding follows the above guidelines. The characteristics of the maintainability were quantified through the following equation:
where
aveVol,
aveV(g), and
aveLOC are the average Halstead’s volume metric, the extended cyclomatic complexity per module, and the average number of lines of code. Since the primary aim of the maintainability index metric is to determine how easy it will be to maintain a particular body of code [
62], the metrics are calculated at the class level, following the example of related research [
63].
4.3. Data Pre-Processing
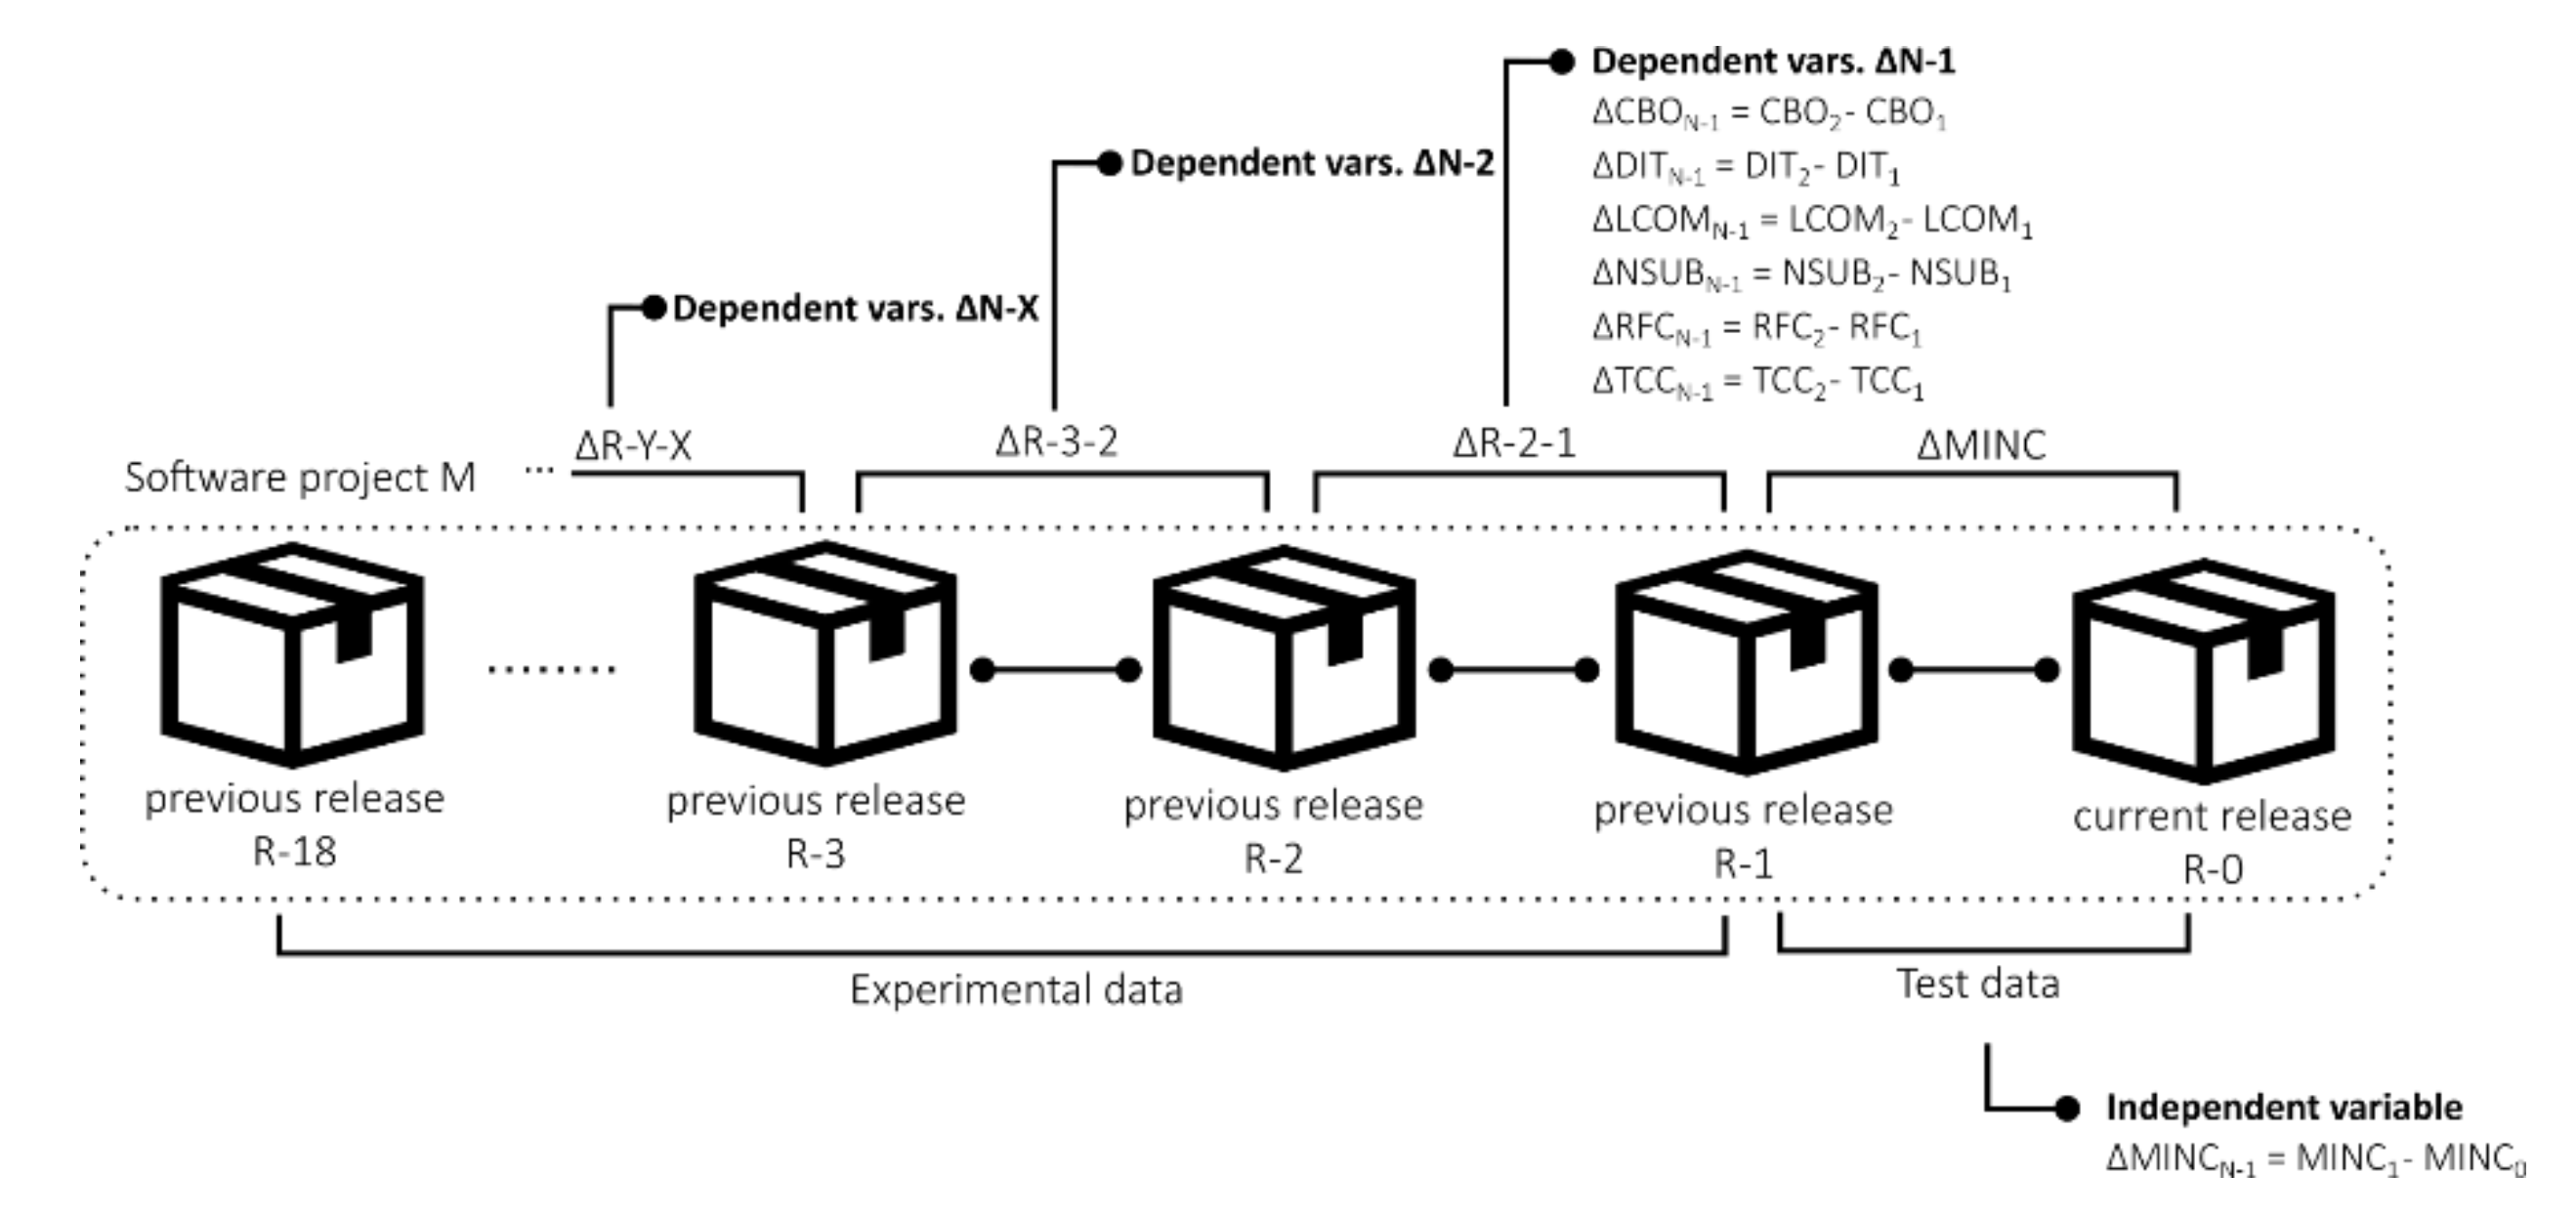
To use software metric measurements extracted from the dataset in the software maintainability prediction models, the software metrics must be pre-processed additionally. As our research question is about the impact of historical changes to the changes in maintainability, instead of direct measurements of the software metrics, the changes in software metrics from version to version were used. Using the absolute software metrics and maintainability measurements would limit the analysis only on projects with similar values. Thus, we used the changes of these measurements, which broadens the validity and applicability of the analysis to the projects with similar changes. Also, as we are researching the changes in maintainability, again, only the changes, not the absolute values of the maintainability index, were used in the analysis. More specifically, in the software maintainability change prediction, we only analysed which changes in internal quality software metrics are the best predictor of changes in maintainability. Hence, the changes in software metrics values and maintainability index between consecutive releases were calculated, which is depicted in
Figure 4.The changes of MINC served to create a new dichotomic nominal feature, which represented the direction of MINC change: (1) In the case where the maintainability index of a class has increased compared to the same class in the previous release, the label was HIGHER, and (2) In the case of a decrease of the maintainability index, the label was LOWER. This new feature served as the outcome (dependent) variable in further analysis. All the classes where the MINC had not changed from the previous version were removed from the subsequent analysis, as they did not provide the answer to our research question on the change in direction of the maintainability of the software.
4.4. Methodology of Data Analysis
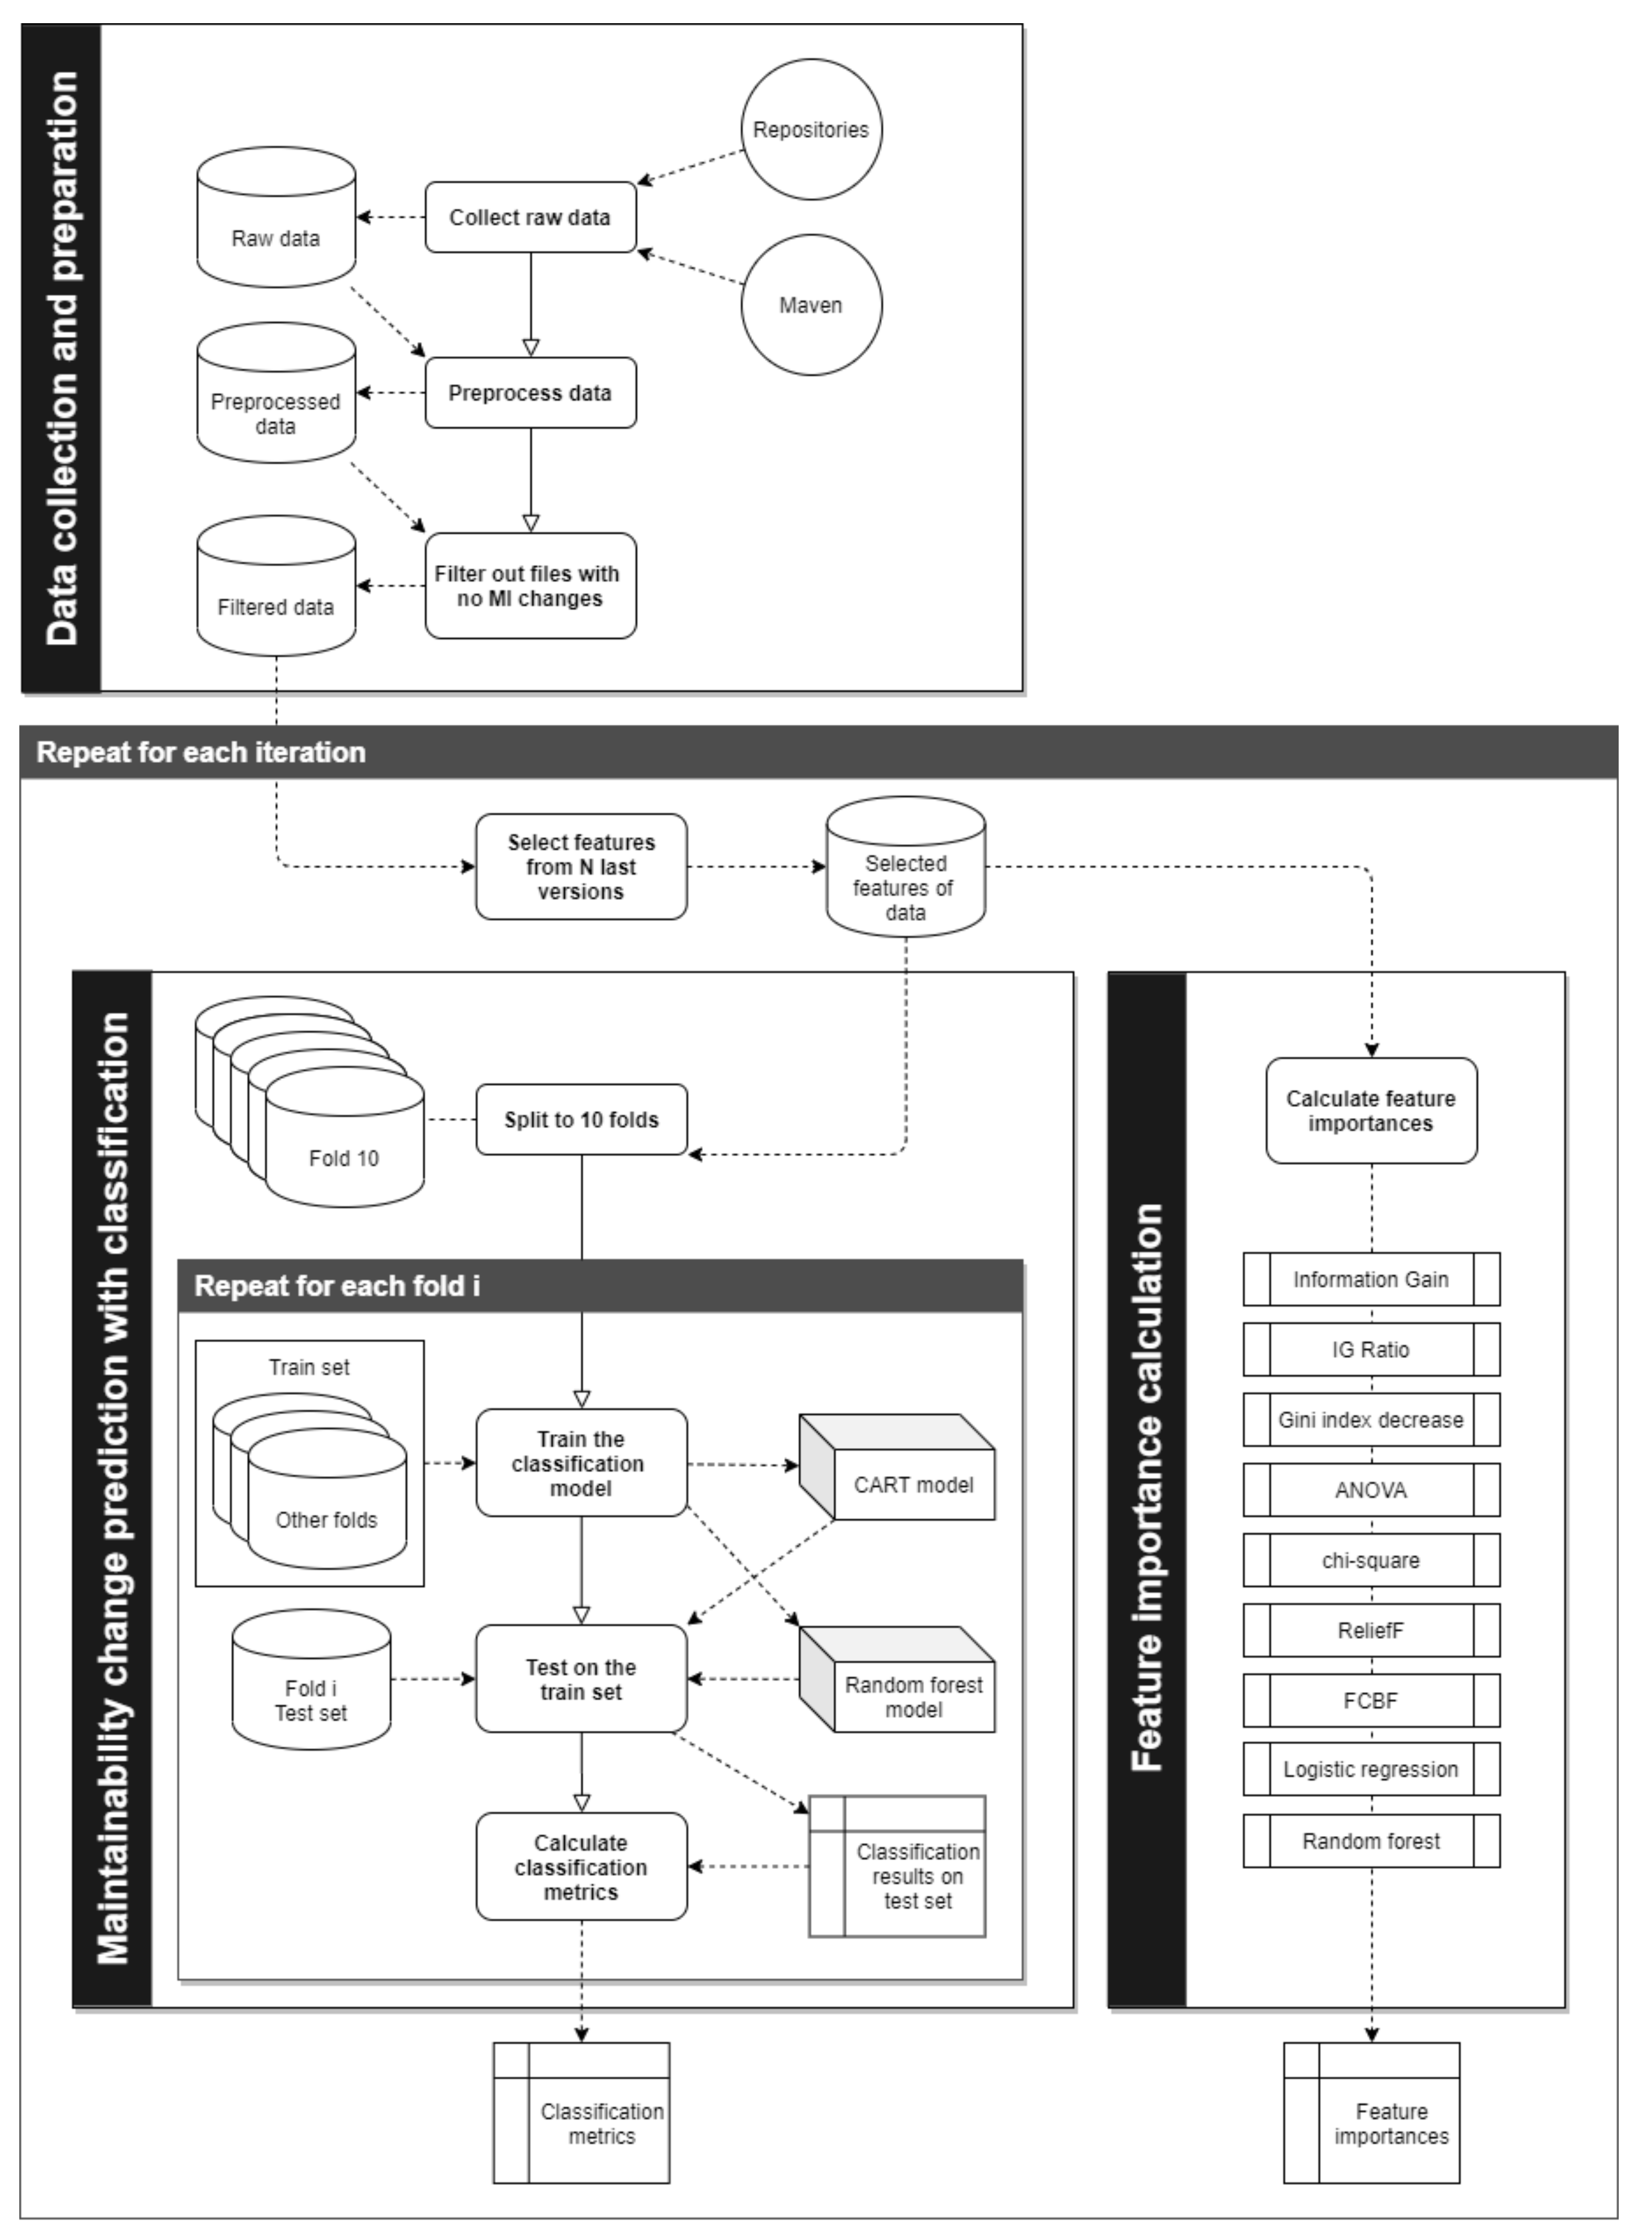
To analyse the prepared datasets and test the impact of historic software metric changes on software maintainability change, we employed the Orange Data Mining tool [
64] version 3.23, and open-source data visualisation, machine learning, and data mining toolkit. The whole stage of data analysis consists of part of the data pre-processing, the feature importance calculation, and the building of maintainability change prediction models, as is depicted in
Figure 5.
Based on the initial setup of the experiment, we calculated classification quality metrics and feature importance scores. To test the prediction of the experimental model, the obtained results of the test were compared to the result of a similar study performed by Jabangwe et al. [
58]. The comparison of results ensures the compliance of results returned by the research work with the previous studies of other authors.
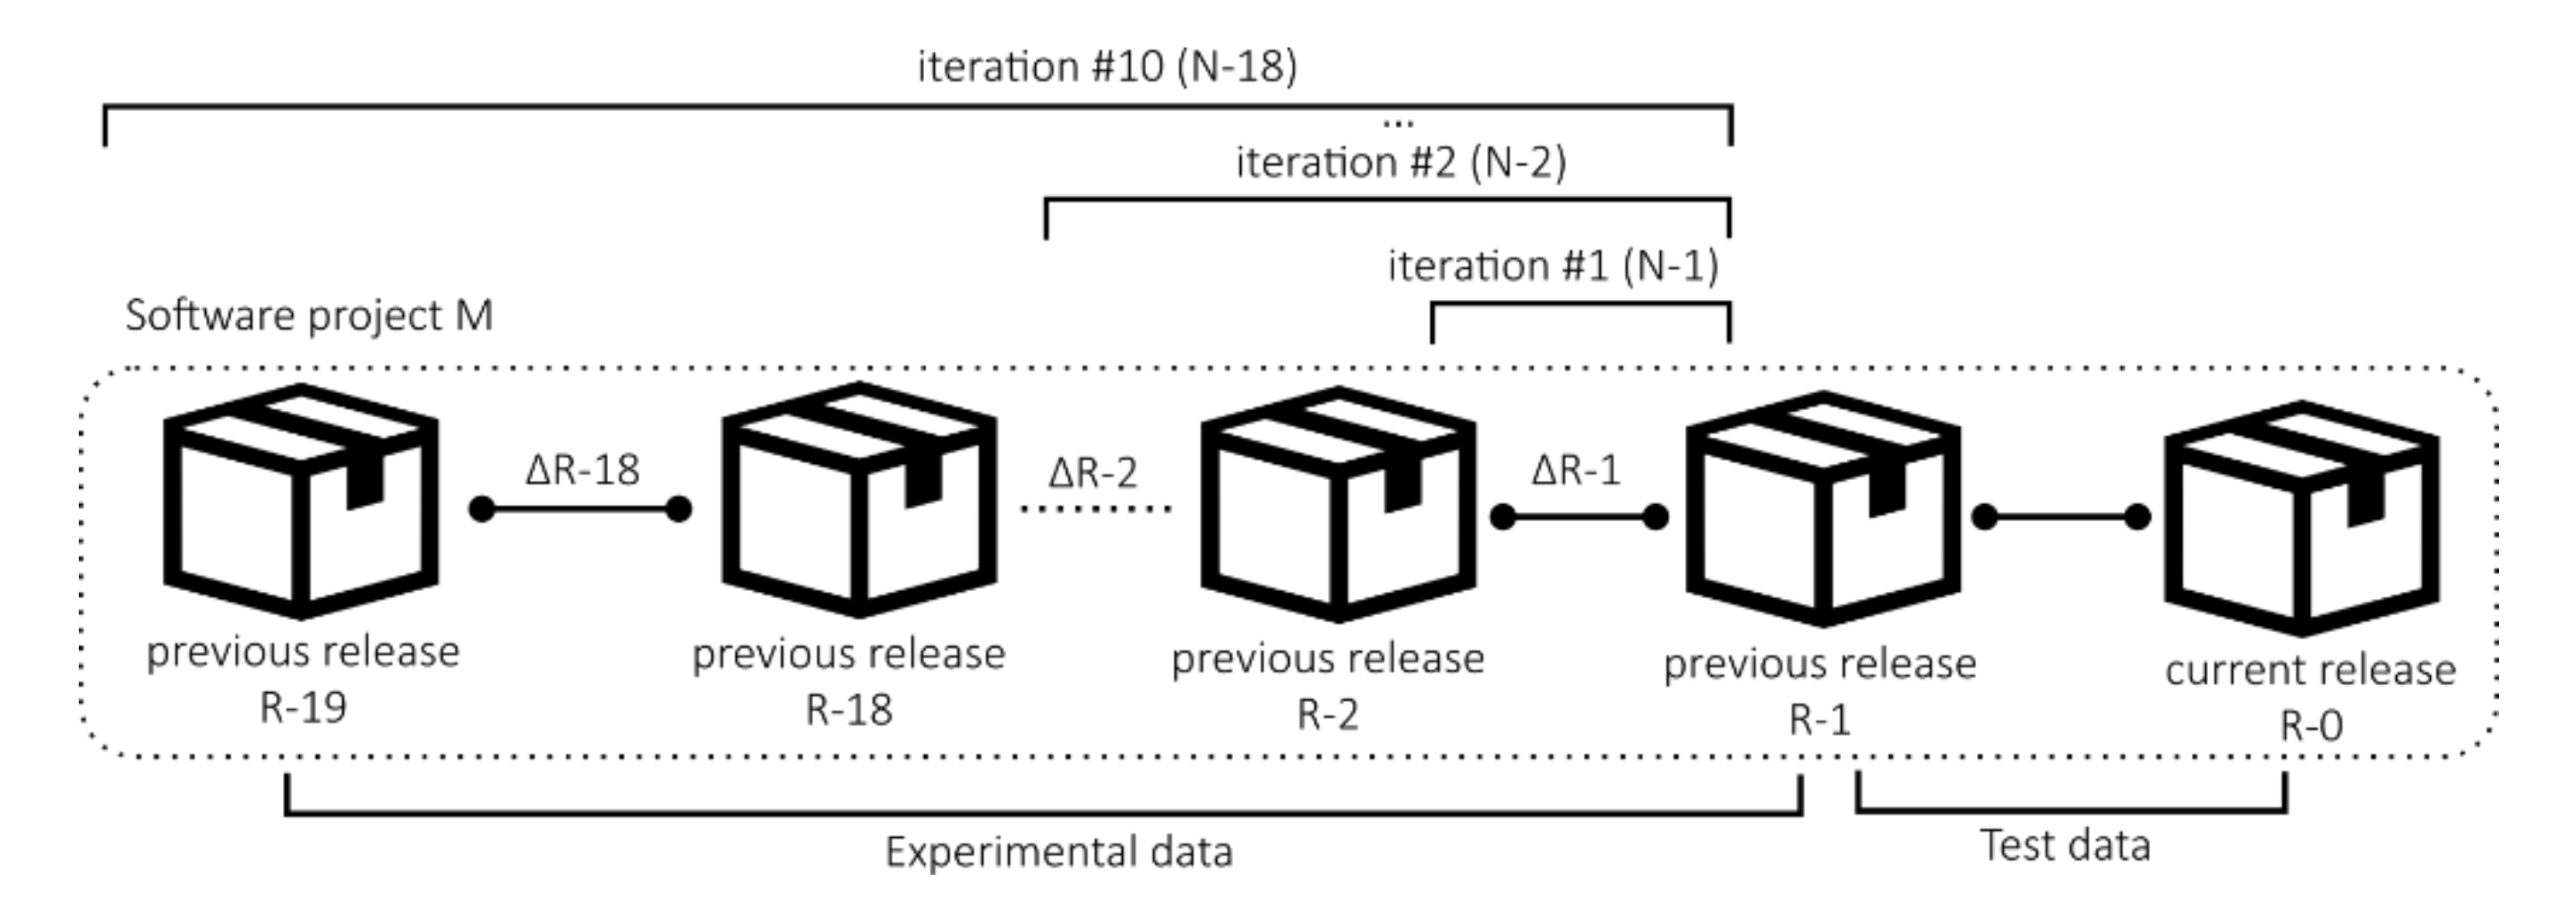
As described in the previous sections, the first stage of the experiment was the data collection, preprocessing and filtering. Next, to test the impact of the past software versions, the experiment was performed 10 times, where the number of prediction variables changed, from the most recent changes only, to also the distant changes in software metrics. In the first iteration of the experiment, denoted as N-1, it was tested how accurately can the change in MINC in the future, R-0 version, be predicted with the use of the changes software metrics values extracted from the releases R-2 to R-1. The next iteration, N-2, added additional software metric changes from R-3 to R-2 to the set of prediction variables. This process was repeated until the last one, N-18, where the changes from the R-18 version to R-17 were included in the prediction variable set. The process of sequential inclusion of the additional version (and their software metric changes) is shown in
Figure 6, and the details of individual iterations of the experiment are described in
Table 5.
Within ten iterations, the experiment included measurement data of up to 18 releases of the studied software components. The iterations of the experiment stopped after 18 consecutive releases included in the prediction model, as increasing the number of used consecutive releases would reduce the number of software projects in the dataset suitable for the experiment significantly.
4.5. Maintainability Change Prediction
To test the possibility whether the changes in maintainability in future, not yet released, of the version can be predicted from past changes in software metrics, we employed the machine learning classification approach, where all of the JHawk provided C&K software metrics were used as the prediction (independent) variables, and the class of the change (HIGHER/LOWER) was used as the outcome (dependent) variable. In each N iteration of the experiment, 10-fold cross-validated classification was performed with the use of the classification and regression trees (CART) [
65] and random forest [
66] classification algorithms.
The software maintainability change prediction is a binary decision classification problem, which has four possible outcomes: (1) true positive (TP) for correctly classified as MINC increase, (2) false positive (FP) for incorrectly classified as MINC increase, (3) true negative (TN) for correctly classified MINC decrease, and (4) false negative (FN) for incorrectly classified MINC decrease. Based on the statistical analysis of the classification outcomes, several prediction model performance indicators can be applied. In our study, we used the two most used classification performance metrics, classification accuracy and F-score in the domain of software quality [
67].
The CART decision tree was used with the limitation of the maximal three depth of value 100, minimum numbers of instances in leaves with value 2, and prohibition of splitting subsets smaller than 5. In the experiment, the CART classification was completed when the majority reached a threshold of 95%. On the other hand, the random forest classifier was applied with 5000 trees and the limitation of splitting the subsets no smaller than 5.
4.6. Feature Importance Calculation
The prediction variables of the classification models were ranked to answer the research question about the most important software metrics and versions. With this, the importance of prediction features was calculated, in their ability to contribute to the prediction of the maintainability change. The aim of the ranking is two-fold. Firstly, the ranking can be determined in which software metrics contribute to the success of the prediction model the best. Secondly, it can be determined what amount of historic measurement data contributes significantly to the success of the prediction model.
The same 10 iterations of expanding set of prediction variables, described in the previous section, were used in the process of feature importance calculation. In each iteration, the features (software metrics in various historical versions) were ranked according to various ranking methods, and according to their contribution to the success of the two classification models. The ranking was done with the following ranking methods: information gain, information gain ratio, gini decrease, ANOVA, x
2, ReliefF, and FCBF [
68]. Also, the inclusion of ranking with two classification models was used: Beta coefficient of individual features in logistic regression, and the feature importance in random forest. The ranking methods used in the experiment are described in detail in
Table 6.
The feature importance ranks grouped by software metric, which reveals how much each software metric contributes to the success of the prediction model. The results of both parts of the experiments, the maintainability change prediction with classification and the feature rankings, are presented in the next section of the paper.
5. The Results of the Experiment
The main goal of the study was to evaluate the contribution of this information to the performance of software maintainability prediction models. The latter was achieved by increasingly adding changes in the C&K software metrics measurements of historic releases to the maintainability prediction model. The prediction model is based on the maintainability index which was measured by the MINC software metric.
5.1. Impact of Historical Changes in Software Metric Measurements–RQ1
As described previously, the performance of the software maintainability prediction model was observed through the series of iterations. In each of them, an additional layer of changes in the C&K software metrics of historic releases were added to the software maintainability prediction models. To evaluate the performance of the model in each iteration of the experiment formally, the models were evaluated by two prediction model performance indicators, classification accuracy and F-score, for both CART classification decision trees and random forest for classification.
Our goal was not to optimise the classification model to have better predictability ability. For this reason, we limited the scope of the experiment only to software metrics for which the literature showed that they should be the most impactful in maintainability prediction. Also, we wanted to test if the changes in older (not only the newest) releases had an impact on MINC change prediction. Of course, if the goal of our experiment was to build the best model in predicting the future MINC change, all the available metrics would be used, along with several other measurements. Readers should keep in mind that using only software metric changes from the past has limited ability in the prediction, but does provide the answers to our research question.
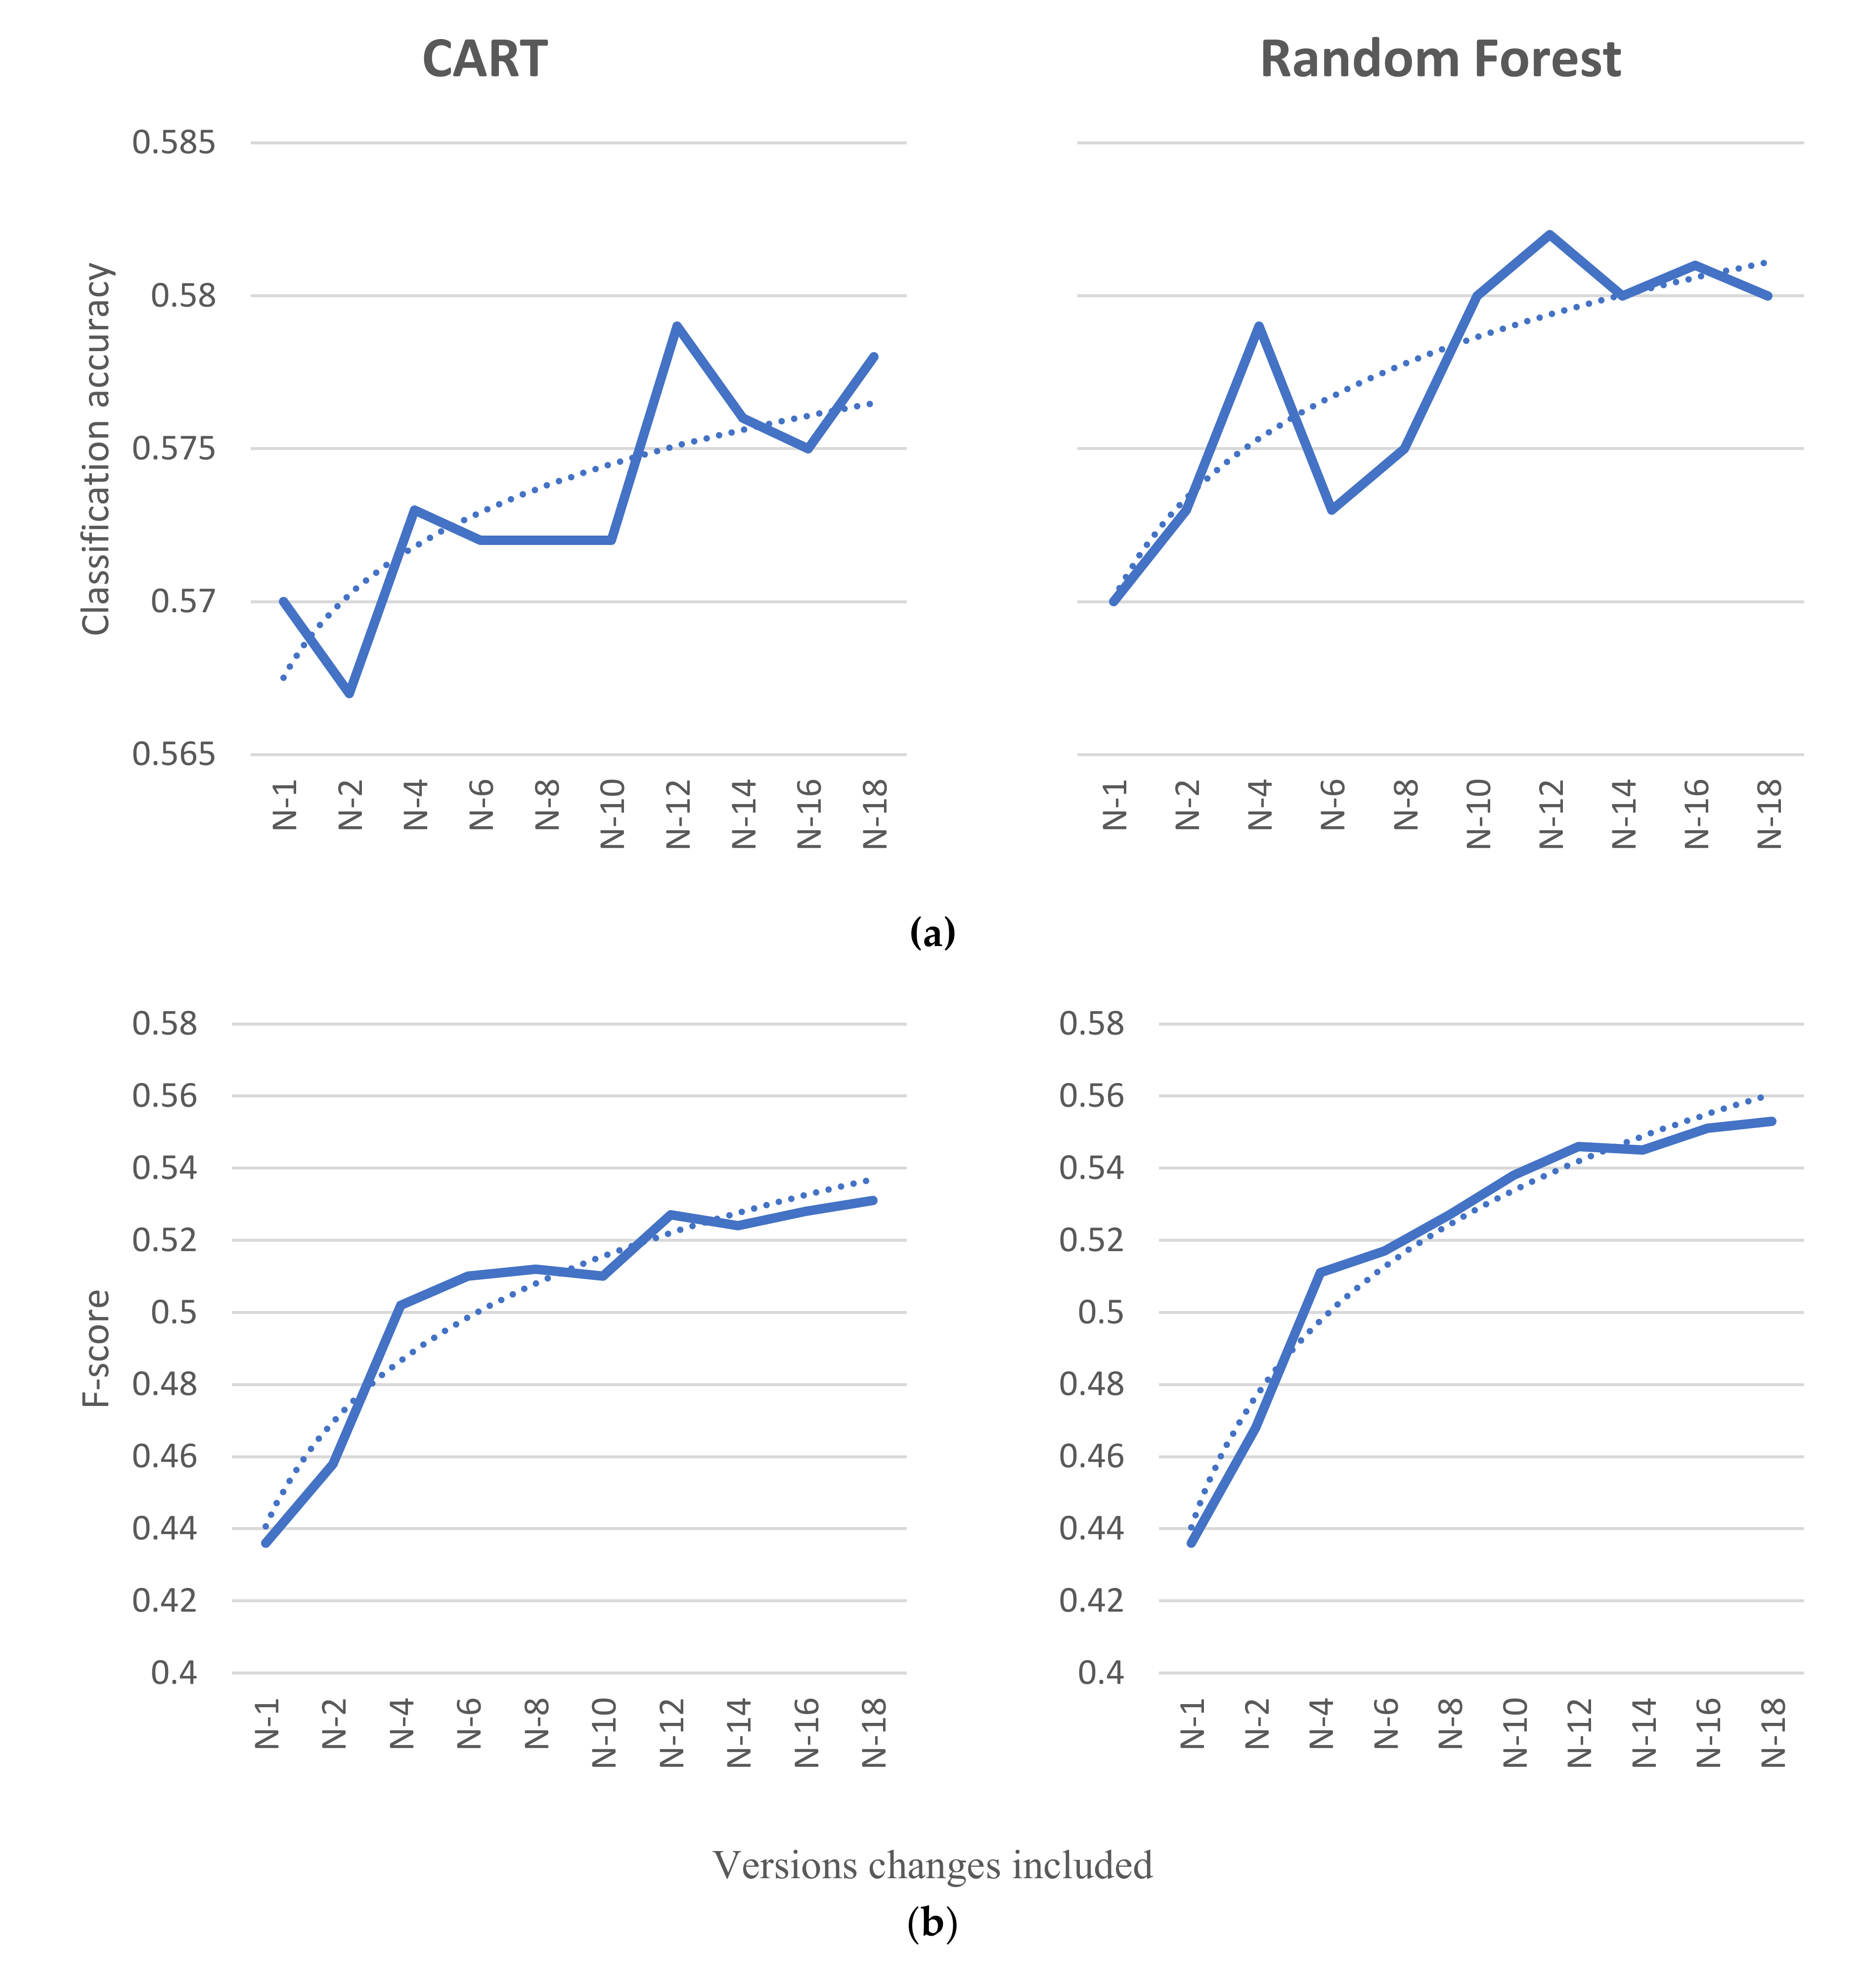
Table 7 summarises the results of both model performance indicators used in the study, namely overall classification accuracy and F-score. According to the data collected in the experiment, the software maintainability prediction model reaches the value 0.570 of classification accuracy for both CART and Random Forest models in the first iteration of the experiment. In that iteration of the experiment, the prediction model is based only on metric changes between R-2 and R-1 releases of the studied software. The F-score indicator of the prediction model in its first iteration reaches the value 0.436 for both, CART and random forest. The values of both classification performance metrics show that the quality of the future MINC change prediction is limited. Again, this should be taken with consideration of our research question and the limitation of the experiment in using only these metrics, while other software and non-software related metrics could (and probably do) play an important role in predicting the maintainability change.
In the last iteration of the experiment, when values of changes in the software metrics for all releases of the software projects considered in the study are added to the prediction models, the classification accuracy reached value 0.578 in the case of the CART prediction model, and value 0.580 in the case of the Random Forest-based prediction model. The F-score reached the value 0.531 in the case when CART was applied, and value 0.553 in the case of random forest. The analysis of the collected data shows that both generated prediction models came to more or less similar results in the final iteration of building the prediction models. Despite that, the random forest-based prediction model showed slightly better results in the final iteration. In general, the results indicate that the software maintainability prediction models showed better performance for both used classification algorithms when the model was enriched by historic measurement data extracted from prior releases.
The analysis of the results shows that classification accuracy gains between the first and the final iteration of the prediction model used in the study were 0.008 in the case of CART, and 0.01 in the case of Random Forest being applied as the learner. Between the initial and the final iteration of the prediction model, the F-score performance indicator gained 0.095 percentage points (pp) in the case of CART and 0.117 pp in the case of random forest. From the viewpoint of the F-score classification metric, the data of the analysis shows that not every layer of historical measurement data added to the prediction model contributes to the performance gain of the model. The analysis of collected data shows that performance indicators of prediction models do not necessarily improve in every iteration of adding additional historic measurement data. This holds for both learners applied in the experiment. The charts of improvement of software maintainability prediction by the gradual addition of historic measurement data to the prediction models are depicted in
Figure 7.
Despite occasional declines in the prediction model performance, overall, the software maintainability prediction model gained in performance when enriched by data from the previous releases, as is shown with logarithmic trends in
Figure 7. The accuracy trend for CART shows that the accuracy metric improved 0.001 in each iteration (this explains 60.92% of the variation of the metrics through the iterations, as is shown here with R
2 = 0.6092), while the accuracy for random forest improved 0.0011 in each iteration (R
2 = 0.7111). Despite slight improvements in the accuracy, more drastic improvements can be seen in the F-score metric. An upwards linear trend is evident for CART, where F-score improved 0.0091 in each iteration (R
2 = 0.9270), and also in random forest, where it improved by 0.0115 when adding historical software metric changes (R
2 = 0.9693), both explaining more than 90% of the variance. The high variance explained with the logarithmic trend, especially for the F-score metric, is in line with assumptions that there is a slow decline in the usefulness of historical changes further in the past.
5.2. Impact of Software Metrics–RQ2
The basic analysis of changes in metrics was done first. Here, all the metric changes in all previous releases were grouped by software metrics.
Table 8 shows the descriptive statistic values of changes in software metrics grouped by the change of MINC. Even though the changes are small, the sample size of classes analysed in the experiment was sufficient that the statistical test could be applied for comparison of two independent groups. As the data of software metric changes are not normally distributed (Shapiro–Wilk returned p <0.001 for every metric in both groups/MINC changes), a non-parametric Mann–Whitney U test was used to compare the software metric changes. The groups of classes compared were two: The classes where MINC rose (Up) and the classes where MINC fell (Down).
The results of the Mann–Whitney U test showed that there are statistically significant differences between the two groups of classes in all changes in software metric (p <0.001 for all of six software metric changes). The small changes in means show that, in most cases, the software metric was not changed at all. This shows that data have high kurtosis, with values of metric changes concentrated around 0 (no change). The latter is primarily a consequence of the fact that only a part of the classes that are subject of modification (e.g., bug fix or modified functionality) is changed in a single release. This imbalance in independent values could provide a challenge in using it in the prediction model, as will be demonstrated in the following sections.
Next, the ranking of features analysis was performed to assess the impact of individual software metrics to the prediction of MINC change.
Table 9 depicts the results of the assessment of how particular software metrics used in the experiment contribute to the software maintainability prediction model throughout the iterations of adding historic measurement data. The software metrics were ranked by the strength of contribution, with 1 indicating the strongest and 6 indicating the weakest contribution of the software metrics to the prediction model.
For the analysis, there are attached reference values of the software metrics‘ contribution to the model in row N-0 of
Table 9. Reference values in N-0 contain measurements of C&K software metrics and measurement of the MINC metric all in the same version, and not software metric versions from the past and MINC from the future. In this layer, the C&K measurement values and values of MINC metric are directly dependent, namely, the values of the MINC metric are calculated based on the software metric measurements. That is the main reason why the measurements of layer N-0 were excluded from the experimental data, and serves only as a reference in comparison of the results of the experiment.
In each iteration, the impact (importance) of every software metric was evaluated with nine ranking methods, as was shown in
Table 6. Every ranking method resulted in important factors for every software metric change between multiple consecutive software releases. This means that every iteration had multiple features from the same metric, with each feature for its version change. In this analysis, the multiple importance factors for every metric in each iteration were averaged, resulting in the average importance factor for every software metric in one iteration. The average importance factors of metrics were ranked and the ranks are presented in
Table 9.
According to the reference ranking presented in row N-0 of the
Table 9, the metrics that contributed to the software maintainability prediction model the most were the software metrics TCC and RFC. On the other hand, software metrics with the weakest impact on the prediction model were the software metrics NSUB and DIT. The data analysis showed that, when the software maintainability prediction model is built based exclusively on change values in software metric measurements of the release N-1, the results of the metric ranking deviated greatly from the reference N-0 ranks. Namely, the software metrics with the strongest contribution to the prediction model were the metrics NSUB and CBO, the software metrics with the weakest contribution to the prediction model, on the other hand, were the metrics DIT and RFC. From the presented data, it can be observed that, adding software metrics measurement data iteratively to the prediction model, the ranks of contribution to the prediction model eventually converged toward the reference ranks for the software metric with the strongest and software metric with the weakest impact on the software maintainability prediction model.
A non-parametric Friedman’s ANOVA test was used to test if the differences between ranks were statistically significant. This test was used as the ranks are ordinal, not scale type values, and a Shapiro-Wilk’s test showed that these ranks do not conform to the normal distribution (
p < 0.001). The results of Friedman’s ANOVA showed that there were statistically significant differences between importance ranks of software metrics change in the impacts in contributing to the prediction of future MINC change (χ
2(5)=17.66, p=0.003). Consequently, post-hoc analysis was used with a Durbin-Conover test with Holm-Bonferroni correction. The results of post-hoc tests are in
Table 10.
There are six pairwise comparisons between importance ranks of software metrics change, which are statistically significant: CBO had a higher impact than DIT (median ranks 2 vs. 5), CBO had a higher impact than NSUB (median ranks 2 vs. 6), RFC had a higher impact than DIT (median ranks 3 vs. 5), TCC had a higher impact than DIT (median ranks 1 vs 5), TCC had a higher impact than LCOM (median ranks 1 vs. 4) and TCC had a higher impact than NSUB (median ranks 1 vs. 6).
5.3. Use Case on One Software Repository
Previous sections showed how historical changes of various software metrics can have an impact on predicting the future change of maintainability MINC metrics in general. With this, a MINC change predicting machine learning model was built, which was shown to have a somewhat limited ability in predicting the changes. Naturally, there is a limited general knowledge of MINC changes one model can incorporate. In other words, predicting the change of MINC for every project based on the patterns of 40 projects could have limited success for various reasons. First, every project is somewhat unique, be it in project software code structure, coding style, style of committing the changes to the Repository and other development-related issues. Second, the development team specifics are different for every project. The team communication, the responsibility allocation, bug and issue tackling, remote or onsite working, the team size, the team structure and the personal dynamics in the team, could have a great impact on the maintainability of the code. All of this could not be extracted from the software metrics measurements and, thus, limited incorporation of these specifics in the prediction model. Also, including 40 projects in our analysis could still not be enough to have a representative sample of projects in general. Also, the top projects in accordance to the number of downloads on Maven are probably not representative to the vast body of projects in the industry, which are not developed in the same manner and with similar team structures as the top ones on Maven. Third, the pattern extraction capabilities of the used classification models are limited only by the available data. If other meta-information about the code style and the team structure could be incorporated, the models could be far better in their prediction ability. Also, as the patterns are very complex, more data are needed to extract them, and not to confuse them with anomalies meant to be ignored.
With these assumptions in mind, the hypothesis is that focusing on one project specifically can produce greater results than trying the extract the general patterns with one model. Analysing the project independently can force the model building process to extract some of the patterns specific to that code base and that development team, rather than trying to find general patterns of multiple projects. This section aims to show the advantages in analysing the projects independently with the previously described analysis, to gather the maintainability changes for that particular project.
For this use case, the httpcore project was chosen for the demonstration. The chosen component is among studied projects for which performance gain of the maintainability prediction models is relatively high. The reason why some of the projects in the dataset do not shows the same level of performance gain will be the subject of future research. In this analysis, 35 releases with 225 distinct classes, with a total combined 10,439 lines of code of this project, were included in the analysis, where the mean days between the releases was 107.74 days. To determine the direction of maintainability, change in the future, only the codes with MINC change were selected, out of which 36 had MINC lowering and 33 had MINC raising. The descriptive statistics about C&K software metrics and MINC about included source codes are in
Table 11.
The project httpcore is part of the broader project developed under the Apache Foundation responsible for creating and maintaining a toolset of low-level Java components focused on the HTTP and associated protocols. The project aims to provide a set of low-level HTTP transport components that can be used to build custom client and server-side HTTP services with a minimal footprint [
69]. The project, which is hosted on GitHub, has in total 31 code contributors, and six of them with the contribution of more than 1000 lines of code.
A MINC change prediction model can be built with only the historical data of this project, so no general patterns about the codebase development were extracted, but only project specifics were considered. Again, random forest, with 5000 classification trees, is trained in steps where more historical changes (more changes between versions) are considered. The data are split with 10-fold cross-validation in each step, and the results are averaged across folds.
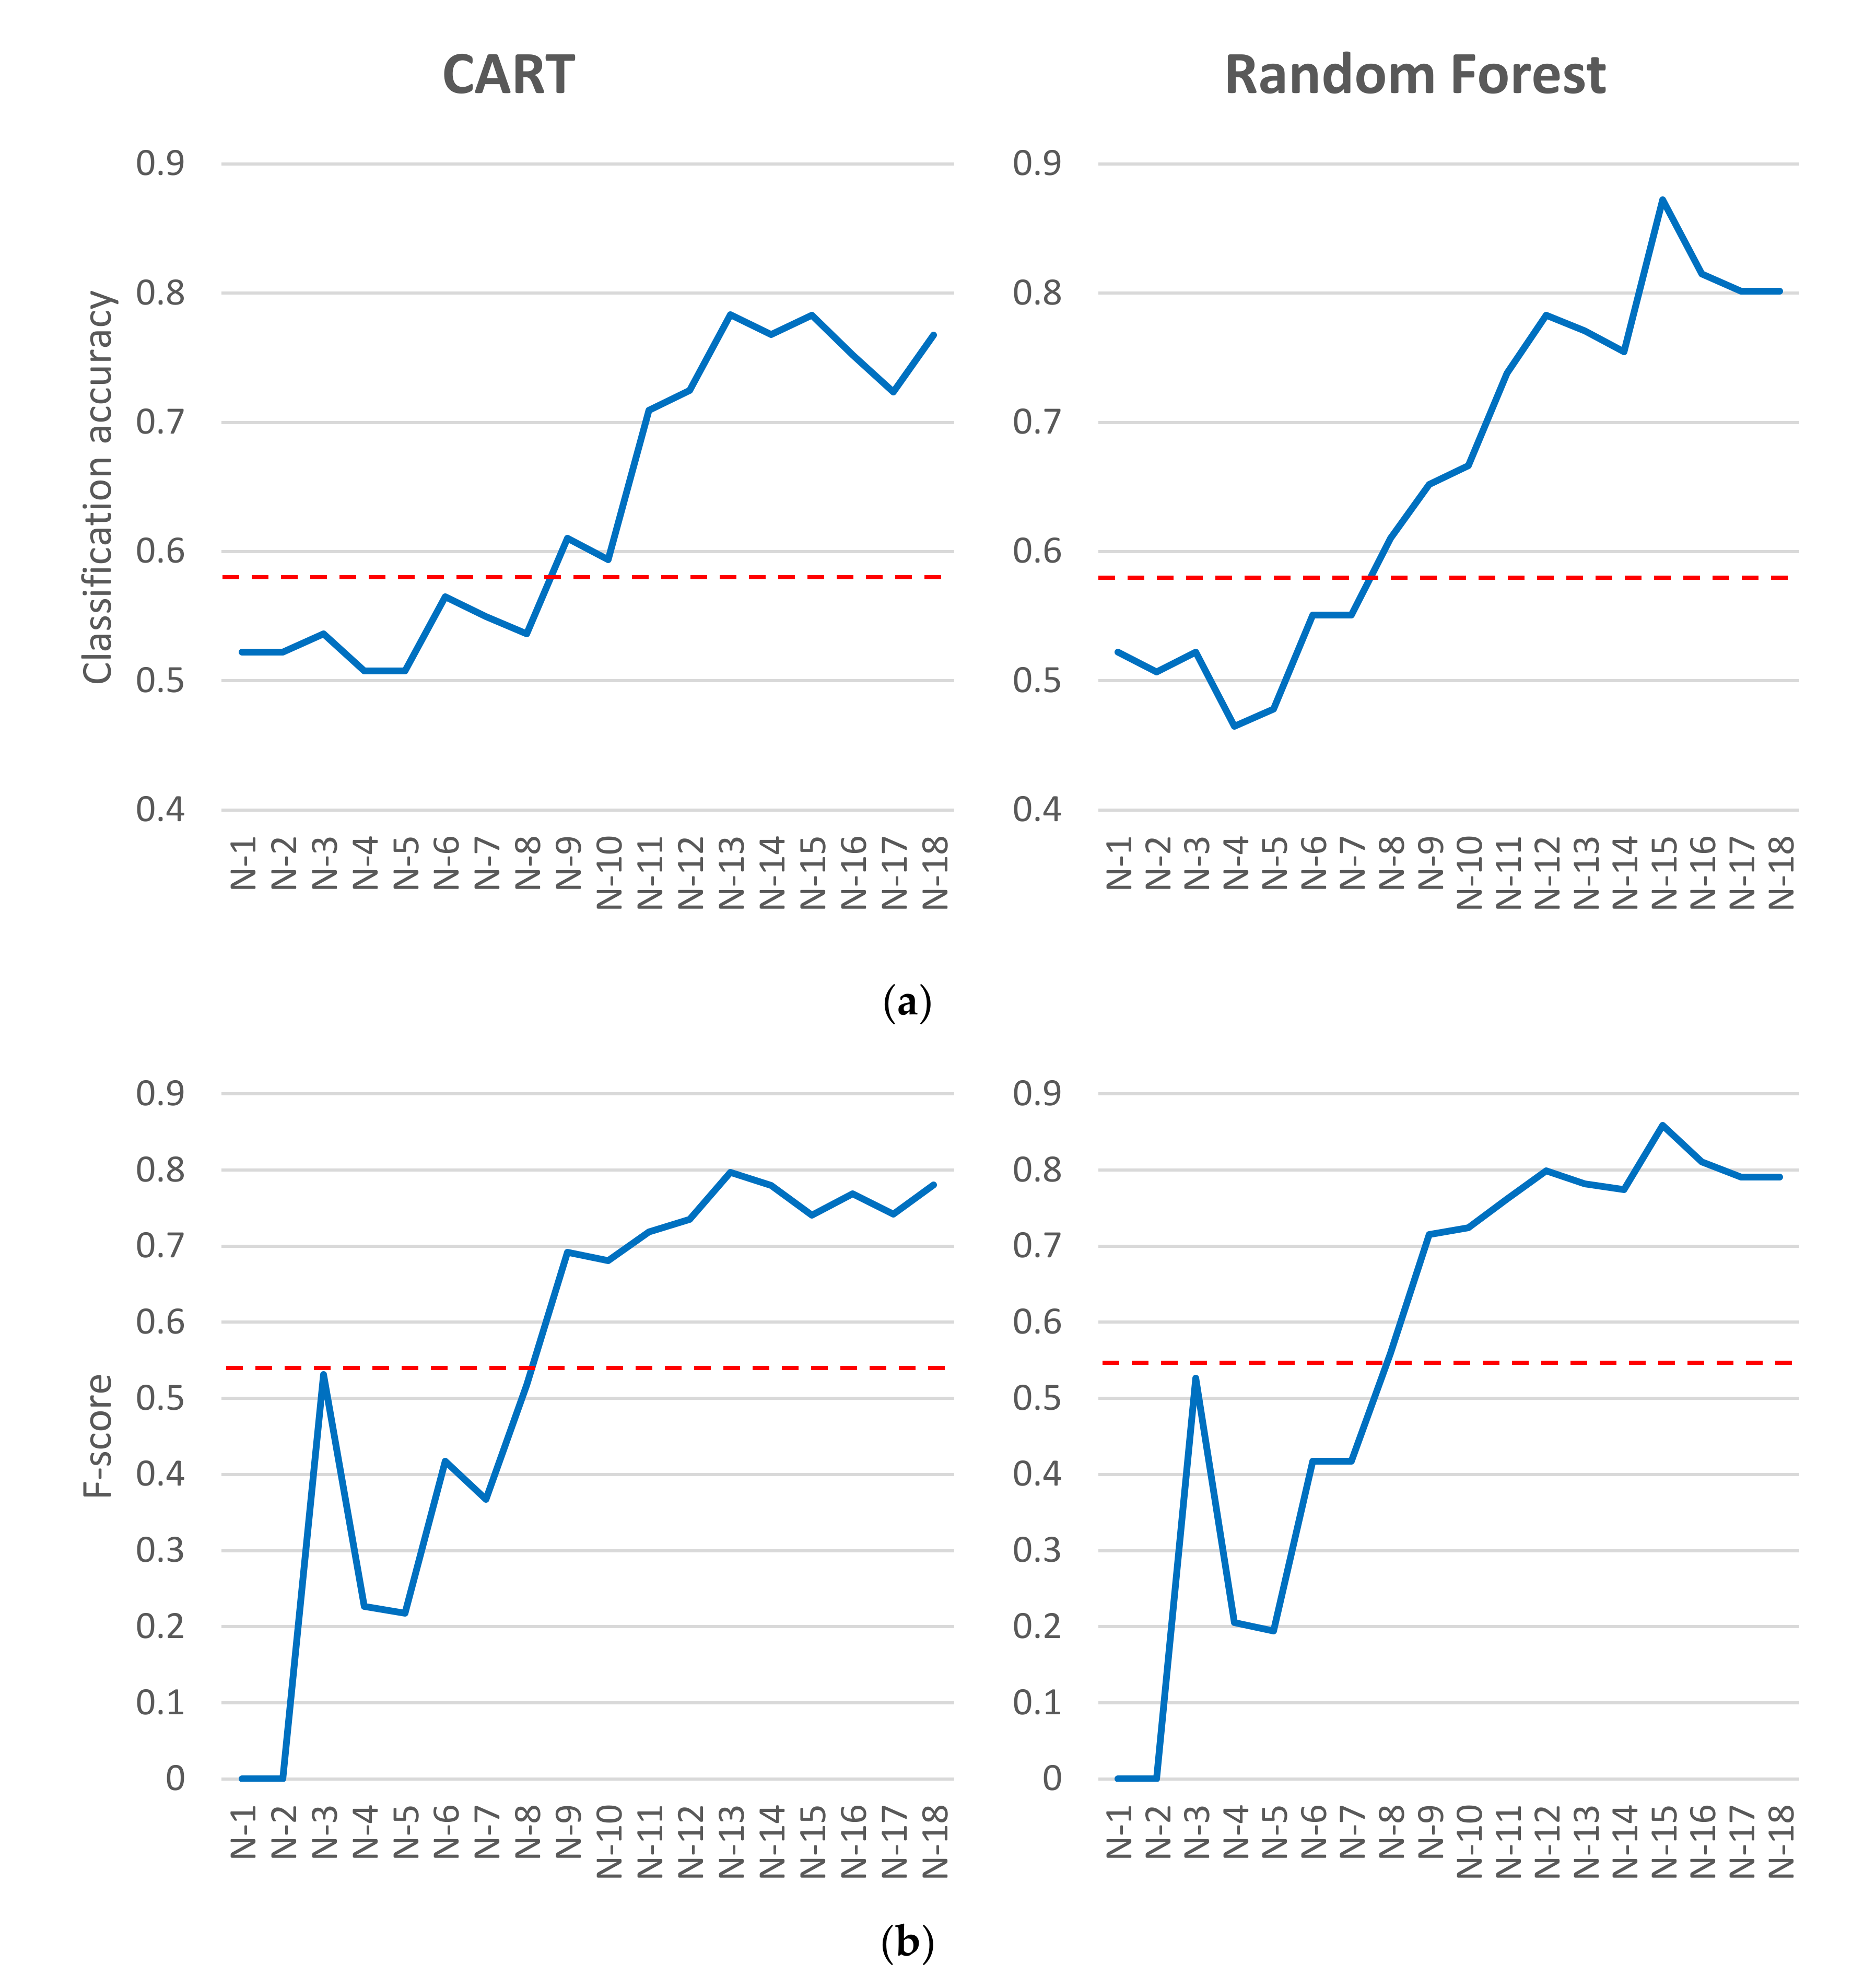
Figure 8 shows that the prediction of MINC change of the model built only on this project is better than the prediction ability of the general model. The best model (N-15) produced CART and Random Forest models with accuracies 0.78 and 0.87 with F-score of 0.74 and 0.86 respectively, versus the general models (from the previous Section), with accuracies of 0.58 both times and F-scores of 0.53 and 0.55 for CART and random forest. Again, this is logical, as only project-specific patterns are extracted and not the general ones.
The classification metrics‘ accuracy and average F-score of this project-specific model are far better in later steps than the classification metrics of the general models. This supports the hypothesis that focusing on one project can produce better results than trying to extract the general knowledge. There is a small drop of classification performance after N-15, which could be attributed to too wide data (too many features and too few instances), which could be mitigated with feature selection or data over-sampling. The bad classification performance of earlier steps (from N-1 to N-5) only supports our hypothesis that including more historical changes from the past improves the future MINC change prediction significantly.
Of course, the good performance using this approach on other projects individually would not be guaranteed. The information needed for future MINC change prediction is not always reflected in source code, and, consequently, software metrics, as in this project. Naturally, these project-specific models are over-fitted to this project, and would perform worse on any other project than the general model. With this approach, the MINC change prediction model must be built individually for every project. This could not be usable and doable for every software project development process (small teams with limited hardware capabilities and machine learning knowledge), but can still be incorporated as a static analysis done overnight on a dedicated system, similar to overnight testing of committed changes. The analysis for this experiment was done on a computer with Intel i7-4790 CPU @ 3.6 GHz with four cores, 24 GB of RAM memory.
6. Discussion
The results of the study indicate that software maintainability models enriched by historic measurement data achieve better results in predicting future maintainability change compared to the model built with measurement of one release of a software project. The results of the experiment show that the software maintainability prediction models enriched by historic measurements perform better for both performance indicators used in the study, the classification accuracy and F-score. In general, the prediction model performance gain was slightly more distinct in the case of the F-score performance indicator. This is a relevant fact, since F-score is a more balanced metric, where the performance of predicting (classifying) every class is more important than just general accuracy, even when some classes are ignored [
70]. The results of the study show that the prediction model based on the measurements obtained from a single release of a software project is, from the perspective of F-score performance indicator, quite weak. In the experiment, both performance indicators were improving throughout iterations after the model was enhanced by additional historical releases of the studied software project.
An important domain of software maintainability research represents studies of links between software metrics and the maintainability of software projects. The systematic literature review conducted by Jabangwe et al. [
58] implied a strong link between the complexity metrics and the maintainability. On the other hand, the measures of inheritance aspects of software design manifest a weaker link to the maintainability. Among the software metrics used in our study, TCC metrics had the strongest contribution to the accuracy of the prediction model, which was used as an equivalent of the WMC software metric of the C&K set. On the other hand, the weakest contribution to the prediction model performance was, on average, measured by the DIT and NSUB software metrics, an equivalent of the NOC metric in C&K. An interesting observation is that the profile of contributions of software metrics in our study is getting closer to the contribution profile of metrics observed by Jabangwe et al. in the last iterations of the experiment when the series of history measurement data was added to the prediction model. In our study, the contribution of measures based on a single software release in the first iteration deviates strongly from the observations of the studies of other authors. Eventually, after adding extra layers of historic software metric measurements, the contribution of the metrics approached the results of the mentioned research.
The profile of software metrics’ contribution to the prediction models shows that the maintainability index, applied in the same way as in this research, can be, despite some criticisms regarding computation and applicability to the object-oriented paradigm [
34,
71], used as an efficient predictor of the future software maintainability change. Namely, the strong link between complexity measures and the maintainability, and the weak link between software inheritance and the maintainability, indicates the eligibility of the maintainability index formula.
According to the results of the study, the largest contribution to the performance of the prediction model was by the measurement data collected from releases closer to the latest release of a software project, namely, newer versions in the history of the software project’s releases. This is indicated by the logarithmic trend in the performance growth revealed by the analysis of the collected data in the experiment. The analysis of the data did show that additional layers of measurement data added in individual iterations of the experiment contributed to the prediction ability of the prediction model. On average, by any layer of the additional historic measurement data, the model was getting more successful.
6.1. Threats to Validity
The empirical study presented in the paper has several threats to internal and external validity for the selected systems to which the study was applied. Consequently, these threats may restrict the generality, and may limit the interpretation of the results of this paper. We identified systematically and addressed carefully potential threats to the validity of our study by taking steps to minimise or mitigate them.
6.1.1. Internal Validity
Steps were taken to ensure that internal validity included the correctness and completeness of the source codes and metric measurements of the software components used in the study. All the selected software components were obtained from the official Maven Repositories. The correctness of statistical analysis also depends on the correctness of the artefact metadata published in the Maven Repository. Software metrics measurements were performed automatically for all releases of a software component using the JHawk static code analysis tool, which reduces the possibility for the emergence of human-induced mistakes. Furthermore, the study relied on getting a history of software metric measurements of a set of prior versions of software components studied in the research. Therefore, prior versions of software components were, in the first stage, sorted into the correct temporal order automatically according to the timestamps obtained from the Maven Repositories, and later validated manually by one of the researchers. During manual validation of release tags, we checked manually that only final releases of versions were included in the study.
6.1.2. Construct Validity
The maintainability index, one of the most used measures for assessing software quality of a software system, was employed to guarantee the structural validity of the assessment of software maintainability of this study. Despite being often criticised because of its lack of compliance with the object-oriented paradigm, it has often been employed in many studies. The C&K metric set, employed to assess software quality characteristics of studied software components, is one of the most used metrics set in the literature. An additional threat to validity could stem from the amount of data used by the machine learning algorithms. The larger amount of data added in the prediction models in the final iterations of the experiment could affect the performance of the model. We tried to reduce the threads by the relatively large amount of software projects included in the research.
Our research is based on previous works that advocate internal quality measured by software metrics as a sufficient indicator of the software maintainability. Besides the assessment of internal quality of software products, alternative approaches to the maintainability assessment can be also found in the literature.
6.1.3. External validity
The first external threat to validity is that all software components included in the study are open-source software systems. Consequently, they may not be representative of all closed-source software from the industrial domain. Open source software is developed in development environments that could have different expectations regard coding conventions and quality standards. To reduce concern regard non-professional software projects, our research is based on the list of the highly-accepted software components. Software components used in the study are among the leaders in their field, provided by in IT world recognized software vendors and developed mainly by professional software developers sponsored by these vendors or communities.
The second external threat to validity is that all software components are implemented based on Java technology stack. Other programming languages, e.g., C++, Smalltalk, and Python, used in the development of modern software solutions, may have features that differ from those in Java. Despite these differences, all modern mainstream programming languages in their foundation follow the same principles, resulting in the minimal impact of programming language on software maintainability.
The third external thread to validity is that the software components used in the study may not be representative of other every-day real-life software projects. The experiment was conducted on real-life software components that are incorporated into many production-ready software solutions daily, but are already well maintained and audited by several experienced developers. This may not be the case for every software project in the industry, and thus the conclusions of our study should be taken with precaution.
7. Conclusions
The study explores the impact of historical software version changes in predicting the future maintainability of the software. The novelty of our study is, unlike related works in the research field, a detailed analysis and assessment of the metric measurement contribution to maintainability prediction performance on a version-to-version basis, which to our best knowledge has not been evaluated previously.
In the experiment, 40 real-life open-sourced Java-based software components published in the Maven Repository were included, for which the history of 19 successive releases was available. The internal quality of collected software projects was assessed using the C&K metric set, and the software maintainability of the software projects was assessed by the maintainability index. With these data, the software maintainability prediction models were built and assessed through two performance indicators, classification accuracy and F-score. The outcome of the experiment was analysed with statistical tests to get the answer to our research question if historical changes in software have an impact on the future software maintainability. The key finding of the study was:
In the context of RQ1, our results showed that despite an occasional smaller decline in the performance of the software maintainability change prediction model during the experiment, in general, the prediction models gained on the performance by every layer of newly added software metrics measurement data
With regard to RQ2, it can be observed that, adding software metrics measurement data iteratively to the prediction model, the ranks of contribution to the prediction model eventually converged toward the reference ranks of the software metrics according to the observations of related research.
The results of the data analysis show that the gain of software maintainability prediction performance was the greatest when the prediction model was enriched by software metric measurements of versions closer to the latest release. Moreover, from the newest release, more distant versions of a software project contributed less to the performance of the maintainability prediction model. The main contribution of the paper is to show the prediction model’s performance through the iterations of the experiment grows with the logarithmic trend. Therefore, the measurement data of the nearby versions of the observed release of a software project remain relevant for the building of maintainability prediction models. Additionally, the paper evaluates the contribution of the growth of the prediction model’s performance through the iterations. How many versions will be considered in the assessment depends on a compromise between the gain in prediction performance and measurement data to be collected.
Additionally, we tested the validity of our approach and its compliance with existing research by conducting a feature importance calculation and ranking. It was shown that, when adding more historical releases to the analysis, the importance of software metrics in predicting the maintainability change resembled the importance of software metrics in calculating the maintainability in the same version. As we are dealing in predicting the future trend of maintainability change, for which the software metrics are not yet known (as with existing research), this is also an important finding.
First, the results obtained in the study could have an impact on software maintainability assessment in software development environments, where a smooth evolution of software products is one of the key risks that have to be managed. Enhanced software maintainability prediction models shift the focus of the maintainability assessment of the latest release of a software component. Instead, the dynamics of software maintainability change in a software product is assessed through a temporal perspective. Without intervention, the patterns of change in the maintainability from the past are likely to continue in the future. The excessive degradation of the maintainability from version to version, for example, indicates future risks. Software maintainability assessment through the temporal viewpoint addresses additional aspects of software quality risk management, e. g., management of software design decay and erosion. The introduction of the historic measurement-enhanced software maintainability prediction models would, consequently, result in better risk management related to the poor internal quality of software products. Second, the results can be useful for researchers in the field of software engineering. Based on approaches of the automated capture of a broader range of measurements of software products, more precise maintainability prediction models can be developed and proposed to practitioners.
As part of the future work, we would like to investigate the abilities of machine learning techniques for the domain of software maintainability prediction. The introduction of the state-of-the-art approaches of machine learning into the research area of software engineering, and the enormous amount of data that can be extracted from real-world software projects available in publicly accessible software repositories, allows investigation of factors with a significant effect on the maintainability and longevity of software products. Based on these approaches, we would like to investigate links between deviations from good engineering practices (e.g., code smells) and management of the maintainability through the complete life cycle of software products. Despite active research in past years, the influence of bad practices on the maintainability remains an open research area.


