Featured Application
Gaseous detonation can be used as an efficient propulsion method to serve the design of detonation engines. This work was to identify the possible effect of inhomogeneity induced by temperature perturbations on the evolution or amplification of cellular instability of the detonation front, which helps to design detonation engines.
Abstract
Numerical simulation of propagation mechanisms of gaseous detonations in the inhomogeneous medium is studied by using the reactive Euler equations coupled with a two-step chemical reaction model. The inhomogeneity is generated by placing artificial temperature perturbations with different wavelengths and amplitudes. The motivation is to investigate the effect of artificial perturbations on the evolution or amplification of cellular instability. The results show that, without artificial perturbations, a planar ZND detonation can evolve into a fully-developed cellular detonation after a distance because of the amplification of the cellular instability. With the artificial perturbations evolved in, at the early stage, the artificial perturbations control the transverse wave spacing by suppressing the amplification of the cellular instability. However, after a steady-state, the cellular instability starts to amplify itself again and eventually transits to a fully-developed cellular detonation. It is demonstrated that the presence of the artificial perturbations delays the formation of the cellular detonation, and the increase of instability factor can slow down this delay. It is also found that, if the wavelength of the artificial perturbations is close to the transverse wave spacing of the cellular detonation in the homogeneous medium, synchronization of these two factors occurs, and hence a cellular detonation with extremely regular cell pattern is immediately formed. The temperature discontinuity causes the front to be more turbulent with the presence of weak triple-wave structure locally besides the natural transverse waves. The artificial perturbations can increase the intrinsic instability, and hence changes the propagation mechanism of the detonation front. In contrast, large artificial perturbations could prohibit the propagation but reduce cellular instability. It is concluded that the competition of artificial perturbations with intrinsic detonation instability dominates the evolution of cellular structures of the detonation front.
1. Introduction
Gaseous detonation (explosive) can be used as an efficient propulsion method to serve the design of detonation engines, or it can appear in an industrial explosion accident seriously. In reality, the gaseous medium usually has non-uniformity; thus, the propagation mechanism is different from the classic detonation theory. The research on the propagation mechanism of detonations in non-uniform gaseous media faces many challenging fundamental issues, and it is also one of the research frontiers of detonation physics. The propagation mechanism of gaseous detonations in inhomogeneous media is different from those inhomogeneous conditions. The classical detonation theory cannot be used to describe the non-ideal process, especially critical conditions of detonation ignition, propagation, and failure. The inhomogeneity mainly arises from the gradient, periodically, or randomly spaced perturbations of component concentration or temperature (density).
Several researchers have studied the detonation in mixtures whose composition gradients are normal to the direction of propagation by experiments [1,2] or numerical simulations [3,4]. Ishii et al. [5] showed that the tilted wavefront whose angle is consistent with the deflection angle of the detonation front. Han et al. [6] investigated the role of a transversal concentration gradient in detonation propagation and found that the transversal concentration gradient enhances the cellular detonation instability. Bjerketvedt et al. [7] elucidated the behavior of detonation waves in non-uniform mixtures. They found that the driver length, gradient width, and difference in properties of driver and acceptor mixtures all affected the possibility of detonation transmission. Thomas et al. [8] performed similar work in a tube. They concluded that the detonation initiation in a weaker mixture by an incident detonation propagated across a concentration gradient from that in a homogeneous mixture. Boulal et al. [9] showed that detonation dynamics depend on the steepness of the composition distribution and the local and initial values of the equivalence ratio.
In the above studies, the non-uniformity of thermodynamic parameters comes from the existence of gradients in the overall spatial distribution. Due to the presence of the gradient, it is difficult for the detonation wave to reach a stable propagation state, and it is usually in a transient process. The wavefront of the detonation wave is twisted, traditionally accompanied by Mach reflection of the detonation wave. Although this gradient distribution model is closer to the real situation, it is not conducive to establishing a steady-state propagation mechanism in non-uniform media. The alternate way is that no overall gradient exists in the thermodynamic parameters but local perturbations on a relatively small scale. In such a case, the detonation wave propagates in a steady-state mode, and the wavefront is planar instead of with overall curvature. This model is useful for studying the influence of the scale and intensity of the perturbation on the evolution of the wavefront structure. Mi et al. [10] studied the detonation limit by adding a random spaced discrete element to the mixture and found it renders the detonation more distorted and discrete, which hence promotes the propagation. Li et al. [11] and Higgins [12] studied the detonation propagation and limit by introducing periodical perturbations to the medium or to the reaction rate to produce inhomogeneity.
The deflagration to detonation transition (DDT) in inhomogeneous media has also been studied by many researchers. The Sinusoidal perturbations are usually superimposed on a linear gradient to examine the effect of perturbations amplitude and frequency [13]. The results suggest that perturbations caused by turbulent mixing may increase the critical length by more than an order of magnitude as compared to a smooth linear gradient. Vollmer et al. [1,14] demonstrated that the criterion of DDT in a homogeneous medium is no longer valid in inhomogeneous media. Wang and Wen [15] found that their numerical results agree well with the experimental results of Ettner [16]. Khodadadi et al. [17] found that the over-pressure at the DDT transition stage is higher in the non-uniform mixtures than that in a homogeneous mixture under similar conditions.
Detonation initiation in inhomogeneous medium has also been extensively studied following the temperature gradient ignition theory proposed by Zel’dovich [18]. These studies mainly focus on the critical conditions for detonation initiation [19,20], propagation mode [21,22,23], and the effect of the reaction model [24,25,26]. In addition, the effect of component concentration and temperature perturbations on detonation initiation are also studied by Dai et al. [27,28] and Qi et al. [29,30]. Lee [31] proposed a similar mechanism of coherent energy release of shock wave amplification (SWACER) to explain the direct detonation process of detonation waves and conducted a detailed study on this issue. Zel’dovich believes that the compression wave initially formed during ignition is coupled with the exothermic reaction of the reaction along the temperature gradient or concentration gradient of the mixture. Although the emphasis of these two mechanisms is different, it is believed that the local inhomogeneity (gradient) of the chemical properties of the mixture caused by the ignition process plays a vital role in the formation of detonation.
The objectives were to identify the possible effect of inhomogeneity induced by artificial temperature perturbations on the evolution or amplification of cellular instability of the detonation front. Unlike previous studies, this study reported, possibly for the first time, the regime for development of cellular structures induced by periodically spaced temperature perturbations and its competition with the intrinsic detonation stability. Moreover, the effects of wavelength and amplitude of the perturbations on the detonation development regime were examined.
2. Numerical Methods
2.1. Governing Equations
The governing equations used in the present work are the Euler equations coupled with a two-step chemical reaction model. The viscosity, heat transfer, and diffusion are neglected. The governing equations are expressed as:
where
assuming a polytropic equation of state and an ideal thermal equation of state:
where p, , E, T, u, v, and Q are the pressure, density, total energy, temperature, velocities at x and y, and the heat release parameter, respectively. and correspond to the induction and reaction progress variables of the reaction model.
2.2. Two-Step Chemical Reaction Model
A two-step reaction model was used in the calculation process. The first step is a thermally neutral induction process with an Arrhenius rate given by:
where subscript indicates quantities in the induction zone behind the detonation front. is a step function defined as:
Here, the induction rate parameter such that the one-dimensional ZND induction length is unity, i.e., , where is the particle velocity behind the shock front in the shock-fixed frame for the CJ detonation. At the termination of induction period (), the second energy release step is given by the rate equation:
where and denote the induction and reaction rate constants to control the induction and reaction width, respectively. and represent the activation energies of the two processes, respectively.
2.3. Numerical Method
A parallel AMROC code developed by Deiterding [32] is used in the present study. It is fully accepted that the AMROC code can resolve the detonation problem with high accuracy, efficiency, and robustness. A fractional step method (Godunov splitting) is used to decouple the hydrodynamic transport and chemical reactions. The reactive Euler equations are solved with an accurate MUSCL-TVD finite volume method. As for the reactive source term, a semi-implicit generalized Runge–Kutta method of fourth-order (GRK4A) is utilized for integration. The entire computational domain is covered by a coarse grid, and a fine mesh is superimposed on the coarse grid in the vicinity of the detonation front.
2.4. Simulation setup
A simple two-step reaction model is used in the present study. Detonations with different instability factors can be obtained by keeping constant but changing . As proposed by Ng [33], the activation energy = 4.8 and = 1.0 to represent hydrogen–oxygen mixtures rather than heavy hydrocarbon mixtures. The specific heat ratio is set as 1.44 for all cases. The detonation velocity . The instability factor proposed by Ng [33] is used to characterize the chemical sensitivity to temperature perturbations. Three detonations with different stability factors were used in the present study, as shown in Table 1. The ZND structures for the three detonations with different instability factors are also shown in Figure 1. The computations are initialized by the steady solution of the ZND detonation. The length and width of the computation domain are and , respectively. The left and right boundaries are both set as outflow conditions. The upper and bottom walls are set as slip wall conditions. Artificial temperature perturbations are placed to generate inhomogeneity. The wavelength of the perturbation s is set as 10 , 20 , 40 , respectively. The amplitude is A, with an average temperature of 295 K, as shown in Figure 2.

Table 1.
Detonation reaction parameters.
Figure 1.
Steady structures of ZND detonations with different instability factors.
Figure 2.
Schematic of the computation setup, (a) top view and (b) side view.
2.5. Resolution Convergence Test
The resolution tests of one-dimensional detonations, as shown in Figure 3, are conducted to check the convergence of the numerical method with the present two-step reaction model. The first one is a CJ detonation with , and K transmits into a low-temperature zone with = 270 K. The second one is a CJ detonation with and K transmits into a high-temperature zone with = 320 K. The resolution tests of two-dimensional detonations, as shown in Figure 4, are also conducted to check the convergence of cellular structures. The set-up is in accord with our following simulations as shown in Figure 2 but in a shorter length of the domain to save computation time. In the present resolution test, and K. The convergence of the numerical results are observed in both the one- and two-dimensional tests. A grid resolution of at least 32 pts is found to be adequate to ensure the convergence in the present study.
Figure 3.
Numerical resolution test for one-dimensional detonations, (a) , = 270 K and (b) , = 320 K.
Figure 4.
Numerical resolution test for cellular structures, (a) 16 pts, (b) 32 pts, and (c) 48 pts.
3. Results and Discussions
3.1. The Transition from ZND to Cellular Detonations without Artificial Perturbations
When a one-dimensional ZND detonation is placed in a two-dimensional domain as an initial condition, the planar structure can only sustain itself for a short distance. Then small-scale distortion appears on the front because of the detonation instability and numerical truncation error. The latter one actually triggers the distortion, but its development is controlled by the detonation instability. The distortion causes a transverse gradient of the reactivity and hence causes the formation of weak transverse waves. As the weak perturbations amplified itself at a rate controlled by the instability factor, a balance will eventually be obtained with the presence of transverse waves with a constant spacing. Thus a fully-developed cellular detonation can always be formed, as shown in Figure 5. In the case with , distortion first appears at a distance of 200 , and the final equilibrium is reached at a distance of about 700 . When , these two values change to 100 and 500 . When , these two values change to 80 and 400 . It suggests that, with the increase of , or equivalently the increase of instability factor f, these two distances are dramatically reduced. The increase of instability renders the chemical reactions to be more sensitive to the perturbations of temperature and hence accelerates the amplifying rate of the distortion and transverse waves. Figure 6 shows five pressure history curves at different height along the channel. It is easy to locate where the distortion occurs, how the perturbations amplify, and when the final equilibrium state is reached. The fluctuations of the cellular detonation front can also be observed. It is found that cases with large instability factors show large fluctuation scattering. The cell length variation is also plotted in Figure 6d. The cell sizes of three fully-developed detonation waves with different only show small variation. It can be explained that the cell size usually has a linear relation with the induction length that does not change since is set as a constant number.
Figure 5.
Numerical smoked foils without artificial perturbations, (a) , (b) , and (c) .
Figure 6.
Pressure history and cell length variation for three cases without artificial perturbations, (a) , (b) , (c) , and (d) cell length.
3.2. Small-Amplitude Artificial Perturbations
Figure 7 and Figure 8 show the numerical smoked foils with different wavelengths of the artificial perturbations. The corresponding cell length variation is shown in Figure 9. Note that the cell length L is approximately 1.5–2 times the cell size . In this section, the small amplitude of artificial perturbations is set as 15 K for all cases. When the artificial temperature perturbations are induced, distortion appears on the detonation front only after a very short distance of a few induction lengths, and the transverse waves are also formed with extremely regular cell pattern as shown in Figure 7. It is observed that the cell size approximately equals to the wavelength s (10 ), indicating the transverse wave evolution is controlled by the artificial perturbations. However, it is also found that the transverse instability starts to amplify itself again later at a position where x = 400 . The amplification is finished at a distance of 700 as a fully-developed cellular detonation is finally formed. It suggests that the artificial perturbations suppress the amplification of the cellular instability for a certain distance, but cannot terminate the process since the wavelength of the artificial perturbations (s = 10 ) is much smaller than the transverse wave spacing (40–50 ).
Figure 7.
Numerical smoked foils for cases with artificial perturbations of A = 15 K, , (a) , (b) , and (c) .
Figure 8.
Numerical smoked foils for cases with artificial perturbations of A = 15 K, , (a) , and (b) .
Figure 9.
Cell length variation during the transition from ZND to cellular detonation with artificial perturbations, (a) , (b) and (c) .
As the wavelength increases to s = 20 , as shown in Figure 8a, a similar process can also be found compared to the case with s = 10 . The main difference is that the amplification is delayed, indicating the increase of wavelength enhances the suppression of cellular instability. As the wavelength increases to s = 40 that is close to transverse wave spacing (approximate 50 ) controlled by the intrinsic instability in a homogeneous mixture, the cellular instability synchronizes with the artificial perturbations immediately, as shown in Figure 8b. Only at the very end of the channel, the cellular instability appears with the presence of an irregular cellular pattern (or phase variation), which is more obvious in cases with high instabilities. The cell size almost remains the same because of the same wavelength, as shown in Figure 9. However, the increase in the instability factor raises the scattering of the cell length. It can also be found that these processes can be shifted to an early date if the instability factor is increased. Thus, the evolution process is dominated by two competing factors, the intrinsic instability and the wavelength of the artificial perturbations. However, due to a fixed small value of amplitude (15 K), a fully-developed cellular detonation can always be obtained in the channel, and the nature of the detonation almost agrees with that in cases without artificial perturbations.
Scattering of the pressure oscillation is reduced because of the presence of the artificial perturbations. However, it is found that the frequency is increased, which is also evidenced by the increase of the fluctuation on cell length, as shown in Figure 9. The temperature perturbations can be considered as periodically spaced hot and cold spots. The hot spot promotes the detonation by increasing the reaction rate, while the cold spot prohibited the detonation by reducing the reaction rate. However, the negative effect is stronger than the positive one because the reaction rate has an Arrhenius form. Thus, the presence of the artificial temperature perturbations can prohibit the growing of the front, resulting in a lower pressure oscillation, but also renders the front more discrete (or equivalently the cell size has a large scattering), as shown in Figure 10.
Figure 10.
The evolution of detonation front () for cases with the same amplitude of A = 15 K but different wavelengths of (a) , (b) , and (c) .
3.3. Large-Amplitude Artificial Perturbations
Figure 11 show the pressure history along the channel. In this section, the large amplitude of the artificial perturbations is used to investigate its effect on the propagation. Figure 12 show the detonation front for a case with A = 55 K, , and s = 20 . The temperature discontinuity is found to render the front more turbulent with the presence of weak triple-wave structure locally besides the natural transverse waves with long tails. In addition, the small unburnt hot pocket can also be formed due to the turbulent front. Figure 13 shows the effect of different amplitude of the temperature perturbations. For the case with A = 105 K, the strong artificial perturbations totally suppress the evolution of the detonation front. Only a turbulent front is observed without strong transverse waves. The numerical smoked foil also confirms it, as shown in Figure 14. It suggests that artificial perturbations can increase the intrinsic instability, and hence changes the propagation mechanism of the detonation front while large artificial perturbations could prohibit the propagation but reducing the cellular instability.
Figure 11.
Pressure history for cases with different artificial perturbations at , (a) , (b) , and (c) .
Figure 12.
Structures of the transit detonation front for case with large amplitude of temperature perturbations (A = 55 K, and ), (a) density, (b) temperature, and (c) Schlieren photography.
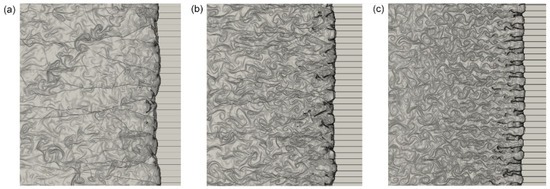
Figure 13.
Schlieren photography of detonation front under artificial perturbations with different amplitude with and , (a) A = 15 K, (b) A = 45 K, and (c) A = 105 K.
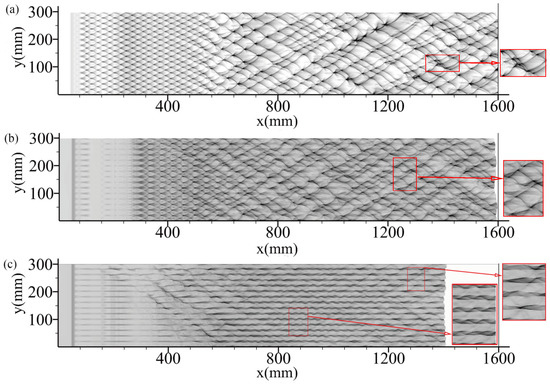
Figure 14.
Numerical smoked foils for cases front under artificial perturbations with different amplitudes and , (a) A = 15 K, (b) A = 55 K, and (c) A = 105 K.
4. Conclusions
The results show that, without artificial perturbations, a planar ZND detonation can evolve into a fully developed cellular detonation after a distance because of the amplification of cellular instability on its front. The process is initiated by numerical truncation error but controlled by the instability factor. With the artificial perturbations evolved in, at the early stage, the artificial perturbations control the transverse wave spacing by suppressing the amplification of the cellular instability. However, after a steady-state, the cellular instability starts to amplify itself again and eventually transits to a fully developed cellular detonation. It suggests that the presence of the artificial perturbations delays the formation of the cellular detonation, and the increase of instability factor can slow down this delay.
It is also found that, if the wavelength of the artificial perturbations is close to the transverse wave spacing of the cellular detonation in a homogeneous medium, synchronization of these two factors occurs, and hence a cellular detonation with extremely regular cell pattern is immediately formed. Only after a long distance of travel, a phase variation renders the cell pattern more irregular. The temperature discontinuity causes the front more turbulent with the presence of weak triple-wave structure locally besides the natural transverse waves. The artificial perturbations can increase the intrinsic instability, and hence changes the propagation mechanism of the detonation front. In contrast, large artificial perturbations could prohibit the propagation but reducing cellular instability. It is concluded that the competing of the artificial perturbations and intrinsic instability dominate the evolution process of the detonation front.
As discussed in the introduction, the inhomogeneity of the reactive mixtures in reality usually arises from a gradual change of the thermodynamic parameters or concentration in space in a particular direction. Most experimental and numerical studies have been conducted based on such an assumption. However, to elucidate the response of the dynamics of the detonation front to the perturbation with a more general framework, a regular placing of temperature perturbation is used in the present study, which renders it difficult to compare directly with the experimental results. Moreover, a planar ZND detonation without cellular structures is used initially trying to observe the effect of temperature perturbations on the detonation front undergoing a transition process to fully developed cellular detonation. Such a process is almost impossible to recover in experiments, since the real detonation front is essentially three-dimensional. However, many researchers still used such a procedure to investigate the detonation problems due to its simplicity and purity by ignoring the transverse waves temporarily. This means that the present work is a pure numerical study derived from previous numerical and experimental observations. Furthermore, in the experiments, all relative factors are coupled together, making it difficult to interpret the real physics. By using this numerical simulation, the problem can be separately investigated, which facilitates the interpretation. Even though no direct comparison to experiments is conducted in the present study, we believe our work is meaningful in contributing to the understanding of the detonation physics in the inhomogeneous medium.
Author Contributions
Conceptualization, J.N. and D.C.; methodology, J.L.; software, D.C.; validation, J.N.; formal analysis, J.N.; investigation, D.C.; resources, J.N.; data curation, J.N.; writing—original draft preparation, J.L.; writing—review and editing, D.C. and J.L.; visualization, D.C.; supervision, J.L.; project administration, J.L.; funding acquisition, J.L. All authors have read and agreed to the published version of the manuscript.
Funding
This research was funded by National Natural Science Foundation of China (No. 11702026) and Project of State Key Laboratory of Explosion Science and Technology (YBKT19-01).
Conflicts of Interest
The authors declare no conflict of interest.
References
- Vollmer, K.G.; Ettner, F.; Sattelmayer, T. Deflagration-to-detonation transition in hydrogen/air mixtures with a concentration gradient. Combust. Sci. Technol. 2012, 184, 1903–1915. [Google Scholar] [CrossRef]
- Boeck, L.R.; Berger, F.M.; Hasslberger, J.; Sattelmayer, T. Detonation propagation in hydrogen-air mixtures with transverse concentration gradients. Shock Waves 2016, 26, 181–192. [Google Scholar] [CrossRef]
- Kessler, D.A.; Gamezo, V.N.; Oran, E.S. Gas-phase detonation propagation in mixture composition gradients. Philos. Trans. R. Soc. A Math. Phys. Eng. Sci. 2012, 370, 567–596. [Google Scholar] [CrossRef] [PubMed]
- Ettner, F.; Vollmer, K.G.; Sattelmayer, T. Mach reflection in detonations propagating through a gas with a concentration gradient. Shock Waves 2013, 23, 201–206. [Google Scholar] [CrossRef]
- Ishii, K.; Kojima, M. Behavior of detonation propagation in mixtures with concentration gradients. Shock Waves 2007, 17, 95–102. [Google Scholar] [CrossRef]
- Han, W.; Wang, C.; Law, C.K. Role of transversal concentration gradient in detonation propagation. J. Fluid Mech. 2019, 865, 602–649. [Google Scholar] [CrossRef]
- Bjerkedvedt, D.; Sonju, O.K.; Moen, I.O. The influence of experimental condition on the reinitiation of detonation across and inert region. In Dynamics of Explosions, Progress in Astronautics and Aeronautics; AIAA Inc.: New York, NY, USA, 1986; pp. 109–130. [Google Scholar]
- Thomas, G.O.; Sutton, P.; Edwards, D.H. The behavior of detonation waves at concentration gradients. Combust. Flame 1991, 84, 312–322. [Google Scholar] [CrossRef]
- Boulal, S.; Vidal, P.; Zitoun, R. Experimental investigation of detonation quenching in non-uniform compositions. Combust. Flame 2016, 172, 222–233. [Google Scholar] [CrossRef]
- Mi, X.; Higgins, A.J.; Ng, H.D.; Kiyanda, C. Effect of Spatial Inhomogeneities on the Propagation Limit o Gaseous Detonations. In Proceedings of the 26th ICDERS, Boston, MA, USA, 30 July–4 August 2017. [Google Scholar]
- Li, J.; Mi, X.; Higgins, A.J. Effect of spatial heterogeneity on near-limit propagation of a pressure-dependent detonation. Proc. Combust. Inst. 2015, 35, 2025–2032. [Google Scholar] [CrossRef]
- Higgins, A.J. Discrete effects in energetic materials. J. Phys. Conf. Ser. 2014, 500, 052016. [Google Scholar] [CrossRef]
- Montgomery, C.J.; Khokhlov, A.M.; Oran, E.S. The Effect of Mixing Irregularities on Mixed-Region Critical Length for Deflagration-to-Detonation Transition. Combust. Flame 1998, 115, 38–50. [Google Scholar] [CrossRef]
- Vollmer, K.G.; Ettner, F.; Sattelmayer, T. Influence of concentration gradients on flame acceleration in tubes. Sci. Technol. Energ. Mater. 2011, 72, 74–77. [Google Scholar]
- Wang, C.J.; Wen, J.X. Numerical simulation of flame acceleration and deflagration-to-detonation transition in hydrogen-air mixtures with concentration gradients. Int. J. Hydrogen Energy 2017, 42, 7657–7663. [Google Scholar] [CrossRef]
- Ettner, F. Efficient Numerical Simulation of Deflagration-Detonations-Transition. Ph.D. Thesis, Technische Universität München, Munich, Germany, 2013. [Google Scholar]
- Khodadadi, A.; Wen, J.; Heidari, A.; Wang, C. Numerical modeling of deflagration to detonation transition in inhomogeneous hydrogen/air mixtures. J. Loss Prev. Process Ind. 2017, 49, 722–730. [Google Scholar] [CrossRef]
- Zel’dovich, Y.B.; Librovich, V.B.; Makhviladze, G.M.; Sivashinskil, I. On the Onset of Detonation in a Nonuniformly Heated Gas. J. Appl. Mech. Tech. Phys. 1970, 11, 264–270. [Google Scholar] [CrossRef]
- Oran, E.S.; Gamezo, V.N. Origins of the deflagration to detonation transition in gas-phase combustion. Combust. Flame 2007, 148, 4–47. [Google Scholar] [CrossRef]
- Zhang, T.; Sun, W.; Ju, Y. Multi-scale modeling of detonation formation with concentration and temperature gradients in n-heptane/air mixtures. Proc. Combust. Inst. 2017, 36, 1539–1547. [Google Scholar] [CrossRef]
- Bradley, D. ’Hot spots’ and gasoline engine knock. J. Chem. Soc. Faraday Trans. 1996, 92, 2959–2964. [Google Scholar] [CrossRef]
- Bates, L.; Bradley, D.; Paczko, G.; Peters, N. Engine hot spots: Modes of auto-ignition and reaction propagation. Combust. Flame 2016, 166, 80–85. [Google Scholar] [CrossRef]
- Gu, X.; Emerson, D.R.; Bradley, D. Modes of reaction front propagation from hot spots. Combust. Flame 2003, 133, 63–74. [Google Scholar] [CrossRef]
- Sharpe, G.J.; Mark, S. Detonation ignition from a temperature gradient for a two-step chain-branching kinetics model. J. Fluid Mech. 2003, 476, 267–292. [Google Scholar] [CrossRef]
- Wang, C.; Qian, C.; Liu, J.; Liberman, M. Influence of chemical kinetics on detonation initiating by temperature gradients in methane/air. Combust. Flame 2018, 197, 400–415. [Google Scholar] [CrossRef]
- Liberman, M.A.; Kiverin, A.D.; Ivanov, M.F. On detonation initiation by a temperature gradient for a detailed chemical reaction models. Phys. Lett. A 2011, 375, 1803–1808. [Google Scholar] [CrossRef]
- Dai, P.; Chen, Z.; Chen, S.; Ju, Y. Numerical experiments on reaction front propagation in n-heptane/air mixture with temperature gradient. Proc. Combust. Inst. 2015, 35, 3045–3052. [Google Scholar] [CrossRef]
- Dai, P.; Chen, Z. Supersonic reaction front propagation initiated by a hot spot in n-heptane/air mixture with multistage ignition. Combust. Flame 2015, 162, 4183–4193. [Google Scholar] [CrossRef]
- Dai, P.; Chen, Z. Effects of temperature perturbation on direct detonation initiation. Proc. Combust. Inst. 2017, 36, 2743–2751. [Google Scholar]
- Qi, C.; Dai, P.; Yu, H.; Chen, Z. Different modes of reaction front propagation in n-heptane/air mixture with concentration non-uniformity. Proc. Combust. Inst. 2015, 36, 3633–3641. [Google Scholar] [CrossRef]
- Lee, J.H.S. The Detonation Phenomenon; Cambridge University Press: Cambridge, MA, USA, 2008. [Google Scholar]
- Deiterding, R. High Performance Computing and Communications; Yang, L.T., Rana, O.F., Di Martino, B., Dongarra, J., Eds.; Springer: Berlin, Germany, 2015; p. 916. [Google Scholar]
- Ng, H.D. The Effect of Chemical Reaction Kinetics on the Structure of Gaseous Detonations. Ph.D. Thesis, McGill University, Montreal, QC, Canada, 2013. [Google Scholar]
© 2020 by the authors. Licensee MDPI, Basel, Switzerland. This article is an open access article distributed under the terms and conditions of the Creative Commons Attribution (CC BY) license (http://creativecommons.org/licenses/by/4.0/).