Abstract
Aggregate piers have been widely used to increase bearing pressure and reduce settlement under structural footings. The ultimate bearing capacity of aggregate pier-reinforced ground is affected by the soil strength, replacement ratio of piles, and construction conditions. Various prediction models have been proposed to predict the ultimate bearing capacity. However, existing models have shown a broad range of bias, variation, and error, and they are at times unsuitable for practical design. In this study, multiple regression analysis was performed using field loading test results to predict the ultimate bearing capacity of ground reinforced by aggregate piers, and the number and type of the most efficient input variables were evaluated to build a robust predictive model. Accordingly, a multiple regression equation for predicting the ultimate bearing capacity was proposed, and a sensitivity analysis was conducted to identify the effect of input variables. In addition, a deep neural network was applied to estimate the ultimate bearing capacity. The optimal structure was selected on the basis of cross-validation results to prevent overtraining. Prediction errors for two approaches were evaluated and then compared with those of existing models.
1. Introduction
Soft soils, such as clay, have high compressibility and low shear strength. Thus, soft soils are considered unsuitable for construction, and ground improvement is required for construction on soft soils. In recent years, aggregate piers have been extensively used to increase bearing pressure and reduce settlement and lateral displacement under structural footings. Moreover, aggregate piers act as vertical drains and accelerate the consolidation of surrounding soft clay. The prediction of the ultimate bearing capacity of the improved ground is an important task for a proper design [1]. Since the 1970s, many researchers have aimed to develop a methodology based on plasticity theory [2], co-expansion theory [3,4], numerical methods [5,6], and empirical methods [7,8]. Predictive models are constantly being proposed and updated. Laboratory and field footing load tests on the aggregate pier have been conducted to investigate the behavior of the aggregate pier and its bearing capacity [9,10,11,12]. Numerical analysis was used to identify stress and strain acting on the piers and surrounding soil according to the load applied to the footing, and experimental results were used to prove the numerical analysis. Ambily and Gandhi [13] performed numerical analysis to simulate the behavior of a stone column, and it was verified by comparison with the experimental results. Hanna et al. [14] presented a numerical model to simulate the performance of a single stone column and groups of stone columns installed in soft clay. Mohanty and Samanta [15] studied the behavior of stone columns through a laboratory test and numerical study. Algin and Gumus [16] performed a three-dimensional numerical modeling of an aggregate pier system considering the installation effects. In addition, Etezad et al. [17] presented an analytical model to predict the bearing capacity of soft soil reinforced with stone columns, and the proposed model was validated via the laboratory and numerical results. Stuedlein and Holtz [18] evaluated the accuracy of existing bearing capacity models using 30 footing load tests with various field conditions and noted that existing models have shown a broad range of bias, variation, and error. The prediction errors of existing models were frequently extensive and unsuitable for practical design. Therefore, these authors proposed a modified ultimate bearing capacity model, and the prediction accuracy was considerably better than existing models. However, the ultimate bearing capacity models were modified using the relationship between the undrained shear strength and bearing capacity factor (or cavity expansion factor): this relationship was derived from the load test results of a single aggregate pier with a high area replacement rate (0.9–1.0), and the prediction error of the ultimate bearing capacity was larger for groups of aggregate piers than for a single aggregate pier. They also proposed a multiple linear regression (MLR) model based on 29 load tests, and it showed favorable performance. However, there was no evaluation of the input variables selection, and the verification was conducted for only one independent load test. Fattah et al. [12] performed statistical analysis using the Statistical Package for the Social Sciences (SPSS), and proposed a regression equation to predict the bearing capacity. However, they also did not consider the effect of the input variables selection, and the validation with independent data was not performed. Additionally, although each input variable may have a different nonlinear relationship with the bearing capacity, both studies considered the same equation type of input variables (exponential or power). In recent years, using artificial intelligence (AI) techniques to address problems in civil engineering has amplified [19,20,21]: the artificial neural network (ANN) is an AI technique that is applied to estimate ultimate bearing capacity [22,23]. ANN is known as a “black box model” because explaining the weights/parameters of a network is infeasible, and it has disadvantages, such as overfitting and vanishing gradient problems. However, the deep neural network (DNN) was developed to overcome these disadvantages and has become popular given its unprecedented success in various machine learning tasks.
In this study, MLR was performed considering the number and combination of various input variables to build a robust predictive model of the ultimate bearing capacity of aggregate pier-reinforced clay. A total of 37 load test data were used for modeling: 30 load tests were adopted from [18], and 7 load tests were newly added. The optimal number of input variables and their equation forms were selected through the results of leave-one-out cross-validation. As a result, the final MLR model was proposed using all load test data with the selected conditions, and a sensitivity analysis was also performed to investigate the influence of each input variable. In addition, a DNN was applied to the same load test database, and an optimal learning structure was selected considering the error of the cross-validation. In conclusion, the prediction results are compared with existing MLR models, and the relevance of these results is demonstrated.
2. Theoretical Background
2.1. Bearing Capacity of Aggregate Pier Reinforced Clay
The configuration of footings that rest on aggregate pier-reinforced soil is categorized into four general designations, as illustrated in Figure 1.
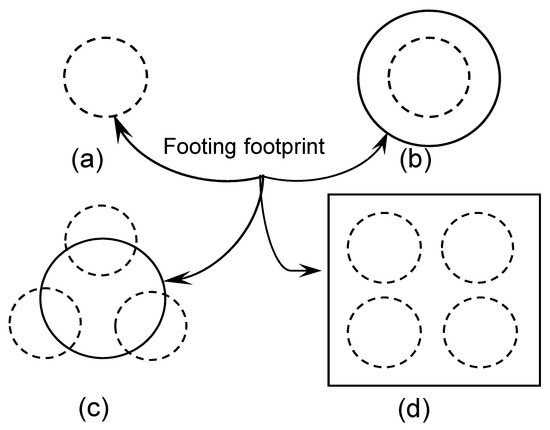
Figure 1.
Common aggregate pier configurations for spread footings: (a) single isolated pier, (b) intermediate single pier, (c) intermediate group of piers, and (d) group of piers (Stuedlein and Holtz [18]).
Aggregate piers under a vertical compressive load transmit the load to the surrounding soil through side friction or lateral confinement. Previous research on the bearing capacity of aggregate pier ground improvements has largely focused on the failure modes of a single pier, and the failure modes of a pier are different under loading and pier conditions. The failure modes of homogeneous soft soil reinforced with aggregate pier are classified into three modes and are exhibited in Figure 2.
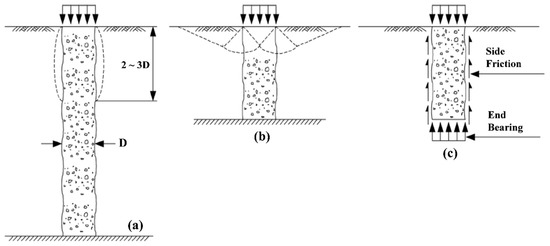
Figure 2.
Failure Modes of individual columns: (a) bulging failure, (b) shear failure, and (c) punching failure (after Barkdale and Bachus [6]; Kim and Lee [9]).
Bulging failure occurs when the pile length is greater than two–three times the pile diameter, as displayed in Figure 2a, and shear failure likely occurs with short piles, which are supported by firm-bearing strata as presented in Figure 2b. In particular, floating aggregate piers with slenderness ratios of less than 3 fail by plunging, as illustrated in Figure 2c. Various models have been proposed to predict the ultimate bearing capacity in accordance with the failure modes: these models were summarized in [9,24]. As another approach to predict bearing capacity, Stuedlein and Holtz [18] performed MLR modeling to estimate the ultimate bearing capacity of aggregate pier-reinforced clay expressed as
where Srp is the slenderness ratio of an aggregate pier, ar is the area replacement ratio, df is the depth of footing embedment, and τmp is the matrix soil shear mass participation factor defined as the ratio of su to ar.
2.2. Multiple Regression Analysis and Cross-Validation
MLR is a statistical technique used to identify and model the relationship between two or more independent variables and a dependent variable by fitting a linear equation to the observed data. If the data are in a linear relationship, the MLR of the observations for the independent variables (xi for i = 1, 2,..., n) can be expressed as
where ε and β0 are the error of prediction and intercept, respectively, and β1, β2, …, βn are the regression coefficients, which are the slopes in the MLR equation. In MLR, if x0 is set to 1, considering the constant term of the MLR, Equation (2) can be simply expressed using a matrix as follows:
where is the matrix for the independent variables with a size of m by , is the matrix of regression coefficients with a size of by 1, and is a matrix for the dependent variables with a size of m by 1. Typically, the regression coefficients of an MLR are estimated by the least squares method, and can be obtained by calculating the matrix as
Although there can be various independent variables for a prediction, the MLR is complicated to account for all the independent variables, and some independent variables may not have a substantial effect on the outcome prediction (described in more detail below).
2.3. Deep Neural Network
An ANN is a system for simulating a network of neurons that comprise a human brain for a computer to learn things and make decisions in a human-like manner. Rosenblatt [25] first proposed an ANN model that learns the weight of connection based on the concept of artificial neurons. In the initial model, learning is possible only when the learning object is classified into a linear model, and there is a disadvantage that the amount of calculation is rapidly increased according to the size of the neural network. These disadvantages can be solved by using the backpropagation algorithm developed by [26], and the multilayer neural network that uses the nonlinear activation functions. An ANN with several hidden layers is called a DNN, and the structure of an existing multilayer neural network and DNN is the same. However, various optimization methods are used to overcome the disadvantages of existing multilayer neural networks in a DNN. A limitation of the existing multilayer neural network is the overfitting (i.e., overtraining) problem, that is, predicting the data used for training is accurate, but the accuracy for new data excluded in training is very low because only the training data are learned excessively. Hinton et al. [27] demonstrated that the overfitting problem can be reduced and several problems with backpropagation can be solved when performing proper initialization through a restricted Boltzmann machine (RBM), which is the method for setting the initial value of the weights. More recently, it was discovered that one could train deep supervised nets by proper initialization, just large enough for gradients to flow well and activations to convey useful information [28]. Another limitation of the conventional backpropagation algorithm is the vanishing gradient problem which is where the gradients vanish as the activation functions are repeatedly used between the layers. This problem is not a fundamental problem with neural networks, and it depends on the choice of the activation function. Figure 3 shows the activation functions commonly used in neural networks.

Figure 3.
Activation functions in neural networks; (a) sigmoid, (b) hyperbolic tangent, and (c) rectified linear unit (ReLU).
The activation function that is typically used in the ANN is a sigmoid function, and the vanishing gradient problem occurs because the derivative value is smaller than 1, and these small gradients are multiplied during backpropagation. This problem is aggravated with the increase in the number of layers in the architecture, and the optimization performance may deteriorate given the difficulty in modifying the weights [29]. Afterward, a hyperbolic tangent activation function that extends the sigmoid function range from −1 to 1 has been proposed but a vanishing gradient problem remains. To overcome this problem, Nair and Hinton [30] proposed a rectified linear unit (ReLU) function that treats all values as 0 when x is less than 0 and uses x as a value that is larger than 0. ReLU is currently the most frequently used activation function in the DNN because it can overcome the disadvantages of sigmoid function and can also be effective in alleviating the overfitting problem.
2.4. Cross-Validation
The performance of the proposed model can be confirmed through the estimation error of the model. If the MLR is established using the entire data, the performance for prediction may be relatively favorable, but predicting the new data may be less accurate. Therefore, the independent data validation must be conducted to establish a robust prediction model, and leave-one-out cross-validation is a suitable technique for evaluating the error of a given model by sequentially excluding samples in the dataset used to derive the model to produce greater reliability in the estimate [31]. Leave-one-out cross-validation is a technique for generating a prediction formula through all the data except for one sample, as shown in Figure 4, and a prediction is made for that sample.
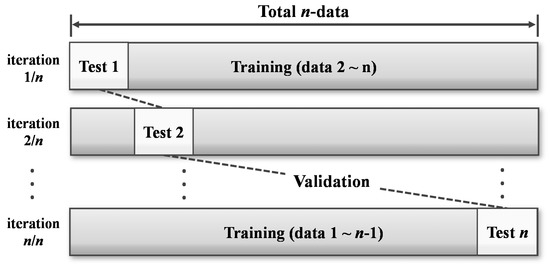
Figure 4.
Leave-one-out cross-validation.
This process is repeated for all samples, and the performance of the model is evaluated by an average estimation error. By estimating the error through independent data, further reliable prediction error estimation is feasible, and the resulting model can be more robust for new conditions [32].
2.5. Comparison with Existing Modeling Techniques
Previously, several studies have been conducted for predicting bearing capacity using MLR or AI. Although the same data set is used, the performance of the model may differ depending on the modeling technique. This study has some differences in modeling approaches from previous studies in order to improve the accuracy and robustness of the prediction model, and they are depicted in Figure 5.
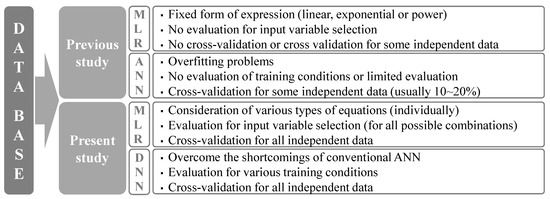
Figure 5.
Comparison of modeling approaches between previous and present studies.
The accuracy of the prediction model can be different depending on the selection of input variables, and its effect should be evaluated to establish the optimal prediction model. Additionally, if the independent variables have a nonlinear relationship with the dependent variable, a suitable relationship must be identified considering the nonlinear function, such as second- or third-order polynomial, exponential, and logarithm functions. However, these effects were rarely considered in MLR modeling in most previous studies. The commonly used independent variable selection methods include forward selection, backward elimination, and stepwise methods. However, even if the input variables are selected by these variable selection methods, the optimal input variables for MLR are not always selected. In addition, if there is a multicollinearity among the independent variables, another model may be selected without analyzing the optimal prediction model. Helsel and Hirsch [33] reviewed the existing variable selection methods, and pointed out their disadvantages. They noted that there are many advantages in selecting a suitable model by evaluating all combinations of independent variables after making all possible models. Therefore, in this study, MLR was used for the basic regression equation, and nonlinearity with dependent variables is considered by adding various variable forms, such as x2, 1/x, ln(x), and . In particular, to select the appropriate number of independent variables, the number of independent variables in the MLR equation was set to three, four, and five, and the accuracy of the model was evaluated considering all combinations of independent variables. The number of input variables and their equation types were selected through the results of cross-validation, and the coefficients of the final model were re-estimated using all data. Finally, the multicollinearity between the input variables has been evaluated to confirm the suitability of the selected variables.
As an artificial intelligence technique, a DNN was applied to overcome the shortcomings of the conventional ANN. In DNN training, how to deal with underfitting or overfitting is very important. However, the performance of a model may differ depending on the data splitting, especially when the data size is small. Unfortunately, there is no standard way to determine the structure of a model (in terms of the number of hidden layers and nodes, batch size, etc.). Therefore, various training conditions were evaluated to determine an optimal structure, and the structure with the minimum cross-validation error was selected as the optimal structure.
3. Results and Discussion
3.1. Load Test Database
Stuedlein [34] collected 58 results of load tests on aggregate piers and discussed that such data should fulfill several criteria to form a reliable database for statistical analysis. These criteria mainly include: adequate soil characterization, adequate description of load test and pier geometry, uniformity of the soil, proper shear response of the matrix soil, loading in a rapid manner, and the possibility of bearing capacity extrapolation from the measured displacements. Consequently, the 30 individual load tests that satisfied the previous criteria were selected to analyze the ultimate bearing capacity by Stuedlein and Holtz [18]. Recently, Bong et al. [35] added seven new load test data by [36]: these additional data satisfied the same criteria for updating a load test database. Accordingly, 37 footing loading tests were used for the application of MLR and DNN in this study, as summarized in Table 1.

Table 1.
Summary of footing load test database.
The footings consisted of 17 square footings and 21 circular footings. The aggregate pier lengths, Lp, ranged from approximately 2.3 to 14 m with diameters, B, ranging from 0.3 to 1 m. The replacement ratio for the 16 SPs (single isolated pier) ranged from 95% to 122%, whereas 15 footing load tests were performed on ISPs (intermediate single pier), IGPs (intermediate group of piers), and GPs (group of piers) with ar ranging from 16% to 47%.
3.2. Estimation of Bearing Capacity Using Multiple Regression Analysis
In the existing models for ultimate bearing capacity, su and ar considerably influenced the prediction of the ultimate bearing capacity. Therefore, two parameters and their combinations are considered as input variables, and the construction conditions and shape factor of the aggregate pier were additionally considered as input variables. To consider the nonlinear relationship between the independent and the dependent variables in the multiple regression analysis, various types of input values were considered given frequently used parameter types, as listed in Table 2.

Table 2.
Type of the input variables in the multiple linear regression (MLR).
The numbers of input variables in the MLR were set to three, four, and five to find an efficient prediction equation, and the combinations of input variables were generated in accordance with the following number of input variables: 5984 (34C3), 46,376 (34C4), and 278,256 (34C5). Then, the leave-one-out cross-validation was performed for all combinations of input values to evaluate the prediction error. From the cross-validation results, the top three input variable combinations with the smallest mean absolute error (MAE) were selected in accordance with the number of input variables and are summarized in Table 3. Figure 6 presents a comparison of the observed and the predicted ultimate capacity for the best models in accordance with the number of input variables.

Table 3.
Estimation of the prediction error by cross-validation.
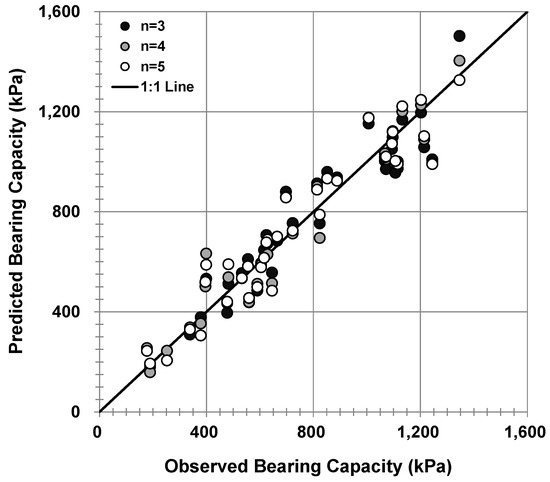
Figure 6.
Comparison of predicted and observed ultimate bearing capacity by cross-validation.
Although a slight difference was observed in prediction accuracy depending on the number of input variables, most of them agreed well with the observed ultimate bearing capacity, and the lowest MAE was obtained when four input variables were used. Therefore, the final regression equation used four selected input variables (, ,, and ) and all load test data were used to estimate the coefficients of the regression equation. The functional form of the best-fitting bearing capacity model is expressed as
where the units of su and df correspond to kPa and m, and the units of ar and Sr are the number, which is a dimensionless derived unit. If a high correlation occurs between the independent variables in the multiple regression calculation, then multicollinearity problems may occur, thereby causing problems in the reliability of the regression coefficient estimation. Therefore, the multicollinearity between the parameters was evaluated through a variance inflation factor (VIF), where VIF = 1 / (1 − R2), and R2 is the coefficient of determination. A VIF that is greater than approximately 5 indicates the presence of potential interdependence [37]. The standard error and VIF for each parameter are summarized in Table 4.

Table 4.
Summary statistics for the proposed MLR model.
The VIF value for all variables was less than 3. Therefore, the estimates of the fitted coefficients were considered appropriate. Figure 7 shows the comparison between the observed and predicted values of bearing capacity using the proposed MLR equation.
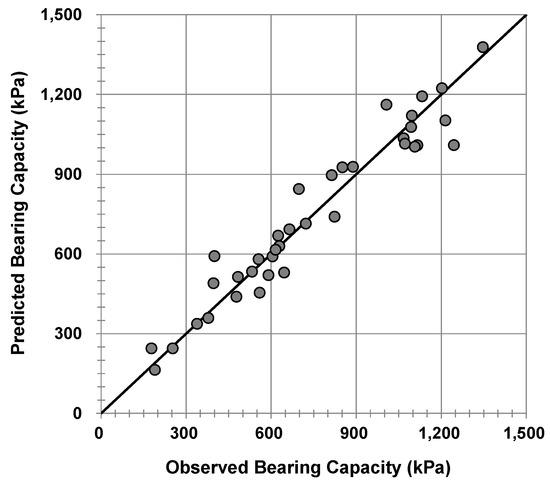
Figure 7.
Comparison of the observed and the predicted ultimate bearing capacity by the proposed MLR equation.
The MAE, bias, and coefficient of variation (COV) in bias for the proposed MLR equation were 61.4 kPa, 1.000, and 12.4%, respectively, and the predictions of the proposed MLR model coincide well with the observed ultimate bearing capacity.
Sensitivity analysis was performed to evaluate the influence of each input variable on the bearing capacity prediction. There are generally two types of sensitivity analysis: global sensitivity analysis and local sensitivity analysis, and the global sensitivity analysis was performed through Monte Carlo simulations because this helps gain an overall vision of the system, which is especially useful for distinguishing a significant parameter from insignificant input parameters [38]. The range of each variable was estimated through the database in Table 1; su ranged from 12 to 100 kPa, ar ranged from 0.16 to 1.22, df ranged from 0 to 0.61 m, and Sr ranged from 2.0 to 26.3, and their distributions were assumed to be uniform. Although Sr is calculated as the ratio of Lp and dp, Sr was directly used in the sensitivity analysis because if Lp and dp are used for Sr, the range of Sr is overestimated in comparison with the actual range. From the simulation results, Spearman rank correlations were estimated, and their tornado diagram is shown in Figure 8.
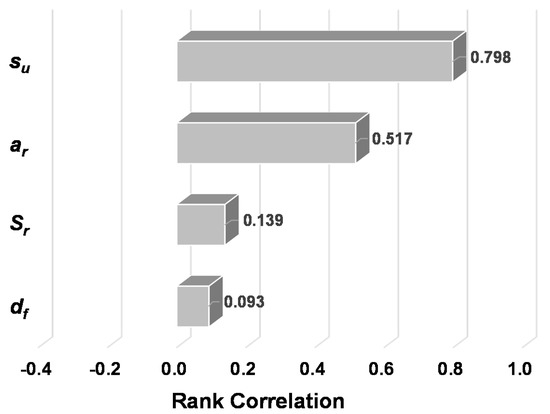
Figure 8.
Tornado diagram for the influence of the variables in the MLR model.
The tornado diagram exhibits the influence of the input variables on the bearing capacity, and su is the most influential variable in predicting the bearing capacity. The other variables were found to influence the bearing capacity in the order of ar, Sr, and df. The rank correlations of input variables have positive values, thus indicating a positive relationship with the bearing capacity.
3.3. Estimation of Bearing Capacity Using DNN
To utilize an AI for predicting the bearing capacity, a DNN was applied to the same load test database. Overfitting (or overtraining) is a major problem in neural networks, and training conditions, such as the number of hidden layers, nodes, and epochs, also influence the prediction accuracy. The prediction accuracy for training data could be increased by adding hidden layers or increasing epoch values in the DNN. However, this did not lead to improving the prediction accuracy for the test data, but the prediction accuracy could be reduced due to the overfitting. Figure 9 shows the comparison of the observed and the predicted ultimate bearing capacity for cross-validation and all data in the DNN when the training is performed to minimize only the MAE for the training data.
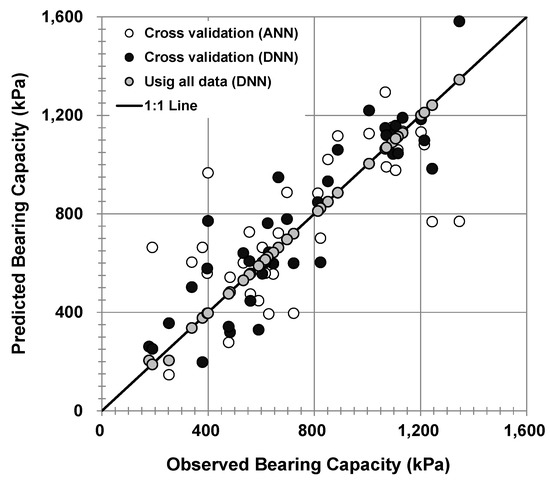
Figure 9.
Comparison of the predicted and the observed ultimate bearing capacity by the deep neural network (DNN) without considering cross-validation error.
The predicted ultimate bearing capacity using all data in the DNN was found to be nearly the same as the observed values with an MAE of 3.4 kPa. However, when the same learning conditions were applied for cross-validation, the predicted values showed large errors: MAE, bias, and COV in bias were 119 kPa, 1.01, and 29.2%, respectively. As described previously, the reason was that, although the prediction errors for the training data were reduced by adding hidden layers and increasing the epoch values, the prediction for the new condition had a large error due to the overfitting. The same process was applied to the ANN to compare the difference between the ANN and DNN for the overfitting problem. When using all data, the MAE for the ANN was 2.9 kPa, almost equal to the DNN, but the MAE, bias, and COV in bias for the cross-validation were 169 kPa, 1.03, and 35.7%, respectively, which were very large compared with the DNN. This means that the overfitting problem can occur significantly in the ANN, and that the DNN is better for predicting new data by compensating for the overfitting problem of the ANN.
However, selecting an optimal structure that considers cross-validation errors is still crucial for a robust prediction of bearing capacity for new conditions, and the leave-one-out cross-validations were performed for various training conditions (324 cases), as summarized in Table 5.

Table 5.
Training conditions for the deep neural network.
Seven variables excluding the ultimate bearing capacity in Table 1 were available as raw input data, but adding various forms of input values in advance could be more effective for training. Therefore, new input variables for combining su and ar were added, and 10 variables were used as input data. Raw data were comprised of attributes with varying scales, and data preprocessing plays a very important part in many deep learning algorithms. Normalization is required so that all the inputs are at a comparable range, and many methods work best after the data have been normalized or standardized in practice. Therefore, min–max normalization was applied to rescale the raw data as follows:
For the leave-one-out cross-validation, 36 load test data were used for training, and the excluded 1 load test datum was used for verification. This procedure was performed on all 37 data, and the prediction performance was evaluated through the average MAE. Figure 10 displays the change in MAE according to the number of epochs for the training and validation of the data.
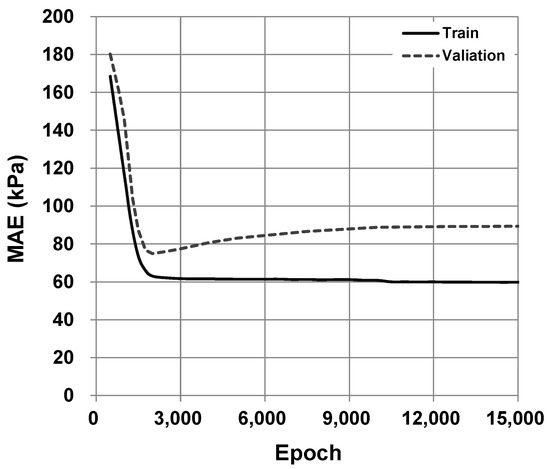
Figure 10.
Change in accuracy according to epochs for training and cross-validation (hidden layer = 2, node = 10, batch size = 20).
The performance on the train set was improved dramatically and continuously until approximately 1800 epochs, whereas the performance of the validation set improved to certain epochs and then degraded due to the overfitting.
The results of the analysis indicated that a trained model with two hidden layers with a node of 10, batch size of 20, drop rate of 0, and epoch of 2000 provides the most accurate result. Therefore, the final deep learning model was established using all data under the above-mentioned learning conditions. The comparisons of the observed and the predicted ultimate bearing capacity for the cross-validation and all data in the DNN considering the optimal structure are shown in Figure 11.
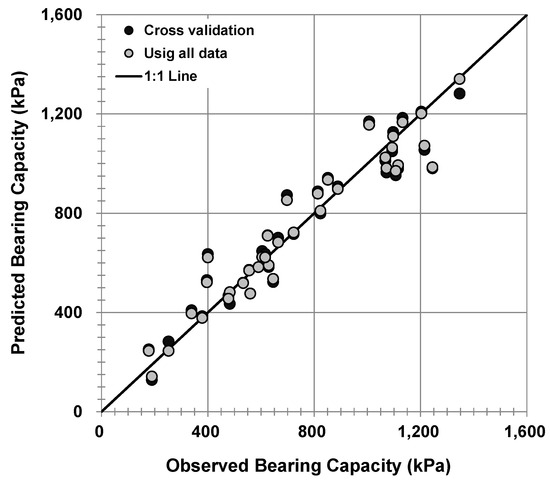
Figure 11.
Comparisons of predicted and observed ultimate bearing capacity by the DNN considering the cross-validation error.
The MAE, bias, and COV in bias for the cross-validation results of the DNN were 74.9 kPa, 0.999, and 16.0%, respectively, and the performance of the deep learning model was slightly improved because all data were used for deep learning: the MAE and bias were 62.1 kPa and 0.999, respectively. Although the MAE of the final deep learning model increased by considering the cross-validation, the cross-validation error decreased by 46.6 kPa, indicating that a robust prediction is feasible.
3.4. Comparison with Existing Models
To compare with existing results, the leave-one-out cross-validation was performed for the MLR equation proposed by [18]; here, the same variables used in their model, used as input variables, and the coefficients were estimated by the least squares method. The results were compared with the cross-validation results using the proposed MLR equation and DNN (Figure 12).
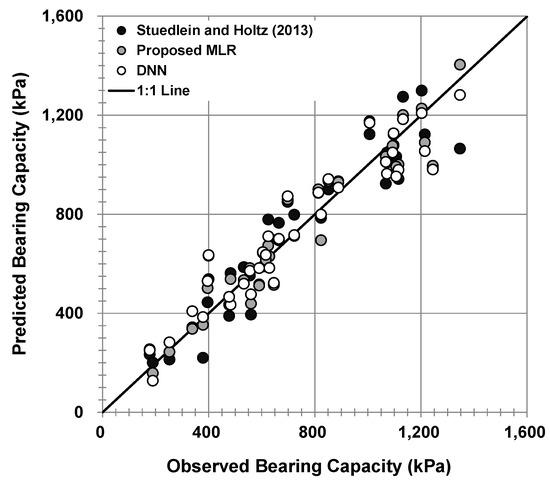
Figure 12.
Comparison of the predicted and the observed ultimate bearing capacity by leave-one-out cross-validation.
In the leave-one-out cross-validation, the MLR equation, which consists of the variables proposed by [18] showed the highest MAE of 89.7 kPa and bias of 1.023. The DNN model showed a favorable performance for new data with an MAE of 74.9 kPa and bias of 0.999 as the optimal structure was selected considering the cross-validation results. The MLR equation, which consists of the variables selected in this study, showed the best performance among the three models with the lowest MAE of 70.5 kPa and bias of 1.003. The evaluation of the error through cross-validation is crucial for evaluating the performance of the prediction model because the accuracy of the prediction model is evaluated based on the independent data, and the MLR equation that uses four input variables proved to be able to predict more accurate ultimate bearing capacity. The comparison of the observed and the predicted ultimate bearing capacity by the three models established with all the load test data is shown in Figure 13, and the statistical results of these comparisons are summarized in Table 6.
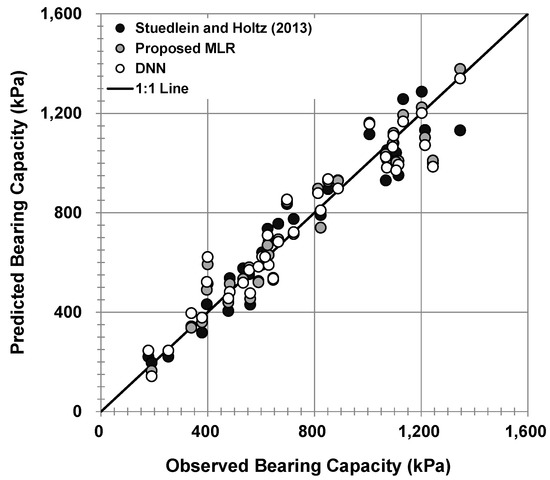
Figure 13.
Comparison of the observed ultimate bearing capacity to that of the predicted using three models.

Table 6.
Performance of prediction methods for ultimate bearing capacity.
On the basis of the MAE, the performance ranking for the final models in which all load test data were used showed the same rank as the performance that considers cross-validation. As a result, the proposed MLR demonstrates high performance in predicting the ultimate bearing capacity of aggregate pier-reinforced clay as it has the lowest MAE, bias, and COV in bias.
Therefore, the ultimate bearing capacity could be predicted effectively with only four parameters. Moreover, it could improve the prediction accuracy and reduce the predictive variability in comparison with the existing MLR equation. The DNN was also applicable for the ultimate bearing capacity prediction by selecting the optimal structure considering the cross-validation. However, the performance was inferior to the proposed MLR, and model-updating might be a time-consuming task because it requires selecting a new optimal structure. By contrast, the MLR equation could easily improve by updating the coefficients considering the new data.
4. Conclusions
In this study, a multiple regression analysis and DNN were applied to predict the ultimate bearing capacity of aggregate pier-reinforced clay. For a robust prediction of the ultimate bearing capacity of aggregate pier-reinforced clay in the MLR, the most efficient input variables were selected through leave-one-out cross-validation. Based on the results of this study, the following conclusions were drawn:
- (1)
- To select the effective input variables in the MLR, the prediction errors according to the number of input variables and their various equation forms were evaluated through the leave-one-out cross-validation. Accordingly, the ultimate bearing capacity was effectively predicted by using only four input variables (, ,, and ) with an MAE of 70.5 kPa and bias of 1.003 in cross-validation;
- (2)
- The final MLR equation was proposed using all load test data, and the MAE, R2, bias, and COV in bias were 61.4 kPa, 0.93, 1.000, and 12.4%, respectively. Therefore, the effective prediction of the ultimate bearing capacity was feasible using the proposed MLR equation, thereby resulting in improved prediction accuracy and reduced variability;
- (3)
- Global sensitivity analysis was performed to evaluate the influence of each input variable, and su has the highest influence on the bearing capacity prediction. The other variables were found to influence bearing capacity in the order of ar, Sr, and df. In addition, four input variables demonstrated a positive correlation with bearing capacity;
- (4)
- A DNN was applied to estimate the ultimate bearing capacity, and various training conditions were examined for accuracy to identify the optimal DNN structure. The optimal DNN model was suggested through the cross-validation error evaluation and showed favorable performance in predicting the ultimate bearing capacity with an MAE of 62.1 kPa and bias of 0.999;
- (5)
- The proposed MLR equation showed the best performance in the three models and could be applied to single and group aggregate piers. Thus, the proposed MLR equation could be recommended as a robust model for predicting the ultimate bearing capacity of aggregate pier-reinforced clay.
Author Contributions
Funding acquisition, T.B.; methodology, T.B.; validation, S.-R.K. and B.-I.K.; writing—original draft preparation, T.B. and S.-R.K.; writing—review and editing, B.-I.K. All authors have read and agreed to the published version of the manuscript.
Funding
This work was supported by the National Research Foundation of Korea (NRF) grant funded by the Korean government (MSIT) (No. 2019R1C1C1010053).
Conflicts of Interest
The authors declare no conflict of interest.
References
- Kitazume, M. The Sand Compaction Pile Method; Taylor and Francis: London, UK, 2005. [Google Scholar]
- Greenwood, D.A. Mechanical Improvement of Soils Below Ground Surface. In Proceedings of the Ground Engineering Conference, London, UK, 16 June 1970; pp. 11–22. [Google Scholar]
- Vesic, A.S. Expansion of cavities in infinite soil mass. J. Soil Mech. Found. Div. 1972, 98, 265–290. [Google Scholar]
- Hughes, J.M.O.; Withers, N.J.; Greenwood, D.A. A Field Trial of the Reinforcing Effect of a Stone Column in Soil. Geotechnique 1975, 25, 31–44. [Google Scholar] [CrossRef]
- Brauns, J. Initial bearing capacity of stone columns and sand piles. In Proceedings of the Symposium on Soil Reinforcing and Stabilizing Techniques in Engineering Practice, Sydney, Australia, 16–19 October 1978; pp. 477–496. [Google Scholar]
- Barksdale, R.D.; Bachus, R.C. Design and Construction of Stone Columns; Federal Highway Administration: Washington, DC, USA, 1983; p. 28.
- Mitchell, J.K. Soil improvement—State-of-the-art report. In Proceedings of the 10th Soil Mechanics and Foundation Engineering, Stockholm, Sweden, 15–19 June 1981; pp. 509–565. [Google Scholar]
- Bergado, D.T.; Lam, F.L. Full scale load test of granular piles with different densities and different proportions of gravel and sand in the soft Bangkok clay. Soils Found. 1987, 27, 86–93. [Google Scholar] [CrossRef]
- Kim, B.I.; Lee, S.H. Comparison of bearing capacity characteristics of sand and gravel compaction pile treated ground. KSCE J. Civ. Eng. 2005, 9, 197–203. [Google Scholar] [CrossRef]
- Ali, K.; Shahu, J.T.; Sharma, K.G. Behaviour of Reinforced Stone Columns in Soft Soils: An Experimental Study. In Proceedings of the Annual Conference of the Indian Geotechnical Society, Mumbai, India, 16–18 December 2010; pp. 625–628. [Google Scholar]
- Black, J.A.; Sivakumar, V.; Bell, A. The settlement performance of stone column foundations. Geotechnique 2011, 61, 909–922. [Google Scholar] [CrossRef]
- Fattah, M.Y.; Al-Neami, M.A.; Al-Suhaily, A.S. Estimation of bearing capacity of floating group of stone columns. Eng. Sci. Technol. Int. J. 2017, 20, 1166–1172. [Google Scholar] [CrossRef]
- Ambily, A.P.; Gandhi, S.R. Behavior of Stone Columns Based on Experimental and FEM Analysis. J. Geotech. Geoenviron. Eng. 2007, 133, 405–415. [Google Scholar] [CrossRef]
- Hanna, A.M.; Etezad, M.; Ayadat, T. Mode of failure of a group of stone columns in soft soil. Int. J. Geomech. 2013, 13, 87–96. [Google Scholar] [CrossRef]
- Mohanty, P.; Samanta, M. Experimental and Numerical Studies on Response of the Stone Column in Layered Soil. Int. J. Geosynth. Ground Eng. 2015, 1, 27. [Google Scholar] [CrossRef]
- Algin, H.M.; Gumus, V. 3D FE Analysis on Settlement of Footing Supported with Rammed Aggregate Pier Group. Int. J. Geomech. 2018, 18, 04018095. [Google Scholar] [CrossRef]
- Etezad, M.; Hanna, A.M.; Ayadat, T. Bearing Capacity of a Group of Stone Columns in Soft Soil. Int. J. Geomech. 2015, 15, 04014043. [Google Scholar] [CrossRef]
- Stuedlein, A.W.; Holtz, R.D. Bearing Capacity of Spread Footings on Aggregate Pier Reinforced Clay. J. Geotech. Geoenviron. Eng. 2013, 139, 49–58. [Google Scholar] [CrossRef]
- Asteris, P.; Nozhati, S.; Nikoo, M.; Cavaleri, L.; Nikoo, M. Krill herd algorithm-based neural network in structural seismic reliability evaluation. Mech. Adv. Mater. Struc. 2019, 26, 1146–1153. [Google Scholar] [CrossRef]
- Kulkarni, P.S.; Londhe, S.N.; Deo, M.C. Artificial Neural Networks for Construction Management: A Review. Soft Comput. Civ. Eng. 2017, 1, 70–88. [Google Scholar]
- Shahri, A.A. Assessment and Prediction of Liquefaction Potential Using Different Artificial Neural Network Models: A Case Study. Geotech. Geol. Eng. 2016, 34, 807–815. [Google Scholar] [CrossRef]
- Mohammadizadeh, M.; Asadi, M. Estimation of Bearing Capacity and Settlement of Spread Footing over Stone Column Reinforced clay Using Fuzzy Models and Artificial Neural Networks. Indian J. Fundam. Appl. Life Sci. 2015, S2, 3038–3050. [Google Scholar]
- Das, M.; Dey, A.K. Prediction of Bearing Capacity of Stone Columns Placed in Soft Clay Using ANN Model. Geotech. Geol. Eng. 2018, 36, 1845–1861. [Google Scholar] [CrossRef]
- Aboshi, H.; Suematsu, N. Sand compaction pile method state-of-the-art paper. In Proceedings of the 3rd International Geotechnical Seminar on Soil Improvement Methods, Nanyang, Singapore, 27–29 November 1985; pp. 1–12. [Google Scholar]
- Rosenblatt, F. The perceptron: A probabilistic model for information storage and organization in the brain. Psychol. Rev. 1958, 65, 386–408. [Google Scholar] [CrossRef]
- Werbos, P. Beyond Regression: New Tools for Prediction and Analysis in the Behavioral Sciences. Ph.D. Thesis, Harvard University, Cambridge, MA, USA, 1974. [Google Scholar]
- Hinton, G.E.; Osindero, S.; The, Y.W. A fast learning algorithm for deep belief nets. Neural Comput. 2006, 18, 1527–1554. [Google Scholar] [CrossRef]
- Gloro, X.; Bengio, Y. Understanding the difficulty of training deep feedforward neural networks. In Proceedings of the 13th International Conference on Artificial Intelligence and Statistics, Sardinia, Italy, 13–15 May 2010; pp. 249–256. [Google Scholar]
- Hochreiter, S.; Bengio, Y.; Frasconi, P.; Schmidhuber, J. Gradient flow in recurrent nets: The difficulty of learning long-term dependencies. Field Guide to Dynamical Recurrent Neural Networks; IEEE Press: Piscataway, NJ, USA, 2001. [Google Scholar]
- Nair, V.; Hinton, G.E. Rectified linear units improve restricted boltzmann machines. In Proceedings of the 27th International Conference on Machine Learning, Haifa, Israel, 21–24 June 2010; pp. 807–814. [Google Scholar]
- Stone, M. Cross-validatory choice and assessment of statistical predictions. J. Roy. Statist. Soc. Ser. B 1974, 36, 111–147. [Google Scholar] [CrossRef]
- Arboretti Giancristofaro, R.; Salmaso, L. Model performance analysis and model validation in logistic regression. Statistica 2003, 63, 375–396. [Google Scholar]
- Helsel, D.R.; Hirsch, R.M. Statistical Methods in Water Resources; USGS: Reston, VA, USA, 2002.
- Stuedlein, A.W. Bearing Capacity and Displacement of Spread Footings on Aggregate Pier Reinforced Clay. Ph.D. Thesis, University of Washington, Settle, KY, USA, 2008. [Google Scholar]
- Bong, T.; Stuedlein, A.W.; Martin, J.P.; Kim, B.I. Bearing Capacity of Spread Footings on Aggregate Pier Reinforced Clay: Updates and Stress Concentration. Can. Geotech. J. 2019, 57, 717–727. [Google Scholar] [CrossRef]
- Martin, J.P. A Full-Scale Experimental Investigation of the Bearing Performance of Aggregate Pier-supported Shallow Foundation. Master’s Thesis, Oregon State University, Corvallis, OR, USA, 2018. [Google Scholar]
- Montgomery, D.C.; Runger, G.C. Applied Statistics and Probability for Engineers, 5th ed.; Wiley: New York, NY, USA, 2010. [Google Scholar]
- Bassaganya-Riera, J. Computational Immunology: Models and Tools; Elsevier/Academic Press: Waltham, MA, USA, 2015. [Google Scholar]
© 2020 by the authors. Licensee MDPI, Basel, Switzerland. This article is an open access article distributed under the terms and conditions of the Creative Commons Attribution (CC BY) license (http://creativecommons.org/licenses/by/4.0/).