Article

A Reproducible Method for Growing Biofilms on Polystyrene Surfaces: Biomass and Bacterial Viability Evolution of Pseudomonas fluorescens and Staphylococcus epidermidis

1
BioTeC+-Chemical and Biochemical Process Technology and Control, Department of Chemical Engineering, KU Leuven, 9000 Gent, Belgium
2
Procter&Gamble, Newcastle Innovation Center, Newcastle NE12 9TS, UK
*
Author to whom correspondence should be addressed.
Appl. Sci. 2020, 10(13), 4544; https://doi.org/10.3390/app10134544
Submission received: 23 April 2020 / Revised: 12 June 2020 / Accepted: 23 June 2020 / Published: 30 June 2020
(This article belongs to the Section Applied Biosciences and Bioengineering)

Abstract

:
Since biofilm development represents a crucial issue within industrial, clinical and domestic sectors, innovative technologies/approaches (e.g., light technology for inactivation, antibiofilm coatings) are required to eradicate them. In this multidisciplinary scenario, protocols for the development of biofilms are necessary, particularly, in laboratories (not specialised in biofilm science) lacking in sophisticated devices for their growth. A protocol was developed for growing Pseudomonas fluorescens (Gram-negative) biofilms on wide, flat, polystyrene surfaces within 24 h. Several factors, such as inoculum level, area size and growth medium concentration, were investigated. Biofilm development was studied via viable cells and biomass quantification. A comparative analysis between kinetics and growth parameters, estimated using the Baranyi and Roberts model, was conducted at different inoculum levels (104 and 107 CFU/mL). The inoculum levels did not influence the final population within the 24-h-grown biofilms, but they influenced the total biomass development, which followed different kinetics. Confocal laser scanning microscopy confirmed that overnight growth allowed for development of a densely packed biofilm with its 3D structure. The developed protocol was validated for Staphylococcus epidermidis (Gram-positive). The present work is the first study to develop an easy-to-use protocol to obtain highly reproducible biofilms, on flat polystyrene surfaces, with no need for sophisticated technologies.

1. Introduction

Biofilms are bacterial communities that colonise different surfaces, both abiotic and biotic [1,2,3]. They produce extracellular polymeric substances (EPS) to adhere to interfaces and to create a chemically and physically protective barrier. The EPS, also referred to as the biofilm’s matrix, protects bacteria from desiccation and chemical agents (antiseptic, antibiotics) and it controls water retention [1,4]. The matrix is mainly composed of different biopolymers, proteins and lipids [4,5,6]. It contributes to the sorption and storage of nutrients and it is the place where many extracellular enzymatic reactions take place. Moreover, it keeps the microorganisms in tight contact with each other to facilitate quorum sensing (QS), and it contains genetic information as well, e.g., the extracellular DNA [5,7].
Pathogenic bacteria organised in biofilms are considered to be a major health concern [8,9,10,11,12]. Bacteria living in a biofilm are much more resistant to antibiotics than their planktonic form, leading to persistent infections [13,14]. They have been found in hospital settings, for instance on medical devices or implants (valves, stents, catheters), leading to infections and death [15]. Within the food chain and industry, they are responsible for contamination and cross-contamination of food products and therefore lead to outbreaks of foodborne diseases [11]. Moreover, their ubiquity on common surfaces in, e.g., kitchens (kitchen worktops, refrigerators), bathrooms (sinks, toilets) and offices (desks, keyboards), requires devising new disinfection strategies.
The study of biofilms is becoming more and more multidisciplinary. To define the different aspects of biofilms (structure, morphology, genetics), several methods/techniques are available in the literature. Even though many complex techniques are currently available to study biofilms (e.g., polymerase chain reaction, chromatography and advanced microscopy), the conventional techniques, e.g., viable cell counting and crystal violet (CV) assay, are still most commonly used. Viable cell counting is a microbiological technique used to quantify the number of colony-forming units (CFU) within the biofilm, while the CV assay is used to quantify the biomass using a dye that stains both the EPS and cells [16]. These techniques are easy-to-use and rapid, and they do not require expensive equipment, they are accessible in every microbiological lab.
Since recent decades have witnessed a huge growth in the number of publications concerning biofilms, having a reproducible method to grow biofilms is of the utmost importance. The current methods for growing biofilms are based on the usage of CDC reactors [12], flow cell systems [17], microwell plates [11,12], tubes and petri dishes [18]. CDC reactors and flow cells, such as microfluidic devices, are systems in which the nutrients and bacteria are always replenished through a feed flow; these devices allow the control of the feed rate, the pH and the concentration of nutrients. In contrast, biofilms grown in microwell plates, tubes, or petri dishes are batch systems. In the latter, a certain amount of nutrients and initial bacterial population are provided and only controlled at the beginning of the experiments. Thus, the medium in which the biofilms develop naturally undergoes changes in pH and nutrient concentration.
All methods for growing biofilms have advantages and drawbacks, but the choice of a method also depends on the natural biofilm growth conditions that are mimicked. The existing methods are characterised by different static or hydrodynamic conditions influencing the conditioning, attachment, colonization and detachment of the biofilm [19]. For instance, flow cells can mimic the condition of a piping system, while a tube can be representative of a temporary storage tanks in industries [20,21,22]. Literature is lacking biofilm growth protocols that are specifically designed to mimic growth on flat horizontal surfaces. Among the methods that are used to develop/seem to develop biofilms on a horizontal surface there are those employing CDC reactors and those using petri dishes and well plates. However, the formers require the laboratory to be equipped with CDC reactors and the latter do not prevent the biofilms from growing on the walls [11,19]. None of these methods are suitable to accomplish the requirements of growing the biofilms on a flat surface.
The first objective of this paper was the development of a robust, highly reproducible protocol for growing Pseudomonas biofilms on a flat polystyrene surface under static (hydrodynamic) conditions, by investigated different factors such as area, medium concentration, level of inoculum density. Viable plate counts, biomass quantification and confocal laser scanning microscopy (CLSM) were used to study the 24-h-grown dense biofilm. The second objective was to study the development of the biofilm in time in terms of both population density and total biofilm biomass. The Baranyi and Roberts (1994) model was fitted to the population density curves to determine the growth parameters. The third objective was to compare growth dynamics both in terms of viable cells and biomass obtained for biofilms growing with two different inoculum levels to better understand the influence of this factor on biofilms dynamics [23]. The fourth objective was to validate the protocol using a different bacterial strain. For this purpose, Staphylococcus epidermidis was chosen, as it has a different genus, Gram-nature, shape and EPS characteristics [24,25,26].
The choice of polystyrene (PS) was made based on the extensive use of this material in industry because of its low cost, durability and ease to be manufactured [27,28]. PS is largely employed in the medical industry and for biomedical applications, making it interesting for public health. It is also a polymer that is largely present in everyday life since, e.g., food containers, packaging and utensils are often made of PS. Secondly, the PS polymer constitutes a model material that is widely used in research for its inert characteristics and lack of surface chemistry. PS has recently been used in various studies concerning chemistry modification (grafting), ion implantation and nanoparticle coatings to understand microbial adhesion or to develop antimicrobial strategies [29]. Thirdly, the choice of PS was made because of its relevance in microbiological lab practices. It has been used as culture material for animal and human cells for more than 50 years, and nowadays it is commonly used for bacterial research activities [30]. The high optical clarity, the cheap cost and the thermoplastic characteristics make the material suitable for cell culture dishes and multiwell plates that are widely employed in every laboratory, pharmaceutical and hospital setting.
The genus Pseudomonas was chosen as a model microorganism because of its ability to easily form strong biofilms, which results in an increase of antibiotic and disinfectant resistance [13,14]. Pseudomonas includes several species, among them P. fluorescens, which is studied for its potential in industrial applications resulting from its biosurfactants production [31]. P. fluorescens is a biofilm former [32,33]. It is commonly studied to understand the complex process of biofilm maturation [34,35], as well as to develop techniques/technologies applicable for biofilm inactivation or removal [36]. In environmental microbiology, P. fluorescens has mainly been studied for its presence in soil and surface of plants [33]. Recent study has demonstrated that it can cause infections in mammalian hosts, as well [33]. Moreover, it is also relevant in food microbiology since it is one of the main microorganisms responsible for wastage of dairy and meat products [2,22,37,38,39]. Next to its relevance, P. fluorescens has been chosen for this study because it can be easily acquired and because it is categorised as biosafety level-1 (BSL-1), which means that it does not cause disease in healthy humans. The use of nuclear magnetic resonance, optical coherence tomography and other cutting-edge techniques to monitor biofilms creates the need to have reproducible biofilm protocols with BSL-1 bacteria. These facilities are often placed in laboratories where the biocontainment precautions are limited to BLS-1, for its safe, inexpensive and easy-to-keep maintenance. Additionally, S. epidermidis, which was used to validate the experimental method, is categorised as BSL-1. Moreover, the choice for this strain was based on the importance of the Staphylococcus genus for several fields. Staphylococcus spp. biofilms are extensively investigated in order to better understand the process of biofilm adhesion to surfaces by means of polysaccharide intercellular adhesin (PIA) in the context of infections at hospitals, public places and homes, and wastewater treatment plants [24,25,26].
The decision to develop highly reproducible biofilms on flat surfaces (without walls) was made with a variety of applications in mind. Studies that deal with the development of anti-biofilm coatings, sandwich structure coatings, photocatalytic surfaces or plasma grafting of surface for antibacterial applications need protocols to develop biofilms on surfaces with a large area, to test the functionality of the high-tech surfaces [40,41]. Moreover, in vitro applications such as the investigation of anti-biofilm strategies by employing novel technologies, e.g., plasma technology, light and ultrasound treatments are recommended to be performed on such flat surfaces to check the uniformity of the treatment [42]. The use of a wide area on which the biofilms are grown will aid to study the inactivation mechanisms after the treatment, facilitating the visualization and observation of the impact of the technology.
One of the main problems that microbiologists face in biofilm research is the lack of reproducibility in terms of the biomass and population density within biofilms. Distinct procedures for growing biofilms result in considerable differences, but even when using the same procedure, significant variation can exist between the biofilms that are formed. In this work, a new method to grow biofilms on a flat surface and defined area was developed. The standard method does not require sophisticated systems for biofilm growth, making it easy to be reproduced in every laboratory. Moreover, it mimics the contamination of surfaces within industries and healthcare settings. An optimal area, nutrient concertation and level of inoculum density for growing a strongly attached biofilm on a defined area (within 24 h) were found. Additionally, the investigation of the morphological features of 24-h-grown biofilms, following the selected conditions, was performed by CLSM.

2. Materials and Methods

2.1. Pre-Culture Preparation

Pseudomonas fluorescens (ATCC® 13525 culti-loops, Thermo Fisher Scientific, Waltham, United State), Gram-negative, was used as a model microorganism. It has been previously reported to produce biofilms [32]. The stock-cultures were prepared with 20% (v/v) glycerol (VWR International, Oud-Heverlee, Belgium) in Tryptic Soy Broth (TSB) (VWR International, Oud-Heverlee, Belgium) and were incubated at −80 °C. First, a streak plate on Tryptic Soy Agar (TSA) (VWR International, Oud-Heverlee, Belgium) was prepared and stored for 24h at 30 °C. Then, one colony from the before-mentioned plate was inoculated in 20 mL TSB using an inoculum sterile loop. This pre-culture was incubated at 25 °C while stirring (160 rpm) overnight.

2.2. Levels of Inoculum Density and TSB Concentrations

The pre-culture (109 CFU/mL) was diluted in TSB to reach several levels of inoculum density. The tested inoculum levels were specifically 104, 105, 106 and 107 CFU/mL. Overall, a standard TSB concentration of 30 g/L was used, except for Section 3.2, where TSB concentrations were 1.5, 3.0, 15.0 and 30.0 g/L. The different concentrations were prepared to check the optimal TSB concentration for biofilm growth.

2.3. Biofilms Growth on a Defined Area

Circles, having defined diameters, were previously marked on the bottom of the petri dishes. Diameters of 1.5, 2.0 and 3.0 cm were tested. A drop of 400 µL of a 107 CFU/mL suspension was placed in the centre of a sterile petri dish in polystyrene (50 mm diameter, 8 mm height, Simport, Canada). The drop was spread on the circular area, using an inoculum sterile loop, to cover completely the entire defined area. Closed petri dishes were left overnight in an incubator at a constant temperature of 25 °C to promote biofilms’ growth. Afterwards the biofilms were rinsed (Section 2.4) and, finally, the viable cells were quantified (Section 2.4.1) or optical density was measured using the crystal violet (CV) assay (Section 2.4.2).

2.4. Enumeration of the Viable Cells and Optical Density Measurments

After overnight growth, the biofilms were visible on the polystyrene surface. The excess of suspension was gently discarded, using a micropipette. The biofilms were, then, gently rinsed three times to remove planktonic cells with 3 mL of phosphate buffered saline (PBS tablet purchased from Sigma-Aldrich, St. Louis, Missouri, containing 137 mM NaCl, 2.7 mM KCl and 10 mM phosphate buffer) solution at pH 7.4. Afterwards, either the procedure for the viable cell enumeration, Section 2.4.1, or for the optical density measurement, Section 2.4.2, was performed.

2.4.1. Enumeration of Biofilm Population Density through Viable Cell Counts

After rinsing, 2 mL of PBS was added. Biofilms developed on the polystyrene were detached from the surface using a sterile cell scraper (Carl Roth, Germany). By using a micropipette, the solution was homogenised, and serial dilutions were prepared to plate them on TSA [43]. After 48 h of growth, the population density ln(N) was determined in CFU/cm2 and the natural logarithm of the population density per area was quantified as follows:
ln N = ln C · 2   mL · D V · A ,
where A represents the area of the biofilm, 2 mL is the volume of PBS added to the biofilm, D the dilution, V the volume of this dilution plated on the agar and C is the number of colonies that was counted. The natural logarithm is used for the enumeration of viable cells during the biofilm development to use the Baranyi and Roberts (1994) model [23]. Three, three to five, and 20 independent replicates were performed for experiments in Section 3.3 (where the influence of the inoculum level is studied), Section 3.4.1 (where the development of the biofilm in time is investigated) and Section 3.5 (where the reproducibility is assessed), respectively.

2.4.2. Biofilm Biomass Quantification through Optical Density Using Crystal Violet Assay

The total biomass, which includes live cells, dead cells and EPS within the biofilm, was quantified through the measurement of the optical density following the CV assay [16,44]. After rinsing three times with 3 mL of PBS to remove the unattached cells, 1.5 mL of a 0.046% (v/v) CV solution (CV stain HT90132, Sigma Aldrich, St. Louis, Missouri) in water was added into the petri dish containing the biofilm. The dye was left to stain the biofilm for 15 min. Afterwards, it was rinsed twice with 2 mL of PBS to remove the excess of dye and it was left to dry for 30 min. Then, 1.2 mL of acetic acid solution 33% (v/v) in water was added to dissolve the dye. 200 µL of the dyed acetic acid solution was transferred in each of three wells of a 96-well microtiter plate. The blank was performed following the same protocol with petri dishes not containing biofilms. The measured blanks were subtracted from the measurements even though the OD related to these blanks was negligible. The quantification of the biofilm biomass was performed by reading the optical density at 590 nm (OD590), using a VersaMax tunable microplate reader (Molecular devices, Berkshire, UK). A single replicate corresponded to the average value corresponded to three wells. The wavelength of 590 nm represents the absorption peak of the CV spectrum. Three, three to five, and ten independent replicates were performed for experiments in Section 3.1 (where the influence of inoculum level is studied), Section 3.4.2 (where the development of the biofilm in time is investigated) and Section 3.5 (where the reproducibility is assessed), respectively.

2.5. Confocal Laser Scanning Microscope

Confocal laser scanning microscopy (CLSM) images were acquired with a Nikon A1R confocal laser scanning microscope to understand the 3D structure and thickness of the biofilms. The 24-h-grown biofilms, rinsed twice with 2 mL of PBS, were stained with 1 mL of a mixture containing the fluorescent dyes. The protocol used for staining is a simplified protocol adapted from Philips et al. [6]. The dyes mixture contained the (i) calcofluor white stain solution (CFW, Sigma Aldrich, St. Louis, Missouri) and the (ii) SYTO9 and propidium iodide (PI) solution (LIVE/DEAD™ BacLight™ Bacterial Viability Kit, Life Technologies, Carlsbad, CA) with proportion 1:1 in volume. The CFW solution was prepared with a concentration 10 mg/mL in water, while SYTO9-PI solution was prepared with a concentration 3 µL/mL of each dye in PBS. Biofilms were stained with 1.2 mL of the dyes’ mixture solution for 20 min. During staining, the biofilms were kept in darkness to avoid fluorescent dyes’ photobleaching. Afterwards, the staining mixture was removed, and the biofilms were rinsed with 2 mL of distilled water to discard the excess of dyes. Biofilms were sealed with a cover slide (35 mm, no 1.5 glass thickness; MatTek in vitro life science, Bratislava, Slovakia) using nail polish. The wavelengths of excitation (λexc) of CFW, SYTO9 and PI were 405, 425 and 575 nm, respectively, while the emission was captured using pass band filters (Δλem) of 425–475, 500–550 and 570–620 nm, respectively. The 60× oil lens was mounted for the acquisitions. NIS Elements software was used to capture the images and ImageJ to analyse them.

2.6. Mathematical Modelling of Biofilm Growth

To study the biofilm development in time, two levels of inoculum density, being 104 and 107 CFU/mL, were investigated. Biofilms obtained from different inoculum levels were quantified at each time point. Every 1.5 h or 3 h (for inoculum levels of 104 and 107 CFU/mL, respectively) the natural logarithm of the CFU per biofilm area was determined (as described in Section 2.4.1). Two to five replicates were performed at each time point. To study the biofilm development and estimate the growth parameters, the Baranyi and Roberts model (1994) was used [23]. To use this model, it is assumed that the population within the biofilm is homogenous and represented by N(t). The model equations are:
d N t d t = Q t 1 + Q t · µ m a x · 1 + N t N m a x · N t
d Q t d t = µ m a x · Q t .
Equation (1) describes the cell density as a function of time N(t), (CFU/cm2), which depends on Q(t), which represents the physiological state of the cells, and which determines the duration of the lag phase. µmax represents the maximum specific growth rate (1/h) and Nmax the maximum cells density (CFU/cm2). Equation (2) describes the evolution of the state Q(t) with time. Data resulting from an inoculum levels of 107 and 104 CFU/mL were fitted with this model. The parameter estimation was implemented using the function lsqnonlin of MATLAB R2016a (The Math Works, Inc.).
The initial conditions are N(t = 0) = N0 and Q(t = 0) = Q0 and the following equation contains the parameter λ , which represents the lag time (h):
λ = 1 µ m a x ln 1 + 1 Q 0
The root mean squared error (RMSE) between the natural logarithms of the observed (Nexp) and predicted (Nmod) values at the time points t i was estimated as follows
RMSE = 1 n ln ( N exp t i ) ln N mod t i 2 n p
where n is the number of measurements and p is the number of estimated parameters. It was used to evaluate the goodness of the fit.

2.7. Method Validation on Staphylococcus Epidermidis

Staphylococcus epidermidis (NCTC 11,047 Lenticule discs, St. Luis, MI, USA) was selected as Gram-positive bacteria to validate the protocol for growing biofilms on a flat polystyrene surface. The pre-culture was prepared following the same protocol (Section 2.1) using Luria Bertani (LB, Becton Dickinson, Franklin Lakes, NJ, USA) supplemented with 5 g/L NaCl at 37 °C. 400 µL of 107 CFU/mL inoculum suspension was spread on the petri dish surface as described in Section 2.3. During growth, the biofilms were incubated at 20 °C to promote S. epidermidis attachment to polystyrene [45,46,47]. Following Section 2.4.1 and Section 2.4.2, the quantification of the biofilm population density and of optical density were performed. Finally, the fitting and the estimation of the parameters using the Baranyi and Roberts (1994) model was carried out as explained in Section 2.6 [23].

2.8. Statistical Analysis

A one-way analysis of variance (ANOVA) was used to statistically compare the estimated parameters of the Baranyi and Roberts (1994) model [23]. A multiple comparison tests based on the multcompare function implemented in MATLAB R2016a (The Math Works, Inc.) was performed. With a level of 95%, a p-value lower than 0.05 was considered significantly different.

3. Results

To optimise the growth of P. fluorescens biofilms on the polystyrene surface of petri dishes, different areas (on which the biofilms were spread) and different TSB concentrations were tested. The spreading procedure ensured a uniformly distributed suspension on all the tested areas. Biofilms were grown for 24 h and compared in terms of population density and total biomass. The biomass and the population densities were monitored in time for two inoculum levels. For an inoculum level of 107 CFU/mL, 24 h of biofilm growth guaranteed a steady state in terms of viable cell densities, and corresponded to the plateau after the peak in the optical density curve. Numerous replicates were obtained for both the optical density and viable cell counts (10 and 20 replicates, respectively) to demonstrate the high reproducibility of the proposed biofilm growth protocol. Moreover, CLSM images were obtained to demonstrate the maturity of the biofilms.

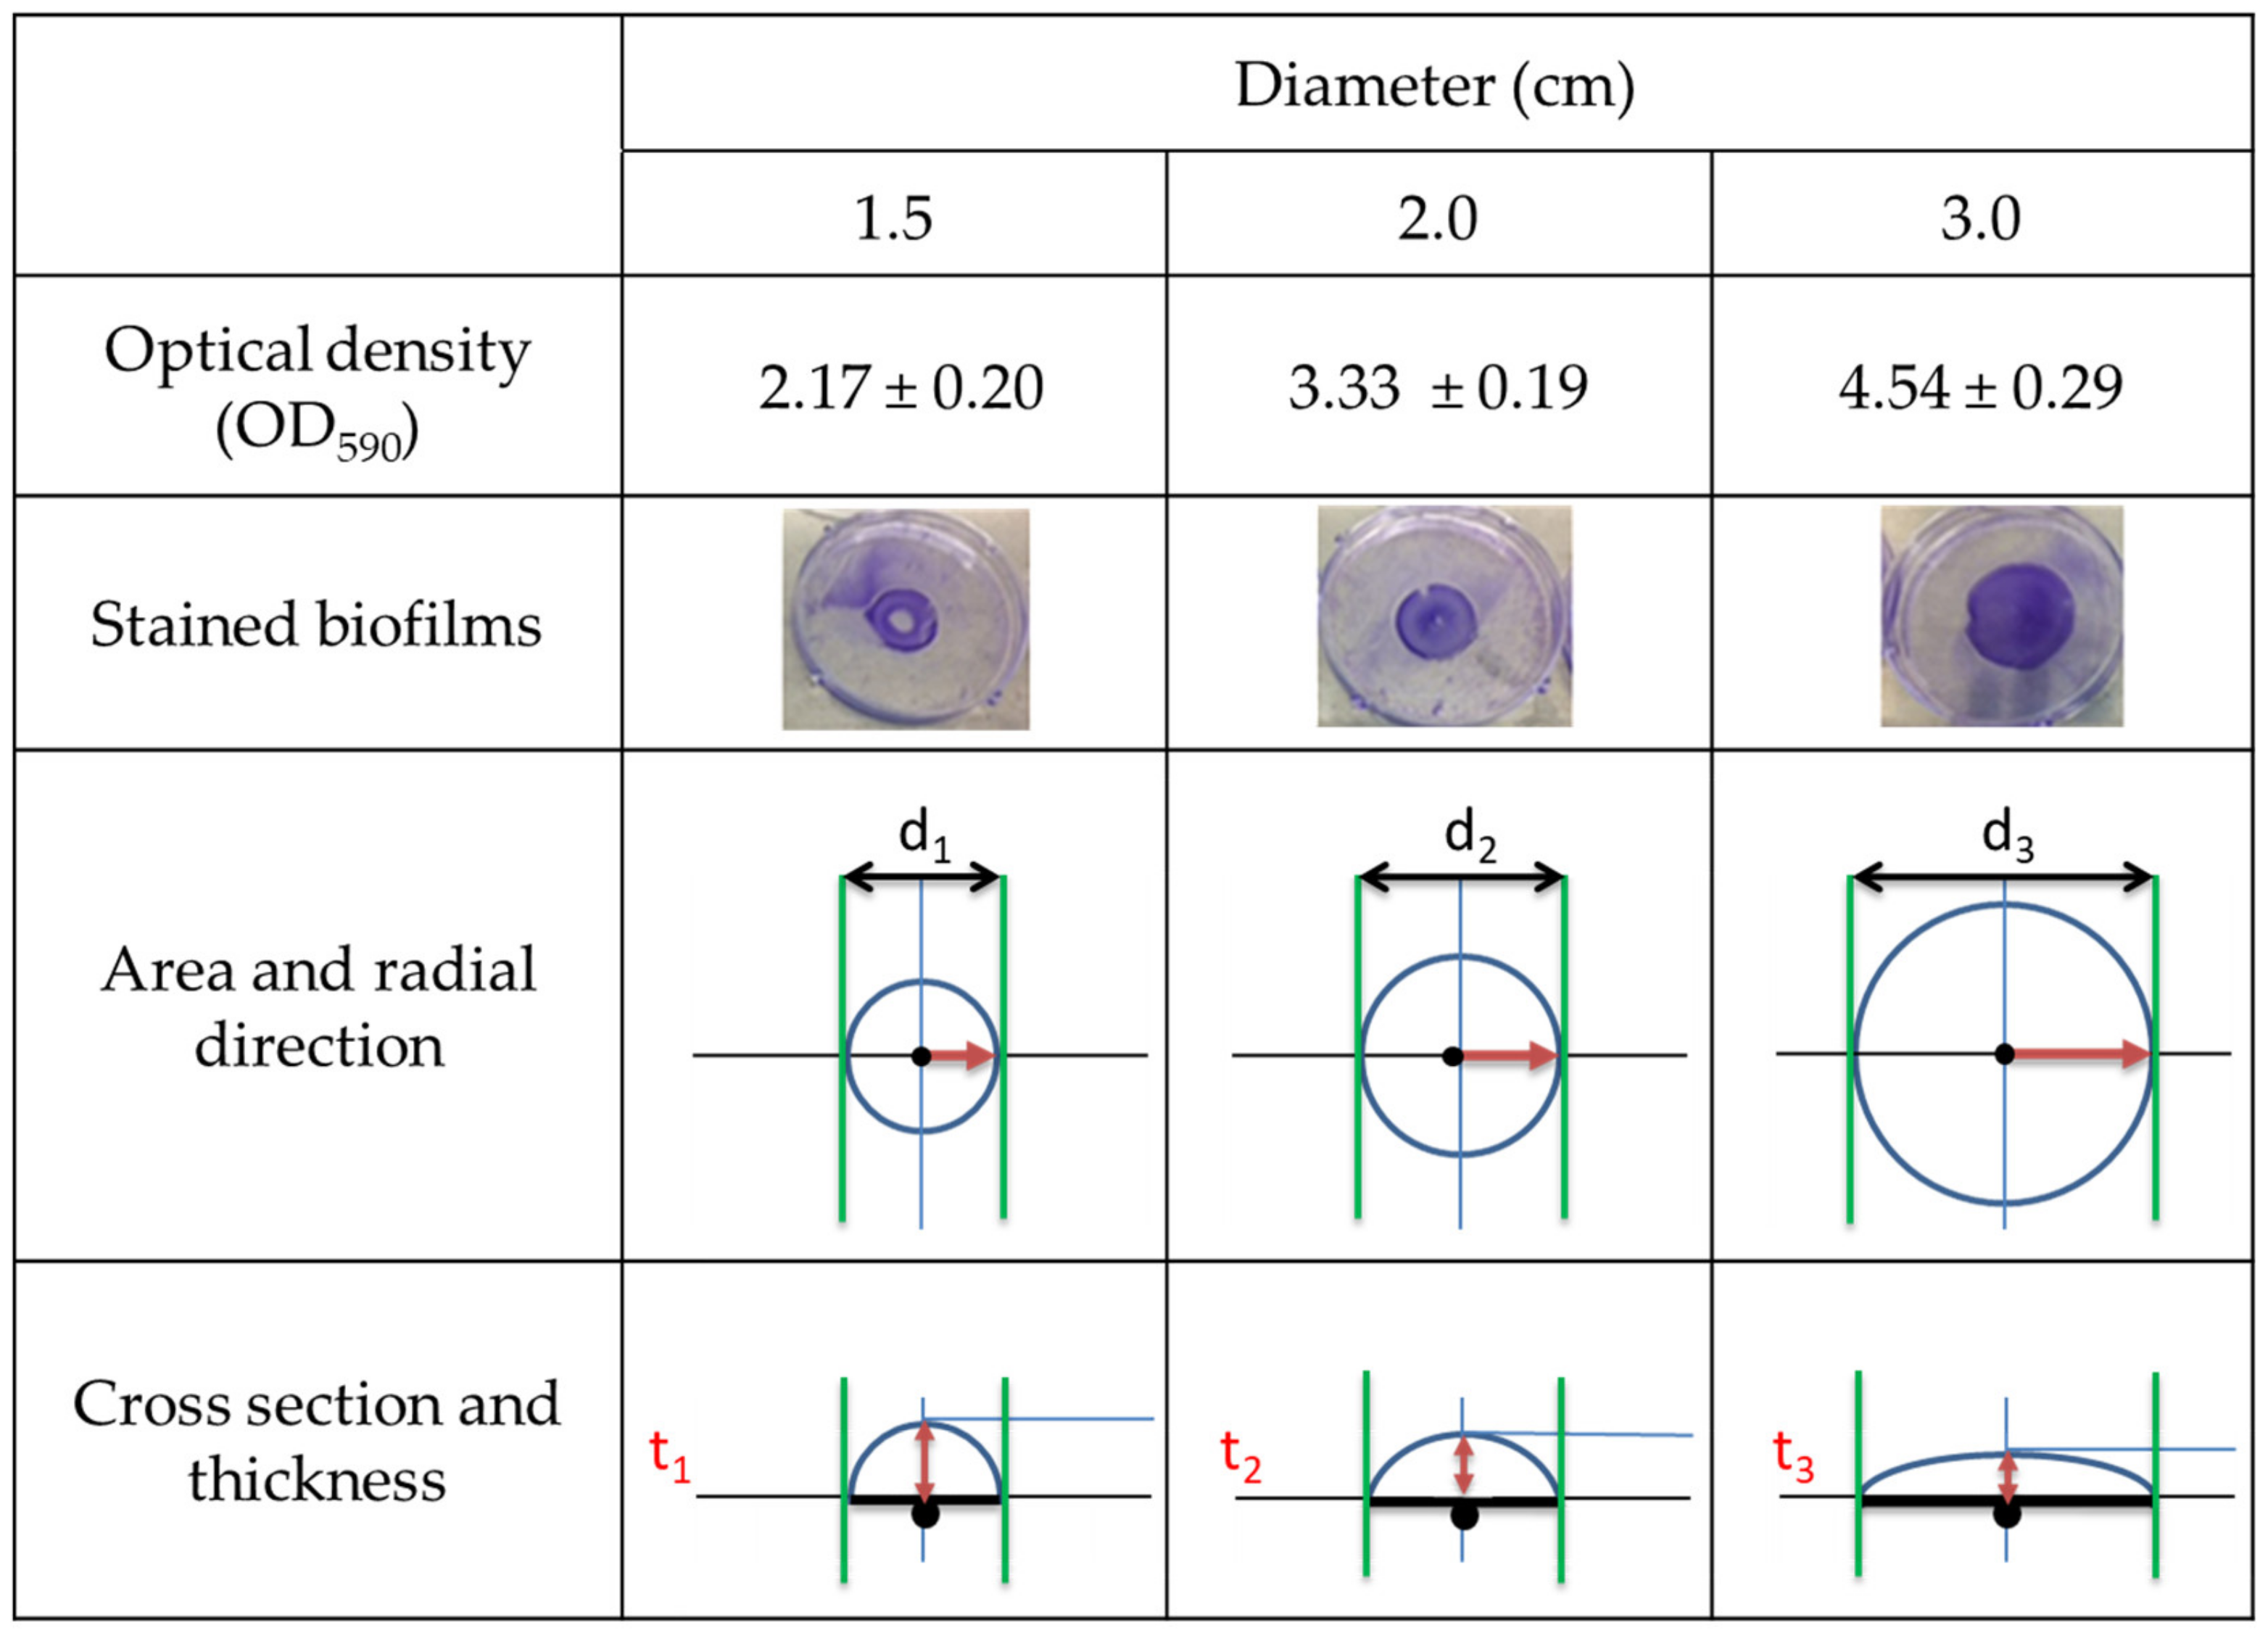
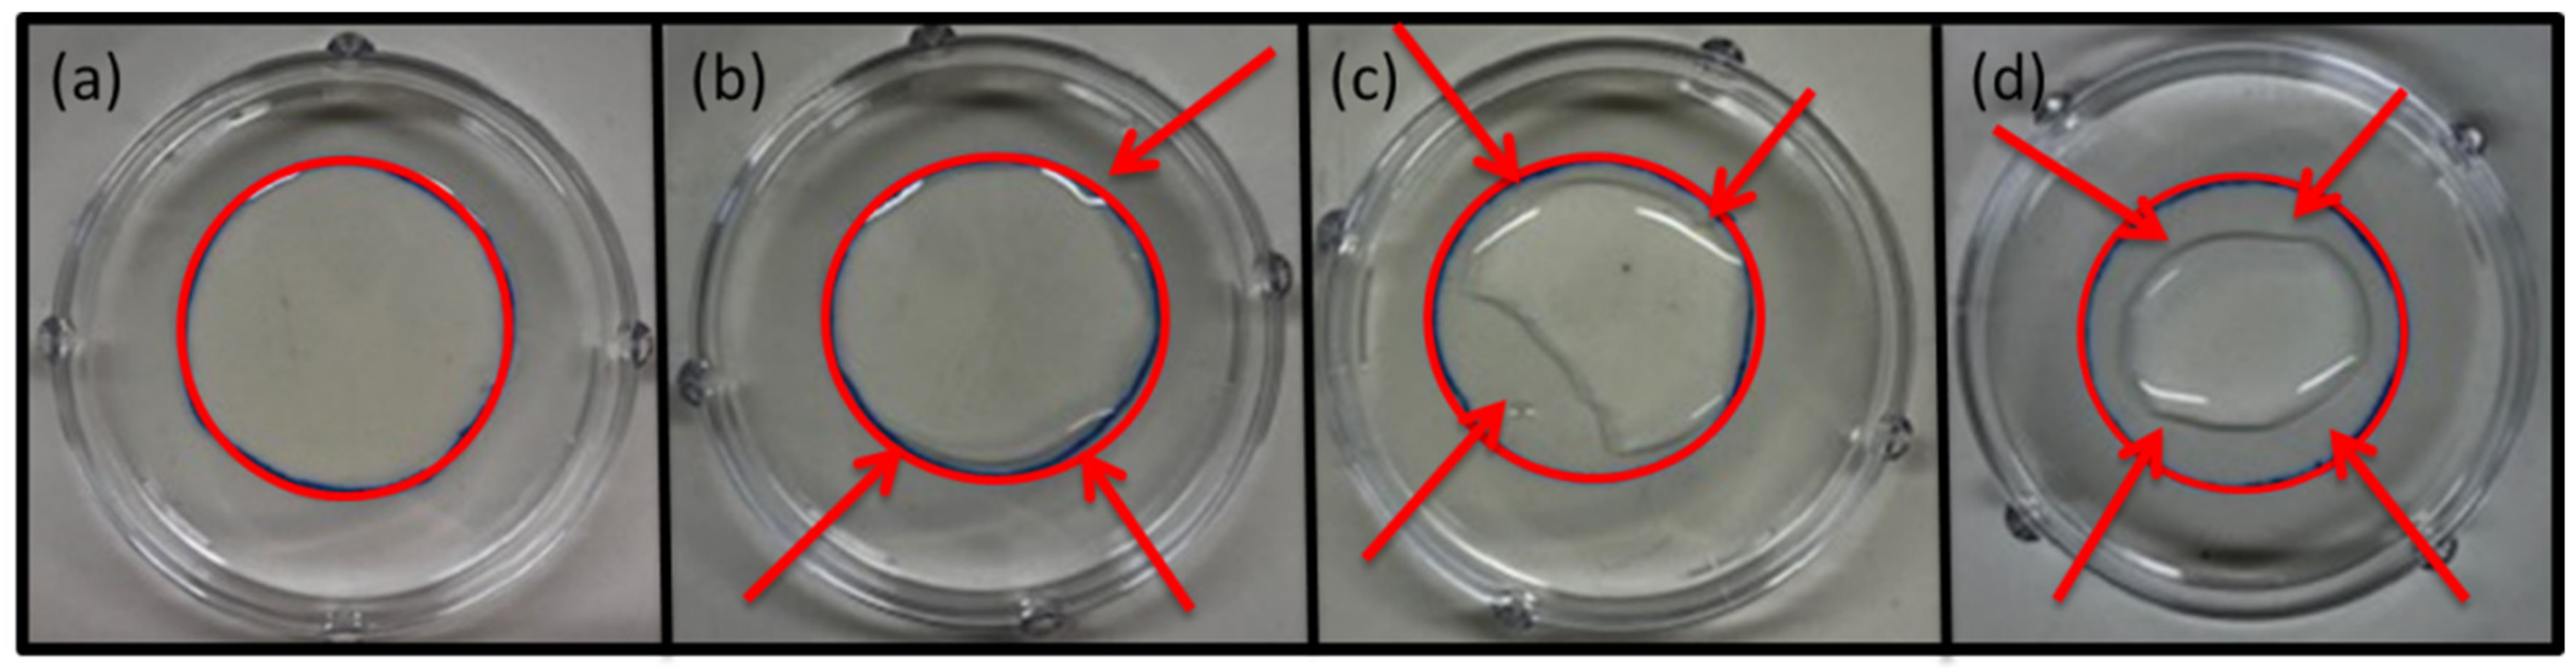
3.1. Deveplopment of Biofilms on Defined Circular Areas

Biofilms were grown within circular areas (on polystyrene) with diameters of 1.5, 2.0 and 3.0 cm, and then their biomass was quantified. Figure 1 displays different values/pictures/images of the biofilms as a function of the diameter (1.5, 2.0, 3.0 cm). In the first row, the CV optical density values (OD590) are displayed, which are related to the total biomass. In the second row, the pictures of the biofilms after staining with CV assay are presented. The third row displays the areas, the diameters (d1 < d2 < d3), and the radial directions, indicated by a red rightwards arrow, which starts at the centre of the drop (black round spot, Figure 1) and points towards the border. The fourth row contains the cross-sections of the 400 µL drops: the thickness at the centre (black spot in the centre) of the drop is indicated by the red double-headed arrow (t1 > t2 > t3). The CV optical density values (first row) appear proportional to the diameter of the drop. The larger the diameter, the larger the area was (third row) and, consequently, the area of interactions between the bacterial population and the polystyrene surface. Based on pictures of the biofilms (second row), it can be easily conceived that the samples with diameter 1.5 cm formed a ring shape, due to the strong detachment of the central part of the biofilm during rinsing. Biofilms with diameter 2.0 cm also lost some part of the biofilm in the centre during the rinsing procedure. Biofilms with diameter 3.0 cm, instead, were generally well attached to the surface. Looking at the cross-section and diameter (third and fourth row), it can be logically seen that larger areas (d1 < d2 < d3) result in a shorter height of the liquid column (lower thickness, t1 > t2 > t3). Moreover, the height of the liquid column (thickness of the drop, t) substantially varied between the centre (black spot) and the border (delimited by the green lines) for biofilms with diameters of 1.5 and 2.0 cm, while it smoothly varied for biofilms having 3.0 cm of diameter. As a consequence of the good attachment of biofilms grown with 3 cm of diameter, this latter was chosen to develop the biofilm protocol.

3.2. Growth Medium Concentration

Four different TSB concentrations (1.5, 3.0, 15.0 and 30.0 g/L) were tested to understand whether the cell growth within the biofilm was promoted by a more diluted broth, as suggested by the literature [8,9,44,48]. Although all the prepared suspensions contained the same level of inoculum density (107 CFU/mL), the change in the TSB concentration determined a consequent variation in the surface tension, as can be observed in Figure 2. This resulted in a “pulling back” phenomenon, which prohibited the spreading of the drop on the defined area as desired. In Figure 2, the red circles pointed out the areas expected to be covered by the suspension, while the arrows highlighted the uncovered polystyrene surfaces. For this reason, the TSB concentration was fixed at 30.0 g/L, allowing the biofilms to grow on the whole area on which the suspension was previously spread.

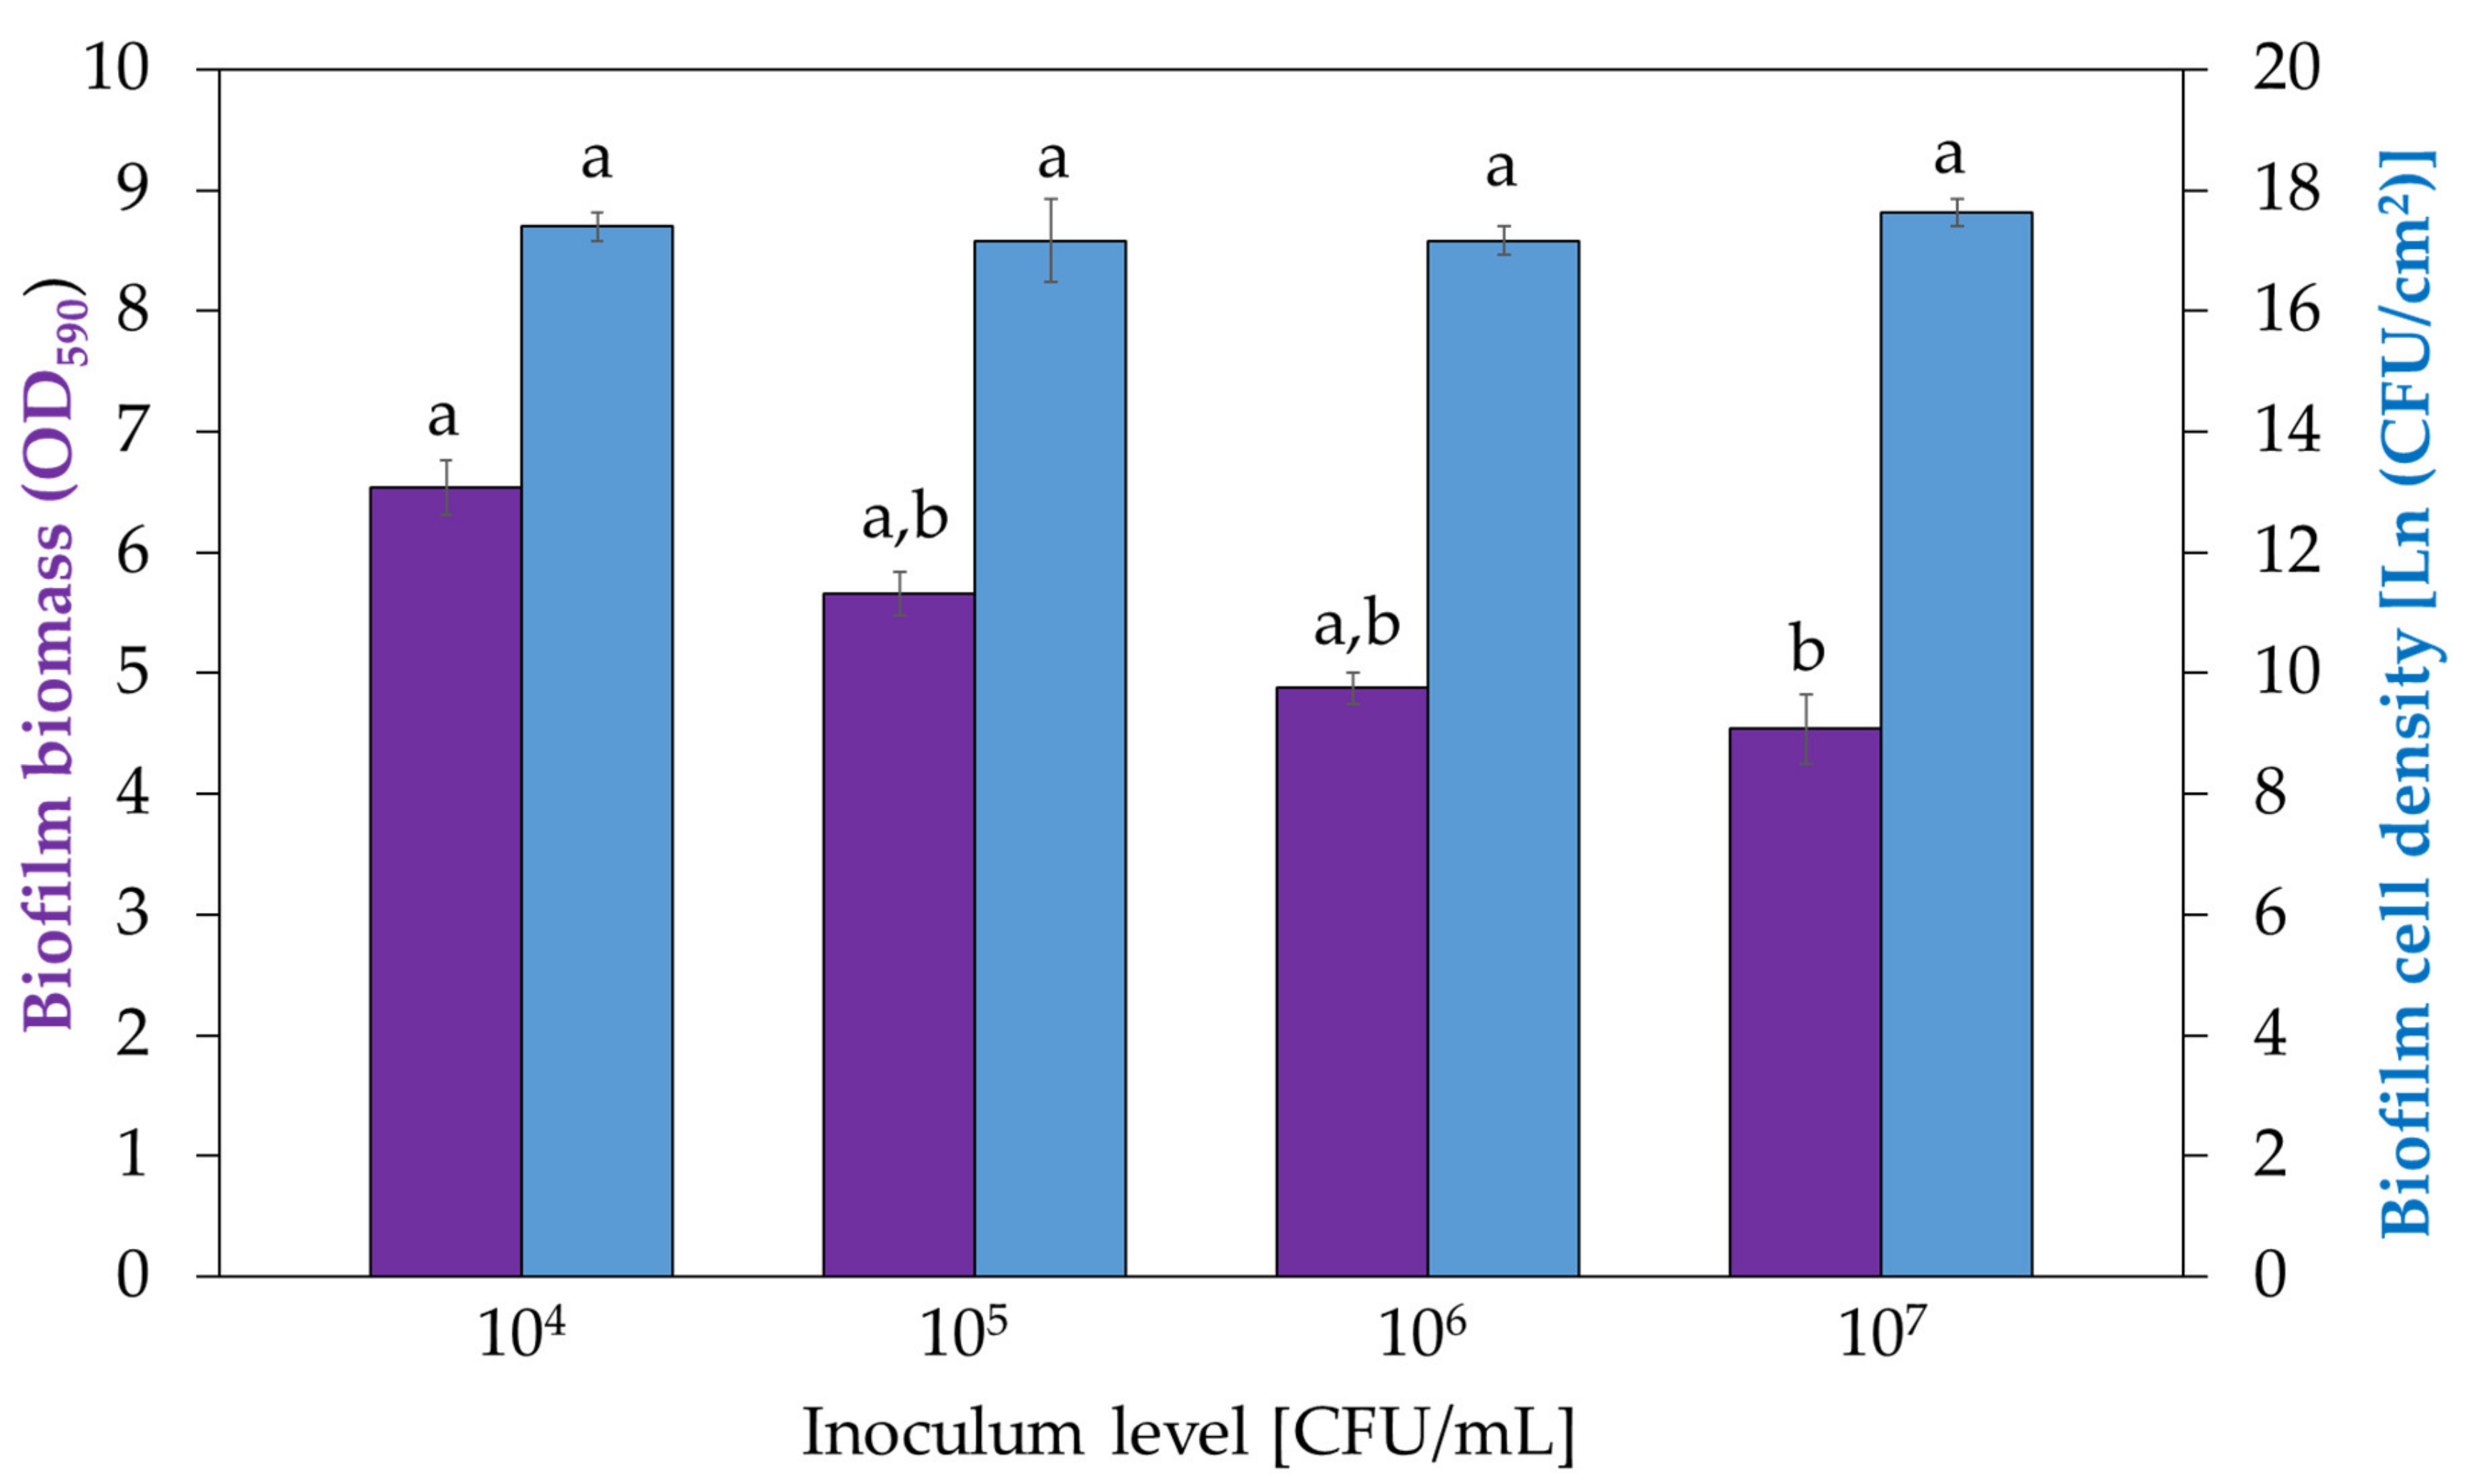
3.3. Influence of Inoculum Density on Biofilm Development

Levels of inoculum density of 104, 105, 106 and 107 CFU/mL were tested. These inoculum levels correspond to 6.34, 8.64, 10.94 and 13.25 ln(CFU/cm2), respectively, on the surface of the petri dishes. The protocols related to the enumeration of the viable cells and the optical density measurements were carried out. The bar chart in Figure 3 (blue bars) displays the natural logarithm of the CFU per area of biofilm (biofilm cell density) obtained with different inoculum levels. The variation of the inoculum levels did not affect the viable cell density within 24-h-grown biofilms. This means that biofilms contained the same number of cells, regardless of the inoculum level after overnight growth. The bar chart in Figure 3 (violet bars) instead shows the optical density values (total biomass) of 24-h-grown biofilms for different inoculum levels. The biomass quantification demonstrated that with a lower inoculum level, a higher total biomass was observed.

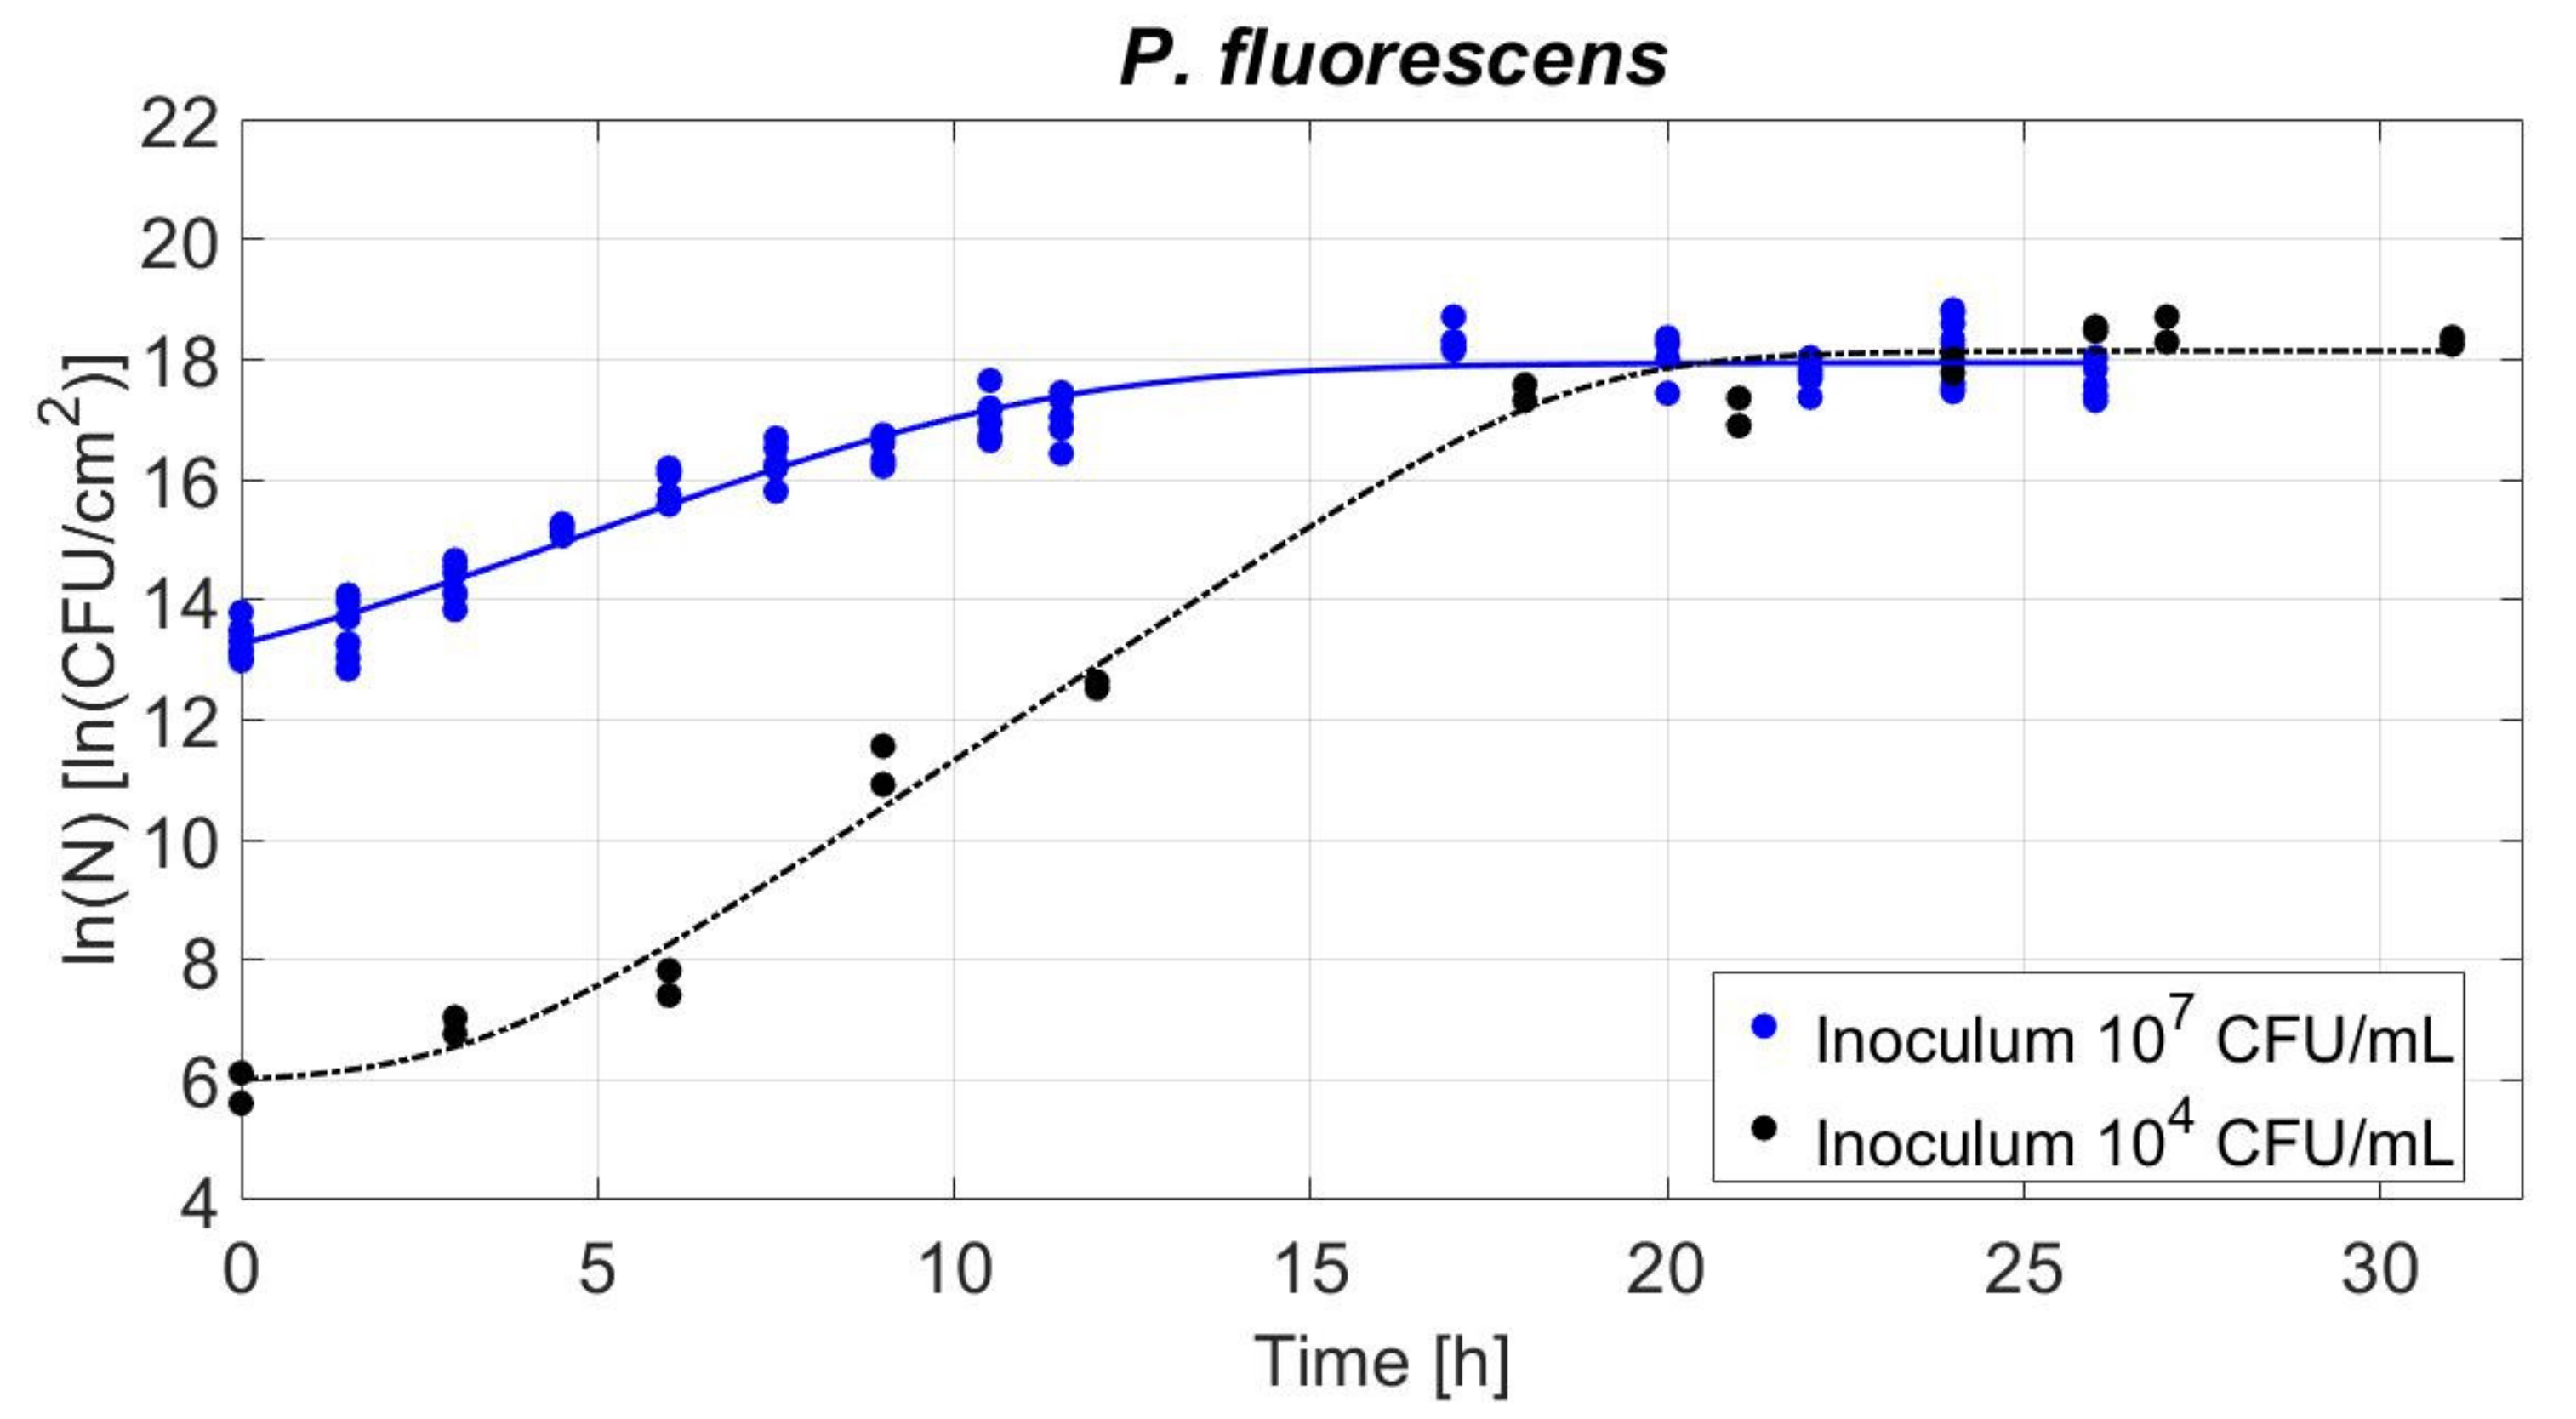
3.4. Biofilm Development in Time for Two Inoculum Levels

The development of the biofilms in time was studied employing viable cell counts and optical density quantification, using CV assay, to study its evolution in terms of both population density and total biomass, respectively. The development was studied for inoculum levels of 104 and 107 CFU/mL.

3.4.1. Study of Biofilm Population Density: Viable Cell Counts

The influence of the inoculum levels on the biofilm population density was studied and it was represented as a function of time in Figure 4. The Baranyi and Roberts (1994) model was fitted to the data and allowed the estimation of the growth parameters (Section 2.6) [23]. The resulting lag time (λ), maximum specific growth rate (µmax), initial and maximum cell densities (ln(N0) and ln(Nmax), respectively), the standard errors (SE) and the Root Mean Squared Errors (RMSE, indicating the quality of the fit) are listed in Table 1. First, a longer lag phase (λ) was needed for the biofilm to grow on the polystyrene when the inoculum level was 104 CFU/mL compared to 107 CFU/mL. Then, the relative maximum growth rate (µmax) was higher for 104 CFU/mL inoculum level compared to 107 CFU/mL. Finally, the stationary phase reached similar densities of approximately 18 ln(CFU/cm2) for both inoculum levels. The absolute increase of the biofilm population was calculated as l n N m a x l n N 0 . These values are also displayed in Table 1.

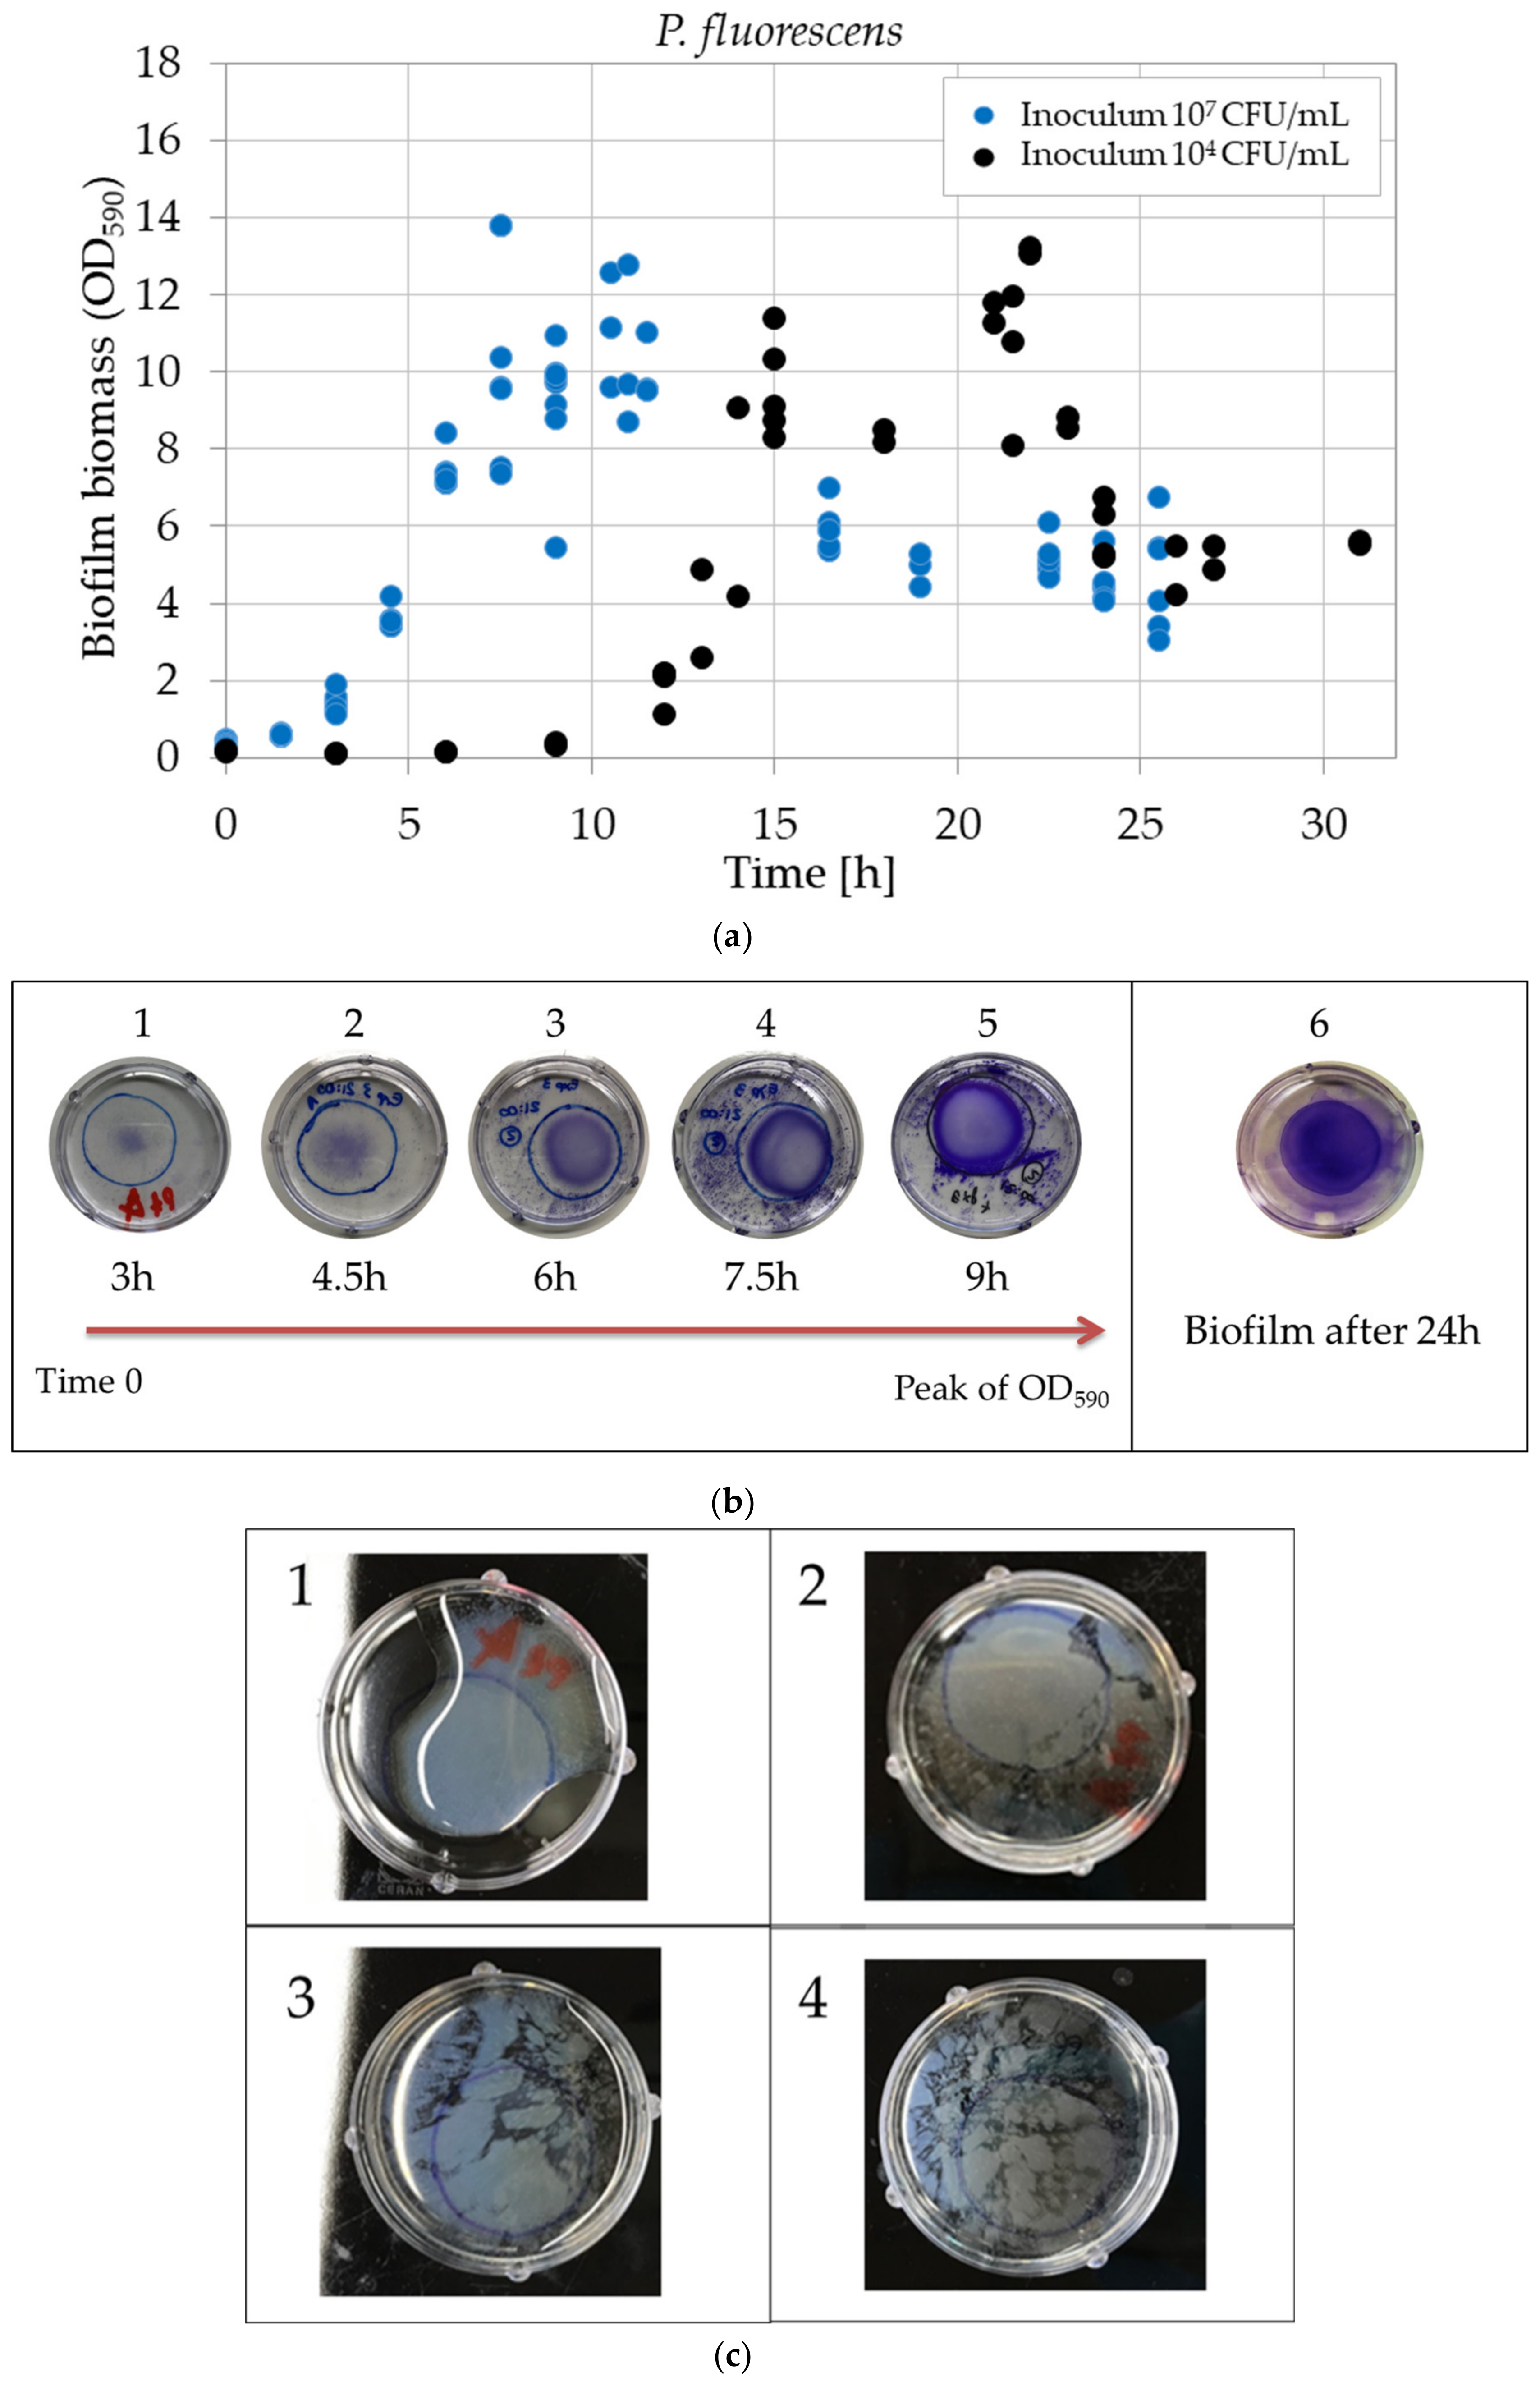
3.4.2. Study of the Biofilm Biomass: Optical Density of CV Assay

The biofilm development was also studied in terms of biomass. The biomass was quantified following Section 2.4.2 and is represented in Figure 5a. In the beginning, the optical density (OD590) increases and reaches a peak value (approximately equalled to 12). Consequently, the OD590 decreases until it reaches a plateau (approximately equal to 5). The plateau was reached after 32 h and 24 h for 104 and 107 CFU/mL of inoculum level, respectively. In Figure 5b, pictures of the biofilms after CV staining are displayed. Pictures 1–5 represent the development of the biofilm from time 0 to the OD590 peak, around 17 h or 10 h for inoculum levels of 104 and 107 CFU/mL, respectively. As can be seen, the biofilm started to grow from the centre of the defined area. Then, it expanded to grow on the full area showing a coffee ring effect. The coffee ring border became more and more intense in colour when OD590 reached the maximum value. After 24 h, the biofilm no longer displayed a difference in intensity between the ring (border) and the centre. It looked uniform for the entire surface (Figure 6b, picture 6). During the growth and development of the biofilm on the polystyrene surface of petri dishes, another phenomenon happened between approximately 15 h and 24 h for an inoculum level of 104 CFU/mL (7 h and 20 h for 107 CFU/mL): the biofilm started also to grow at the air-liquid (A-L) interface. Figure 5c demonstrates the development of the biofilm growing at the A-L interface from its formation (Figure 5c, picture 1) to its disruption, which resulted in small biofilm fractions floating on top of the liquid (Figure 5c, picture 2–4).

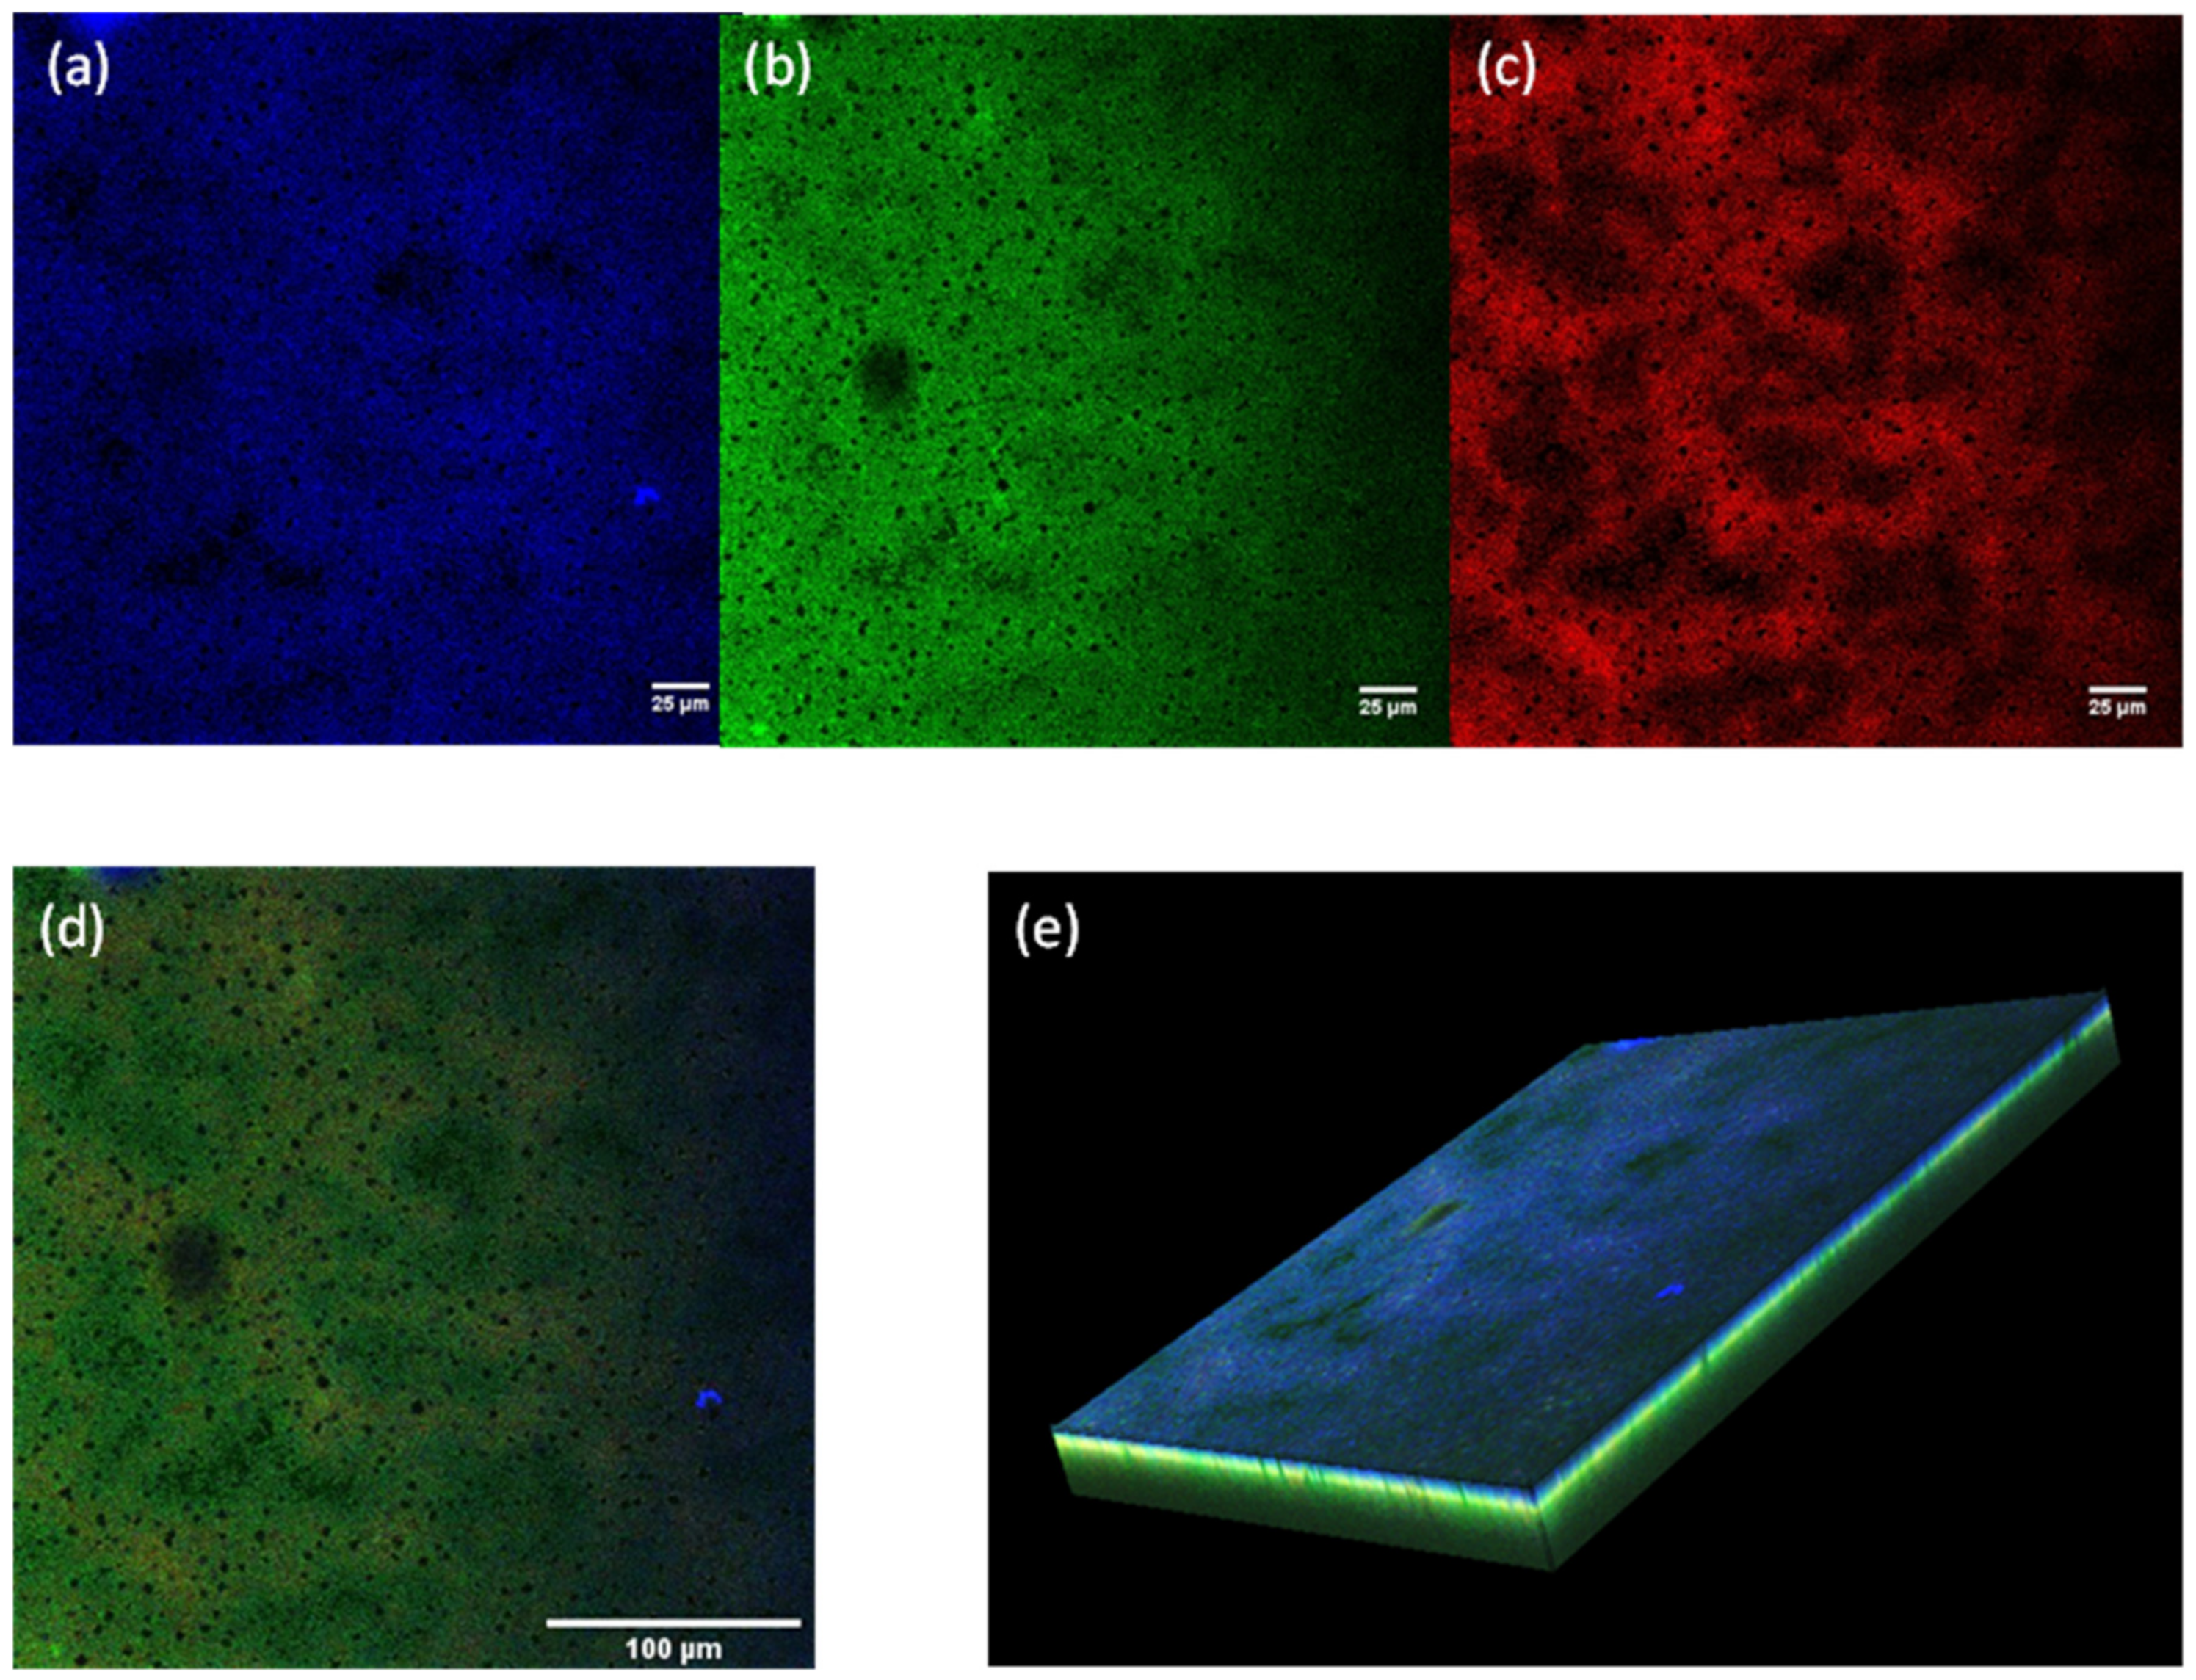
3.5. Reproducibility and Confocal Laser Scanning Microscopy Images

The monitoring of the evolution of the biomass and the population density showed a steady state after 24 h for biofilms obtained with inoculum level of 107 CFU/mL. A stationary phase is observed for the population density growth curve, and a plateau is observed (after the peak) in the optical density measurements. For this reason, the reproducibility of the obtained biofilm was studied specifically after 24 h of growth. The mean value of the optical density on ten independent replicates demonstrated to be 4.95 ± 0.43. Viable plate counts of 20 independent replicates resulted in an average population density of 17.78 ± 0.44. These data demonstrated a good reproducibility of the biofilm that is obtained after 24 h when following the developed protocol.
The protocol yielded a fully mature biofilm, as demonstrated by confocal laser scanning microscopy. After fluorescent staining, 24-h-grown biofilms were visualised with CLSM. The estimated biofilm thickness was approximately 73 µm. The three CLSM images (in Figure 6a–c), corresponding to half the depth of the biofilm (approximately 38 µm), show the complex architecture of the biofilms. The blue dye (CFW) makes it possible to visualise the polysaccharides of the EPS, specifically 1-3 or 1-4 β-glycosidic bonds between saccharides [6]. This represents the biofilm matrix. The green dye (SYTO9) is a nucleic acid stain that diffuses through cellular membranes; consequently, it binds to the DNA of both viable and dead cells. In fact, it also stains the extracellular DNA that is part of the EPS. The PI is an intercalating agent that stains the dead cells, penetrating their damaged membrane. The CLSM images served as a way of understanding the 3D structure, and the different components within the biofilm. Figure 4 represents the combination of the three laser channels (CWF, SYTO9 and PI) at the same depth of 38 µm. The structure of the biofilm is displayed in the images (Figure 6a–d), where the black circular spots represent the water channels. They clearly differ in the dimension of the pores and are essential for the transportation of nutrients. Figure 6c displayed larger dark areas, indicating that the dead cells are in lower quantity and are clumped together. Figure 6e displays a 3D reconstruction of the biofilm using z-stack acquisition. As can clearly be seen, the top part of the biofilms was mainly covered by EPS to protect the cells from external factors (blue), while the middle and bottom part, growing in contact with the polystyrene, was mainly composed by densely packed cells (green).

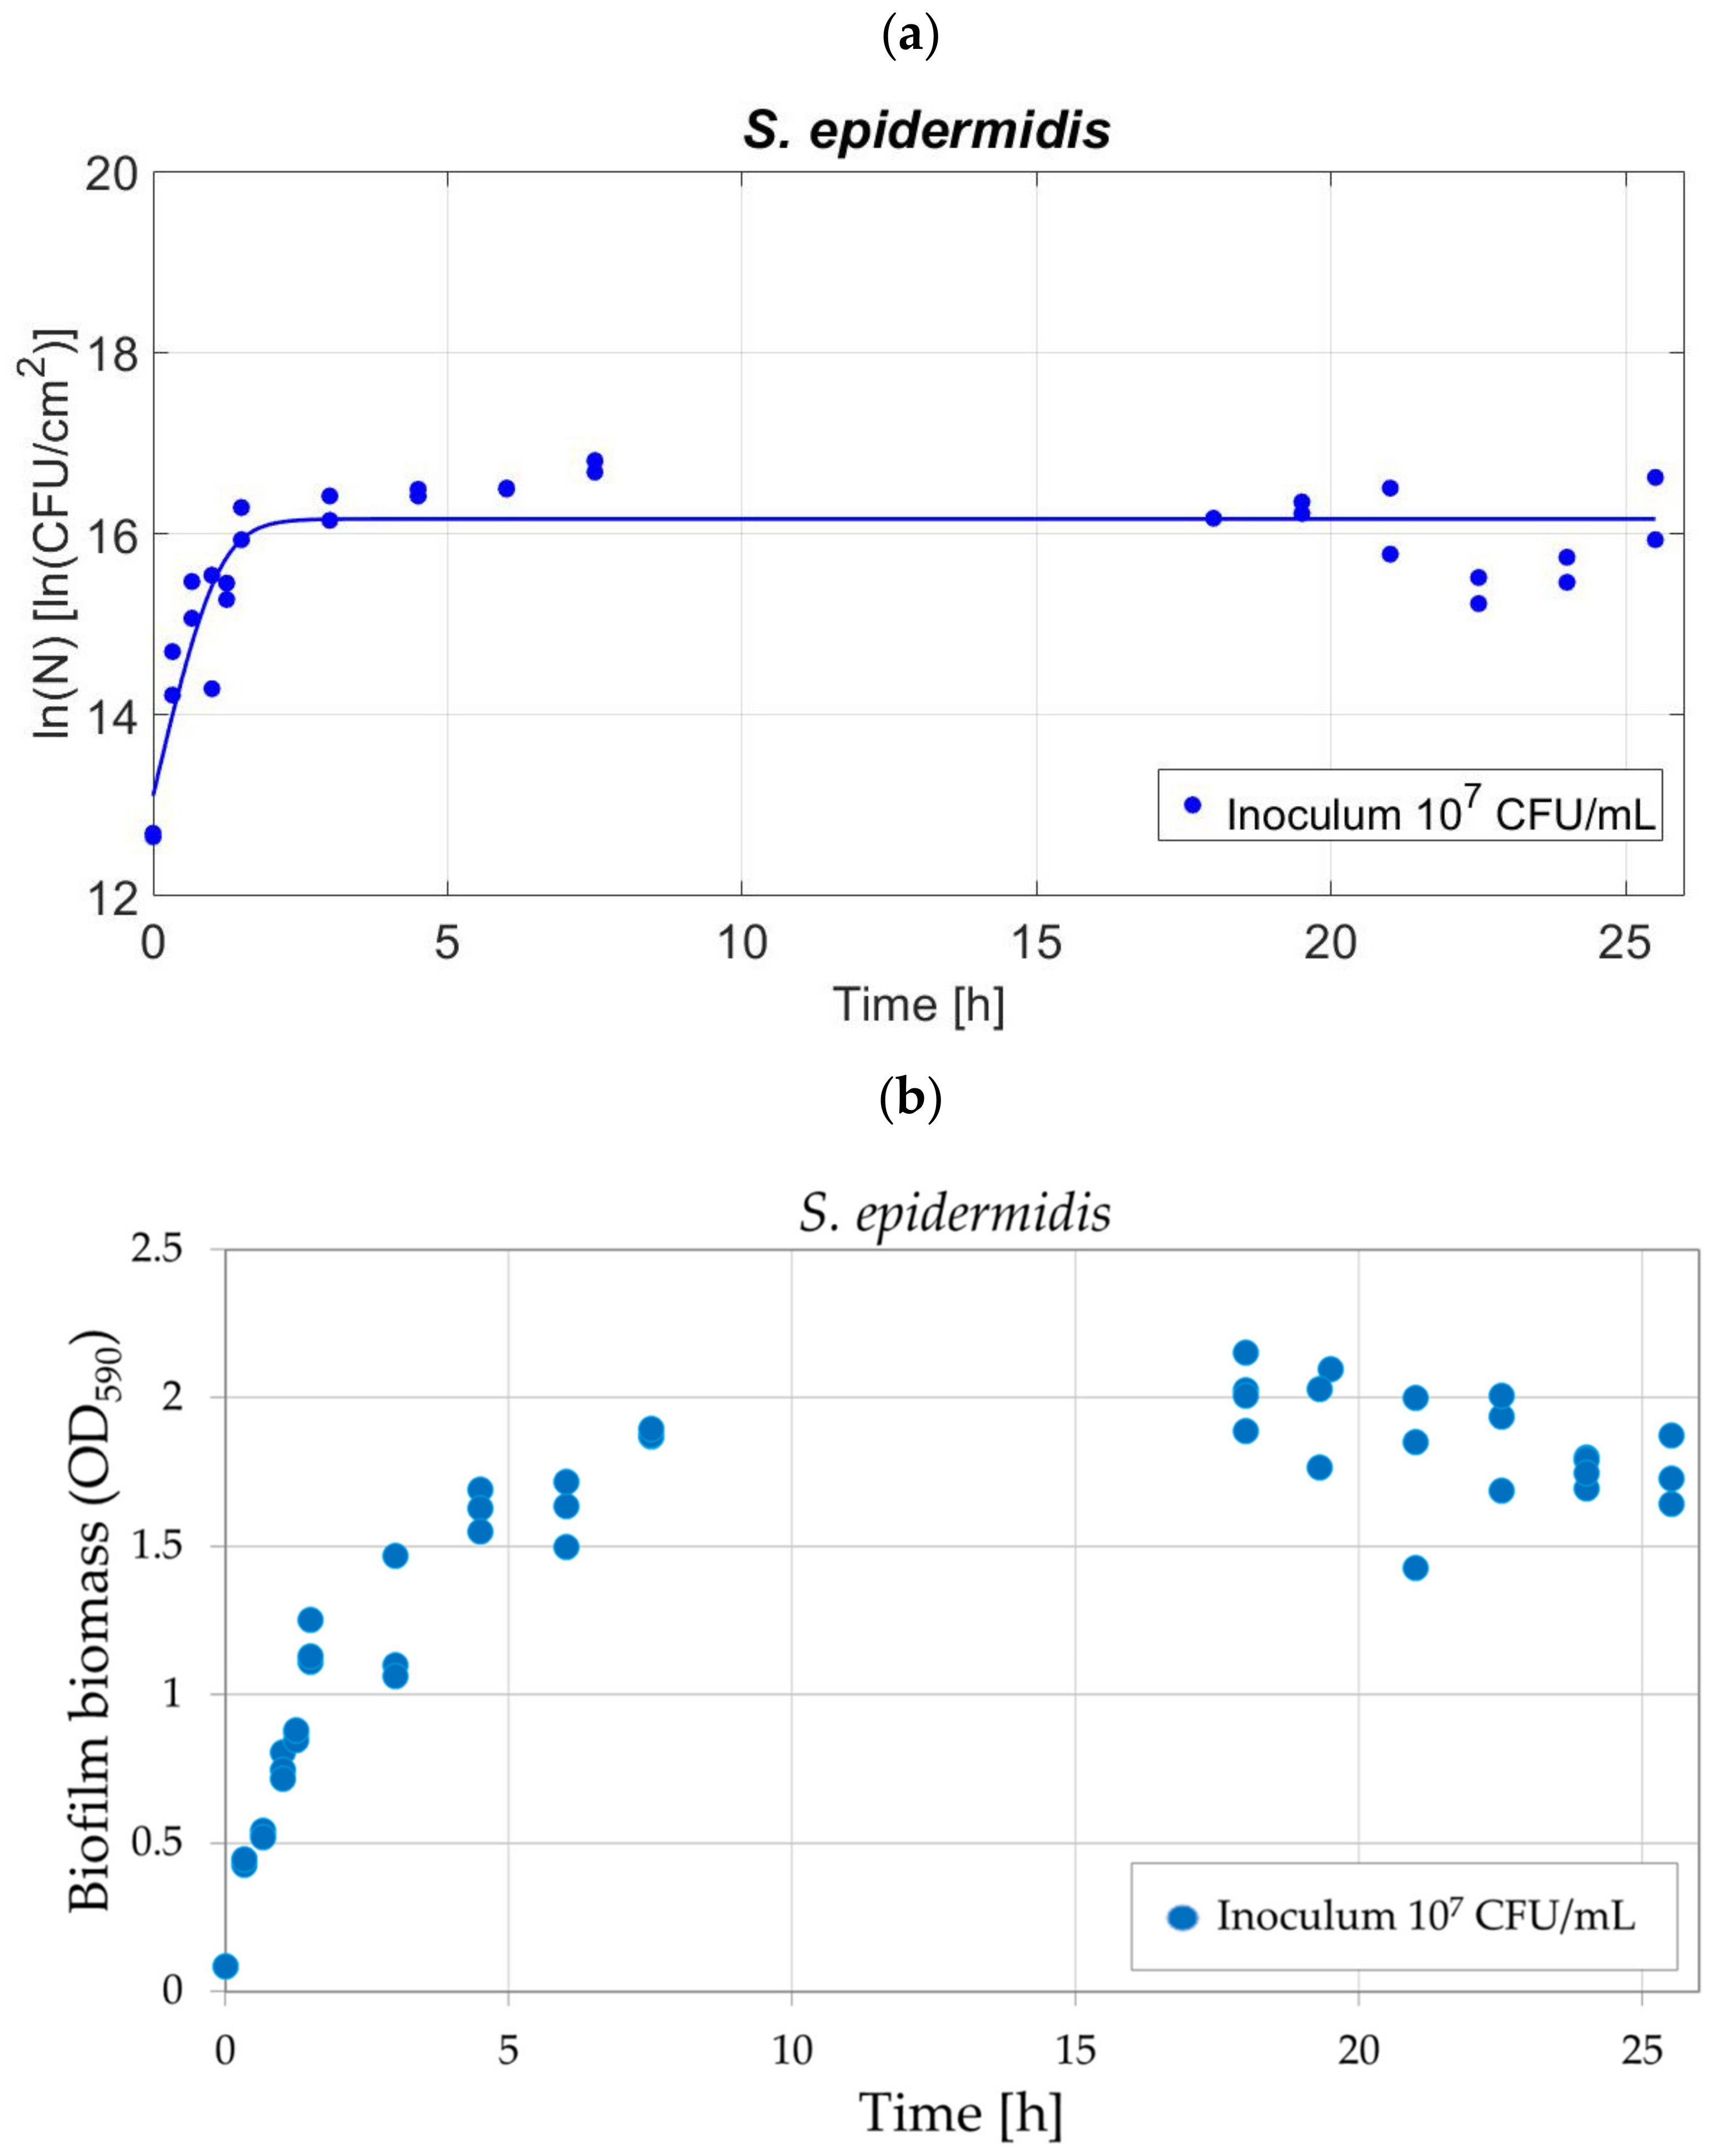
3.6. Method Validation on S. epidermidis

The protocol for biofilm development was validated using another strain with different characteristics from P. fluorescens, such as (i) shape, cocci rather than bacillus, (ii) genus, Staphylococcus, and (iii) Gram-nature, specifically Gram-positive. The biofilm biomass and the population density were measured during the biofilm development and the growth parameters were estimated. The data are shown in Figure 7a,b, for the biofilm biomass and the population density, respectively. Figure 7a shows that S. epidermidis growth showed a sigmoidal curve following the Baranyi and Roberts (1994) model [23]. The growth parameters, estimated by fitting the Baranyi and Roberts (1994) model to the experimental data, corresponded to 13.16 ± 0.43 [ln(CFU/cm2)] for the initial population ln(N0), 2.622 ± 1.35 [1/h] for the maximum specific growth rate (µmax) and 16.36 ± 0.12 [ln(CFU/cm2)] for the maximum cell density ln(Nmax), while the lag time was equal to zero. The RMSE related to the quality of the fit was equal to 0.6115. The biofilm development occurred in the first few hours and the population density reached a plateau that maintained constant until 25h30. The attachment of the bacteria occurs at once when the bacterial population is exposed to the polystyrene surface. Figure 7b showed the S. epidermidis biomass evolution in time. Differently from P. fluorescens, neither the coffee ring effect nor pellicles formation was observed at any time points. For S. epidermidis, the biofilm biomass was uniform on the whole area since the first attachment. The optical density increased and reached a constant value (plateau) after 7h30. Replicates of the biomass and population density (10 and 20, respectively) demonstrate that the S. epidermidis biofilm was highly reproducible as for P. fluorescens. Specifically, OD of 1.78 ± 0.27 and 15.6 ± 0.19 ln(CFU/cm2) were obtained for the biofilm biomass and population density.

4. Discussion

This research is the first to develop a protocol for growing biofilms on a flat polystyrene surface, presenting biofilms that grow on a wide area, without the need for expensive equipment. Since petri dishes are the most popular material used in microbiological research, the advantage of the protocol is also related to its availability in every laboratory. The development of a reproducible protocol for growing biofilms in 24 h was performed following different steps, such as defining the (i) biofilm area, (ii) TSB concentration, and (iii) level of inoculum density. CLSM images of 24-h-grown biofilms confirmed that overnight growth allowed P. fluorescens to develop a densely packed biofilm with its 3D structure.
A key evidence of the reproducibility of the method not only arises from the consistency of the resulting biofilms after 24 h, but also from the reproducibility of the biofilm development as a function of time. The development of biofilms was studied by means of viable plate counts and optical density measurements using the CV assay. By fitting the model of Baranyi and Roberts (1994) to the growth dynamics of the biofilm cell densities, the model parameters were determined and compared between two different inoculum levels. The protocol is highly reproducible, as numerous replicates witnessed (both in terms of the optical density and viable cell counts), and it can be used to yield fully developed mature biofilms, as CLSM images demonstrated.

4.1. Developing Strongly Attached Biofilms

The first studied factor influencing the biofilm development was the size of the areas where the biofilms were grown (solid-liquid interface). The height of the liquid column along the diameter of the drop strongly varied from the centre to the border (as explained in Section 3.1), for biofilms that were grown on smaller areas (1.5 and 2.0 cm of diameter). In contrast, for biofilms grown on areas having a larger diameter (3.0 cm), the height of the liquid column varied less from the centre to the border. The hypothesis is that the amount of oxygen reaching the liquid–solid interface in the centre of the drop is lower for the small drops than for the large drops, due to the higher liquid column. Some authors suggest that the oxygen diffusion process is essential for biofilm growth [49,50]. Lewandowski et al., using a microelectrode, investigated the oxygen diffusion profile at the biofilm-liquid interface. They found a decrease of the dissolved oxygen concentration near the biofilm surface (1 mm of distance) [50]. This profile underlines the importance of the dissolved oxygen for the complex biofilm system [50]. This would be then definitely the case for P. fluorescens, which are obligate aerobic bacteria [33]. The low attachment of the biofilm in the centre of the smaller biofilms (1.5 and 2.0 cm) consequently caused detachment during the rinsing procedure (Section 3.1). The oxygen availability along the liquid–solid interface remained the same when the area is large (3 cm), because of the small difference in liquid height between border and centre of the drop. This is assumed to have allowed a stronger biofilm attachment. Gradients of oxygen and carbon sources play an important role in the spatial organization of biofilms formation [50,51].
In the literature, some works have confirmed that a low nutrient concentration in the inoculum could favour a stronger, thicker and faster-growing biofilm and would thus stimulate biofilm production [8,9,16,44,48]. Based on these works, the decision of investigating different TSB concentrations was made. However, changing the TSB concentration resulted in a variation in the surface tension and, therefore, influenced the final area of the drop used for biofilm growth. Decreasing the TSB concentration made it impossible to cover the expected delimited area as required; hence, the choice of fixing the TSB concentration to the one that was suggested by the supplier.
Therefore, TSB 100% and 3 cm of diameter were chosen to assure a good, homogeneous and full coverage of the polystyrene surface. The selection of these conditions assured a strongly adherent biofilm which did not detach during the rinsing procedure. The biofilm was uniform and highly reproducible in terms of optical density and population density. Such a wide biofilm area is not obtainable with CDC reactors for which the dimensions of the coupons are generally about 1.5 cm in diameter [52]. Another problem when using coupons, is the disruption or alteration of the biofilm due to handling (the removal from the media, rinsing baths) [53]. In the research done by Philips et al., pictures of the biofilms grown inside wells (6-well microplate) visibly demonstrated that the biofilms do not uniformly cover the flat-bottom plates used during the experiments [6]. A careful observation of the biofilm pictures of Philips at al. clarifies that the removed/degraded biofilm parts exactly corresponded with the walls of the wells [6]. A similar situation of biofilm growth was observed in the study of Li et al. [54]. The wells of a 96-well microtiter plate were filled with 100 µL of suspension. After 24 h, thick biofilm was developed in the small central part of the well, and a thin biofilm on the remaining part of the surface, and, extensively, along the wall side. Despite its potential for testing antibiotic compounds in a high-throughput method, the use of 96-well microplates leads to the development of biofilms covering a quite small area with no control on the biofilm growing on the walls of the microplate. This makes a direct inspection difficult or impossible [19]. Additionally, some authors pooled together the scraped biofilm contents of three wells to have a single replicate [53]. Finally, although using petri dishes or tubes could guarantee a wide area coverage, it does not offer control over the biofilms growing on the side walls as previously mentioned [18]. For applications, e.g., in coating science and technology for anti-biofilm applications or regarding non-thermal inactivation technologies (such as light treatment), the development of a biofilm on a flat surface is of extreme importance [40,41,42].
Some studies have investigated the effect of the cell concentrations in biofilm formation, finding that a higher cell concentration resulted in a higher number of bacteria attached to the surface and a higher adhesive strength [20,22,55]. A higher adhesive strength allows the biofilm to resist greater sheer forces, e.g., the rinsing procedure. The idea was to try different inoculum levels to find the conditions leading to stronger attached biofilms with a higher cell density after 24 h. This contributed to interesting and unexpected results. For biofilms grown for 24 h, it was noticed that the number of viable cells was equal, regardless of the initial inoculum level (Figure 3a). However, the biomass of the biofilm increased when the inoculum level was lower (Figure 3b). This was further investigated by studying the dynamics of biofilm growth, both in viable cells and biomass.

4.2. Biofilm Dyamics for Two Inoculum Levels

To understand the evolution of the biofilms on the polystyrene surfaces in terms of biofilm cell density and biomass, its development was studied in time. Different inoculum levels were investigated and CLSM images of the 24-h-grown biofilms were captured. The Baranyi and Roberts (1994) model was fitted to the viable cell counts measured in time to estimate the growth parameters in different conditions [23].

4.2.1. Biofilm Population Density: Growth Parameters

The Baranyi and Roberts (1994) model, which was originally developed for the planktonic form, has previously been used to describe biofilms grown in different batch conditions [23,44,56]. In the present work, the model was adopted to fit the data related to biofilm growth. The biofilms investigated in this study were specifically grown using a protocol that has been developed by the authors.
The use of the Baranyi and Roberts (1994) model and the comparison of the growth curves lead to several findings that will be discussed in detail: (i) the initial population of attached biofilms was proportional to the inoculum concentration; (ii) the slight difference in the lag time between the growth curves was a result of the “surface conditioning”; (iii) the higher µmax for a lower initial concentration was the result of the nutrient availability; and (iv) the growth curves reached similar maximum cell densities [23].
First, the outcomes concerning the growth curves indicated that it can be reasonably assumed that the planktonic cells immediately begin the attachment to and growth on the substratum. The initial populations, ln(No), were proportional to the inoculum concentrations, and these results corroborated that the number of attached bacteria was found to be dependent on these initial cell densities [20,22,55].
However, the bacteria did not need a lot of time to recover from the shock of being transferred onto the surface, as can be understood from the short lag phases (λ). This could be related to the type of substrate that was used in this work, i.e., polystyrene. Polystyrene is a hydrophilic material which facilitates the spread of water and bacterial suspension on it, promoting adhesion [29]. The slightly longer lag phase for the inoculum level of 104 CFU/mL was not surprising. If fewer viable cells were present, they would have spent more time to “condition the surface”. The surface conditioning represents the first stage of biofilm formation. It consists in producing a film of proteins, lipids and polysaccharide molecules by bacteria, which attach to the surface and facilitate biofilm formation. In this specific study, the organic molecules produced by P. fluorescens (e.g., alginate) plus the molecules present in the growth medium (e.g., glucose, soya and casein peptone) facilitated the conditioning of the surface. The microorganisms quickly formed a layer that neutralised excessive surface charges and surface free energy, facilitating growth. Some studies have found that bacteria can also alter the production of some components of the outer cell layer (e.g., lipopolysaccharides, peptidolipids, glycolipid, lipoteichoic acid) making the surface-cell interaction easier. Specifically, this was observed for Pseudomonas aeruginosa [57]. In this specific case, the lag phase can be considered as an adhesion step for biofilms. Cunault et al. investigated the adhesion step of P. fluorescens and Pseudomonas grimontii in different (static and hydrodynamic) conditions mimicking the fresh-cut food equipment process [56]. They highlighted that P. fluorescens is characterised by a rapid adhesion step regardless of the flow conditions and shear stress, as the outcome of this work also confirmed. Although Cunault et al. already underlined that P. fluorescens is characterised by a short lag phase during biofilm growth, a direct comparison of the λ and µmax values was not possible because of the differences in the protocol used to perform the experiments [56].
As can be seen from the mathematical model in Equations (1) and (2), the relative maximum growth rate of the microbial population (µmax), which is observed in the exponential phase of growth, is independent of the concentration of cells. However, a surprising result was to observe a higher maximum growth rate (µmax) of biofilms with an inoculum level of 104 CFU/mL compared to 107 CFU/mL. Since both biofilms have the same initial concentration of nutrients available in their growth medium, the biofilm inoculated at 104 CFU/mL will have a lower nutrient concentration when reaching the initial concentration of the biofilm that was inoculated at 107 CFU/mL. The growth rate is expected to decrease with the nutrient concentration in the given range. As such, it is unlikely that nutrient availability can explain the faster growth rate of the biofilm with the inoculum level of 104 CFU/mL. The same reasoning could be applied to the potential presence of toxic cell metabolites.
A study of Ghanbari et al. demonstrated that biofilms growing under flow conditions developed as mushroom structures at low inoculum levels whereas they developed as a layer of connected colonies at very high inoculum levels [58]. This research was conducted using an agent-based model that was validated using micrographs of the real biofilms that were formed in channel µ-Slides under flow conditions. The authors underlined that the competition between the motile and immotile subpopulations also played a fundamental role [58]. The model of Baranyi and Roberts (1994) is a simple empirical model which, in this specific case, is not able to explain the mechanism behind the differences between the relative maximum growth rates as a result of the different inoculum levels [23]. A dedicated model for biofilms should take into account the complexity of the system since the model in its current form cannot consider different complex phenomena occurring, e.g., adhesion of new cells, trapping of cells, cell detachment or death, cell division [50,56]. All these processes might influence the cell population and its increase within the biofilms.
Finally, the two growth curves reached the same maximum cell density during the stationary phase (plateau). The reason of the plateau was due to the nutrient depletion in the drop, which was similar to the behaviour observed in planktonic form [59]. Other authors, using a modified Gompertz model, investigated the effect of different temperatures and pH on Salmonella Typhimurium biofilm growth, and the population density reached the same value, as well. Despite using an inoculum level of 104 CFU/mL, a population density of 18 ln(CFU/cm2) using a similar static method was obtained. The difference between their protocol and the current research is related to the use of coupon method [60]. Cunault et al. demonstrated that P. fluorescens and P. gismontii followed the Baranyi and Roberts model and reached a stationary phase, regardless of the method used for the biofilm growth, i.e., static (hydrodynamic) in petri dishes or dynamic using other biofilm-developing-methods [23,56]. Pang and Yuk, who investigated the biofilm cell response to food-related stress, obtained P. fluorescens biofilms on coupons (static hydrodynamic method) starting with an inoculum concentration of 106 CFU/mL [35]. Although the authors grew the biofilms for 48 h at 10 °C, they obtained a biofilm equally dense to the one developed in the present research, corresponding to about 7.5 log (CFU/cm2) (corresponding to 17.3 ln (CFU/cm2). Finally, Gazzola et al. also, using a different biofilm-developing-method (flow cell system), underlined that P. fluorescens biofilms reach their steady state between 12 and 60 h, and did not further increase [39]. These studies confirm the reliability of the developed protocol, as the typical growth pattern, i.e., reaching a stationary phase with a dense biofilm (irrespective to the specific inoculum conditions), was reproduced using the novel method proposed.

4.2.2. Biofilm Biomass: Optical Density Evolution and Pellicles

An interesting result was found when the development of the biomass was investigated. Our findings did not support previous research in this field. In fact, the optical density did not follow the Baranyi and Roberts (1994) model, as previous research indicated for biofilms of different strains [23,44]. This means that the total biomass as a function of time is not simply proportional to the biofilm cell density. In the current study, the optical density reached a maximum value and then decreased. It is important to divide the biofilm development into steps to better understand the gradual development and the different features associated with each level: (i) the biofilm grows at the centre of the drop on the polystyrene; (ii) the biofilm grows following a coffee ring shape; (iii) development of biofilm at the A-L interface (pellicles); (iv) destruction of pellicles; (v) thickening of the biofilm on polystyrene.
Observations, emerging from the data, strongly support the idea that the biofilm started to grow at the centre of the drop. This region was characterised by a depletion of oxygen; the cells were stressed and started to grow as biofilms [61].
Then, the biofilm grew at the border of the drop, showing a coffee ring effect, to create a bacterial community able to exploit the higher oxygen availability at the border (oxygen gradient). The growth indicated greater oxygen availability at the border (coffee ring region) which pointed out the gradient along the radial direction of the drop (Figure 1). The coffee ring effect demonstrated the biofilm to thicken at the border.
After this stage, the biofilm started to develop at the A-L interface. What is known about the tendency of P. fluorescens to colonise the surface of a (static) liquid is based on the findings of Koza et al. [62]. The authors claimed that the bacteria produced beta-1,4-linked polymers (alginate-based), which have been referred to as pellicles in other works [62,63,64]. Moreover, the development of biofilms at the A-L interface, compared to the one developed at the polystyrene interface, occurs in a favourable microenvironment where oxygen concentration is high compared to the polystyrene interface [62].
The outcomes of these experiments demonstrated that at the beginning, the A-L biofilm was composed by a single connected pellicle. Successively, the bacterial community started to destroy it [65]. The hypothesis is that P. fluorescens started to produce enzymes (like lipase or esterase) that destroyed the EPS in order to use this material for other survival functions. These degrading enzymes stimulated the dispersal of formed pellicles [66]. When the A-L biofilm starts to be destroyed, it is transformed into several pellicles. These pellicles are reduced into small pieces, resulting in EPS islands floating at the A-L interface (Section 3.4.2).
Finally, the destruction of this biomass corresponded to a thickening and reinforcement on the biofilm grown on the polystyrene surface. After a total of 24 h, the biofilm on the polystyrene surface became thick and uniform on the full, delimited area. The coffee ring effect is no longer visible.
It is thought that flagella’s presence promotes the development of biofilms in batch systems as they are generally associated with motility [67,68,69]. Flagella genes and biosurfactant genes have indeed been identified inside the genome sequence of the P. fluorescens ATCC 13525 chosen for this study [70]. Based on different studies; however, it was found and confirmed that bacteria grow as biofilms on A-L interface, regardless of the absence of flagella, and that cell motility could have a major relevance [71]. Sinibaldi et al., in a study characterising the constrained motion of Escherichia coli at the A-L interface, described in detail the clockwise motion of single bacterial cells (flagellated bacteria) and the rafting of the microcolonies, which did not show a preferential motion [65]. The authors explained the phenomenon of formation of microcolonies after the collision of two single-swimmers, the growth of the microcolonies by collision of a single swimmer with a pre-formed microcolony followed by a merging process, and even the disruption phenomenon. After disaggregation, the sub-microcolonies start to float independently [65]. Another study done by Houdry et al., where the authors investigated mutants of Bacillus cereus, a food-borne pathogen (wild-type, non-flagellated, flagellated but not motile), underlined that motility promotes biofilm formation and allows the bacteria to grow at the A-L interface [71]. The development of the biomass as indicated by the optical density demonstrates that the optical density peaks (Section 3.4.2.) occurred just before the stationary phase (for both inoculum levels). This result was not anticipated. The comparison of the cell density (Figure 4) and biofilm biomass (Figure 5a) development in time revealed that the increase of the total biomass was merely related to an increase of the EPS. This overproduction of EPS did not occur at the expenses of living cell. It is well known that P. fluorescens can increase the EPS production in certain conditions. Allen et al. claimed that P. fluorescens produced a higher quantity of EPS in early-stage biofilms, when low nutrient levels were applied [14].

4.3. Understanding Biofilm Development and Growth

Confocal images confirmed that the biofilm is protected from external (chemical and physical) agents by a thin layer of EPS. This layer, covering the cells underneath, behaves as a barrier, as previous authors observed with the same strain [14]. The layers in direct contact with the polystyrene surface were mainly composed of living cells (the predominant emitted wavelength was green associated with living cells (Section 3.4). However, dead cells and the EPS were also present in small quantities along the depth profile. The CLSM images showed the presence of water channels of different dimensions and a connected matrix surrounding cell clusters and micro-colonies, as confirmed by previous published studies on biofilms of Pseudomonas sp. [1]. The CLSM images confirmed that a period of 24h allowed the bacteria to establish a dense biofilm on the polystyrene surface, and this allowed elaborating some hypothesis on what happened during overnight growth.
The findings related to the biofilm biomass development, the biofilm cell density and CLSM images demonstrated that the start of the biofilm took place on the polystyrene surface but mainly in the centre of the area covered with the suspension. Afterwards, the biofilm started to develop following a coffee ring shape, most likely due to the oxygen availability at the edge of the drop. After that, the biofilm started to form at the A-L interface (pellicles formation). Successively, the pellicle biomass was used to the advantage of the biofilm growing on the polystyrene: the biofilm became thicker, reinforced and stronger. Most likely, this process was mediated by enzymes, as previously mentioned (Section 4.2.2.). After 24 h, the biofilm on the polystyrene is full-grown exhibiting the normal structure of a mature biofilm, composed of bacteria embedded in the EPS, as CLSM images demonstrated. This development is followed in static (hydrodynamic) conditions regardless the inoculum levels.

4.4. Validation of the Protocol for Different Bacterial Strain: S. epidermidis

To validate the protocol for Gram-positive bacteria, Staphylococcus epidermidis was selected. S. epidermidis was chosen for this purpose because of the different characteristics in shape, genus, Gram nature, and EPS production. Staphylococcus genera are characterized by the production of polysaccharide intercellular adhesin (PIA) that has a major and crucial role in the adhesion of the biofilm to surfaces and in antibiotic resistance [25,26]. The evolution of the S. epidermidis population within the biofilm showed a sigmoidal curve following the Baranyi and Roberts (1994) model, similar as for P. fluorescens [23]. Even though the Gram-positive S. epidermidis reached a lower maximum biofilm population density in the 24 h mature biofilms, the development of the biofilm on the polystyrene surface occurred faster compared to the Gram-negative P. fluorescens. Regarding the development of the biofilm biomass, S. epidermidis did not show the pellicles formation and coffee ring effect. The biofilms demonstrated to be highly reproducible in terms of biomass and population density demonstrating the reliability of the protocol for several application e.g., for testing antimicrobial and antibiofilm coatings/films, surface treatments and physical treatments [40,41,42,72].

5. Conclusions

The present work is the first study to develop (i) an easy-to-use protocol for obtaining highly reproducible biofilms, (ii) on a completely flat polystyrene surface that facilitates the biofilm handling avoiding disruption, (iii) with no need for sophisticated and expensive technologies for biofilms growth (e.g., CDC reactors). The 24-h-grown biofilms completely covered the defined area. The resulting biofilms strongly attached to the polystyrene petri dish and remained there, even after rinsing. The ability to grow biofilms on a completely flat surface has a great potential for testing antimicrobial and antibiofilm coatings/films, surface treatments and physical treatments (e.g., based on light). The use of polystyrene surfaces makes this new protocol suitable for application in every laboratory without the need for biofilm growth reactors. The protocol mimics the transition from planktonic to biofilm that happens on every kind of surface that happens after contamination of surfaces in real life. A similar protocol could be followed for different bacteria; however, the choice of P. fluorescens was made based on it being BSL-1 and of crucial interest within the food industry, households and heath care. The development of biofilms was studied in terms of viable cells and biomass. The use of the Baranyi and Roberts (1994) model shows a steady state after 24 h [23]. The dynamics allowed the estimation of the growth parameters and permitted a comparison between the two inoculum levels. The growth rate and initial attached population depended on the inoculum density, while the estimated maximum population in static conditions was the same for the two inoculum levels. Additionally, the total biomass development of the batch system under investigation did not follow the Baranyi and Roberts (1994) model but rather a different kinetics reaching a maximum value and then decreasing to a plateau. The findings add to a growing body of research on biofilm development and confirm the importance of enumeration of both the viable cell population and quantification of the total biomass to determine when the biofilms reach a type of steady state/equilibrium. CLSM confirmed that overnight growth allowed the development of densely packed biofilms with a mature 3D structure and water channels. The biomass investigation also allowed a better understanding of the development of the biofilms of P. fluorescens, first on the polystyrene surface and successively at the air-liquid interface of the inoculum suspension. It was observed that an increase in the biomass did not necessarily mean an increase in the viable cell concentration within the biofilm and did not necessarily result in a thicker or more adherent biofilm. Based on that, attention should be payed to the distribution of the biofilm on the surface under investigation, in order to avoid misinterpretation. This is especially true when dealing with small surfaces, such as the wells of micro well plates, where the distribution of the biofilm is complicated to observe. The complexity of biofilm lifestyle requires an extended experimental investigation of biofilm proliferation to have a better understanding of biofilm behaviour and formation pattern. The protocol was developed on a Gram-negative bacterium, P. fluorescens, and validated on a Gram-positive one, S. epidermidis, demonstrating the wide applicability. As such, the present study explored biofilm development on widely used polystyrene surfaces, adds knowledge to the research in biofilm science and indicates the wide applicability of the developed method.

Author Contributions

Individual contributions of each of the authors to the research are the following: conceptualisation, V.A., C.S., S.A., B.H., A.C. and J.F.M.V.I.; methodology, V.A., T.A. and B.H.; software, V.A., C.S. and S.A.; validation, V.A.; formal analysis, V.A.; investigation, V.A.; resources, J.F.M.V.I.; data curation, V.A.; writing—original draft preparation, V.A.; writing—review and editing, V.A., C.S., S.A., T.A., B.H., A.C. and J.F.M.V.I.; visualization, V.A.; supervision, C.S., S.A., A.C. and J.F.M.V.I.; project administration, A.C. and J.F.M.V.I.; funding acquisition, J.F.M.V.I. All authors have read and agreed to the published version of the manuscript.

Funding

This research was funded by project Bioclean MSCA–ITN-722871 of the HORIZON 2020 EU Framework Programme for Research and Innovation, by project C24/18/046 of the KU Leuven Research Council and by project G.0863.18 of the Research Foundation–Flanders. Simen Akkermans was supported by the Research Foundation-Flanders under grant 1224620N.

Conflicts of Interest

The authors declare no conflict of interest.

References

  1. Hentzer, M.; Teitzel, G.M.; Balzer, G.J.; Heydorn, A.; Molin, S.; Givskov, M.; Parsek, M.R. Alginate overproduction affects Pseudomonas aeruginosa biofilm structure and function. J. Bacteriol. 2001, 183, 5395–5401. [Google Scholar] [CrossRef] [PubMed] [Green Version]
  2. Baum, M.M.; Kainović, A.; O’Keeffe, T.; Pandita, R.; McDonald, K.; Wu, S.; Webster, P. Characterization of structures in biofilms formed by a Pseudomonas fluorescens isolated from soil. BMC Microbiol. 2009, 9, 103. [Google Scholar] [CrossRef] [PubMed] [Green Version]
  3. Costerton, J.W.; Stewart, P.S.; Greenberg, E.P. Bacterial biofilms: A common cause of persistent infections. Science 1999, 284, 1318–1322. [Google Scholar] [CrossRef] [PubMed] [Green Version]
  4. Flemming, H.C.; Wingender, J. The biofilm matrix. Nat. Rev. Microbiol. 2010, 8, 623–633. [Google Scholar] [CrossRef]
  5. Hung, C.-C.; Santschi, P.H.; Gillow, J.B. Isolation and characterization of extracellular polysaccharides produced by Pseudomonas fluorescens Biovar II. Carbohydr. Polym. 2005, 61, 141–147. [Google Scholar] [CrossRef]
  6. Philips, J.; Rabaey, K.; Lovley, D.R.; Vargas, M. Biofilm formation by Clostridium ijungdahlii is induced by sodium chloride stress: Experimental evaluation and transcriptome analysis. PLoS ONE 2017, 12, e0170406. [Google Scholar] [CrossRef]
  7. Parsek, M.R.; Val, D.L.; Hanzelka, B.L.; Cronan, J.J.E.; Greenberg, E.P. Acyl homoserine-lactone quorum-sensing signal generation. PNAS 1999, 96, 4360–4365. [Google Scholar] [CrossRef] [Green Version]
  8. Dewanti, R.; Wong, A.C.L. Influence of culture conditions on biofilm frmation by Escherichia coli O157:H7. Int. J. Food Microbiol. 1995, 26, 147–164. [Google Scholar] [CrossRef]
  9. Speranza, B.; Corbo, M.R.; Sinigaglia, M. Effects of nutritional and environmental conditions on Salmonella sp. biofilm formation. J. Food Sci. 2011, 1, 12–16. [Google Scholar] [CrossRef]
  10. Bonin, E.; dos Santos, A.R.; Fiori da Silva, A.; Favero, M.E.; Campanerut-Sá, P.A.Z.; de Freitas, C.F.; Caetano, W.; Hioka, N.; Mikcha, J.M.G. Photodynamic inactivation of foodborne bacteria by eosin Y. J. Appl. Micorbiol. 2018, 124, 1617–1628. [Google Scholar] [CrossRef]
  11. Bonneville, L.; Ortiz, S.; Maia, V.; Brito, L.; Martínez-Suárez, J.V. Strain and Growth Conditions may Regulate Resistance of Listeria monocytogenes Biofilms to Benzalkonium Chloride. Appl. Sci. 2020, 10, 988. [Google Scholar] [CrossRef] [Green Version]
  12. Galdiero, E.; Di Onofrio, V.; Maione, A.; Gambino, E.; Gesuele, R.; Menale, B.; Ciaravolo, M.; Carraturo, M.; Guida, M. Allium ursinum and Allium oschaninii against Klebsiella pneumoniae and Candida albicans Mono- and Polymicrobic Biofilms in In Vitro Static and Dynamic Models. Microorganisms 2020, 8, 336. [Google Scholar] [CrossRef] [PubMed] [Green Version]
  13. Vikram, A.; Bomberger, J.M.; Bibby, K.J. Efflux as a glutaraldehyde resistance mechanism in Pseudomonas fluorescens and Pseudomonas aeruginosa biofilms. Antimicrob. Agents Chemother. 2015, 59, 3433–3440. [Google Scholar] [CrossRef] [PubMed] [Green Version]
  14. Allen, A.; Habimana, O.; Casey, E. The effects of extrinsic factors on the structural and mechanical properties of Pseudomonas fluorescens biofilms: A combined study of nutrient concentrations and shear conditions. Colloids Surf. B Biointerfaces 2018, 165, 127–134. [Google Scholar] [CrossRef]
  15. Skowron, K.; Wiktorczyk, N.; Kwiecińska-Piróg, J.; Sękowska, A.; Wałecka-Zacharska, E.; Gospodarek-Komkowska, E. Elimination of Klebsiella pneumoniae NDM from the air and selected surfaces in hospital using radiant catalytic ionization. Lett. Appl. Microbiol. 2019, 69, 333–338. [Google Scholar] [CrossRef] [PubMed]
  16. Stepanović, S.; Cirković, I.; Ranin, L.; Svabić-Vlahović, M. Biofilm formation by Salmonella spp. and Listeria monocytogenes on plastic surface. Lett. Appl. Microbiol. 2004, 38, 428–432. [Google Scholar] [CrossRef]
  17. Pousti, M.; Zarabadi, M.P.; Amirdehi, M.A.; Paquet-Mercier, F.; Greener, J. Microfluidic bioanalytical flow cells for biofilm studies: A review. Analyst 2019, 144, 68–86. [Google Scholar] [CrossRef]
  18. Passerini, D.; Fécamp, F.; Marchand, L.; Kolypczuk, L.; Bonnetot, S.; Sinquin, C.; Verrez-Bagnis, V.; Hervio-Heath, D.; Colliec-Jouault, S.; Delbarre-Ladrat, C. Characterization of biofilm extracts from two marine bacteria. Appl. Sci. 2019, 9, 4971. [Google Scholar] [CrossRef] [Green Version]
  19. Lorenzo, F.; Sanz-Puig, M.; Bertó, R.; Orihuel, E. Assessment of performance of two rapid methods for on-site control of microbial and biofilm contamination. Appl. Sci. 2020, 10, 744. [Google Scholar] [CrossRef] [Green Version]
  20. Duddridge, J.; Kent, C.; Laws, J. Effect of surface shear stress on the attachment of Pseudomonas fluorescens to stainless steel under defined flow conditions. Biotechnol. Bioeng. 1982, 24, 153–164. [Google Scholar] [CrossRef]
  21. Assanta, M.A.; Roy, D.; Montpetit, D. Adhesion of Aeromonas hydrophila to water distribution system pipes after different contact times. J. Food Prot. 1998, 61, 1321–1329. [Google Scholar] [CrossRef]
  22. Chen, M.J.; Zhang, Z.; Bott, T.R. Effects of operating conditions on the adhesive strength of Pseudomonas fluorescens biofilms in tubes. Colloids Surf. B Biointerfaces 2005, 43, 61–71. [Google Scholar] [CrossRef] [PubMed]
  23. Baranyi, J.; Roberts, T.A. Mathematics of predictive food microbiology. Int. J. Food Microbiol. 1994, 95, 199–218. [Google Scholar] [CrossRef] [Green Version]
  24. Kozajda, A.; Jeżak, K.; Kapsa, A. Airborne Staphylococcus aureus in different environments—A review. Environ. Sci. Pollut. Res. 2019, 26, 34741–34753. [Google Scholar] [CrossRef] [Green Version]
  25. Otto, M. Staphylococcal Biofilms. Microbiol. Spectr. 2018, 6, 4. [Google Scholar] [CrossRef] [PubMed]
  26. Stanley, N.R.; Lazazzera, B.A. Environmental signals and regulatory pathways that influence biofilm formation. Mol. Microbiol. 2004, 52, 917–924. [Google Scholar] [CrossRef] [PubMed]
  27. Schellenberg, J.; Leder, H.-J. Syndiotactic polystyrene: Process and applications. Adv. Polym. Technol. 2006, 25, 141–151. [Google Scholar] [CrossRef]
  28. Ho, B.T.; Roberts, T.K.; Lucas, S. An overview on biodegradation of polystyrene and modified polystyrene: The microbial approach. Crit. Rev. Biotechnol. 2018, 38, 308–320. [Google Scholar] [CrossRef]
  29. Guruvenket, S.; Rao, G.M.; Komath, M.; Raichurc, A.M. Plasma surface modification of polystyrene and polyethylene. Appl. Surf. Sci. 2004, 236, 278–284. [Google Scholar] [CrossRef] [Green Version]
  30. Lerman, M.J.; Lembong, J.; Muramoto, S.; Gillen, G.; Fisher, J.P. The evolution of polystyrene as a cell culture material. Tissue Eng. Part B Rev. 2018, 24, 359–372. [Google Scholar] [CrossRef] [Green Version]
  31. Janek, T.; Czyżnikowska, Ż.; Łukaszewicz, M.; Gałęzowska, J. The effect of Pseudomonas fluorescens biosurfactant pseudofactin II on the conformational changes of bovine serum albumin: Pharmacheutical and biomedical applications. J. Mol. Liquids 2019, 288, 111001. [Google Scholar] [CrossRef]
  32. Ude, S.; Arnold, D.L.; Moon, C.D.; Timms-Wilson, T.; Spiers, A.J. Biofilm formation and cellulose expression among diverse environmental Pseudomonas isolates. Environ. Microbiol. 2006, 8, 1997–2011. [Google Scholar] [CrossRef] [PubMed]
  33. Scale, B.S.; Dickson, R.P.; LiPuma, J.J.; Huffnagle, G.B. Microbiology, genomics, and clinical significance of the Pseudomonas fluorescens scpecies complex, an unappreciated colonizer of humans. Clin. Microbiol. Rev. 2014, 27, 927–948. [Google Scholar] [CrossRef] [PubMed] [Green Version]
  34. Banin, E.; Vasil, M.L.; Greenberg, E. Iron and Pseudomonas aeruginosa biofilm formation. PNAS USA 2005, 102, 11076–11081. [Google Scholar] [CrossRef] [Green Version]
  35. Pang, X.; Yuk, H.-G. Effects of the colonization sequence of Listeria monocytogenes and Pseudomonas fluorescens on survival of biofilm cells under food-related stresses and transfer to salmon. Food Microbiol. 2019, 82, 142–150. [Google Scholar] [CrossRef]
  36. Wei, H.; Zhang, L. Quorum-sensing system influences root colonization and biological control ability in Pseudomonas fluorescens 2P24. Antonie Van Leeuwenhoek 2006, 89, 267–280. [Google Scholar] [CrossRef]
  37. Quintieri, L.; Fanelli, F.; Caputo, L. Antibiotic resistant Pseudomonas spp. Spoilers in fresh dairy products: An underestimated risk and the control strategies. Foods 2019, 8, 372. [Google Scholar] [CrossRef] [Green Version]
  38. Bekker, A.; Steyn, L.; Charimba, G.; Jooste, P.; Hugo, C. Comparison of the growth kinetics and proteolytic activities of Chryseobacterium species and Pseudomonas fluorescens. Can. J. Microbiol. 2015, 61, 977–982. [Google Scholar] [CrossRef] [Green Version]
  39. Gazzola, G.; Habimana, O.; Quinn, L.; Casey, E.; Murphy, C.D. Population dynamics of a dual Pseudomonas putida-Pseudomonas fluorescens biofilm in a capillary bioreactor. Biofouling 2019, 35, 299–307. [Google Scholar] [CrossRef]
  40. Cattò, C.; Cappitelli, F. Testing anti-biofilm polymeric surfaces: Where to start? Int. J. Mol. Sci. 2019, 20, 3794. [Google Scholar] [CrossRef] [Green Version]
  41. Jalvo, B.; Faraldos, M.; Bahamonde, A.; Rosal, R. Antimicrobial and antibiofilm efficacy of self-cleaning surfaces functionalized by TiO2 photocatalytic nanoparticles against Staphylococcus aureus and Pseudomonas putida. J. Hazard Mater. 2017, 340, 160–170. [Google Scholar] [CrossRef] [PubMed]
  42. Angarano, V.; Smet, C.; Akkermans, S.; Watt, C.; Chieffi, A.; Van Impe, J.F.M. Visible light as an antimicrobial strategy for inactivation of Pseudomonas fluorescens and Staphylococcus epidermidis biofilms. Antibiotics 2020, 9, 171. [Google Scholar] [CrossRef] [PubMed] [Green Version]
  43. Herigstad, B.; Hamilton, M.; Heersink, J. How to optimize the drop plate method for enumerating bacteria. J. Microbiol. Methods 2001, 44, 121–129. [Google Scholar] [CrossRef]
  44. Govaert, M.; Smet, C.; Baka, M.; Janssens, T.; Van Impe, J.F.M. Influence of incubation conditions on the formation of model biofilms by Listeria monocytogenes and Salmonella Typhimurium on abiotic surfaces. J. Appl. Microbiol. 2018. [Google Scholar] [CrossRef] [PubMed]
  45. Achinas, S.; Charalampogiannis, N.; Euverink, G.J.W. A Brief Recap of Microbial Adhesion and Biofilms. Appl. Sci. 2019, 9, 2801. [Google Scholar] [CrossRef] [Green Version]
  46. Herald, P.J.; Zottola, E.A. Attachment of Listeria monocytogenes to stainless steel surfaces at various temperatures and pH values. J. Food Sci. 1988, 53, 1549–1562. [Google Scholar] [CrossRef]
  47. Shi, X.; Zhu, X. Biofilm formation and food safety in food industries. Trends Food Sci. Technol. 2009, 20, 407–413. [Google Scholar] [CrossRef]
  48. Gerstel, U.; Römling, U. Oxygen tension and nutrient starvation are major signals that regulate agfD promoter activity and expression of the multicellular morphotype in Salmonella Typhimurium. Environ. Microbiol. 2001, 3, 638–648. [Google Scholar] [CrossRef]
  49. Xu, K.D.; Stewart, P.S.; Fuhu, X.; Huang, C.-T.; McFeters, G.A. Spatial physiological heterogeneity in Pseudomonas aeruginosa biofilm is determined by oxygen availability. Appl. Environ. Microbiol. 1998, 64, 4035–4039. [Google Scholar] [CrossRef] [Green Version]
  50. Lewandowski, Z.; Altobelli, S.A.; Fukushima, E. NMR and microelectrode studies of hydrodynamics and kinetics in biofilms. Biotechnol. Prog. 1993, 9, 40–45. [Google Scholar] [CrossRef]
  51. Borer, B.; Tecon, R.; Or, D. Spatial organization of bacterial populations in response to oxygen and carbon counter-gradient in pore networks. Nat. Commun. 2018, 22, 769. [Google Scholar] [CrossRef] [Green Version]
  52. Ausbacher, D.; Lorenz, L.; Pitts, B.; Stewart, P.S.; Goeres, D.M. Paired methods to measure biofilm killing and removal: A case study with Penicillin G treatment of Staphylococcus aureus biofilm. Lett. Appl. Microbiol. 2018, 66, 231–237. [Google Scholar] [CrossRef] [PubMed] [Green Version]
  53. Ferrer-Espada, R.; Liu, X.; Goh, X.S.; Sharo, X. Antimicrobial blue light inactivation of polymicrobial biofilms. Front. Microbiol. 2019, 10, 721. [Google Scholar] [CrossRef] [PubMed]
  54. Li, H.; Liu, F.; Peng, W.; Yan, K.; Zhao, H.; Liu, T.; Cheng, H.; Chang, P.; Yuan, F.; Chen, H.; et al. The CpxA/CpxR two-component system Affects biofilm formation and virulence in Actinobacillus pleuropneumoniae. Front. Cell. Infect. Microbiol. 2018, 8, 72. [Google Scholar] [CrossRef]
  55. Droste, R.L.; Andras, E.; Kennedy, K.J. Initial biofilm formation of acetoclastic methanogenic bacteria. Biofouling J. Bioadhes. Biofilm Res. 1990, 2, 191–210. [Google Scholar] [CrossRef]
  56. Cunault, C.; Faille, C.; Briandet, R.; Postollec, F.; Desriac, N.; Benezech, T. Pseudomonas sp. biofilm development on fresh-cut food equipment surfaces—A growth curve—Fitting approach to building a comprehensive tool for studying surface contamination dynamics. Food Bioprod. Process. 2018, 107, 70–87. [Google Scholar] [CrossRef]
  57. Neu, T.R. Significance of bacterial surface-active compounds in interaction of bacteria with interfaces. Microbiol. Rev. 1996, 60, 151–166. [Google Scholar] [CrossRef] [PubMed]
  58. Ghanbari, A.; Dehghany, J.; Schwebs, T.; Müsken, M.; Häussler, S.; Meyer-Hermann, M. Inoculation density and nutrient level determine the formation of mushroom-shaped structures in Pseudomonas aeruginosa biofilms. Sci. Rep. 2016, 6, 32097. [Google Scholar] [CrossRef]
  59. Lange, R.; Hengge-Aronis, R. Growth phase-regulated expression of bolA and morphology of stationary-phase Escherichia coli cells are controlled by the novel sigma factor sigma S. J. Bacteriol. 1991, 173, 4474–4481. [Google Scholar] [CrossRef] [Green Version]
  60. Nguyen, H.D.N.; Yang, Y.S.; Yuk, H.G. Biofilm formation of Salmonella Typhimurium on stainless steel and acrylic surfaces as affected by temperature and pH level. LWT Food Sci. Technol. 2014, 55, 383–388. [Google Scholar] [CrossRef]
  61. Sabra, W.; Kim, E.; Zeng, A. Physiological responses of Pseudomonas aeruginosa PAO1 to oxidative stress in controlled microaerobic and aerobic cultures. Microbiology 2002, 148, 3195–3202. [Google Scholar] [CrossRef] [PubMed] [Green Version]
  62. Koza, A.; Hallett, P.D.; Moon, C.D.; Spiers, A.J. Characterization of a novel air-liquid interface biofilm of Pseudomonas fluorescens SBW25. Microbiology 2009, 155, 1397–1406. [Google Scholar] [CrossRef] [Green Version]
  63. Wang, S.; Liu, X.; Liu, H.; Zhang, L.; Guo, Y.; Yu, S.; Wozniak, D.J.; Ma, L.Z. The exopolysaccharide Psl–eDNA interaction enables the formation of a biofilm skeleton in Pseudomonas aeruginosa. Environ. Microbiol. Rep. 2015, 7, 330–340. [Google Scholar] [CrossRef] [PubMed] [Green Version]
  64. Marsden, A.E.; Grudzinski, K.; Ondrey, J.M.; Deloney-Marino, C.R.; Visick, K.L. Impact of Salt and Nutrient Content on Biofilm Formation by Vibrio fischeri. PLoS ONE 2017, 12, e0169521. [Google Scholar] [CrossRef] [PubMed]
  65. Sinibaldi, G.; Iebba, V.; Chinappi, M. Swimming and rafting of E.coli microcolonies at air–liquid interfaces. MicrobiologyOpen 2018, 7. [Google Scholar] [CrossRef]
  66. Abee, T.; Kovács, A.T.; Kuipers, O.P.; van der Veen, S. Biofilm formation and dispersal in Gram-positive bacteria. Curr. Opin. Biotechnol. 2011, 22, 172–179. [Google Scholar] [CrossRef] [PubMed] [Green Version]
  67. Lemon, K.P.; Higgins, D.E.; Kolter, R. Flagellar motility is critical for Listeria monocytogenes biofilm formation. J. Bacteriol. 2007, 189, 4418–4424. [Google Scholar] [CrossRef] [Green Version]
  68. Pratt, L.A.; Kolter, R. Genetic analysis of Escherichia coli biofilm formation: Roles of flagella, motility, chemotaxis and type I pili. Mol. Microbiol. 1998, 30, 285–293. [Google Scholar] [CrossRef]
  69. Kirov, S.M.; Castrisios, M.; Shaw, J.G. Aeromonas flagella (polar and lateral) are enterocyte adhesins that contribute to biofilm formation on surfaces. Infect. Immun. 2004, 72, 1939–1945. [Google Scholar] [CrossRef] [Green Version]
  70. Meier, M.J.; Subasinghe, R.M.; Beaudette, L.A. Draft genome sequence of the industrially significant bacterium Pseudomonas fluorescens ATCC 13525. Microbiol. Resour. Announc. 2018, 7, 17. [Google Scholar] [CrossRef] [PubMed] [Green Version]
  71. Houry, A.; Briandet, R.; Aymerich, S.; Gohar, M. Involvement of motility and flagella in Bacillus cereus biofilm formation. Microbiology 2010, 156, 1009–1018. [Google Scholar] [CrossRef] [PubMed] [Green Version]
  72. Taha, M.; Culibrk, B.; Kalab, M.; Schubert, P.; Yi, Q.-L.; Goodrich, R.; Ramirez-Arcos, S. Efficiency of riboflavin and ultraviolet light treatment against high levels of biofilm-derived Staphylococcus epidermidis in buffy coat platelet concentrates. Vox Sang. 2017, 112, 408–416. [Google Scholar] [CrossRef] [PubMed]
Figure 1. Overview of biofilms with different diameters (1.5, 2.0 and 3.0 cm). Optical densities and standard deviations obtained with CV assay (first row) measured and calculated based on three independent replicates. Pictures of stained biofilms (second row). Images comparing the area sizes (third row). The radial directions are represented with red rightwards arrows, while the diameters are represented with black double-headed arrows. Cross-sections (fourth row). The thickness is represented by a red double-headed arrow, the centre of the drop/area is represented by a black spot and the border of the drop is delimited by green lines.
Applsci 10 04544 g001
Figure 2. Drops with an inoculum level of 107 CFU/mL and different TSB concentrations of 30.0, 15.0, 3.0 and 1.5 g/L, correspond to (a), (b), (c) and (d), respectively. The red circles highlight the expected area sizes to be covered. The arrows highlight discrepancy between expected covered area and uncovered parts due to the different superficial tension of the suspensions.
Applsci 10 04544 g002
Figure 3. Optical density at 590 nm (violet bars, right y-axis) after CV staining and biofilm cell densities (blue bars, left y-axis) measured for 24-h-grown biofilms obtained with different inoculum levels: 104, 105, 106 and 107 CFU/mL. The error bars indicate standard deviation on three independent replicates. The statistical analysis was carried out separately on the two sets of data. Data bearing different letters (no letter in common) are significantly different (p ≤ 0.05).
Applsci 10 04544 g003
Figure 4. Population density during P. fluorescens biofilm development: black and blue dots are related to inoculum levels of 104 and 107 CFU/mL, respectively. Baranyi and Roberts (1994) model fits follow the same colours: blue line for 104 and black line for 107 CFU/mL inoculum level [23].
Applsci 10 04544 g004
Figure 5. (a) Development of the P. fluorescens biofilm biomass after CV staining. Optical density (OD590) variation in time obtained with 104 (black dots) and 107 (blue dots) CFU/mL inoculum levels. (b) Pictures of stained biofilms during its formation and development: pictures (1), (2), (3), (4) and (5) correspond to 3h, 4h30, 6h, 7h30 and 9h of growth, while (6) corresponds to 24-h-grown biofilm. (c) Pellicles corresponding to the biofilm formed at the air-liquid interface, after adding PBS solution. In picture (1), a whole pellicle covering the entire interface can be observed; from (2) to (4), it is destroyed in gradually smaller fractions, floating at the interface.
Applsci 10 04544 g005
Figure 6. Confocal laser scanning microscopy images of a z-stack in the centre of the biofilm: biofilm stained with (a) calcofluor white (CFW) solution displaying the EPS; (b) SYTO9 displaying the alive cells and extracellular DNA; (c) propidium iodide (PI) displaying the dead cells; (d) overlapping of the three channels of excitation for CFW, SYTO9 and PI; (e) z-stack 3D reconstruction of 24-h-grown biofilm. The bars represent 25 µm in (a), (b) and (c), 100 µm in (d).
Applsci 10 04544 g006
Figure 7. Development of the S. epidermidis biofilm for protocol validation with inoculum levels of 107 CFU/mL: (a) population density fitted by the Baranyi and Roberts (1994) model [23]; and (b) biofilm biomass after CV staining by means of optical density (OD590).
Applsci 10 04544 g007
Table 1. Growth parameters. Parameters obtained from the Baranyi and Roberts (1994) model fits for inoculum levels of 104 and 107 CFU/mL [23]. The table displays the lag time (λ), maximum specific growth rate (µmax), the initial ln(N0) and the maximum cell density ln(Nmax), the absolute increase of population, the Root-Mean-Square-Error (RMSE) and the respective standard errors (SE). Parameters bearing different superscript (no letter in common) are significantly different (p ≤ 0.05).
ParameterInoculum Level [CFU/mL]
Estimated Value104107
λ [h]3.28 ± 0.80 b1.00 ± 0.65 a
µmax [1/h]0.791 ± 0.057 b0.472 ± 0.040 a
ln(No) [ln(CFU/cm2)]6.00 ± 0.35 b13.26 ± 0.11 a
ln(Nmax) [ln(CFU/cm2)]18.14 ± 0.18 a17.94 ± 0.07 a
Population increase [ln(CFU/cm2)]12.14 ± 0.39 b4.68 ± 0.13 a
RMSE0.54790.1570

