Featured Application
This paper concluded that liquefaction resistance of sand increases with the increasing of cyclic loading frequency based on a series of cyclic direct simple shear tests. In practical terms, compared to the frequency of a seismic excitation, a lower loading frequency used in laboratory tests has an under-estimation of the liquefaction resistance of sand, which could render designs costly. Furthermore, the results from this study could be used in the calibration of numerical study on the liquefaction prediction of sand.
Abstract
The frequency of ground motions during earthquakes is typically in the order of a few hertz. As the earthquake-induced liquefaction of soils is widely assessed by performing laboratory tests, it is necessary to consider various loading frequencies generated by real earthquakes. The effect of loading frequency has been studied by cyclic triaxial tests; however, it has rarely been investigated by cyclic direct simple shear tests, which are more similar to the cyclic loading conditions associated with earthquakes. In this study, a series of cyclic direct simple shear tests were performed on clean sand with a relative density (Dr) of 40% (loose sand) and 80% (dense sand), obtained from Nakdong River. The parameters considered are the initial vertical effective stresses (σv0′ = 50, 100, and 200 kPa) and the loading frequencies (f = 0.05, 0.1, 0.5, and 1 Hz) to evaluate the effect of the loading frequency on the liquefaction prediction of clean sand. The results showed that the liquefaction resistance of the sand increases with the increase in the loading frequency, regardless of the initial vertical effective stress and relative density. When the loading frequency increased from 0.1 to 0.5 or 1 Hz, the maximum increase in the cyclic resistances were 15%, and 19% for loose and dense sand, respectively. For a given loading frequency, the liquefaction resistance of the sand decreased when the initial vertical effective stress increased.
1. Introduction
The frequency of a seismic excitation, varying mostly from 0 to 15 Hz [1], indicates that loading frequency is an important factor influencing the liquefaction behavior of soil layers. In order to predict the liquefaction induced by earthquakes accurately, the loading frequency effect should be considered in laboratory tests. The effect of the loading frequency for the liquefaction resistance of sand has been studied for a wide range of loading frequencies from 0.05 to 12 Hz, mostly by conducting cyclic triaxial tests on medium saturated sand, and failure criteria based on the axial strain and excess pore pressure ratio have been randomly employed. Nevertheless, conclusions about the effect of the loading frequency on the liquefaction resistance of sand are contradictory. Several investigators have found that the undrained cyclic strength of saturated sand is negligibly small or uninfluenced by the loading frequency [2,3,4,5,6,7,8]. Using limited data, Peacock and Seed [9] investigated the effect of frequency in the range 0.17–4 Hz on the liquefaction resistance of saturated Monterey sand by using a Roscoe-type simple shear apparatus. They noted that the effect of frequency variation was small since their data for medium sand with relative density (Dr) of 50% were scatted within ±10% of the mean shear stress, causing failure in 10 cycles, with no special order prevailing. Lee and Fitton [10] conducted cyclic triaxial tests on medium saturated sand at frequencies of 0.17 and 1 Hz and found that the sand appeared to have a slightly lower strength at the lower loading frequencies. They also pointed out that the difference in the observed strength was of the same order of magnitude as the scatter in some of the data for a typical series of tests at one frequency on supposedly identical samples. In contrast, some researchers, including Feng and Zhang [11] and Zhang et al. [12], have examined the effect of the loading frequency on the cyclic strength in the frequency range 0.05–2 Hz and obtained a consistent result: in the cyclic triaxial test, the liquefaction resistance of sand increases significantly with an increase in the loading frequency, regardless of the relative density state. Guo and He [13] investigated the influence of the loading frequency on saturated loose (Dr = 28%) and dense (Dr = 70%) sand at isotropic consolidation levels of 100 and 200 kPa by conducting cyclic triaxial experiments. They found that varying the frequency from 0.05 to 1 Hz led to an increase in the cyclic strength, with the increase ranging from 12.4%–33.3%. Mulilis et al. [14] reported that the liquefaction resistance of loose Monterey sand tested at a frequency of 0.017 Hz was greater than that tested at a frequency of 1 Hz by about 12%. Table 1 summarizes previous studies that have investigated the effect of the loading frequency on the liquefaction resistance of sand.

Table 1.
Literature review on loading frequency effect.
The effect of the loading frequency on the liquefaction resistance of saturated sand has been investigated primarily through cyclic triaxial tests. Except for Peacock and Seed [9], mentioned above, we could not find any more studies investigating the effect by using cyclic direct simple shear (CDSS) tests. In the cyclic triaxial tests, the major principal stress is always parallel or perpendicular to the vertical direction. Cyclic direct simple shear loading causes the continuous rotation of principle stress axes, which can be better to simulate the rotation of principal stress caused by earthquakes. Due to the contradictory conclusions and limited data on CDSS tests on the effect of the loading frequency on the liquefaction prediction of sand, the effect of loading frequency on the liquefaction prediction of sand requires further attention. In this study, a series of CDSS tests were performed on loose and dense clean dry sand obtained from Nakdong River. Loading frequencies of 0.05, 0.1, 0.5, and 1 Hz were considered for evaluating the effect of the loading frequency on the liquefaction resistance of the sand.
2. Test Material
In this study, sand obtained from Nakdong River was used. This river flows in the center lowlands of the Yongnam district and stretches to Elsuk Island in Busan. Recently, damage to property due to the collapse of embankments in the Nakdong River areas have been severe. Understanding the liquefaction behavior of Nakdong River sand is important on a technological level for the construction and maintenance of these embankments. Its material properties are listed in Table 2.
Table 2.
Material properties of sand obtained from Nakdong River.
The sand was washed and sieved to obtain the sand grain size in the range of 0.85–0.075 mm. Figure 1 and Figure 2 show a scanning electron microscopy image and the gradation curve of the sand obtained after sieving. The sand was siliceous-medium non-plastic sand with a subangular shape. Its specific gravity was 2.64, and the minimum and maximum void ratios were 0.65 and 1.18, respectively. It was classified as poorly graded sand (SP) according to the Unified Soil Classification System.
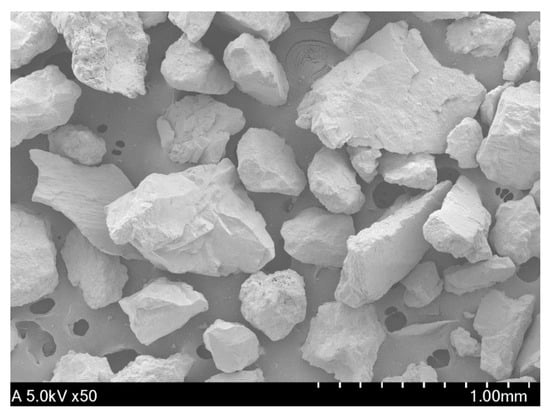
Figure 1.
SEM image of sand obtained from Nakdong River.
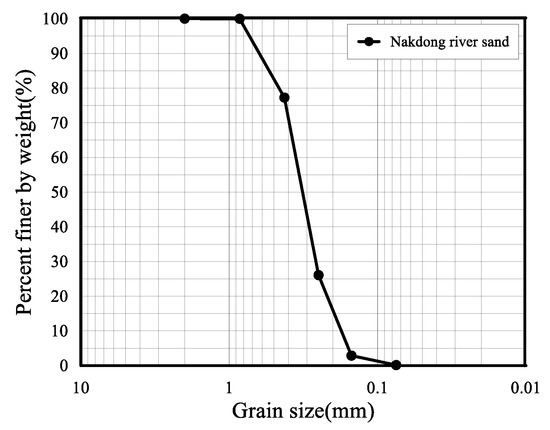
Figure 2.
Grain size distribution curve of sand obtained from Nakdong River.
3. Cyclic Direct Simple Shear Tests
3.1. Test Conditions and Sample Preparation
The cyclic simple shear device used in this study is a type that was developed by the Norwegian Geotechnical Institute (NGI) as shown in Figure 3. It consists of a shear box for retaining the sample, two high-speed precision micro stepper motors for controlling the loading mechanisms for horizontal and vertical loads, sensors for measuring load and displacement and two embedded controllers for test control and data acquisition. A constant volume of the specimen is obtained by maintaining the specimen height constant, and the excess pore pressure generated under shearing is equal to the change in the value of the vertical confining pressure [15]. To prevent displacement in the lateral direction, the specimen was enclosed in a wire-reinforced membrane instead of a stack of Teflon-coated rings. Baxter et al. [16] compared the response of specimens confined with a wire-reinforced membrane with that of specimens confined within Teflon-coated rings by using a simple shear apparatus made by Geocomp Corporation. The responses were similar in the shear stage. In this study, a wire-reinforced membrane with an initial diameter of 63.5 mm and an initial height of 30 mm was used for preparing the specimen. The wire-reinforced membrane was purchased from Seiken Inc., Japan, and had a lateral pressure capacity of 600 kPa.
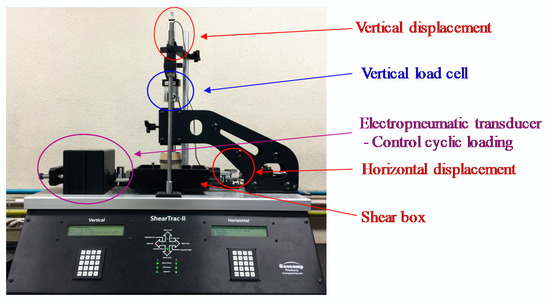
Figure 3.
Cyclic simple shear device used in this study.
The specimen was prepared by using a static compaction method. A static compaction method that applied less energy to the lower layer of the specimen was used to achieve a uniform density in the height direction [17]. The target relative densities after consolidation were approximately 40% and 80% for the loose and dense sand, respectively. For loose sand (Dr = 40%), the same amount of sand was used every time and compacted lightly to achieve a final height of 30 mm. For dense sand (Dr = 80%), the specimen was separated into five layers; the same amount of sand was used for each layer, and the sand was compacted to achieve a height of 6 mm. The lower layers were compacted to a height slightly greater than 6 mm by trial and error, and the height of the specimen was made to exceed 30 mm by approximately 1 mm for obtaining the target density after consolidation. After sample preparation, a series of CDSS tests was performed at initial vertical effective stresses (σv0′) of 50, 100, and 200 kPa. Sine waves with four frequencies (f), namely, 0.05, 0.1, 0.5, and 1 Hz, were applied to the specimens. Appropriate cyclic stress ratios were chosen for each case.
3.2. Cyclic Direct Simple Shear System
The apparatus used in this study was of the ShearTrac II manufactured by Geocomp Corporation, which is of the type developed by the Norwegian Geotechnical Institute [15]. This system is a universal shear system capable of performing measurements in the consolidation, static, and cyclic direct simple shear phases under fully automatic control. An electropneumatic transducer facilitates stress-controlled cyclic loading in the frequency range 0.034–1 Hz. The vertical load is measured by a 5 kN load cell. The horizontal and vertical displacements are measured by a 26-mm-capacity linear variable differential transducer. The system is capable of accurately measuring the displacement rate control from 0.00003 to 15 mm/min, and a select number of data points are logged per cycle to obtain 10–500 readings/s. Test data can be stored in a file for subsequent reduction and can also be plotted using the report features in the software.
3.3. Liquefaction Criteria
Liquefaction is usually defined on the basis of either the pore pressure ratio or the axial/shear strain. In the cyclic direct simple shear test, a specimen is deemed to have liquefied when a single amplitude of the shear strain exceeds 3.75% [18,19] or the excess pore pressure ratio exceeds 90% [20]. In the present study, specimen liquefaction was defined as a double amplitude shear strain of 7.5%; this shear strain was obtained by dividing the peak-to-peak horizontal displacement by the specimen height. This definition has been recommended by National Research Council (NRC) [21] and widely used by researchers [22,23,24]. The cyclic resistance ratio (CRR) reported herein corresponds to liquefaction in 15 cycles, which represents an earthquake with a magnitude of 7.5 [25].
4. Results and Discussion
For every combination of the frequency, initial vertical effective stress, and density, the test was repeated several times (mostly five or six times), and the maximum and minimum number of cycles were excluded to eliminate the influence of data scatter. The mean number of cycles for the remaining data was used for the subsequent analysis. Table 3 summarizes the results of the cyclic resistance performed at different loading frequencies, initial vertical effective stresses, and relative densities after consolidation (Drc). For a given loading frequency, density state, and initial vertical effective stress, three distinct tests with different levels of the cyclic stress ratio (CSR) were conducted to obtain a cyclic resistance curve (number of cycles to liquefaction versus CSR).
Table 3.
Summary of direct cyclic shear tests.
Figure 4 shows the undrained cyclic direct simple shear response of loose sand at f = 0.05 Hz (Figure 4a–d) and 0.5 Hz (Figure 4e–h) for σv0′ = 100 kPa and CSR = 0.18. As loading proceeded, shear strain was accumulated continuously, and initially, the excess pore pressure rose rapidly. Subsequently, the increase in the excess pore pressure became gradual and was accompanied by a decrease in the initial vertical effective stress. Once the liquefaction criterion was satisfied, the excess pore pressure at the end of the test exceeded 90% of the initial vertical effective stress. A comparison of Figure 4d,h shows that the magnitude of initial vertical effective stress decrease was influenced by the loading frequency. At f = 0.05 Hz, the value of σv0′ decreased approximately 45%, from 100 kPa to 55 kPa in the first cycle. However, at f = 0.5 Hz, the value of σv0′ decreased only 35%, from 100 kPa to 65 kPa in the first cycle. The faster decrease in initial vertical effective stress in the first cycle is resulted in a less numbers of cycles to liquefy. The different changes in specimen fabric under different loading frequency contribute to observed differences in cyclic response.
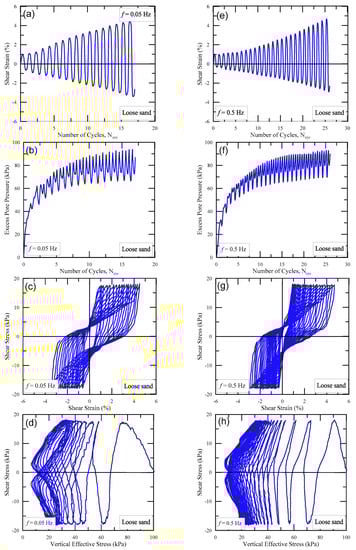
Figure 4.
Undrained response of loose sand at σv0′ = 100 kPa and cyclic stress ratio (CSR) = 0.18: (a–d) f = 0.05; (e–h) f = 0.5.
Figure 5 presents the cyclic behavior of dense sand at a low frequency (Figure 5a–d) and a higher frequency (Figure 5e–h) under the test conditions σv0′ = 100 kPa and CSR = 0.3. The dilatancy of dense sand was distinct from that of loose sand. During unloading, the sand specimen recovered its effective stress and shear stiffness because of dilation. Consequently, the shear strain accumulated at a low rate, and the excess pore pressure oscillated around 80% of the initial vertical effective stress. As observed in loose sand, the decrease in initial vertical effective stress in the first cycle at f = 0.05 Hz occurred more quickly than the one at f = 0.5 Hz for dense sand.
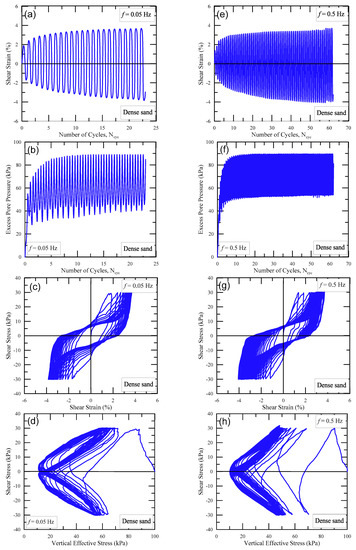
Figure 5.
Undrained response of dense sand at σv0′ = 100 kPa and CSR = 0.3: (a–d) f = 0.05; (e–h) f = 0.5.
4.1. Effect of Relative Density
Figure 6 and Figure 7 show the relationship between the cyclic stress ratio and the mean number of cycles to liquefaction for loose and dense sand for σv0′ = 100 and 200 kPa, respectively. The positive and negative error cycle numbers for each mean number of cycles are indicated by the error bar. Each figure shows a comparison of the relationship for different loading frequencies. As expected, the liquefaction resistance increases with the relative density. For the case of σv0′ = 100 kPa, the liquefaction resistance of dense sand was greater than that of loose sand by about 64% for 0.05 and 0.1 Hz. In particular, for f = 0.5 Hz, the liquefaction resistance of dense sand was higher than that of loose sand by about 82%. Therefore, the effect of the relative density on the liquefaction resistance became stronger at the loading frequency of 0.5 Hz. For the case of σv0′ = 200 kPa, as shown in Figure 6, the liquefaction resistance stably increased (by approximately 38%–47%) with an increase in the relative density from 40% to 80%, regardless of the loading frequency.
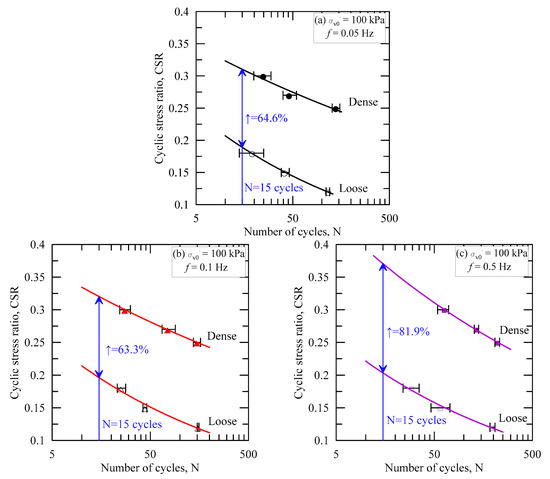
Figure 6.
Comparison of cyclic resistance curves (a) f = 0.05 Hz, (b) f = 0.1 Hz and (c) f = 0.5 Hz at different density states for σv0′ = 100 kPa.
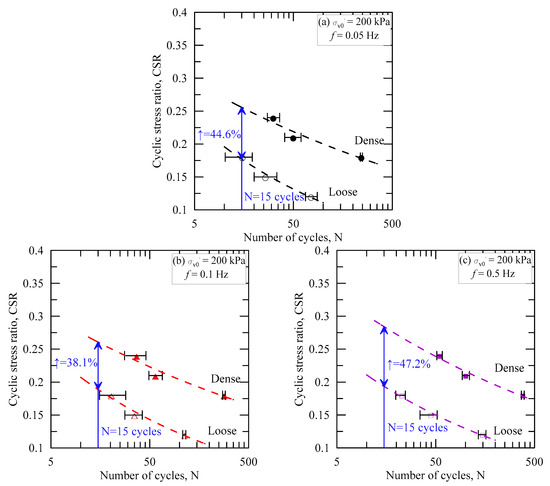
Figure 7.
Comparison of cyclic resistance curves (a) f = 0.05 Hz, (b) f = 0.1 Hz and (c) f = 0.5 Hz at different density states for σv0′ = 200 kPa.
A comparison of Figure 6 and Figure 7 shows that the effect of the relative density reduced as the initial vertical effective stress increased. This is because unlike loose sand, the liquefaction resistance of dense sand decreased dramatically when the initial vertical effective stress increased. On the basis of triaxial tests, Vaid et al. [26] reported that the confining stress on loose Fraser River sand had little effect on the liquefaction resistance of the sand.
4.2. Effect of Initial Vertical Effective Stress and Loading Frequency
Figure 8 shows the relationship between the loading frequency and the CRR at 15 cycles (CRR15). For a given loading frequency and density state, the CRR15 value decreased when the initial vertical effective stress increased. A comparison of Figure 8a,b reveals that the cyclic resistance of dense sand decreased more significantly than that of loose sand. This is because the dilative behavior of dense sand is inhibited under a high initial vertical effective stress. Vaid and Sivathayalan [19] emphasized that an increase in the confining stress had a small effect on the dilatancy of loose sand but caused a progressive reduction in the dilatancy or enhanced contraction of dense sand.
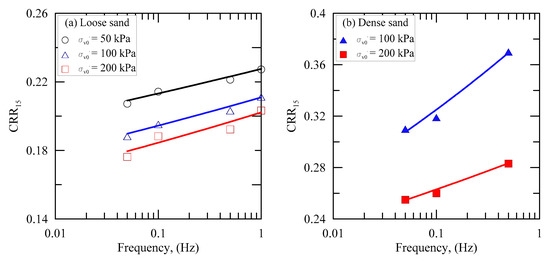
Figure 8.
Effects of loading frequency (a) loose sand and (b) dense sand on cyclic resistance.
The CRR15 values increased with the loading frequency, regardless of the initial vertical effective stress and relative density. Figure 9 presents the percentage increase in the cyclic resistance at 0.1, 0.5, and 1 Hz relative to the cyclic resistance at 0.05 Hz. For loose sand at σv0′ = 100 kPa, an increase in the loading frequency from 0.05 Hz to 0.1, 0.5, and 1 Hz led to the cyclic resistance increasing by 3.7%, 7.9%, and 12%, respectively. For dense sand at σv0′ = 100 kPa, an increase in the loading frequency from 0.05 Hz to 0.1 and 0.5 Hz led to the cyclic resistance increasing by 2.9% and 19%, respectively. Similar results can be seen for σv0′ = 200 kPa. Feng and Zhang [11] reported that the cyclic resistance of loose sand (Dr = 30%) increased by 8.9% when the frequency was increased from 0.05 to 1 Hz in a cyclic triaxial test. Furthermore, in cyclic triaxial tests conducted by Guo and He [13] under a confining stress of 100 kPa, the relative increase in the liquefaction resistance at 12 cycles was 33.3% for loose sand (Dr = 28%) and 15.4% for dense sand (Dr = 70%) when the loading frequency varied from 0.05 to 1 Hz.
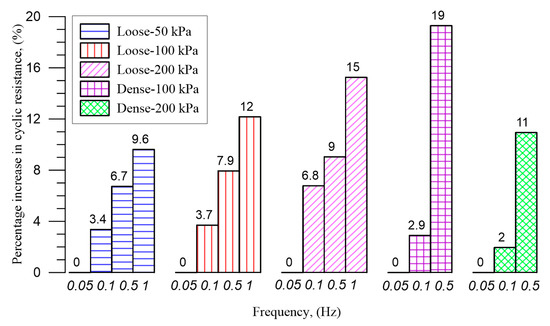
Figure 9.
Percentage increase in cyclic resistance at 0.1, 0.5 and 1 Hz relative to the cyclic resistance at 0.05 Hz.
4.3. Shear Strain and Pore Pressure Accumulations
This increase in the liquefaction resistance could be related to the rates of shear strain and excess pore pressure accumulations. The accumulated shear strain data were automatically generated by the CDSS system as a function of the number of cycles, and they are plotted in Figure 10. Figure 10a shows the accumulated shear strain for loose sand at various loading frequencies for CSR = 0.12. Initially, the accumulated shear strain had a constant low value, implying that elastic strain was predominant. As the number of cycles increased, the accumulated shear strain increased rapidly, indicating a sudden increase in the plastic strain and, subsequently, the shear strain value at liquefaction was reached. At lower frequencies, the plastic shear strain accumulates more rapidly, leading to the sand becoming unstable in fewer loading cycles. Figure 10b shows the accumulation of shear strain in dense sand for CSR = 0.27. It is not identical to that in loose sand. The accumulation of shear strain was initially rapid and, subsequently, it became gradual and continued until the shear strain value at liquefaction was reached. The lower the frequency, the more rapid the accumulation of shear strain and the shorter the time taken to reach the strain value at liquefaction was. The difference in the manner of shear strain accumulation could be attributed to the dilation-dominant behavior of dense sand in this study.
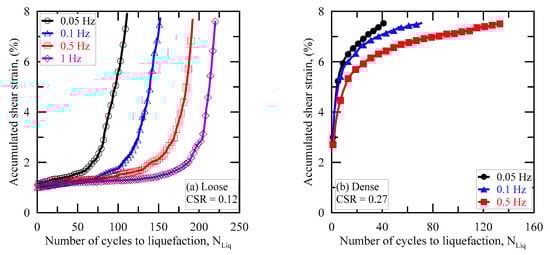
Figure 10.
Evolution of accumulated shear strain (a) loose sand for CSR = 0.12 and (b) dense sand for CSR = 0.27 effected by various loading frequencies at σv0′ = 100 kPa.
The effect of loading frequency on excess pore pressure accumulations is evaluated based on the changes in excess pore pressure ratio (ru = Δu/σv0′) during undrained shearing phase. Figure 11 shows the relationship between the excess pore pressure ratio and the number of cycles to liquefaction at different frequencies in CDSS tests when CSR is 0.12 and 0.18 for the loose sand. It can be clearly seen that the excess pore pressure accumulations are significantly influenced by loading frequency. As the loading frequency increases, the excess pore pressure slowly increases at a constant CSR and σv0′ values. This results in more cycles to reach liquefaction at a higher loading frequency.
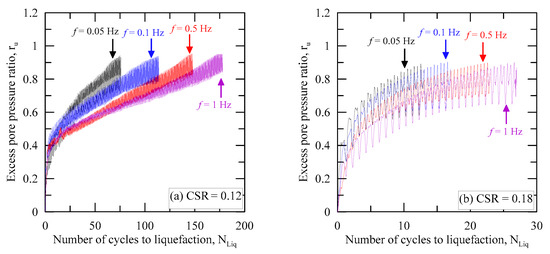
Figure 11.
Accumulation of excess pore pressure under different shear values (a) CSR = 0.12 and (b) CSR = 0.18 effected by loading frequencies for loose sand at σv0′ = 200 kPa.
Since recent studies on the earthquake-induced liquefaction behavior of sand have mainly been conducted at a loading frequency of 0.1 Hz [27,28,29,30], the cyclic resistances from studies performed at 0.1 Hz may not be applicable to all frequencies. As an earthquake contains a range of frequencies, it seems that 0.1 Hz gives an average response to the range of frequencies the authors examined. In practical terms, compared to the frequency of a seismic excitation, the lower loading frequency used in laboratory tests causes an underestimation of the liquefaction resistance of sand, which could make designs costly. Since the effect of the loading frequency on soil liquefaction is not well understood and results from various studies in the literature are contradictory, more than one loading frequency should be used to assess the cyclic resistance of sand in laboratory studies through CDSS tests. This study was conducted on a limited loading frequency range, and sand from only one location was used. Additional studies are required to derive reliable, generalized conclusions.
5. Conclusions
The effect of loading frequency on soil liquefaction is not well understood, and test results have been contradictory. Most results have been derived from cyclic triaxial tests conducted on saturated sand, and studies have rarely been carried on cyclic direct simple shear tests, which can better simulate the vertically propagating shear wave caused by earthquake loading. In this study, a series of CDSS tests were performed to investigate the effect of the loading frequency on the liquefaction resistance of clean, dry Nakdong River sand. The major findings of this study are as follows:
- The liquefaction resistance of dense sand was greater than that of loose sand for the same loading frequency and initial vertical effective stress. Furthermore, dense sand was more sensitive to the test conditions. While an increase in the loading frequency and/or a decrease in the initial vertical effective stress caused a significant increase in the liquefaction resistance of dense sand, its influence on loose sand was small.
- An increase in the initial vertical effective stress resulted in a decrease in the liquefaction resistance. The liquefaction resistance of dense sand decreased significantly because the high initial vertical effective stress inhibits the dilative behavior of sand particles.
- The accumulated shear strain was influenced by the loading frequency. For given experimental conditions, the number of cycles required to attain a given level of accumulated shear strain increased with the loading frequency.
- The loading frequency affected the rate of excess pore pressure accumulation. For a constant amplitude of cyclic stress, an increase in loading frequency led to a decrease in the accumulated excess pore pressure.
- The loading frequency exerted a strong influence on the cyclic resistance for both loose and dense sand. Thus, it is recommended that more than one loading frequency be used to assess the cyclic resistance of sand in laboratory studies through CDSS tests.
Author Contributions
Conceptualization, Z.N. and S.-S.P.; methodology, Z.N. and S.-S.P.; experiments, Z.N.; validation, S.-S.P.; S.-W.J. and D.-E.L.; formal analysis, Z.N., S.-S.P., and S.-W.J.; investigation, Z.N. and S.-S.P.; resources, Z.N. and S.-S.P.; data curation, Z.N. and S.-S.P.; writing—original draft preparation, Z.N. and S.-S.P.; writing—review and editing, Z.N. and S.-S.P.; visualization, Z.N., S.-S.P., and S.-W.J.; supervision, S.-S.P. and D.-E.L.; project administration, S.-S.P.; S.-W.J. and D.-E.L.; funding acquisition, S.-S.P. and D.-E.L. All authors have read and agreed to the published version of the manuscript.
Funding
This work was supported by grants from the National Research Foundation of Korea (NRF-2018R1A5A1025137) funded by the Korea government, and the Basic Science Research Program through the National Research Foundation of Korea (NRF-2019R1F1A1058869) funded by the Ministry of Education.
Conflicts of Interest
The authors declare no conflicts of interest.
References
- Silva, W.J. Soil Response to Earthquake Ground Motion (EPRI Report NP-5747); Electric Power Research Institute: Palo Alto, CA, USA, 1988. [Google Scholar]
- Yoshimi, Y.; Oh-oka, H. Influence of degree of shear stress reversal on the liquefaction potential of saturated sand. Soils Found 1975, 15, 27–40. [Google Scholar] [CrossRef]
- Wong, R.T.; Seed, H.B.; Chan, C.K. Cyclic Loading Liquefaction of Gravelly Soils. J. Geotech. Geoenviron. Eng. 1975, 101, 571–583. [Google Scholar]
- Tatsuoka, F.; Maeda, S.; Fujii, S.; Yamada, S.I. Cyclic undrained strength of saturated sand under random and uniform loading and their relation. Bull. ERS (Institute of Industrial Science, Univ. of Tokyo) 1983, 16, 11–31. [Google Scholar]
- Tatsuoka, F.; Toki, S.; Miura, S.; Kato, H.; Okamoto, M.; Yamada, S.; Yasuda, S.; Tanizawa, F. Some Factors Affecting Cyclic Undrained Triaxial Strength of Sand. Soils Found 1986, 26, 99–116. [Google Scholar] [CrossRef]
- Polito, C.P. The Effects of Non-plastic and Plastic Fines on the Liquefaction of Sandy Soils. Ph.D. Thesis, Virginia Polytechnic Institute and State University, Blacksburg, VA, USA, 1999. [Google Scholar]
- Wang, X.H.; Zhou, H.L. Study on dynamic steady state strength of sand soil liquefaction. J. Rock Mech. Eng. 2003, 22, 96–102. [Google Scholar]
- Sze, H.Y. Initial Shear and Confining Stress Effects on Cyclic Behaviour and Liquefaction Resistance of Sands. Ph.D. Thesis, Hong Kong University, Hong Kong, China, 2010. [Google Scholar] [CrossRef]
- Peacock, W.H.; Seed, H.B. Sand liquefaction under cyclic loading simple shear conditions. J. Soil Mech. Found. Div. 1968, 94, 689–708. [Google Scholar]
- Lee, K.L.; Fitton, J.A. Factors affecting the cyclic loading strength of soil. ASTM Int. 1969, 71–95. [Google Scholar] [CrossRef]
- Feng, T.G.; Zhang, L.M. Experimental study on effect of vibration frequency on dynamic behaviors of saturated loose sands. J. Water Res. Arch. Eng. 2013, 11, 11–15. [Google Scholar]
- Zhang, S.; Zhang, Y.F.; Zhang, L.K.; Liu, C.J. Influence of confining pressure and vibration frequency on the liquefaction strength of the saturated gravel sand. J. Xingjiang Agric. Univ. 2015, 38, 68–71. [Google Scholar]
- Guo, Y.; He, L. The influences of the vibration frequencies on liquefaction strength of saturated sands. J. Disas. Prev. Mitig. Eng. 2009, 29, 618–623. [Google Scholar]
- Mulilis, J.P.; Chan, C.K.; Seed, H.B. The Effects of Method of Sample Preparation on the Cyclic Stress-strain Behavior of Sands (EERC Report 75-18); University of California: Berkeley, CA, USA, 1975. [Google Scholar]
- Bjerrum, L.; Landva, A. Direct simple shear tests on a Norwegian quick clay. Geotechnique 1966, 16, 1–20. [Google Scholar] [CrossRef]
- Baxter, C.D.P.; Bradshaw, A.S.; Ochoa, L.M.; Hankour, R. DSS Test Results Using Wire-reinforced Membranes and Stacked Rings. In Proceedings of the GeoFlorida 2010 the advances in analysis modeling and design, West Palm Beach, FL, USA, 20–24 February 2010; pp. 600–607. [Google Scholar] [CrossRef]
- Ladd, R.S. Preparing test specimens using under compaction. Geotech. Test. J. 1978, 1, 16–23. [Google Scholar] [CrossRef]
- Pillai, V.S.; Stewart, R.A. Evaluation of liquefaction potential of foundation soils at Duncan dam. Can. Geotech. J. 1994, 31, 951–966. [Google Scholar] [CrossRef]
- Vaid, Y.P.; Sivathayalan, S. Static and cyclic liquefaction potential of Fraser Delta sand in simple shear and triaxial tests. Can. Geotech. J. 1996, 33, 281–289. [Google Scholar] [CrossRef]
- Hazirbaba, K.; Rathje, E. A Comparison between In Situ and Laboratory Measurements of Pore Water Pressure Generation. In Proceedings of the 13th WCEE, Vancouver, BC, Canada, 1–6 August 2004; p. 1220. [Google Scholar]
- National Research Council. Liquefaction of Soils during Earthquake; The National Academies Press: Washington, DC, USA, 1985. [Google Scholar]
- Miller, H.J.; Alba, P.D.; Baldwin, K.C. Cyclic simple shear apparatus for low-strain soils tests. Transp. Res. Rec. 1966, 1548, 9–15. [Google Scholar] [CrossRef]
- The Comparison of Undrained Behavior of Sand between simple Shear Condition and Triaxial Compression Condition. Available online: http://www.dbpia.co.kr/Article/NODE00609221 (accessed on 26 June 2020).
- Kim, S.J. Behavior of Sand in Cyclic Simple Shear Test. Master’s Thesis, Pusan University, Busan, Korea, 2009. [Google Scholar]
- Seed, H.B.; Idriss, I.M.; Makdisi, F.; Baberjee, N. Representation of Irregular Stress Time Histories by Equivalent Uniform Stress Series in Liquefaction Analysis (EERC Report); University of California: Berkeley, CA, USA, 1975. [Google Scholar]
- Vaid, Y.P.; Stedman, J.D.; Sivathayalan, S. Confining stress and static shear effects in cyclic liquefaction. Can. Geotech. J. 2001, 38, 580–591. [Google Scholar] [CrossRef]
- Kammerer, A.M.; Wu, J.; Riemer, M.; Pestana, J.M.; Seed, R.B. Use of Cyclic Simple Shear Testing in Evaluation of the Deformation Potential of Liquefaction Soils. In Proceedings of the 2001-Fourth International Conference on Recent Advances in Geotechnical Earthquake Engineering and Soil Dynamics, San Diego, CA, USA, 26–28 March 2001; pp. 1–6. [Google Scholar]
- Mao, X.; Fahey, M. Behavior of calcareous soils in undrained cyclic simple shear. Geotechnique 2003, 1, 715–727. [Google Scholar] [CrossRef]
- Dharma, W.; Maria, S. Cyclic Shear Loading Response of Fraser River Delta Silt. In Proceedings of the 13th WCEE, Vancouver, BC, Canada, 1–6 August 2004; pp. 1–9. [Google Scholar]
- Dinesh, S.V.; Kumar, G.M.; Balreddy, M.S. Liquefaction potential of Sabarmati-river sand. J. Earthq. Tech. 2011, 516, 61–71. [Google Scholar]
© 2020 by the authors. Licensee MDPI, Basel, Switzerland. This article is an open access article distributed under the terms and conditions of the Creative Commons Attribution (CC BY) license (http://creativecommons.org/licenses/by/4.0/).