Article

Study on the Thermal Performance and Temperature Distribution of Ball Bearings in the Traction Motor of a High-Speed EMU

School of Electrical Engineering, Beijing Jiaotong University, Beijing 100044, China
*
Author to whom correspondence should be addressed.
Appl. Sci. 2020, 10(12), 4373; https://doi.org/10.3390/app10124373
Submission received: 31 May 2020 / Revised: 18 June 2020 / Accepted: 22 June 2020 / Published: 25 June 2020
(This article belongs to the Section Applied Physics General)

Abstract

:
The transient thermal performance of rolling bearings affects the mechanical performance and system safety of traction motors. Most of the traditional empirical formulas used in temperature analysis have been simplified and cannot be completely applied to the calculation of heat generation and convection heat transfer coefficients. Based on the comparative analysis of finite element transient temperature and experimental data, this paper proposes a correction method of mathematical model and derives an accurate calculation formula for the heat generation and lubricant convection heat transfer coefficient of ball bearings applicable for the non-driving end in the traction motor of a high-speed EMU (Electric Multiple Unit). The accuracy of the results has been verified by durability experiment data. In addition, with changes in speed, radial load and other factors taken into account, we have analyzed the influence of these time-varying factors on ball bearing temperature, as well as the temperature distribution law of each component in a grease-lubricated bearing, in a bid to lay a foundation for follow-up research on the heat transfer laws of traction motors and rolling bearings.

1. Introduction

A rolling bearing is an essential component of a traction motor. As the key component connecting rotating parts (rotor, shaft) and non-rotating parts (stator, casing), its thermal performance affects bearing life and overall performance. The operation conditions of traction motors in high-speed EMUs (Electric Multiple Units) is complex. Frequent changes in speed, load, external environment and other factors tend to generate heat inside the bearing under severe friction, resulting in various mechanical faults, such as gluing, plastic deformation, cage damage, etc., which pose a threat to the safe and stable operation of rolling bearings [1,2,3]. Therefore, it is necessary to study the thermal performance and temperature distribution of ball bearings in the traction motors of high-speed EMUs.
Recently, many experts and scholars have seen extensive efforts in temperature analysis of rolling bearings. Wang et al. (1993) estimated the contact friction force of a tapered roller bearing raceway using Coulomb’s law for reference and deduced the calculation formula of heat generation, taking into account the bearing speed and friction moment, but this is far from the actual situation as the effect of lubricant is not considered in the calculation [4]. Palmegren (1959) fitted out the empirical formulas of bearing friction torque and heat generation by experimental study with different series of bearings [5]. Based on the empirical formula put forward by Harris [6], Changenet and others (2006) accurately predicted the power loss of a six-speed manual gearbox by using the thermal network method [7]. Ma et al. (2016) established a mathematical model of ball bearing heat generation with grease lubrication based on local heat source analysis, analyzed the transient temperature distribution of spherical roller bearings, and studied the influence of various factors such as speed, radial load and grease injection rate on bearing temperature rise [8]. Xu Hao et al. (2019) proposed a new thermal network model of thermal fluid–solid coupling, fully considering the factors of lubricating oil performance, friction heat generation and bearing structural parameters, which was used for transient temperature analysis of a bearing system [9]. Taking into account the effect of cooling lubricant and specific structure constraints, Zheng et al. (2017) established a thermal expansion load balance model for an angular contact ball bearing, as well as a comprehensive thermal network model of a high-speed spindle front bearing and its surrounding environment based on multi-node thermal network theory, and accurately analyzed and predicted bearing transient temperature distribution [10]. Yan et al. (2017) established an oil–air–heat coupled floating ring bearing model and evaluated the influence of air introduction, viscous heating and heat transfer by using computational fluid dynamics [11]. Thierry Sibilli et al. (2018) compared the temperature calculated by the thermal network model and finite element model with experimental temperature, and the results showed that the temperature calculated by the finite element model was more accurate than that calculated by the former [12]. F Pouly (2010) proposed a thermal network method to estimate the temperature at different positions of a thrust angular contact bearing. Considering several power loss distributions in thrust angular contact bearings, the influence of these factors on bearing temperature and the important role of oil–gas mixture were analyzed [13]. Neurouth et al. (2014) used a simplified thermal network model to calculate the power loss of grease-lubricated thrust ball bearings [14]. Li et al. (2017) put forward the shaft system of a tilting outer ring ball bearing in view of improper assembly problems. Based on quasi-static analysis, they studied the influence of tilting the bearing’s outer ring on the contact angle, contact force and bearing friction heat. It turned out that the larger the bearing outer ring angle is, the greater the heating power is, and the higher the steady temperature of the bearing’s outer ring is [15]. Based on the traditional steady-state model, thermal deformation coupling and other time-varying parameters, Ke et al. (2016) deduced a transient analysis method and put forward the thermal network method of spindle transient temperature analysis considering the thermal structure interaction. The experimental results showed that the temperature deviation obtained by the steady-state model is larger, while the temperature obtained by the transient model is more precise [16].
Temperature analysis of rolling bearings is often realized through the finite element analysis method [17], node network method [18,19] or computational fluid dynamics method [20], with the pivotal step being the calculation of the heat generation and lubricant convection heat transfer coefficient. Most of these empirical formulas are derived based on geometric models or experimental data [5,21], and any rolling bearing model that is a result of a mathematical method is simplified to a standard geometry with a fixed shape and volume [22,23], which, for its approximate calculation, has a certain theoretical value and reference significance on occasions that do not require high accuracy. However, considering the complexity of rolling bearing working conditions for some specific mechanical equipment, bearing temperature is subject to factors such as friction heat generation, spin heat generation, grease cooling, etc. Approximate or simplified empirical formulas are not accurate enough for the calculation of the heat generation and convection heat transfer coefficient; therefore, the temperature distribution of rolling bearings analyzed by these empirical formulas is a marked departure from experimental data.
In this paper, based on the traditional empirical formula of temperature analysis and the comparative analysis of finite element transient temperature and bearing experimental data, the formula of heat generation and the lubricant convection heat transfer coefficient of ball bearings applied to the non-driving end in the traction motor of a high-speed EMU are derived. On this premise, the temperature distribution law of grease-lubricated bearings under different working conditions is studied, and the heat transfer mechanism of each component of the rolling bearing is revealed. Under the condition of constant load/variable speed and constant speed/variable load, the influence of speed and radial load on bearing temperature is analyzed.

2. Model Establishment

2.1. Establishment of a Finite Element Transient Temperature Solution Model

The 6311 ball bearing is adopted for the non-drive-end bearing in the traction motor of a high-speed EMU, and its basic dimension parameters and structure are shown in Table 1.
Considering that traction motor bearings are installed in the bearing chamber casing, when the EMU is in operation, the outside of the bearing chamber achieves forced cooling through natural wind, and the inside of the bearing chamber is cooled through air inside the traction motor. Therefore, a bearing chamber model was created at the bearing’s periphery after the ball bearing model was established. The 3D section and mesh division are shown in Figure 1.

2.2. Heat Generation Calculation

Palmegren [5] pointed out that the heat generation of a rolling bearing is related to friction torque and bearing speed, and the friction torque of a rolling bearing is
M = M 1 + M 2
where M 1 represents the moment related to lubricant hydrodynamic losses and its empirical formula is
M 1 = 10 7 f 0 v n 2 / 3 D 3 , v n 2000 160 × 10 7 f 0 D 3 , v n < 2000
where n is the bearing speed in r/min; v is the lubricant kinematic viscosity at working temperature (the viscosity of base oil is taken when grease lubrication is used) in m2/s; f 0 is the coefficient related to bearing type and lubrication method and shown in Table 2 for specific values; for light series bearings, f 0 is taken as the smaller value, while, for heavy series bearings, f 0 is taken as the larger value; D is the bearing pitch diameter.
M 2 represents the moment related to load various friction losses, and its empirical formula is
M 2 = f 1 P 1 D
where f 1 is the coefficient related to bearing type and load, and its value is shown in Table 3; P 1 is the calculated load to determine the bearing friction moment, and the calculation method is shown in Table 3.
In the table, F r is the bearing radial load; F a is the bearing axial load; C 0 is the bearing rated static load; P 0 is the bearing equivalent static load.
The heat generation G of a rolling bearing is the product of friction moment and angular speed.
G = π M n / 30 × 10 3

2.3. Convective Heat Transfer of Bearings

Bearing-induced heat is released through conduction, convection and radiation [24]. Given the modest temperature difference between the bearing components, heat from thermal radiation is ignored for its secondary position. Bearing heat is mainly dissipated through conduction and convection, among which the conduction heat between inner/outer rings and rollers is distributed in a proportion of 1:1 [25]. The bearing in the traction motor of a high-speed EMU is lubricated with grease; therefore, the bearing’s convective heat transfer includes the convective heat transfer between the grease and the inner/outer raceway surfaces, the convective heat transfer between grease and rolling body/cage surfaces, and the convective heat transfer between outer surface of the bearing seat and the outer air.
The fluid state can be divided into laminar flow and turbulent flow according to flow characteristics [26]. When calculating the convective heat transfer coefficient, the difference in material state will produce the Nusselt criterion of different flow states, and the convective heat transfer coefficient is also different. The lubricant moves in a laminar flow inside the bearing, which makes the description of heat convection rather difficult. The convective heat transfer coefficient can be approximately expressed by the surface heat transfer coefficient for a plate in a laminar flow [21].
h g = 0.0332 k g P g 1 / 3 u g v g D 1 / 2
In the formula, when considering the heat transfer between the bearing and the lubricant, the surface speed of the bearing cage is u g ; v g is the lubricant grease kinematic viscosity; P g is the lubricant grease Prandtl number, and k g is the lubricant grease thermal conductivity, as shown in Table 4.
Since the surface velocity of the bearing cage is related to angular velocity and the bearing pitch diameter, the above formula is simplified as
h g = 0.0332 k g P g 1 3 π n c 60 v g 1 2
where n c is the speed of the bearing cage. It can be seen from the above formula that the convective heat transfer coefficient between the lubricant and the bearing components is constant in the approximate calculation, which is only related to the cage speed and lubricant performance.
When the traction motor is in operation, the bearing chamber can achieve a marked cooling effect, since forced ventilation cooling is at work internally and the external wind is at high velocity. The forced convection model is used to calculate the convection heat transfer coefficient between the bearing chamber outer surface and the air, and the calculation formula is as follows [27]:
α = 0.3 k a i r D c h u a i r D c h v a i r 0.57
where k a i r is the thermal conductivity of air; D c h is the diameter of the bearing chamber; v a i r is the kinematic viscosity of air; u a i r is the flow rate of air.

2.4. Problem Analysis

Based on the calculation method of heat generation and convective heat transfer coefficient in Section 2.2, the transient temperature field of a 6311 ball bearing was analyzed under durability experiment conditions (radial load 2400 N, bearing speed 5800 r/min). At the same time, a bearing durability experiment was carried out on the bearing lubrication experiment bench of a high-speed traction motor under the same working condition, and the transient temperature changes on the inner surface of the inner ring and outer surface of the outer ring were recorded.
The overall block diagram and the experimental device on the bearing lubrication experiment bench for a high-speed traction motor are shown in Figure 2. The inner and outer ring temperature sensors measure the temperature of the inner and outer ring bearing surfaces. The loading device applies radial and axial loads to the bearings, and the motor drives the bearings to rotate through the belt. The control cabinet loads the experiment conditions, including settings and control of load and speed, and the recorder records the temperature data of different positions of the bearing in real time. The comparison curve of the durability experiment and transient temperature field simulation temperature of the ball bearing are shown in Figure 3. It can be seen from the comparison curve that the inner and outer ring temperatures of the bearing simulated by the Section 2.2 theory are more than five times higher than the experimental temperatures, and there is a large deviation between the heat generation and convection heat transfer coefficient of the bearing calculated directly by the approximate empirical formula and the actual values.
The calculation method for Palmegren bearing heat generation is derived from experiments [5]. Limited by the experimental conditions and detection devices, the empirical formula is only applicable for the calculation of bearing heat generation for medium–low speeds and medium–small torques. Meanwhile the rolling bearing of a high-speed EMU traction motor operates at a high velocity, carries enormous load, and works under complex working conditions, with its actual running speed above 6000 rpm and a radial load of up to 3000 N. Therefore, the Palmegren formula requires further correction before it is applied to heat calculation for a rolling bearing in the traction motor of a high-speed EMU. In addition, the convective heat transfer coefficient of lubricant inside the bearing is approximately obtained from the surface heat transfer coefficient of a flat plate in laminar flow. The rolling bearing in the traction motor of the high-speed EMU is lubricated with grease. A thin oil film takes shape during the bearing operation on the inner surface of the outer ring, outer surface of the inner ring, cage surface and roller surface, which can help lubricate and cool. Despite its theoretical mathematical significance, the approximate empirical formula is not precise enough to calculate the convective heat transfer coefficient completely. Therefore, there is a wide disparity between the temperature distribution of rolling bearings based on these mathematical model formulas and the experimental data.

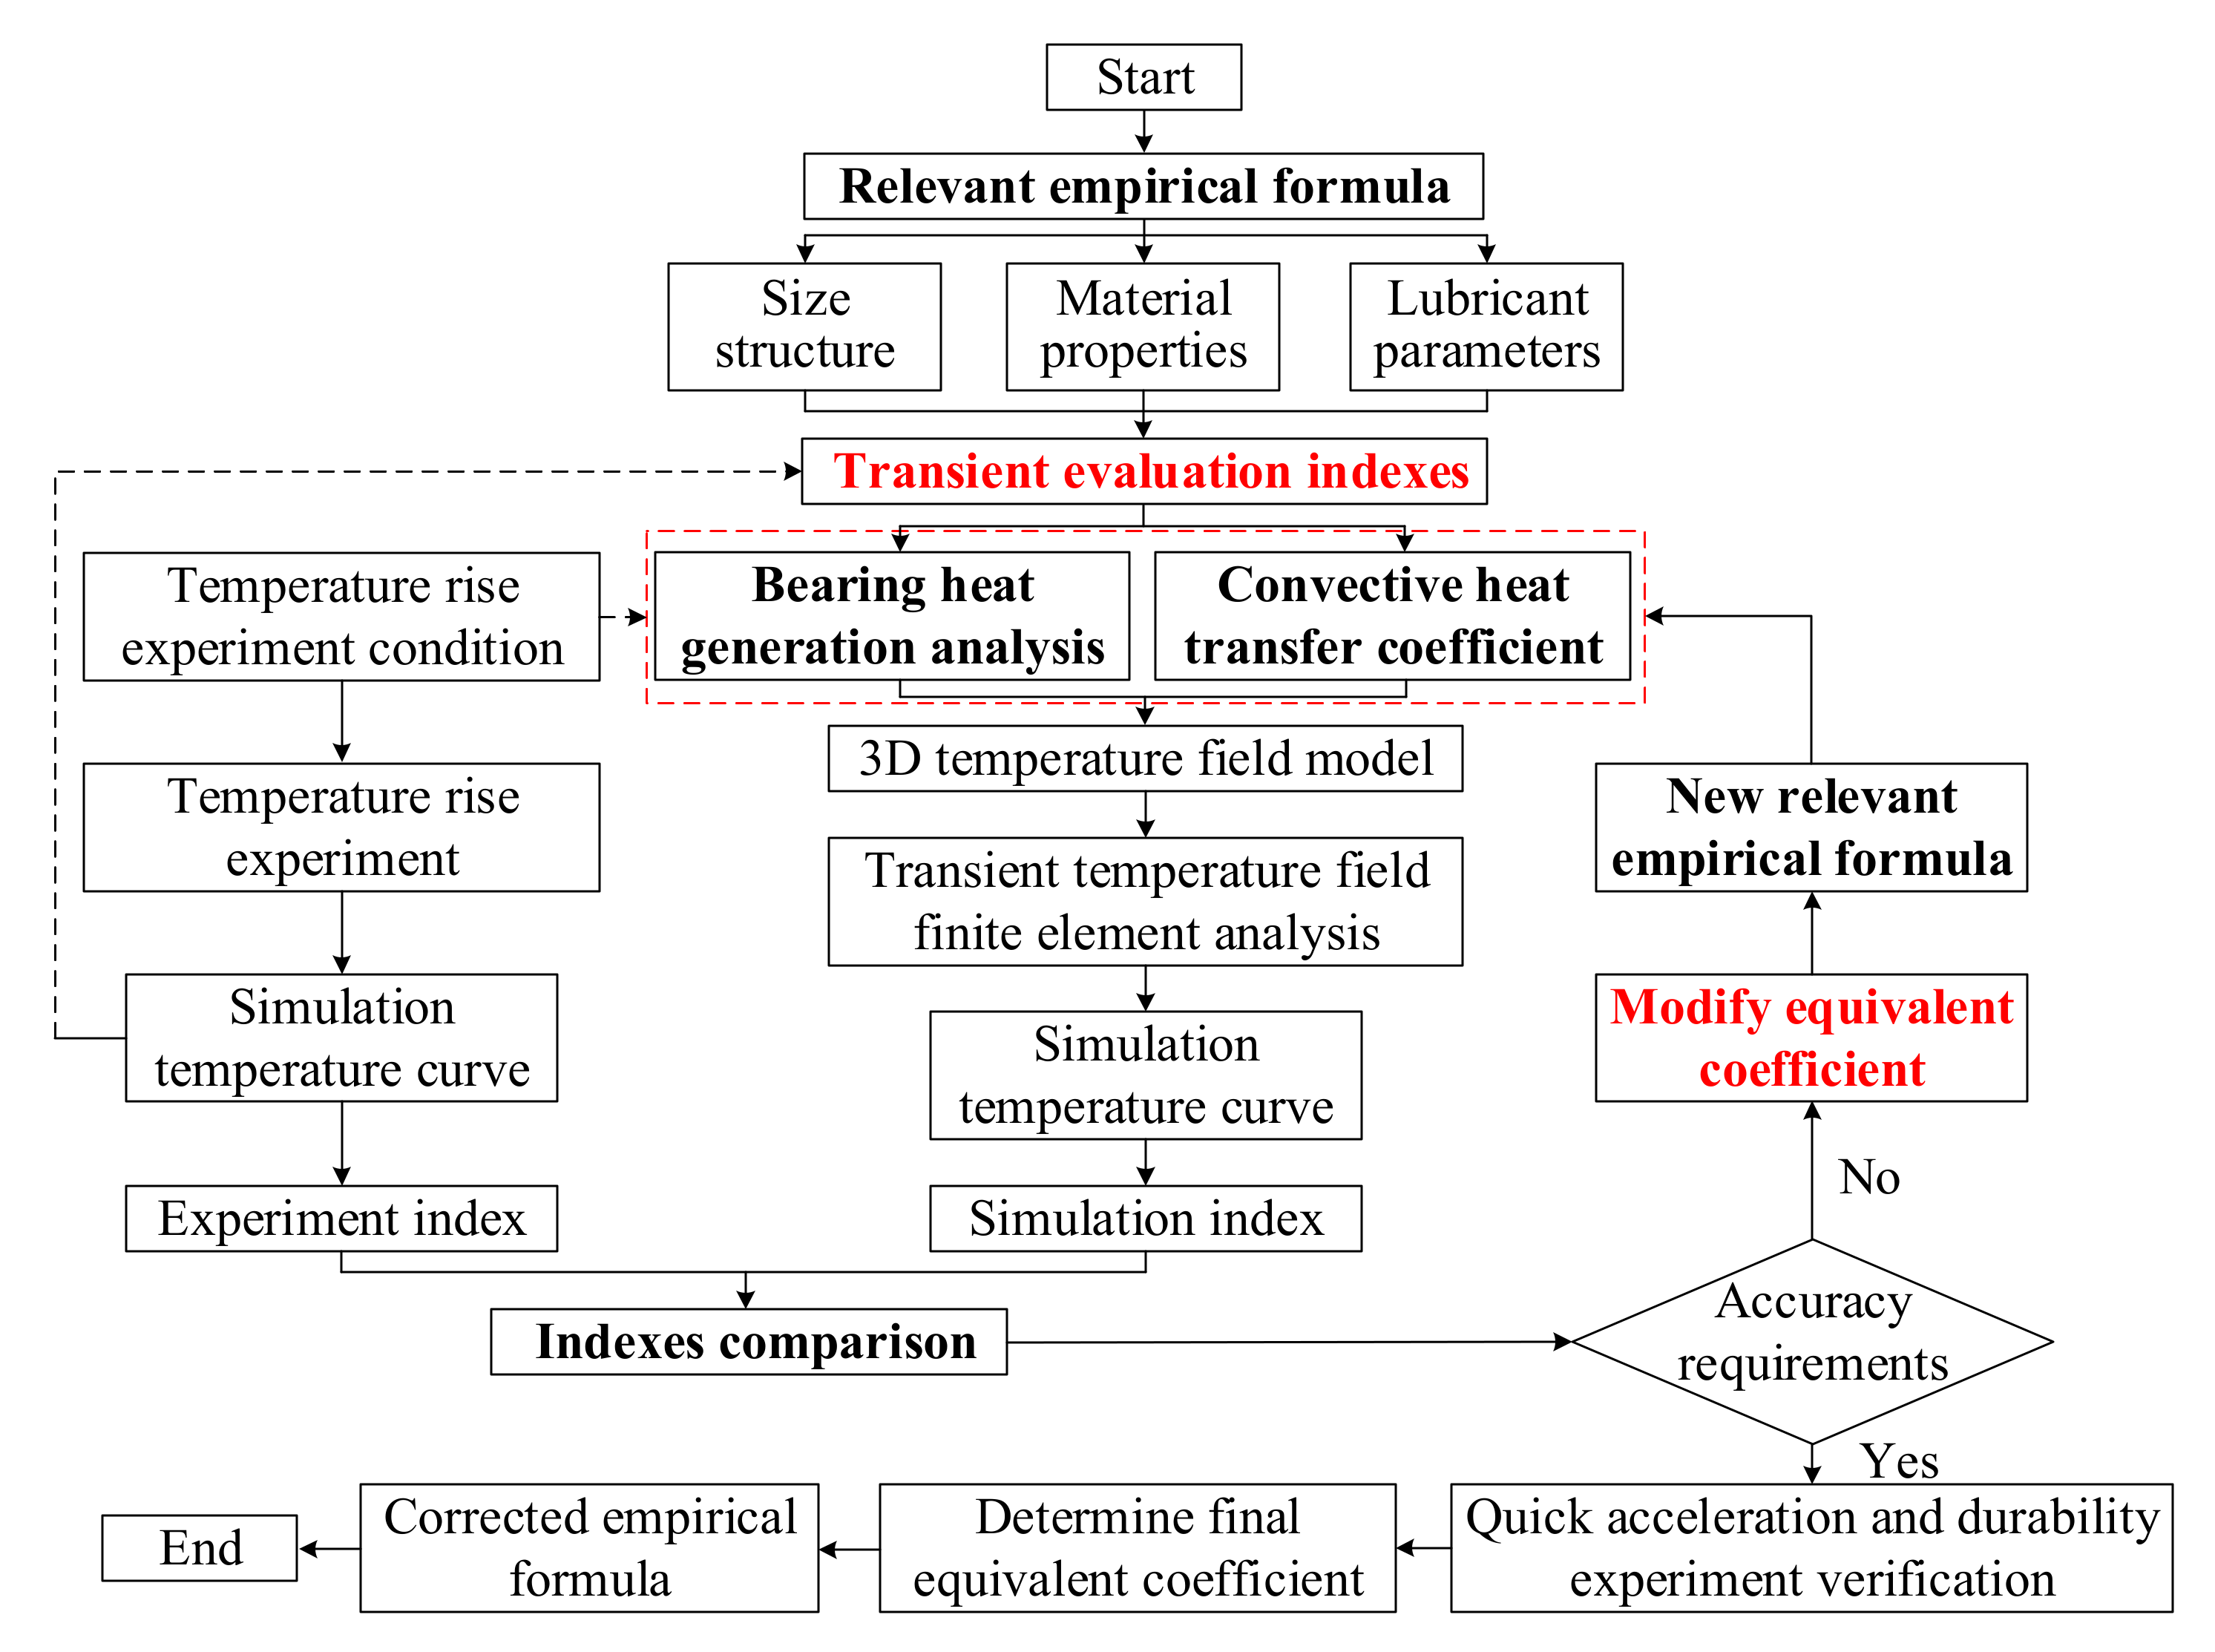
3. Correction of Mathematical Model

3.1. Correction Method of Empirical Formula

In order to ensure the accuracy of the transient temperature field calculations, the mathematical model of bearing temperature analysis, including the heat generation mathematical model and convective heat transfer coefficient calculation formula, was corrected based on the performance evaluation experiment on rolling bearings before the thermal performance analysis. At present, the rolling bearing performance experiments with the bearing lubrication experiment bench for a high-speed traction motor shown in Figure 2 include a temperature rise experiment, durability experiment and rapid acceleration experiment. Considering that the corrected mathematical model must cater to rolling bearing temperature analysis under all working conditions, the temperature rise experiment is selected as the correction basis. Under the condition of fixed axial and radial load, the bearing speed is increased gradually, to compare the temperature rise of the experiment and the simulation at a certain speed. The transient evaluation index and equivalent coefficient are introduced to determine the mathematical model suitable for the temperature calculation of a rolling bearing in a traction motor. The correction process is shown in Figure 4, and the specific correction process is as follows:
Step 1: Determine the basic parameters required for rolling bearing temperature analysis based on the relevant empirical formula for rolling bearing temperature analysis.
Step 2: Extract the experimental temperature curve of the rolling bearing temperature rise experiment and select the transient evaluation index according to curve change.
Step 3: With reference to the basic parameters of the rolling bearing, calculate the heat generation and lubricant convective heat transfer coefficient under the corresponding working conditions of the temperature rise experiment according to empirical formulas.
Step 4: Establish a 3D temperature field solution model of the rolling bearing and bearing chamber, apply load and boundary conditions, and use the finite element method to analyze the transient temperature field of the rolling bearing.
Step 5: Extract the transient evaluation index of the simulation temperature curve obtained by the finite element method, compare the transient evaluation index of temperature rise experiment, and calculate the difference value of each index. If the difference value meets the given accuracy requirements, continue to the next calculation step; otherwise, change the equivalent coefficient, multiply the equivalent coefficient with the empirical formula as a new empirical formula, and calculate a heat generation and lubrication convective heat transfer coefficient to calculate iteratively; return to step 4 to re-analyze the transient temperature distribution.
Step 6: Check the durability experiment results, determine the final equivalent coefficient, and multiply the final equivalent coefficient with the relevant empirical formula as the corrected empirical formula.

3.2. Correction Process

3.2.1. Selection of Transient Evaluation Indexes

The equivalent coefficient is introduced in the correction of the mathematical model. The value of the equivalent coefficient has an impact on how the rolling bearing fluctuates during transient temperature rise. As shown clearly in Figure 3, the rolling bearing starts off with a gradual increase in transient temperature rise before it eventually levels off. Therefore, the transient evaluation indexes selected by reference to the experimental curve include transient stability time, the inner surface temperature stability value of the inner ring and the outer surface temperature stability value of the outer ring. Given the fluctuation of the experimental data, this paper identifies the transient stability time as the time it takes to increase from the outset of the operation to 90% of the transient stability value. The schematic diagram of the transient evaluation index is shown in Figure 5, where T max represents the final temperature stability value and t st represents the transient stability time.

3.2.2. Empirical Formula Correction

According to the mathematical model correction method described in Section 3.1, with the temperature rise experiment as a reference, the equivalent coefficient is calculated iteratively to correct the calculation formula of heat generation and the convection heat transfer coefficient of a 6311 ball bearing. The application of radial load and speed under each working condition of the temperature rise experiment are shown in Table 5. During the iteration process, the change in the equivalent coefficient in heat generation under different working conditions is recorded, as shown in Figure 6. The polynomial data fitting method is used to fit the equivalent coefficient at different speeds, and the fitted equivalent coefficient formula of heat generation is obtained as follows:
n G = 1.65 × 10 12 n 3 + 2.65 × 10 8 n 2 1.49 × 10 4 n + 0.3695
where n is the bearing speed. The equivalent coefficient of convective heat transfer under different working conditions is a constant value, and its expression is
n g = 0.363
The corrected heat generation can be described as
G n e w = n G × π M n / 30 × 10 3 = 1.65 × 10 12 n 3 + 2.65 × 10 8 n 2 1.49 × 10 4 n + 0.3695 × π M n / 30 × 10 3
and the corrected lubricant convection heat transfer coefficient can be described as
h g n e w = n g × 0.0332 k g P g 1 3 π n c 60 v g 1 2 = 0.363 × 0.0332 k g P g 1 3 π n c 60 v g 1 2
The comparison curve between the corrected temperature rise simulation value and the experimental value is shown in Figure 7, which demonstrates that the experimental value is well consistent with the simulation value, and the steady-state temperature field analyzed by the corrected mathematical model can reflect the actual bearing temperature distribution. The durability experimental data used to verify the accuracy of the empirical formula after correction with the verification results is shown in Figure 8. The simulation temperature of the inner surface of the inner ring is largely consistent with experimental temperature, while the simulation value of the outer surface of the outer ring is slightly higher than the experimental value. Considering the complexity of the experimental conditions, the corrected mathematical model is accurate for transient temperature analysis.

4. Analysis of the Thermal Performance and Temperature Field

4.1. Analysis of the Temperature Distribution of the Rolling Bearing

In order to study the heat transfer law of each component of the rolling bearing, the corrected mathematical model is used to calculate heat generation and convective heat transfer coefficient. Take the temperature rise experiment condition shown in Table 5 as an example; the transient temperature field of the rolling bearing is analyzed. The final steady-state temperature distribution of the overall ball bearing and cross-section temperature distribution are shown in Figure 9, which reveals that the temperature gradient boundary of the rolling bearing after reaching the thermal stability state is obvious: the temperature is highest in the inner ring and lowest in the outer ring, with the rolling temperature gradually decreasing from the inner ring contact point to the outer ring contact point, and there is no pronounced temperature difference between the outer ring, inner ring and cage. The 6311 ball bearing has eight rolling bodies, with its overall temperature distribution showing 1/8 periodic symmetry. Five points of the longitudinal section centerline are taken as research objects, namely the outer surface temperature node of the outer ring, the temperature node of the contact point between the outer ring and the rolling body, the center temperature node of the rolling body, the temperature node of the contact point between the rolling body and the inner ring, and the inner surface temperature node of the inner ring. The temperature distribution on the five points is shown in Figure 10.
As can be seen from Figure 9, of the five temperature nodes, the temperature is the highest at the contact point between the inner ring and rolling body and the inner surface of the inner ring. The contact points of the inner ring and the rolling body and the outer ring and the rolling body are where friction heat and bearing heat are generated. The generated heat then causes the temperature to rise in the rolling body, inner ring and outer ring via heat conduction. The temperature in the outer surface of the outer ring is lower than that of the inner ring since the outer surface is in contact with the bearing chamber, which allows the heat to dissipate through conduction.

4.2. Influence of Speed and Load on Bearing Temperature

In the process of rolling bearing rotation, bearing temperature is directly related to speed and load. In order to analyze the influence of speed and load on the temperature field of the ball bearing, the parametric analysis and calculation are carried out under the conditions of constant load/variable speed and constant speed/variable load, and the change in transient temperature is compared. The average temperature of the bearing is shown in Figure 11. It can be seen from the figure that, with the increase in rotating speed and load, the heat generated rises and the bearing temperature gradually goes up. Because the transient stability time is affected by both heat generation and the convective heat transfer coefficient, the shorter the heat generation is, the smaller the convective heat transfer coefficient is, and the longer the stability time is; therefore, the transient temperature of the bearing at low speed takes a longer time to stabilize. Compared with the transient temperature of Figure 11a,b, the contribution of load to temperature rise is smaller. When the radial load increases from 0 to 2650 N, the average steady-state temperature merely goes up approximately 1 °C; therefore, it can be inferred that the bearing speed has a greater impact on the bearing temperature rise.

5. Conclusions

The thermal performance is the key factor in securing the safe operation of the bearing. The traditional empirical formula of temperature analysis cannot be directly applied to the transient temperature analysis of a rolling bearing in the traction motor of a high-speed EMU. On this basis, the application of the relevant mathematical model is extended, and the thermal performance and temperature distribution of a grease-lubricated bearing under different working conditions are studied. The conclusions are as follows:
(1)
A correction of the mathematical model related to temperature analysis is proposed, and an accurate calculation formula for the heat generation and lubricant convection heat transfer coefficient of a ball bearing at the non-driving end in the traction motor of a high-speed EMU is derived. The accuracy of results is verified with durability experiment data.
(2)
The temperature distribution law of a grease-lubricated bearing under different working conditions is studied, and the heat transfer mechanism of each component of the rolling bearing is revealed. The ball bearing shows an obvious temperature distribution, with the temperature gradually falling from the inner ring to the outer ring.
(3)
Under the condition of constant load/variable speed and constant speed/variable load, the influence of bearing speed and radial load on bearing temperature is analyzed. The results show that the contribution of speed to bearing temperature is much higher than that of load.
Considering the difference in bearing components’ friction degrees under different working conditions, the formula of the heat generation and lubricant convection heat transfer coefficient of a cylindrical roller bearing at the driving end in the traction motor of a high-speed EMU require further investigation. In addition, the application of the empirical formula correction method proposed in this paper to transient temperature analysis of other bearing types needs further study.
Furthermore, the high temperature of the bearing is likely to cause mechanical thermal expansion, and the heat generated by a rolling bearing after thermal expansion will also have an impact on its temperature field; hence, there is a mutual inverse influence between thermal and mechanical expansion. In future research, we will establish a thermal mechanical coupling model of rolling bearings and analyze the mutual inverse influence between thermal and mechanical factors, and finally predict the dynamic change in bearing temperature.

Author Contributions

Conceptualization, J.C.; formal analysis, Y.W., J.C. and G.A.; investigation, Y.W., R.L. and H.Y.; methodology, Y.W. and J.C.; project administration, Y.W.; resources, Q.T. and Y.Z.; software, Y.W.; supervision, J.C., Q.T. and Y.Z.; validation, Y.W.; writing—original draft, Y.W.; writing—review & editing, Q.T. All authors have read and agreed to the published version of the manuscript.

Funding

This work was supported by the National Natural Science Foundation of China (Grant Number 51777008, 51577007).

Acknowledgments

We thank the editors and reviewers for their comments. We thank the National Natural Science Foundation of China (Grant Number 51777008, 51577007) for support.

Conflicts of Interest

The authors declare no conflicts of interest.

Nomenclature

C 0 bearing rated static load (N) n bearing speed (r/min)
D bearing pitch diameter (m) n c speed of bearing cage (r/min)
D c h diameter of bearing chamber (m) n g equivalent coefficient of convective heat transfer
f 0 coefficient related to bearing type and lubrication method n G fitted equivalent coefficient formula of heat generation
f 1 coefficient related to bearing type and load P 0 bearing equivalent static load (N)
F r bearing radial load (N) P 1 calculated load to determine bearing friction moment (N)
F a bearing axial load (N) P g lubricant grease Prandtl number
G heat generation (W) t st transient stability time
G n e w corrected heat generation (W) T max final temperature stability value
h g lubricant grease convective heat transfer coefficient (W·m−2·°C−1) u g surface speed of bearing cage (m/s)
h g n e w corrected lubricant convection heat transfer coefficient u a i r flow rate of air (m/s)
k g lubricant grease thermal conductivity (W·m−1·K−1) v lubricant kinematic viscosity(m2/s)
k a i r thermal conductivity of air (W·m−1·K−1) v g lubricant grease kinematic viscosity (m2/s)
M friction torque of rolling bearing(N·m) v a i r kinematic viscosity of air(m2/s)
M 1 moment related to lubricant hydrodynamic losses (N·m) α convection heat transfer coefficient between bearing outer surface and air
M 2 moment related to load various friction losses (N·m)

References

  1. Yu, G. Fault feature extraction using independent component analysis with reference and its application on fault diagnosis of rotating machinery. Neural Comput. Appl. 2015, 26, 187–198. [Google Scholar] [CrossRef]
  2. Huang, W.; Sun, H.; Luo, J.; Wang, W. Periodic feature oriented adapted dictionary free OMP for rolling element bearing incipient fault diagnosis. Mech. Syst. Signal Process. 2019, 126, 137–160. [Google Scholar] [CrossRef]
  3. Kavathekar, S.; Upadhyay, N.; Kankar, P.K. Fault Classification of Ball Bearing by Rotation Forest Technique. Procedia Technol. 2016, 23, 187–192. [Google Scholar] [CrossRef] [Green Version]
  4. Wang, S.; Cusano, C.; Conry, T.F. A dynamic model of the torque and heat generation rate in tapered roller bearings under excessive sliding conditions. Tribol. Trans. 1993, 36, 513–524. [Google Scholar] [CrossRef]
  5. Palmgren, A. Ball and Roller Bearing Engineering, 3rd ed.; SKF Industries Inc.: Philadelphia, PA, USA, 1959. [Google Scholar]
  6. Harris, T.A. Rolling Bearing Analysis, 2nd ed.; John Wiley and Sons: New York, NY, USA, 1984. [Google Scholar]
  7. Changenet, C.; Marlot, X.O.; Velex, P. Power loss predictions in geared transmissions using thermal networks-applications to a six-speed manual gearbox. J. Mech. Des. 2006, 128, 618–625. [Google Scholar] [CrossRef]
  8. Ma, F.; Li, Z.; Qiu, S.; Wu, B.; An, A. Transient thermal analysis of grease-lubricated spherical roller bearings. Tribol. Int. 2016, 93, 115–123. [Google Scholar] [CrossRef]
  9. Hao, X.; Yun, X.; Han, Q. Thermal-Fluid-Solid Coupling in Thermal Characteristics Analysis of Rolling Bearing System under Oil Lubrication. J. Tribol. 2019, 142, 1–41. [Google Scholar] [CrossRef]
  10. Zheng, D.; Chen, W. Thermal performances on angular contact ball bearing of high-speed spindle considering structural constraints under oil-air lubrication. Tribol. Int. 2017, 109, 593–601. [Google Scholar] [CrossRef]
  11. Yan, W.; Xiao-Dong, R.; Xue-Song, L.; Chun-Wei, G. Numerical Investigation of Air-Oil-Thermal Coupling Mechanism in Floating Ring Bearings. J. Tribol. 2017, 140, 031701. [Google Scholar] [CrossRef]
  12. Sibilli, T.; Igie, U. Transient Thermal Modeling of Ball Bearing Using Finite Element Method. J. Eng. Gas Turbines Power: Trans. ASME 2018, 140, 032501. [Google Scholar] [CrossRef]
  13. Pouly, F.; Changenet, C.; Ville, F. Investigations on the power losses and thermal behavior of rolling element bearings. Proc. Inst. Mech. Eng. Part J: J. Eng. Tribol. 2010, 224, 925–933. [Google Scholar] [CrossRef]
  14. Neurouth, A.; Changenet, C.; Ville, F.; Arnaudon, A. Thermal modeling of a grease lubricated thrust ball bearing. Proc. Inst. Mech. Eng. Part J: J. Eng. Tribol. 2014, 228, 1266–1275. [Google Scholar] [CrossRef]
  15. Li, X.H.; Lv, Y.F.; Yan, K.; Liu, J.; Hong, J. Study on the influence of thermal characteristics of rolling bearings and spindle resulted in condition of improper assembly. Appl. Therm. Eng. 2017, 114, 221–233. [Google Scholar] [CrossRef] [Green Version]
  16. Yan, K.; Hong, J.; Zhang, J.; Mi, W.; Wu, W. Thermal-deformation coupling in thermal network for transient analysis of spindle-bearing system. Int. J. Therm. Sci. 2016, 104, 1–12. [Google Scholar] [CrossRef]
  17. Blanuša, V.; Zeljković, M.; Milisavlevich, B.M.; Savić, B. Mathematical modelling of thermal behaviour of cylindrical roller bearing for towed railway vehicles. Teh. Vjesn. Tech. Gaz. 2017, 24, 211–217. [Google Scholar]
  18. Ai, S.; Wang, W.; Wang, Y.; Zhao, Z. Temperature rise of double-row tapered roller bearings analyzed with the thermal network method. Tribol. Int. 2015, 87, 11–22. [Google Scholar] [CrossRef]
  19. De-Xing, Z.; Weifang, C.; Miaomiao, L. An optimized thermal network model to estimate thermal performances on a pair of angular contact ball bearings under oil-air lubrication. Appl. Therm. Eng. 2018, 131, 328–339. [Google Scholar] [CrossRef]
  20. Song, Y.; Gu, C.W. Development and Validation of a Three-Dimensional Computational Fluid Dynamics Analysis for Journal Bearings Considering Cavitation and Conjugate Heat Transfer. J. Eng. Gas Turbines Power: Trans. ASME 2015, 137, 122502. [Google Scholar] [CrossRef]
  21. Eckert, E. Introduction to the Transfer of Heat and Mass; McGraw-Hill: New York, NY, USA, 1950. [Google Scholar]
  22. Ma, C.; Yang, J.; Zhao, L.; Mei, X.; Shi, H. Simulation and experimental study on the thermally induced deformations of high-speed spindle system. Appl. Therm. Eng. 2015, 86, 251–268. [Google Scholar] [CrossRef]
  23. Takabi, J.; Khonsari, M.M. Experimental testing and thermal analysis of ball bearings. Tribol. Int. 2013, 60, 93–103. [Google Scholar] [CrossRef]
  24. Badruddin, I.A.; Zainal, Z.A.; Narayana, P.A.; Seetharamu, K.N. Numerical analysis of convection conduction and radiation using a non-equilibrium model in a square porous cavity. Int. J. Therm. Sci. 2007, 46, 20–29. [Google Scholar] [CrossRef]
  25. Burton, R.A.; Staph, H.E. Thermally activated seizure of angular contact bearing. ASLE Trans. 1967, 10, 408–417. [Google Scholar] [CrossRef]
  26. Mcgregor, W.M.; Fomara, D.; Pellizzon, T.; Bassi, G.L. Process for the Cleaning of Oil and Gas Wellbores. U.S. Patent 6672388, 27 May 2004. [Google Scholar]
  27. Crecelius, W.J.; Pirvics, J. Computer Program Operation Manual on SHABERTH. A Computer Program for the Analysis of the Steady State and Transient Thermal Performance of Shaft-Bearing Systems; SKF Industries INC King of Prussia PA Research LAB; Defense Technical Information Center: Fort Belvoir, VA, USA, 1976. [Google Scholar]
Figure 1. 3D section and mesh division of a transient bearing temperature solution model.
Applsci 10 04373 g001
Figure 2. Overall block diagram and the experimental device on the bearing lubrication experiment bench for a high-speed traction motor. (a) Overall block diagram; (b) Experimental device.
Applsci 10 04373 g002
Figure 3. Temperature contrast curve between the durability experiment and the transient temperature field simulation.
Applsci 10 04373 g003
Figure 4. Correction process flow chart of the empirical formula.
Applsci 10 04373 g004
Figure 5. Schematic diagram of transient evaluation indexes.
Applsci 10 04373 g005
Figure 6. Equivalent coefficient of heat generation under different working conditions.
Applsci 10 04373 g006
Figure 7. Comparison curve of the corrected temperature rise simulation value and the experimental value.
Applsci 10 04373 g007
Figure 8. Durability experiment verification results.
Applsci 10 04373 g008
Figure 9. Temperature distribution of overall ball bearing and cross section after steady state: (a) overall ball bearing; (b) cross section.
Applsci 10 04373 g009
Figure 10. Temperature distribution on the centerline of the longitudinal section.
Applsci 10 04373 g010
Figure 11. Average temperature curve of constant load/variable speed and constant speed/variable load. (a) Constant load/variable speed; (b) Constant speed/variable load.
Applsci 10 04373 g011
Table 1. Basic dimension parameters of a ball bearing in the traction motor of a high-speed EMU.
TypeOut Diameter
/mm
Inner Diameter
/mm
Number of Balls/RollersWidth/mm
Ball bearing12055829
Table 2. Value of coefficients related to bearing type and lubrication method with different lubrication types.
TypeOil-Mist LubricationOil-Bath/Grease LubricationVertical Oil-Bath/Spray-Grease Lubrication
Ball bearing0.7~11.5~23~4
Table 3. Calculation method of coefficient related to bearing type/load and calculated load value.
Type f 1 P 1
Ball bearing 0.0009 P 0 / C 0 0.55 3 F a 0.1 F r
Table 4. Performance parameters of lubricant grease.
Base-Oil TypeKinematic ViscosityThermal ConductivityPrandtl Number
Synthetic oil88.74 m m 2 / s 0.1324 W m 1 K 1 1532.44
Table 5. Bearing temperature rise experiment condition.
Time/min90180270360450540
Speed/rpm150024004200490056006200
Radial load/N265026502650265026502650

