1. Introduction
The global navigation satellite systems (GNSS) applicability has lately dramatically increased. We can now name numerous applications that use or completely rely on GNSS signals and services [
1,
2,
3]. GNSS systems can provide good accuracy and availability under normal conditions. However, their signals are prone to various disruption sources, including multipath and signal interference [
4,
5,
6]. The latter could be unintentional, such as interfering the signal with other signals in the same frequency band or, could be intentional (commonly known as signal jamming), which is the fiddliest one. Signal jamming could cause severe functional hazards to a GNSS receiver. Examples of these unwanted effects are large position, velocity, and timing (PNT) errors, or a complete denial of service.
Many real jamming incidents have been reported during the past decade. A real jamming incident that happened at Newark Airport in 2013 was reported in [
7]. A worker wanted to hide from his company’s fleet tracking system; therefore, he operated a small jamming device, but the effect went wider than that. The in-the-area ground-based augmentation system (GBAS), a system used to assist aircraft during take-off and landing, consequently suffered from casual failures for about two years until the occurrences were identified by the US Federal Communications Commission (FCC) as jamming incidents. On top of the losses the authorities suffered, the individual was also fined with the amount of about U.S.
$32,000. A more recent incident, which immediately underwent a police investigation, is what happened in Hong Kong in October 2018 where more than 40 drones fell from the sky while performing a professional light show. The damage cost, consequently reported, was about U.S.
$127,500. According to the same source [
8], the Hong Kong Tourism Board’s Executive Director, Anthony Lau, articulated that the case was not a computer hacking, as initially concluded by police authorities, rather it was due to a global positioning system (GPS) signal jammer.
Although some receivers have anti-jamming techniques incorporated in their inner circuitry or using special antenna arrangements, jamming effects in many cases cannot be predicted; thus, it is essential to conduct studies about the behavior of GNSS receivers under real signal jamming situations. Some studies have investigated this issue before from different perspectives. Nonetheless, this paper adds a remarkable discussion to the literature. GPS only or GPS/Galileo receivers have been considered in the previous literature [
9], whereas this study addresses GPS/GLONASS receivers. The paper first discusses the benefits of using multi-constellation receivers over GPS-only receivers under signal jamming conditions. Secondly, the paper also investigates the behavior and response of theses receivers to different types of jamming signals.
2. The Architecture of GPS Receiver
Figure 1 shows the high-level architecture of a GPS receiver [
3,
10]. The GPS receiver signal processing mainly consists of two stages, namely the radio frequency (RF) front-end stage and the signal processing stage. The main functions of the RF front-end are to amplify, downconvert, and sample the incoming GPS signal. The preamplifier magnifies and filters the received signal. Then, the preamplifier’s output is shifted by the down converter from the GPS RF carrier frequency (L1) to a lower intermediate frequency (IF). The lower IF frequency is easier to deal with than the original incoming signal [
11]. The signal is finally sampled by the IF sampling to be passed to the signal processing stage.
Signal acquisition is the first step in processing the sampled GPS IF data. The primary purpose of the signal acquisition is to detect any visible satellites and to provide a coarse estimate about the signal parameters of the satellites in view [
11,
12,
13,
14]. There are three key parameters to be determined during the acquisition process, which are the C/A codes of the available satellites, their respective C/A-code phases, and carrier frequencies. The acquisition process is a necessary step to determine an approximate Doppler and code phase for the satellite signal being tracked by the channel and to estimate a noise threshold. The estimated parameters are next passed to the second stage, which is the channel tracking loops. The tracking loops attempt to clampdown on the estimated parameters so that the satellite signal can be kept in lock, and continuous measurements can be accordingly generated. It is used to generate precise replicas of the incoming code and carrier. The local code and carrier can be correctly generated only if the signal parameters are correctly tracked. There are two main types of tracking loops depending on the tracked property of the signal. The first type is the code tracking loop, which is called the delay lock loop (DLL). The DLL provides an estimate of the code phase of the C/A code being tracked. The second are the carrier tracking loops which track the incoming carrier phase and frequency via a phase lock loop (PLL) and frequency lock loop (FLL), respectively. The code and carrier tracking loops are coupled in the sense that DLL needs an accurate estimate of the incoming carrier frequency as provided by the carrier loop.
When a receiver is in tracking mode, it needs to know if a signal is actually tracked and that the estimated parameters (code delay, carrier frequency, and phase) are correct. After the parameters of each visible satellite are estimated accurately, the navigation message can be extracted and decoded.
The signal parameters estimated by the tracking loops need to be converted into actual measurements (pseudo-range, Doppler frequency, and carrier phase) that can be used to obtain the navigation solution. In order to compute a navigation solution, the receiver must produce pseudo-ranges to at least four satellites and know the navigation data broadcast by satellites. The receiver can also solve for velocity using the Doppler measurements.
The effects of the jamming signal on the receiver mainly prevent receivers from tracking the GPS signals. A jammer with a GPS-like spread spectrum signal will have a significant signal denial range for the same power since it prevents the de-spreading processing gain and is difficult to detect by conventional methods such as spectrum analysis.
3. GNSS Anti-Jamming Techniques
Modern GNSS use direct sequence spread spectrum communication (DSSS), which has an inherent level of protection against signal interference, but these signals have low signal power levels, which make them conversely susceptible to signal jamming. Hence, anti-jamming techniques are required under jamming conditions to guarantee continuous navigation/positioning availability. Various anti-jamming methods have been documented in the literature, which could be employed at any of the different GNSS signal processing stages, i.e., from signal reception incident at the receiver antenna through the navigation solution processor [
15]. Accordingly, they are classified as such. For example, [
16] categorized anti-jamming techniques such as adaptive time-domain filtering, time-frequency domain processing, subspace processing, adaptive antennas, and amplitude-domain processing techniques. The selection of an anti-jamming technique depends on various factors, including cost, size, and power consumption [
17]. Nonetheless, we can categorize anti-jamming techniques into two main classes: signal processing-based and antenna-based methods.
A nonstationary anti-jamming technique was proposed in [
18] based on the assumption that the received GPS signal is a composite of the jammer signal, additive noise, and the desired GPS signals for GPS receivers. The method uses what is called the time-frequency distributions to characterize the jammer time-frequency characteristics. These are then used to build a mask that is applied to the received signal samples to block the jammer energy using orthogonal projection allowing only the GPS signals. The paper used signal simulations to demonstrate the performance of the proposed method with more than the 3 dB gain improvement in the signal-to-noise ratio (SNR) for a one-antenna versus two-antenna case. Unlike other anti-jamming techniques, research in [
19] presented an interference suppression method that exploits spatial signal processing but is based on the known temporal self-coherence structure of the GPS C/A signals. C/A-code patterns are repeated 20 times per every navigation message bit; thus, GPS signals inherent solid between-chip rate samples self-coherence. This fact is utilized to eliminate interference signals, which typically have temporal structures that are very different from those of the GPS signals. Results show that the proposed method could successfully cancel directional jammer signals at as high as 50 dB jamming to signal ratio (JSR). Further advantages of the algorithm are that it does not require synchronization between the satellite and the receiver nor the knowledge of the visible satellite positions. Performance evaluation of several anti-jamming techniques such as adaptive temporal filtering (ATF), space-time adaptive processing (STAP), and overlapped fast Fourier transform (OFFT) was done in [
15]. The paper also investigated the advantage of combining two of these algorithms in one method. Results indicate that individual algorithms show moderate jamming resistance at JSR levels around 40 dB, whereas algorithm combinations show better jamming resistance at JSR as high as 60 dB. A new approach of jamming mitigation is introduced in [
20], which combines a time-domain notch filtering and a spatial filtering technique. This is to take advantage of the complementary characteristics of both techniques as the time-domain filtering is efficient in suppressing the continuous wave and narrowband interference since it addresses the signal in the time domain. Spatial filtering, on the other hand, is more applicable in mitigating the narrowband and wideband interference based on the direction of arrival of both signals and interferences. Thus, the suggested combination can mitigate the narrowband and wideband interference at once. This combination selection was also selected to avoid higher hardware requirements often demanded by frequency domain and space domain filtering combinations. The time-domain notch filter was applied before the spatial filter in the case of multiple interference signals since the time-domain filtering is meant to remove the narrowband interference signals, while the spatial filter is used to mitigate for the wideband interference. A linear antenna was simulated, and the results show that the proposed method could suppress strong narrowband and wideband interference simultaneously as high as 50 dB. The effect of real jammers on GPS and Galileo L1/E1 signals was investigated in [
21]. The study involved few survey-grade receivers and a high sensitivity (HS) software-defined receiver. An attenuator was used to control the transmitted jammer signal power, which ranged between 0–90 dB-Hz J/N0. Between constellation comparison demonstrated that both GPS and Galileo signals showed similar jamming resistance trends with the GPS signal loss of lock happened at around 83 dB-Hz versus a J/N0 of about 86 dB-Hz for Galileo signals. For the receivers, a 4 dB increase in C/N0 is experienced in a 12 MHz bandwidth for the HS receiver versus the other receivers due to the fact that only limited portion of the added noise caused by the jammer is allowed into the HS receiver which had a front-end bandwidth less than 12 MHz, whereas the survey receivers had front-end bandwidths equal to or greater than 12 MHz. This paper explores the effect of signal jammers on GPS/GLONASS receivers. Moreover, different types of jamming signals are considered.
4. Experimental Setup and Realistic Simulation Scenarios
The experimental evaluation of the impact of signal jammers on the commercial GNSS receiver was verified using semi-real data.
Figure 2 shows the experimental setup used in this research. The Spirent GSS6700 simulator controlled by SimGEN™ software, which can provide a controlled simulation environment and realistic simulation scenarios, is utilized to generate the RF GPS L1 and GLONASS L1 signals. The Keysight N5172B-502 vector signal generator is used to generate the RF jamming signal. Both the RF GNSS signal and the jamming signals are combined using the Spirent GSS8366 interference combiner unit. The output RF signal was logged using a commercial NovAtel SPAN SE GNSS receiver.
The trajectory time was set to 2 August 2017, at 12:00 am and lasts for around 15 min. The traveled distance was about 15 km in Kingston, Ontario, Canada with an initial latitude of 44°13′43.56″ N and longitude of 76°27′56.88″ W. The vehicle was stationary for 1 min, after which it accelerated until its speed reached 60 km/h as shown in
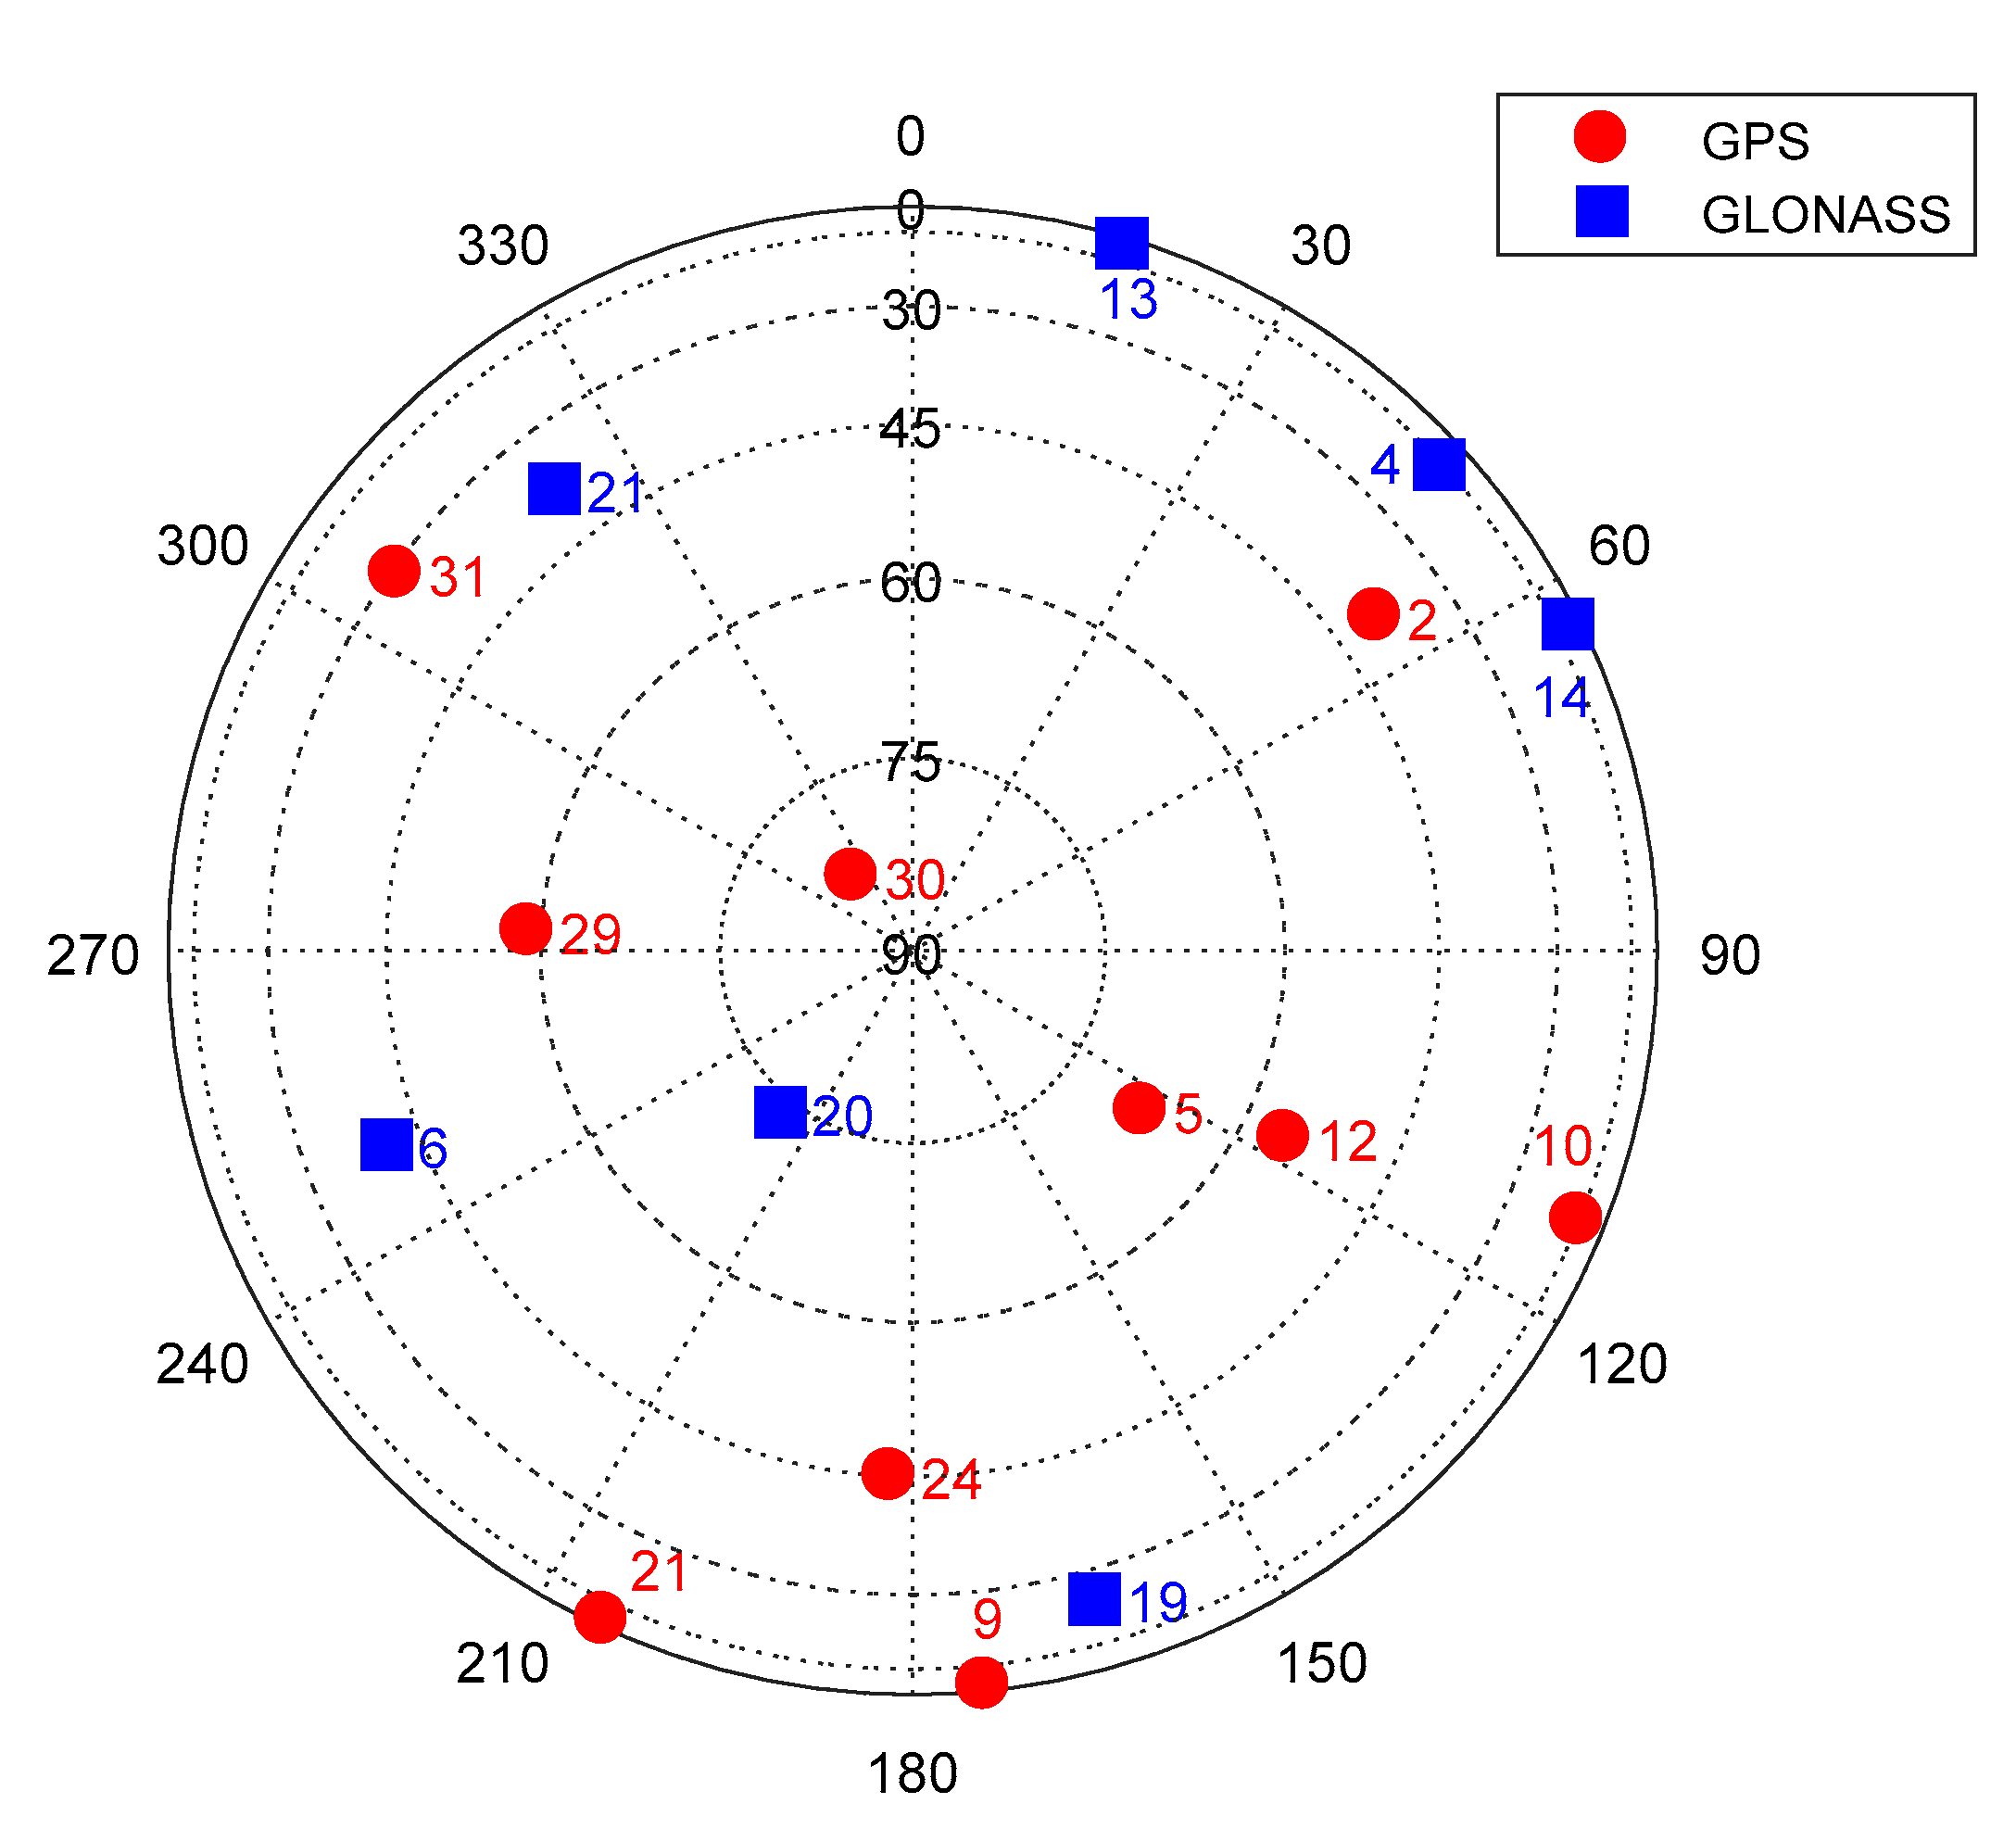
Figure 3. The trip started at the red circle indicated in the figure. The velocity changed between zero and 100 km/h with several turns until the vehicle stopped at the same starting point. Ten GPS satellites and seven GLONASS satellites were available at the time of the experiment. The sky plot of the available satellites is shown in
Figure 4.
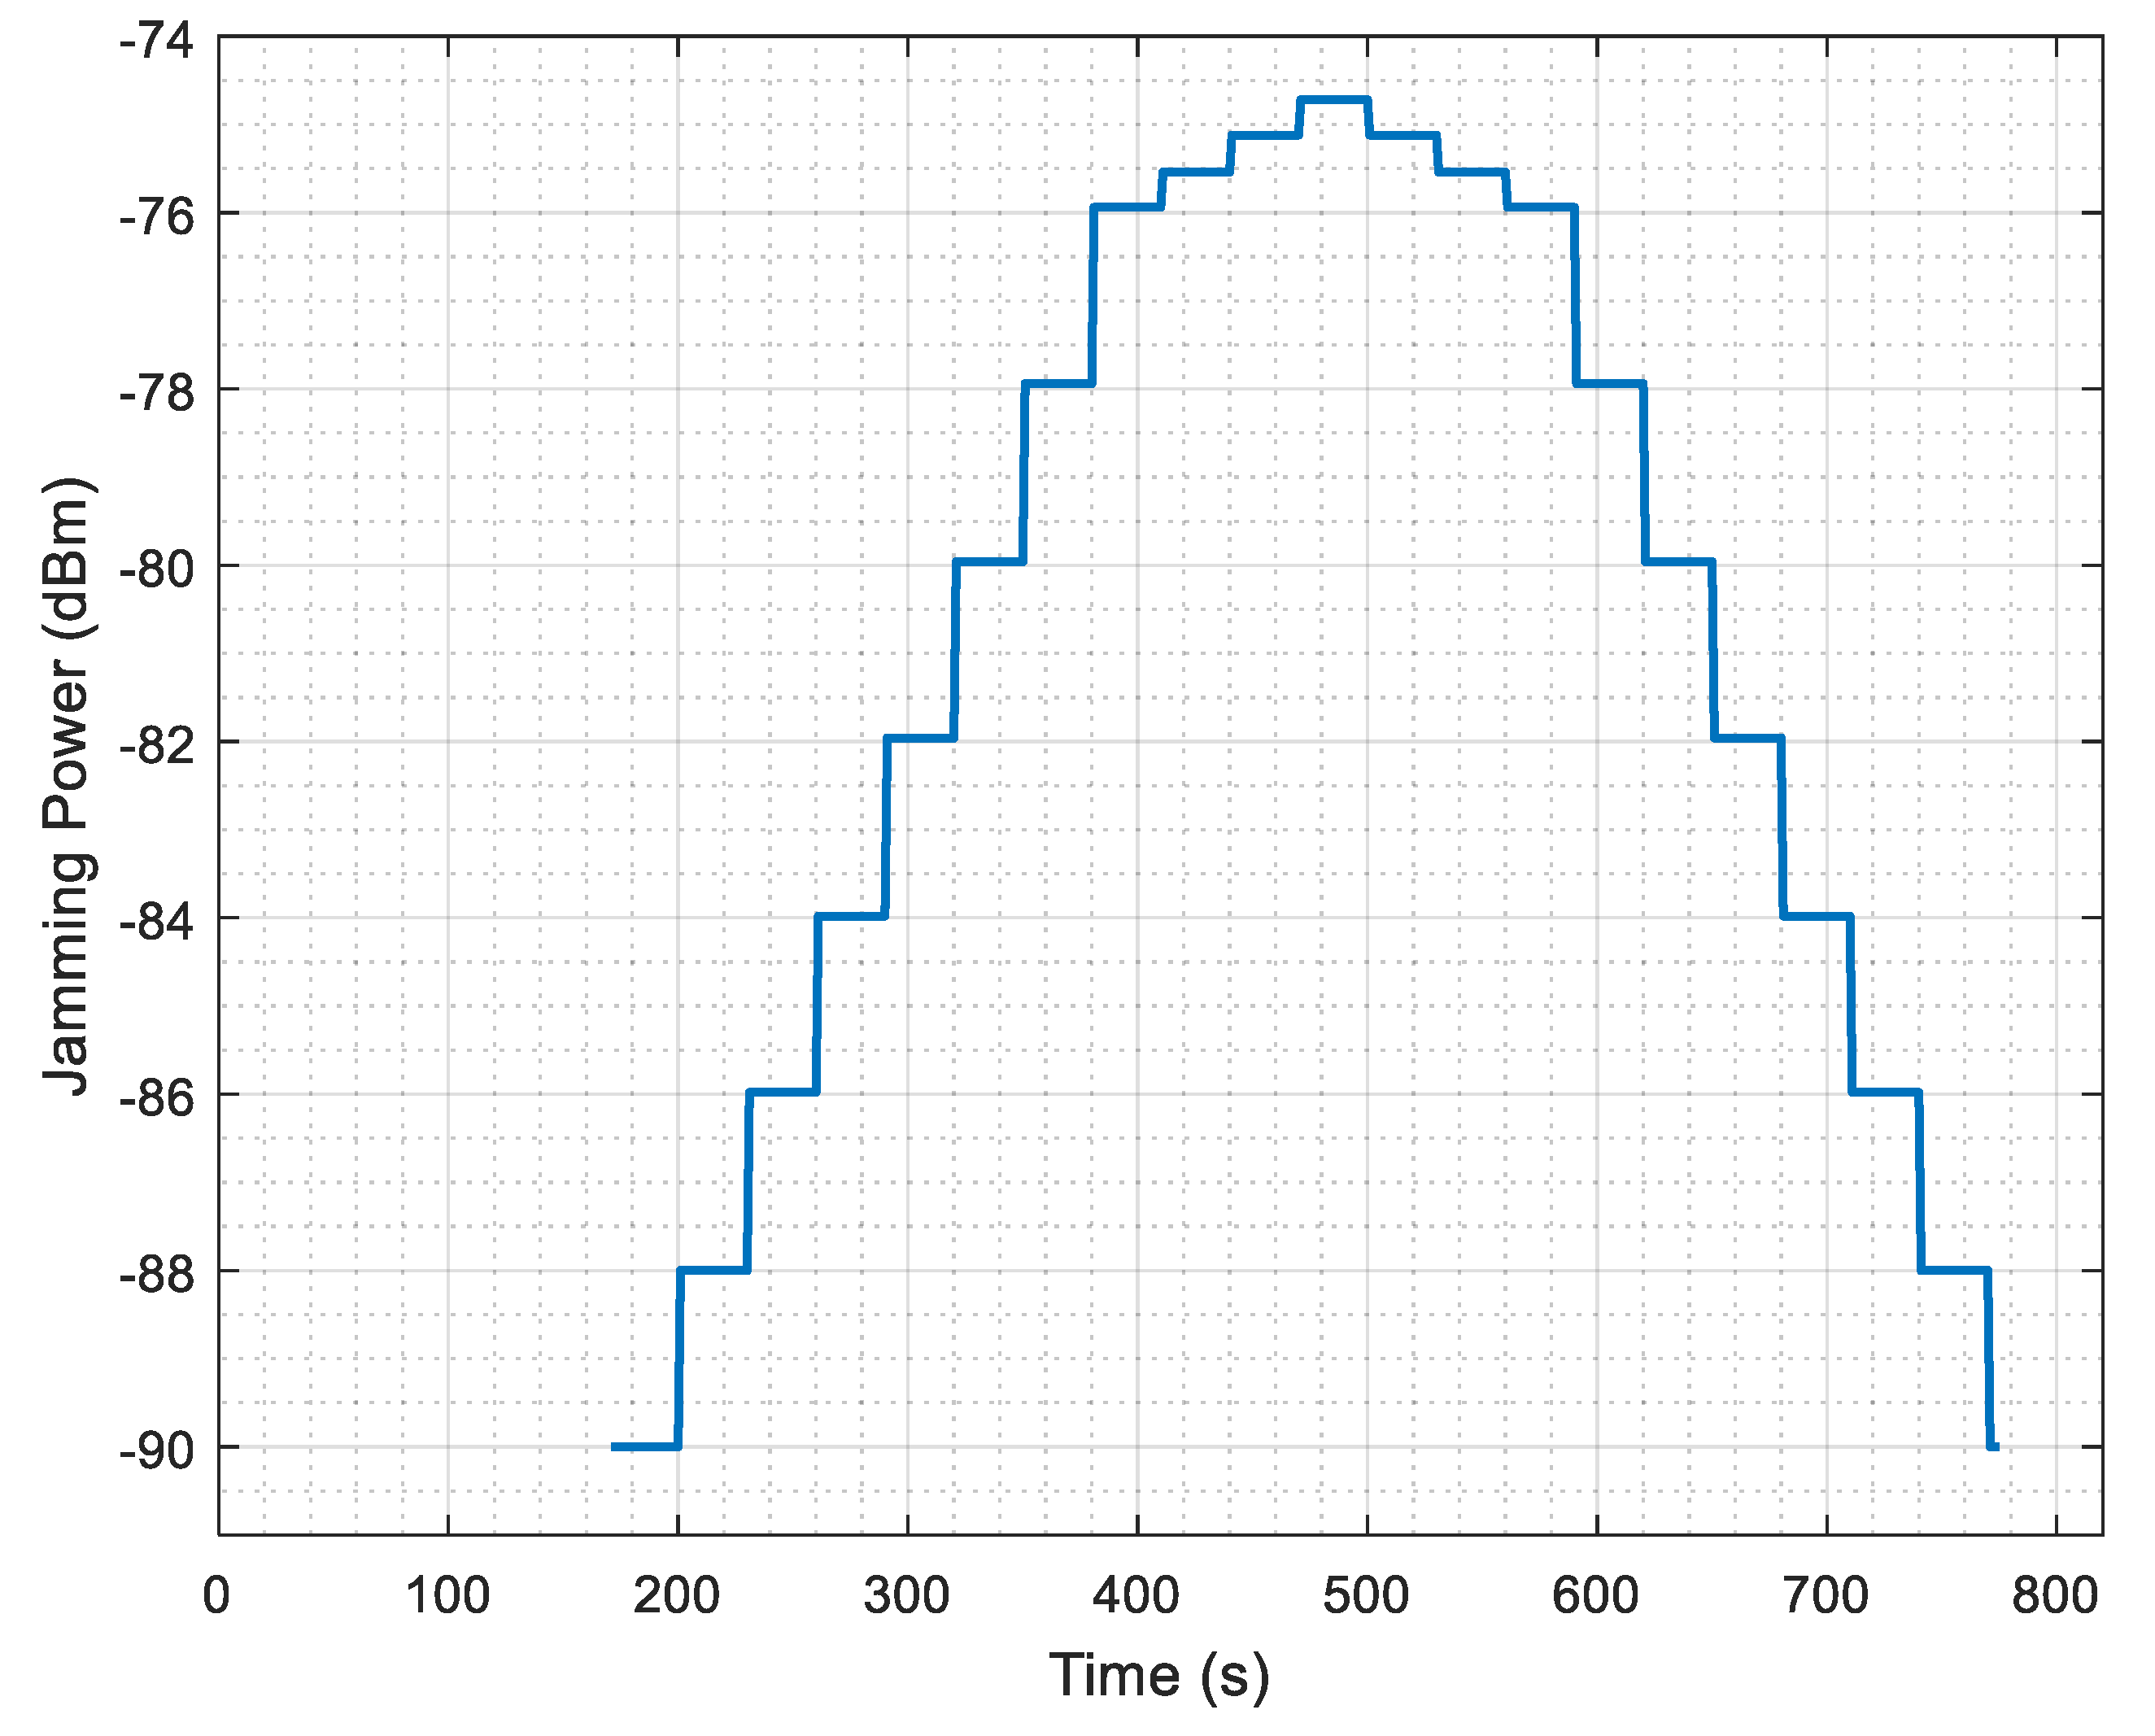
The jamming signal was operated after three minutes from the start of the trajectory and remained “ON” for 74.6% of the time of the whole trajectory. The jamming profile is shown in
Figure 5. Two jamming signals are considered in this paper, which are narrowband and wideband interference. The narrowband interference is chosen to be in the form of a continuous wave (CW) signal, one time targeting the GPS frequency band and another time targeting the GLONASS frequency band. Similarly, the wideband interference is generated using swept continuous wave (SCW) signals that span the whole band of either GPS or GLONASS as depicted in
Table 1.
The trajectory, as described above, is repeated six times for the purpose of comparing the effect of the selected jamming signals on the performance of a NovAtel SpanSE receiver. The interference signal targets one constellation at a time, i.e., either GPS L1 band or GLONASS L1 band as shown in
Table 2.
5. Results and Analysis
This section presents the results of the six scenarios mentioned above. The performance of a NovAtel SpanSE receiver is assessed using several evaluation metrics, including solution availability, dilution of precision (DOP), carrier-to-noise ratio, and positioning accuracy. The benefits of multi-constellation are explored by enabling only GPS constellation at a time, then repeating the same trajectory when both GPS and GLONASS are enabled. This section is structured as follows: First, it starts with the analysis of the results of scenarios #1 and #4, in which only GPS constellation is included in the position solution calculations. Second, the results of the remainder of the scenarios are presented; in which GPS/GLONASS constellations are enabled.
5.1. GPS-Only Constellation Scenarios
Examining
Table 3, the case of narrowband interference, the receiver was able to keep lock-onto at least 5 satellites at jamming power of −75.6 dBm, but lost lock to all satellites at jamming power of −75.2 dBm. On the other hand, in the case of wideband interference, the receiver maintained lock onto 5 satellites at jamming power of −82 dBm and lost track of all satellites at jamming power of −80 dBm. Therefore, the wideband interference resulted in a 6% lower solution availability compared to the narrowband interference, as can be seen in
Table 4.
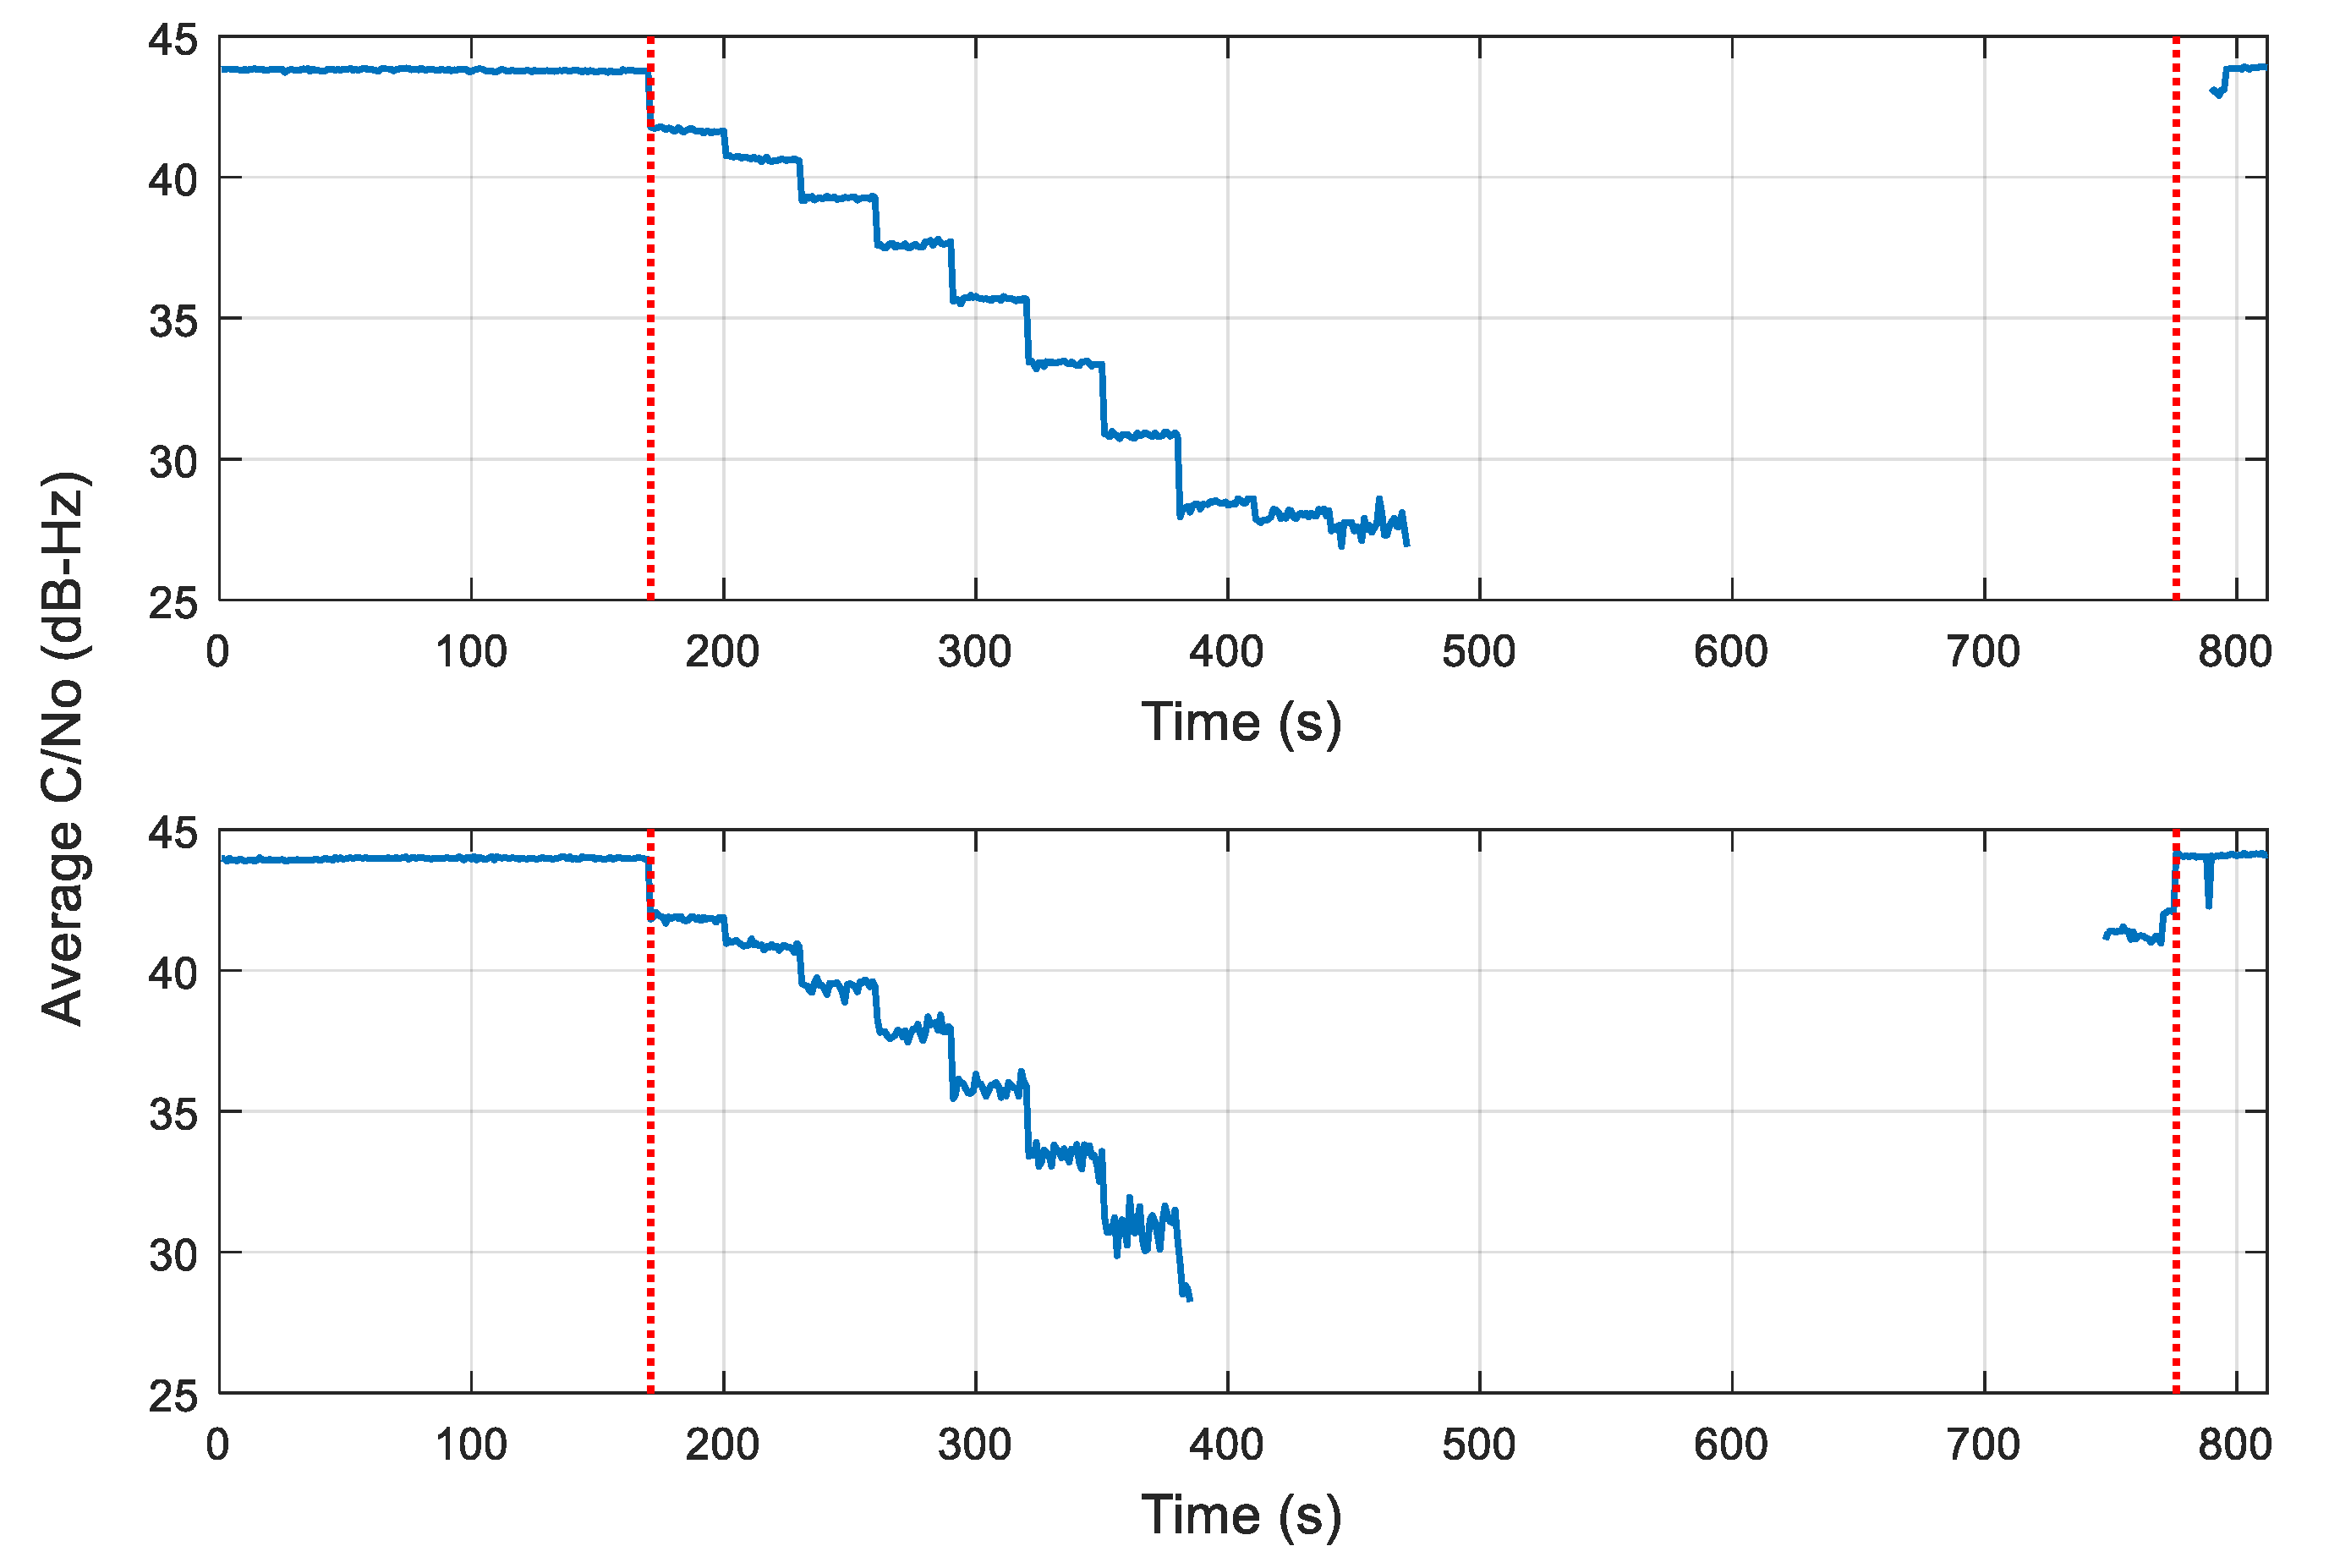
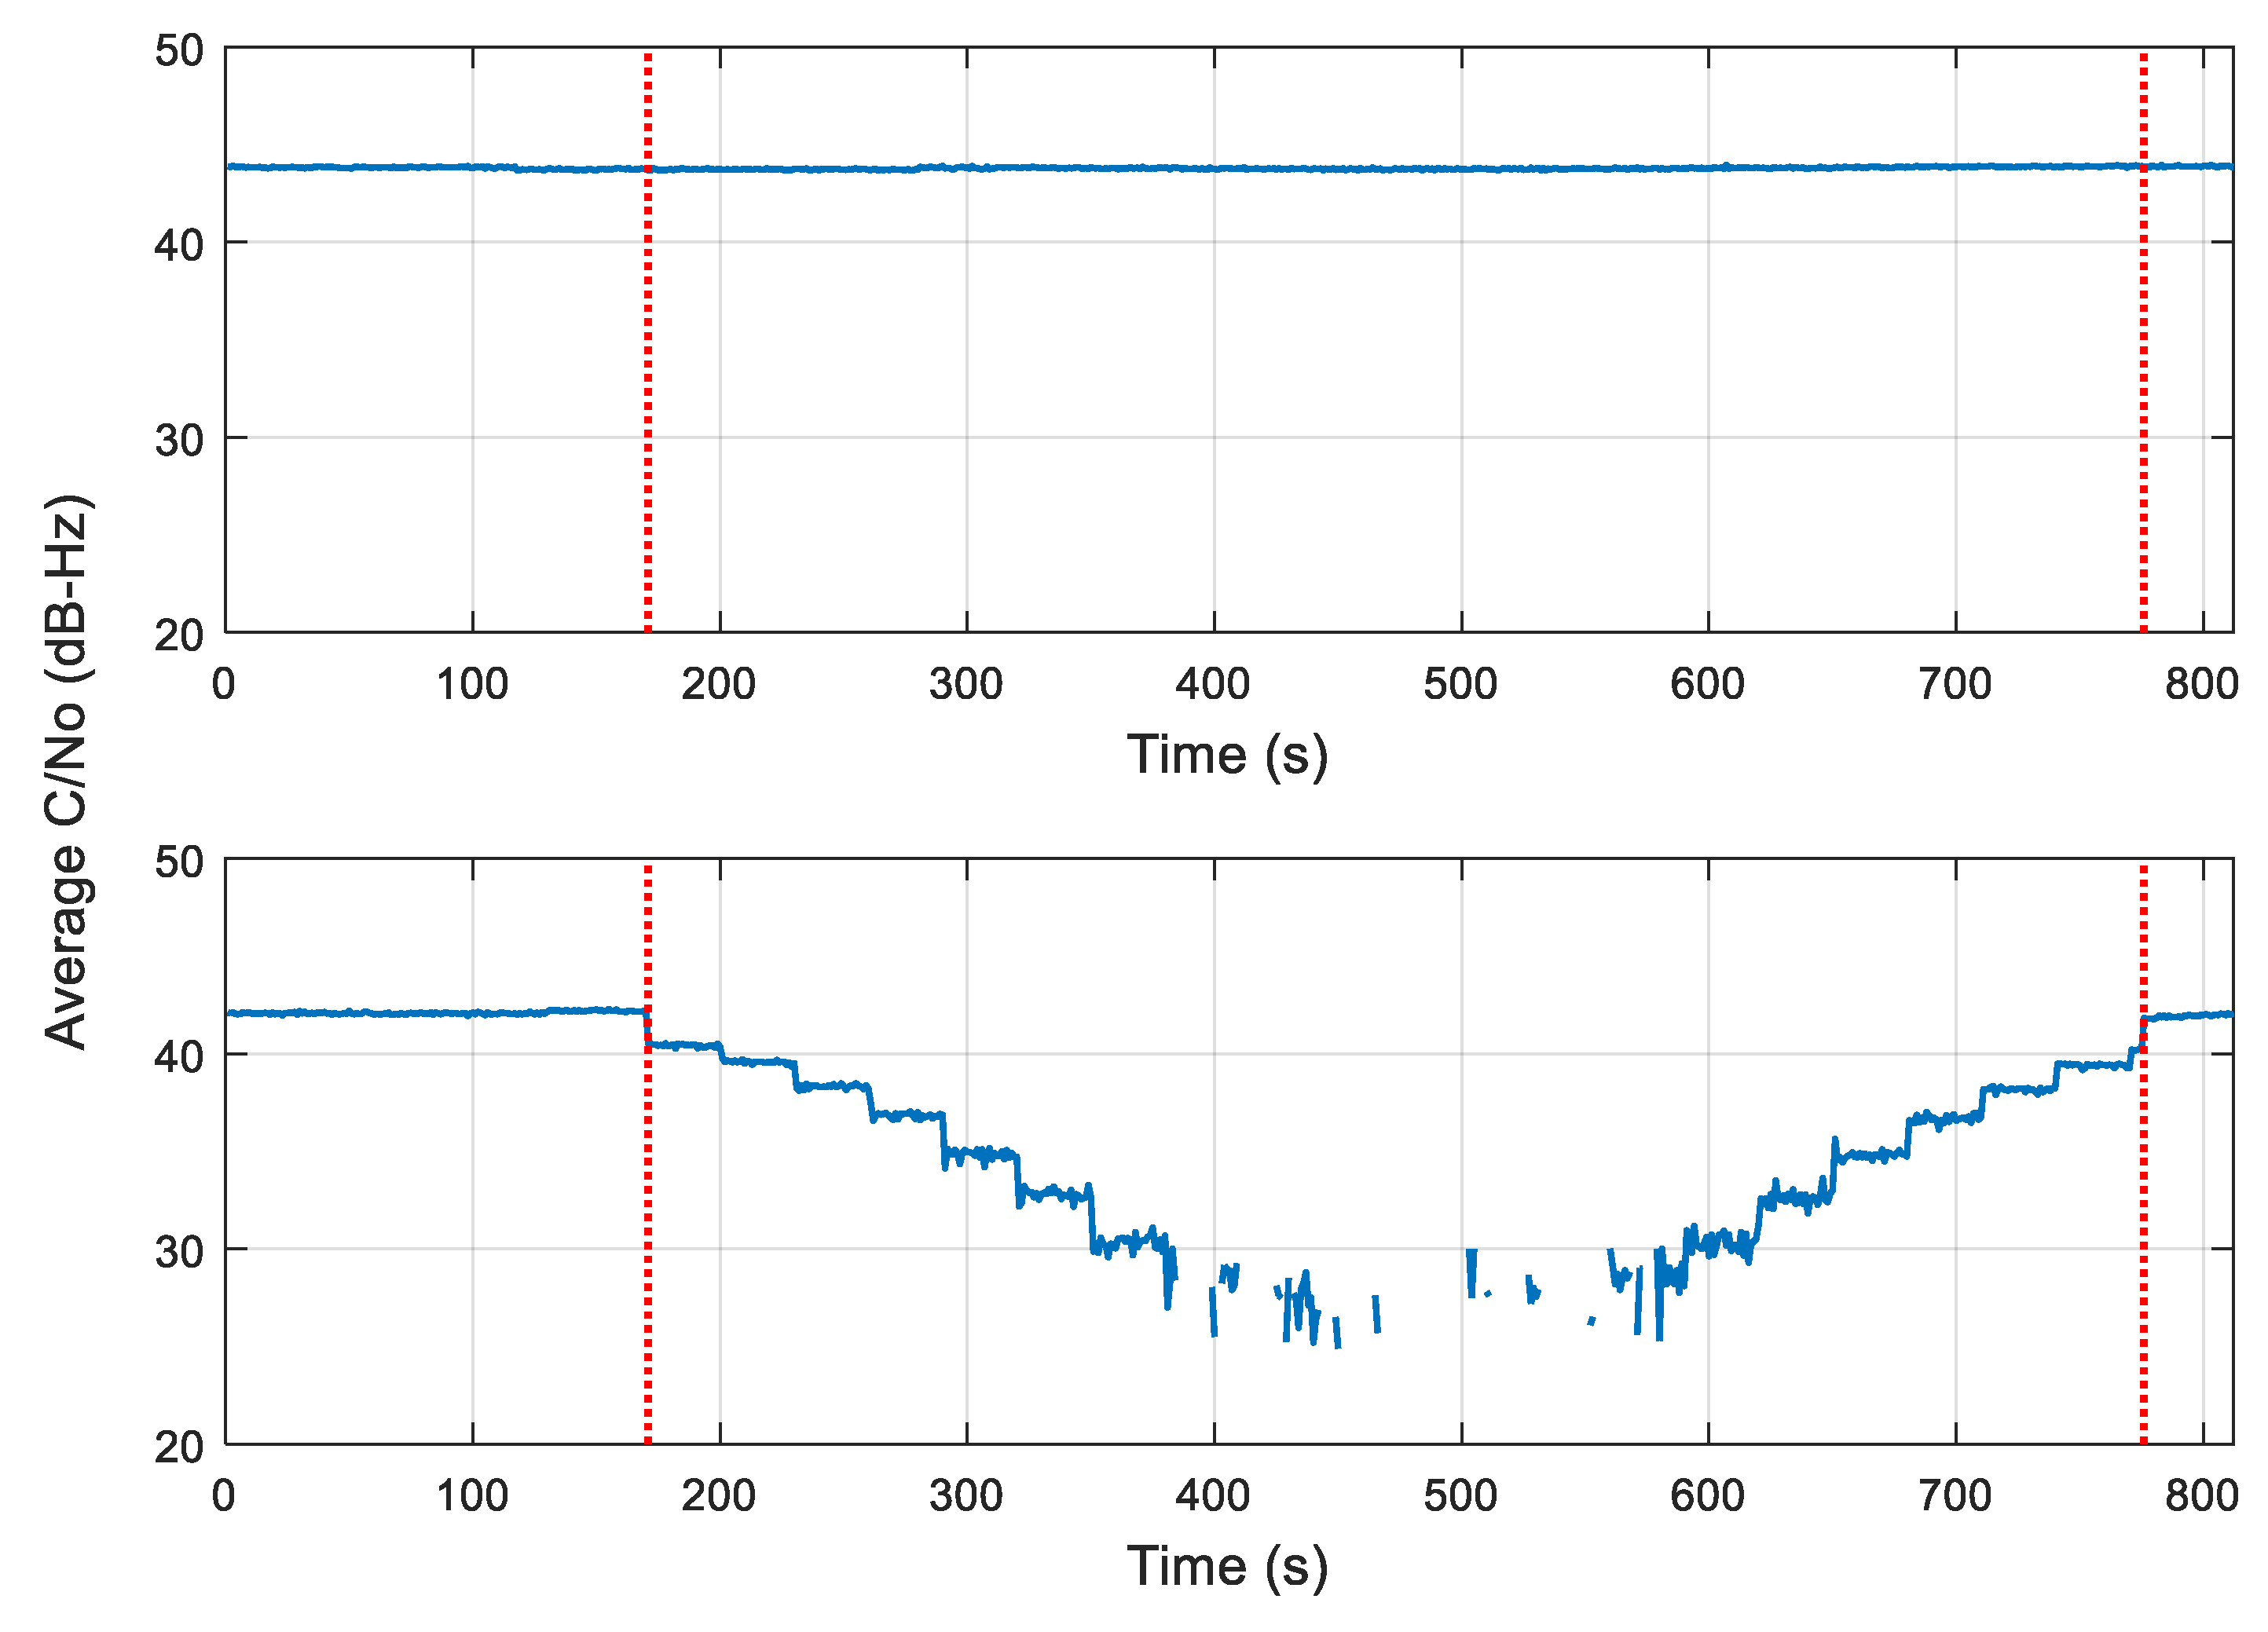
Figure 6 shows the average carrier-to-noise ratio for all available GPS satellites in each scenario. In this figure and all subsequent sections, the red-dotted vertical lines denote the period at which the jamming signal was applied. In both narrowband and wideband interference scenarios, the signal was totally lost when the carrier-to-noise ratio dropped below 27 dB-Hz. The figure clearly shows the outage the receiver experienced in both scenarios. It can also be noted that the receiver went into an outage in the case of wideband interference before the narrowband scenario.
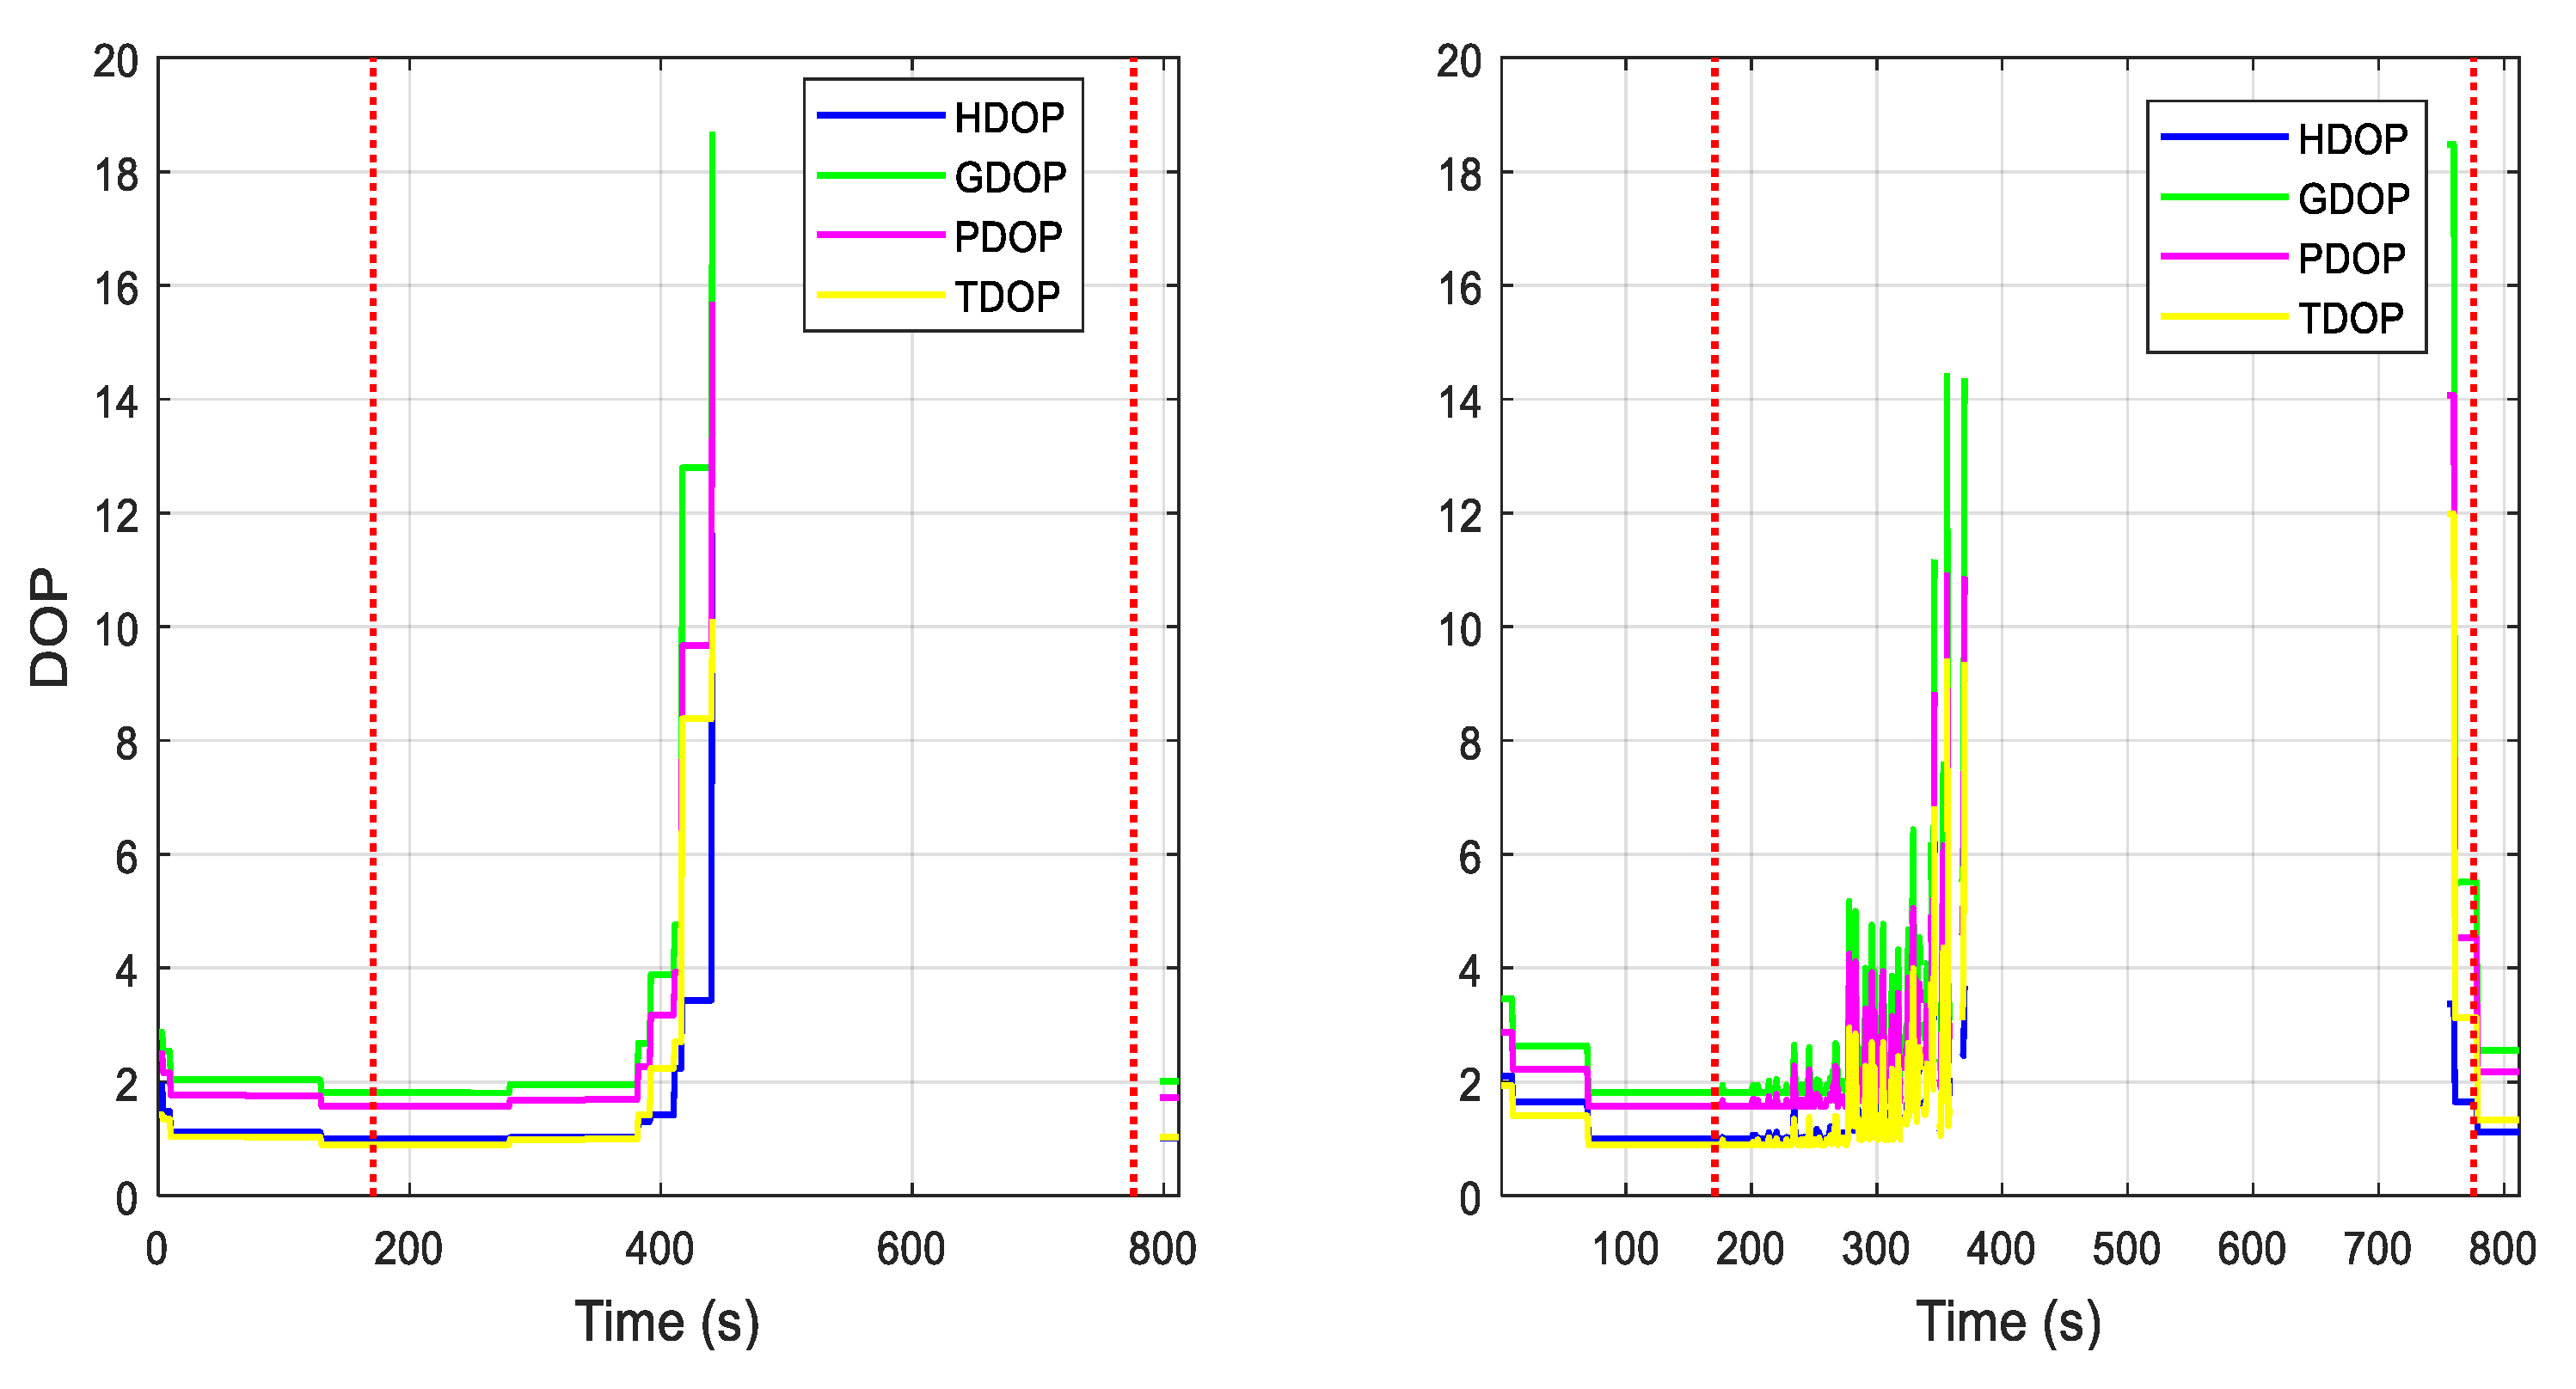
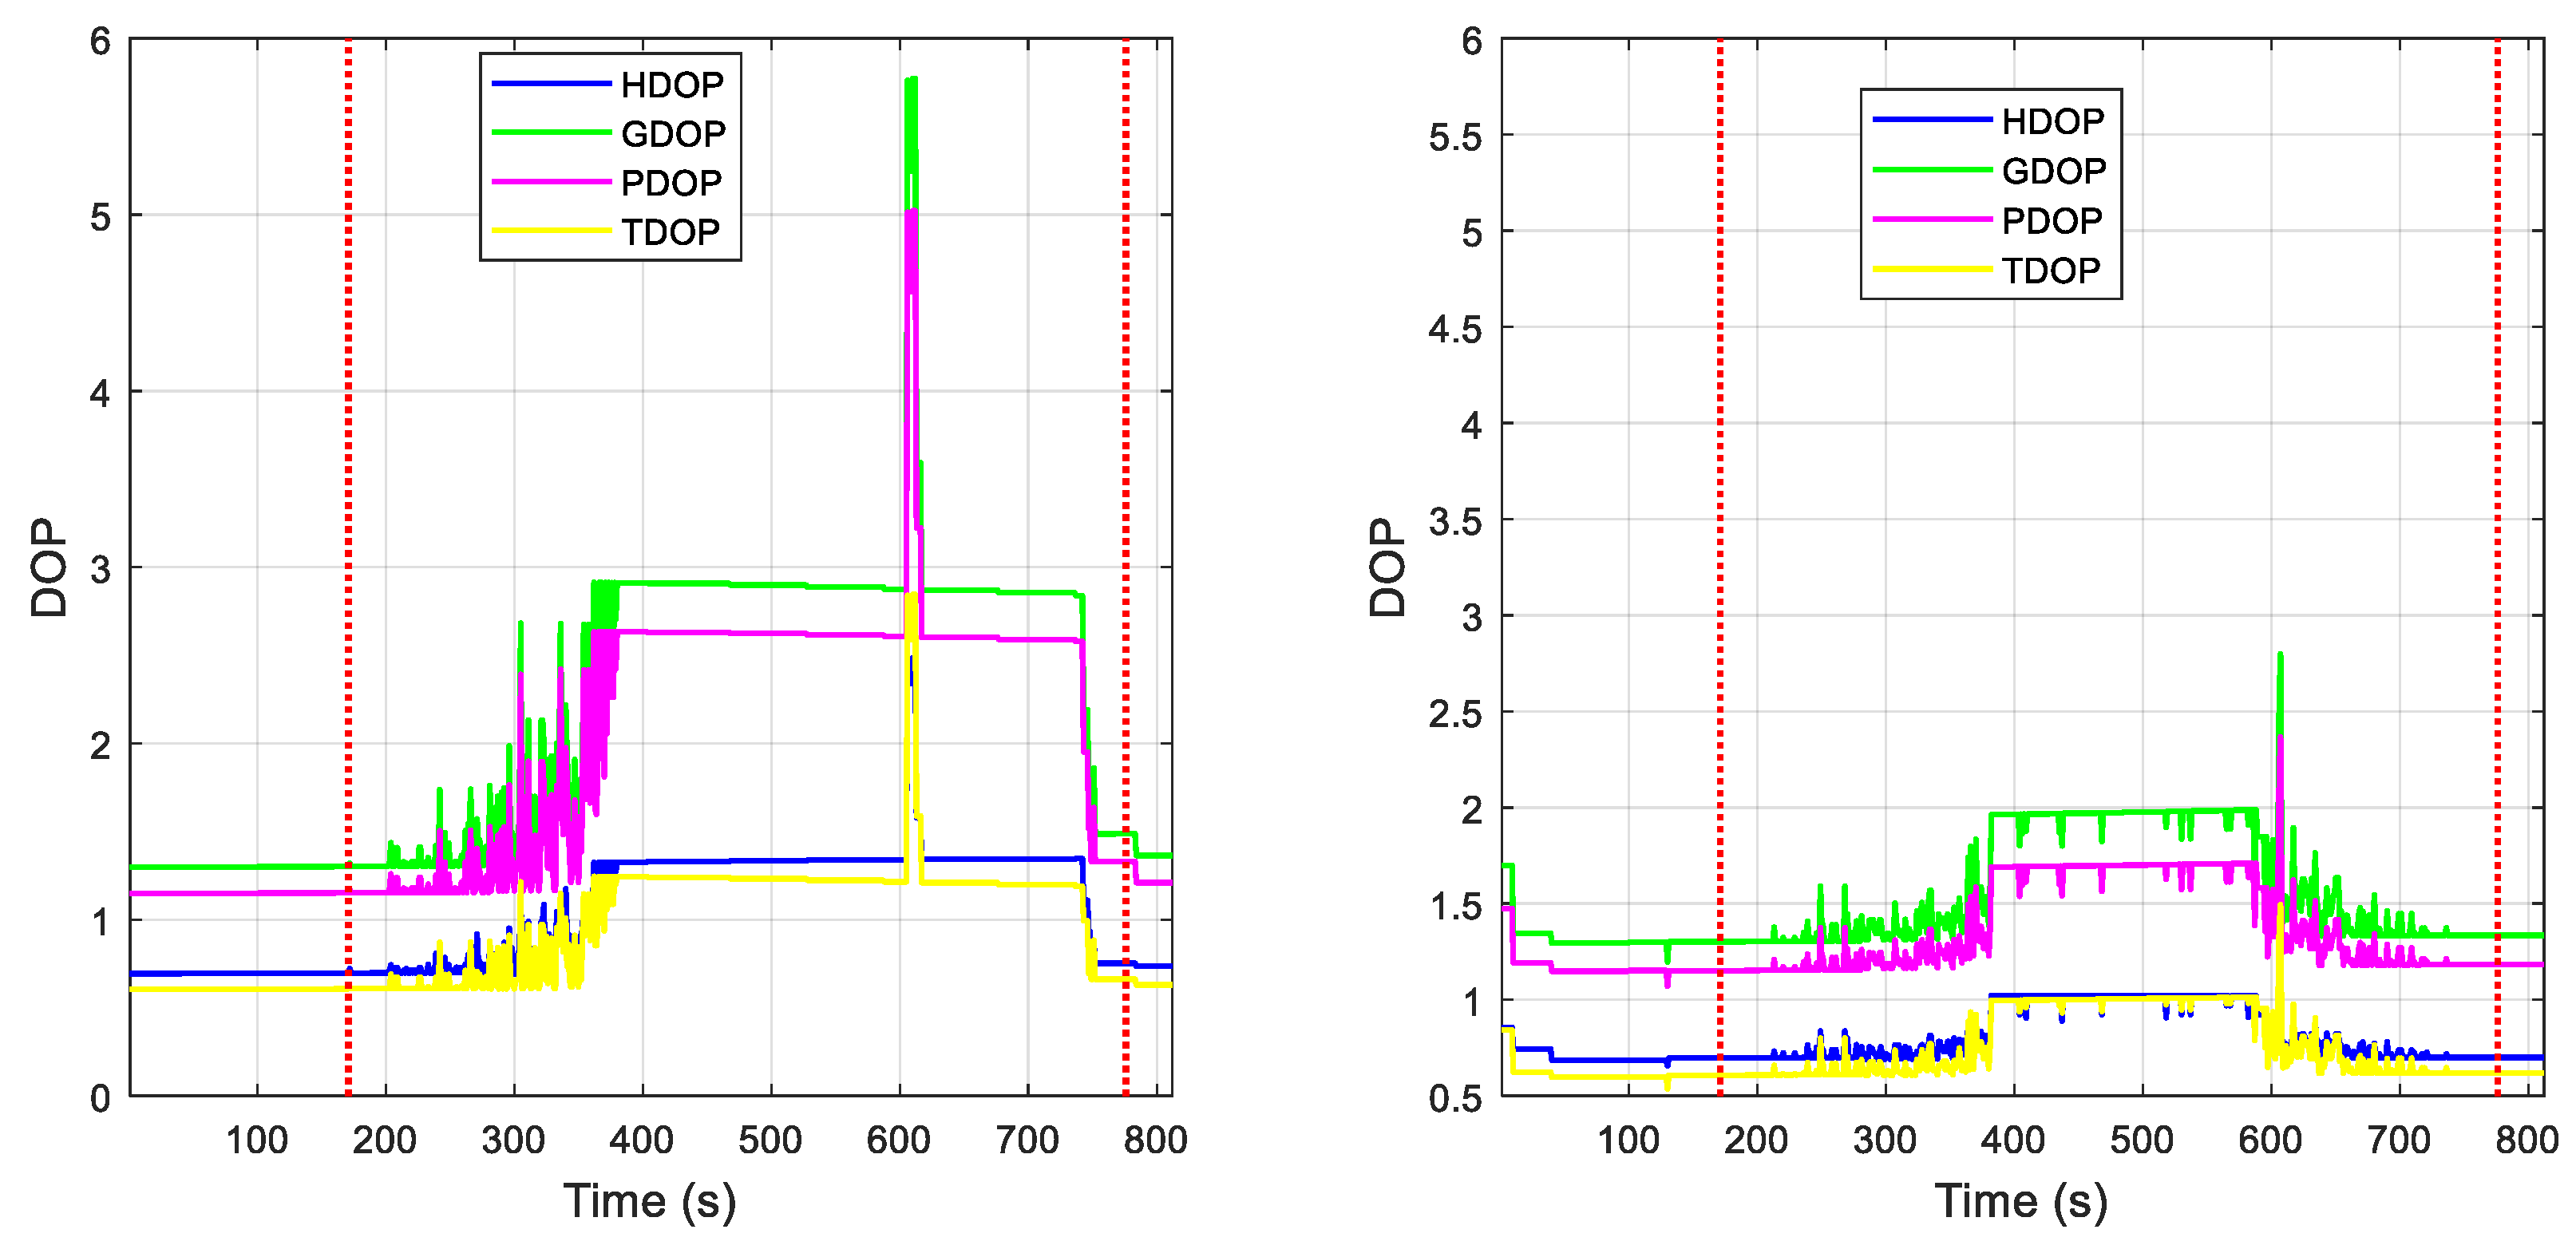
Figure 7 shows the DOP values for both scenarios. The more satellites lost due to the presence of the jamming signal, the higher the value of DOP is, indicating higher uncertainty in the position solution provided by the receiver based on the available satellite geometry.
5.2. Multi-Constellation Scenarios
This section discusses the results of the multi-constellation scenarios. First, the results of scenarios #2 and #3, which comprise the narrowband interference signal, are presented. Then, the results of scenarios #5 and #6 are discussed, which involve the wideband interference signal.
5.2.1. Narrowband Interference
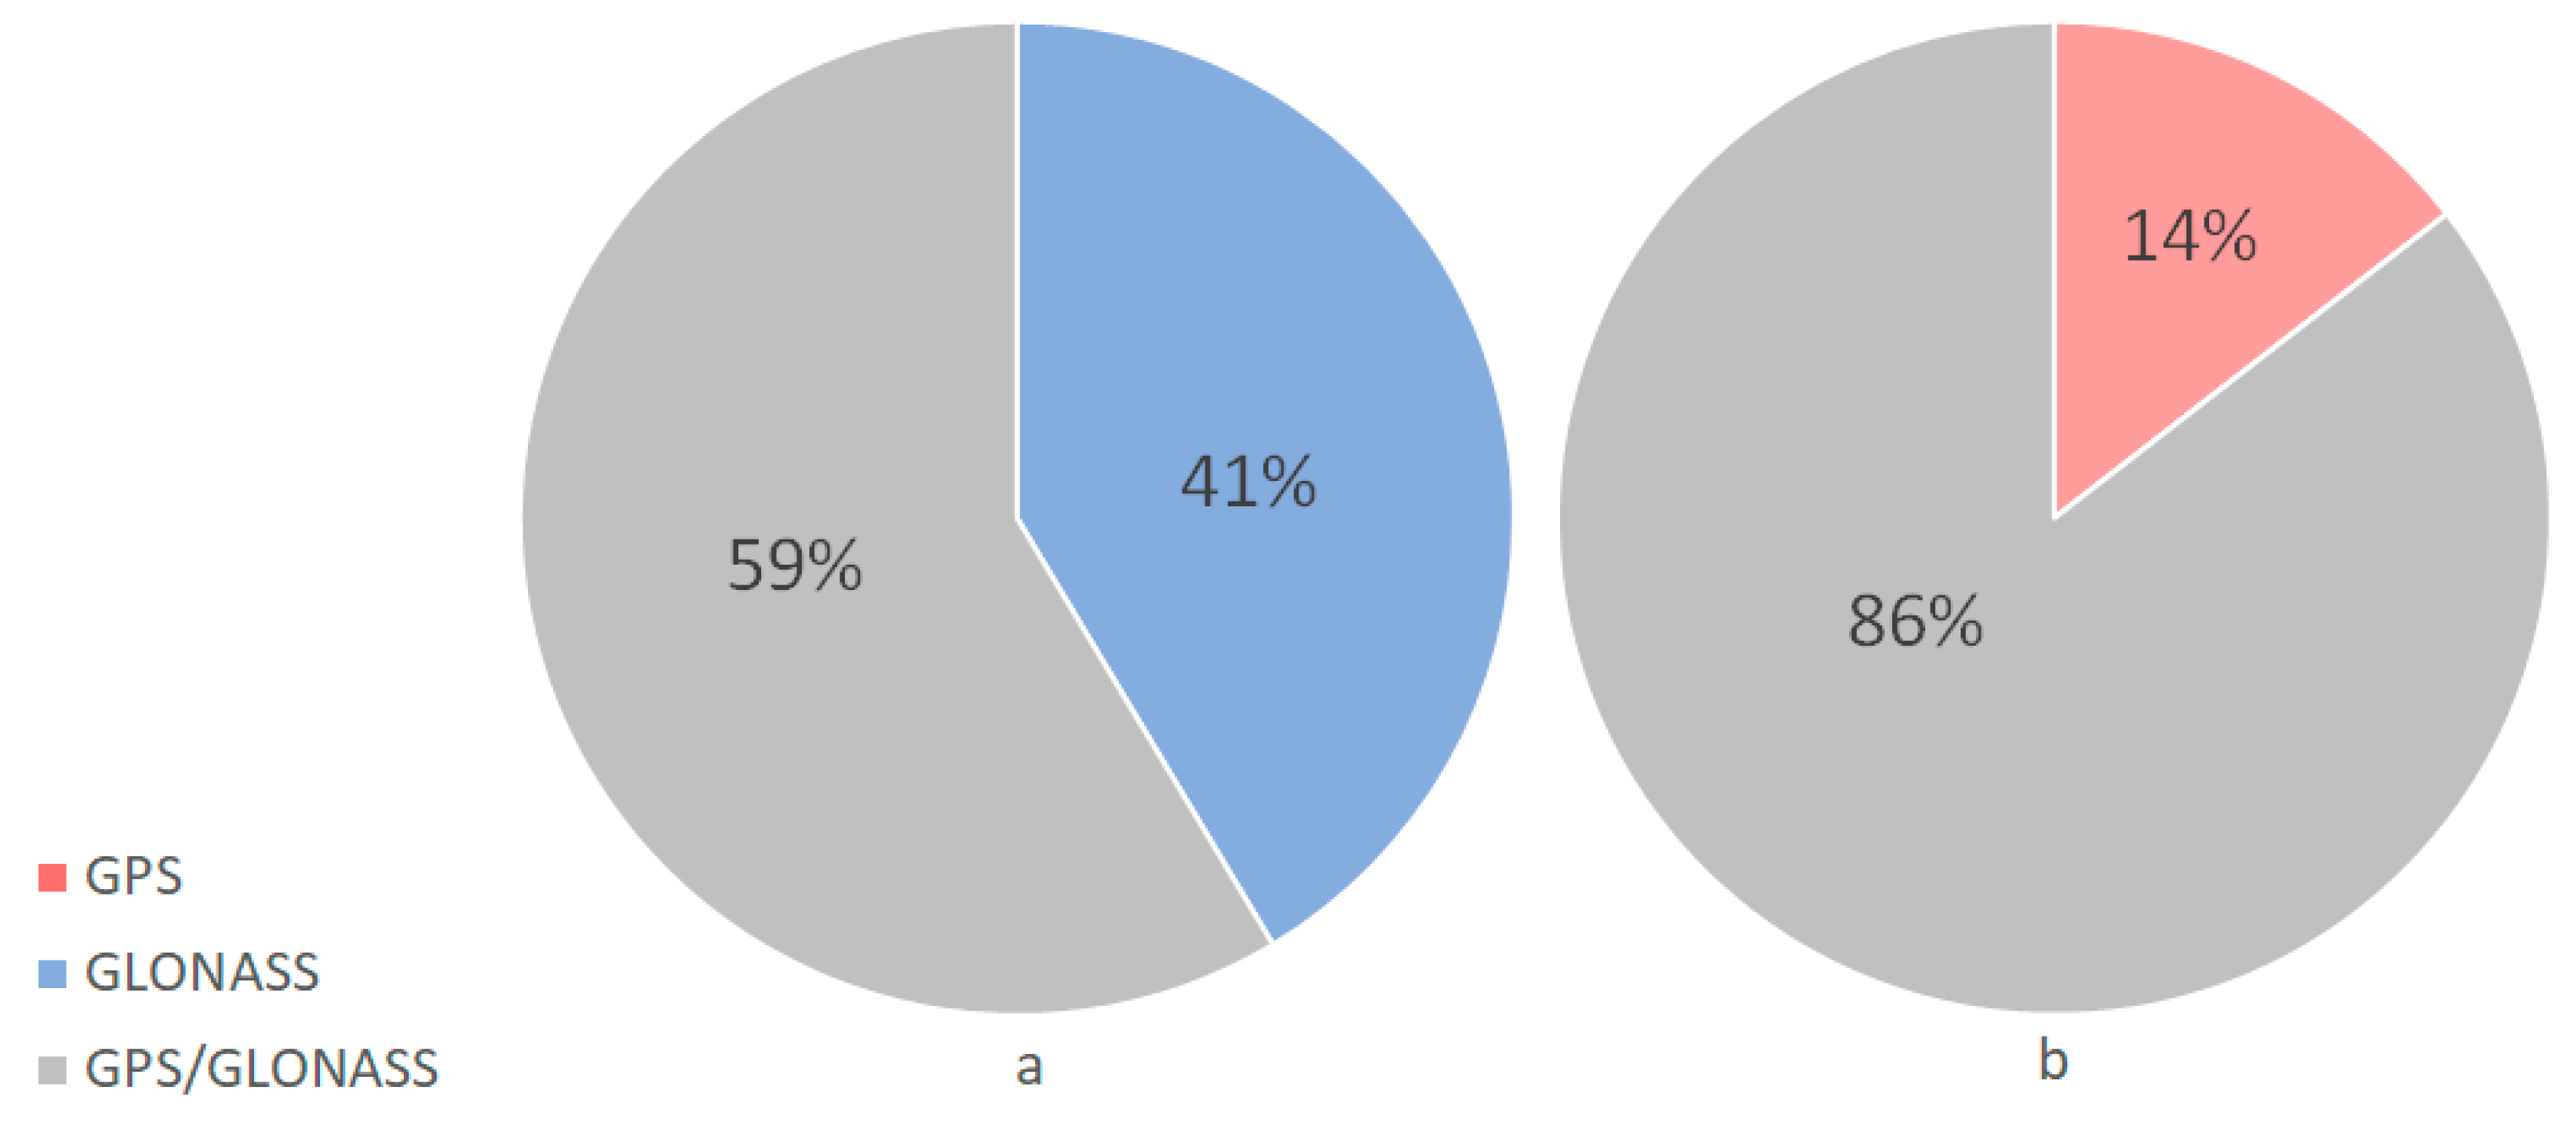
The use of multi-constellation significantly enhanced the solution availability to be 100% in both scenarios. However, none of the constellations were available all the time due to the presence of jamming, which targeted each band individually. The chart shown in
Figure 8 tells that the GPS constellation was unavailable for 39% of the trajectory in scenario #2, in which the jamming signal was centered in the GPS band. Similarly, the GLONASS constellation was lost for 14% of the time of the trajectory in scenario #3, as the jamming was centered at the GLONASS band.
Table 5 and
Table 6 show that the receiver was tracking at least 7 and 9 satellites at the maximum jamming power of −74.8 dBm for scenarios #2 and #3, respectively.
Examining
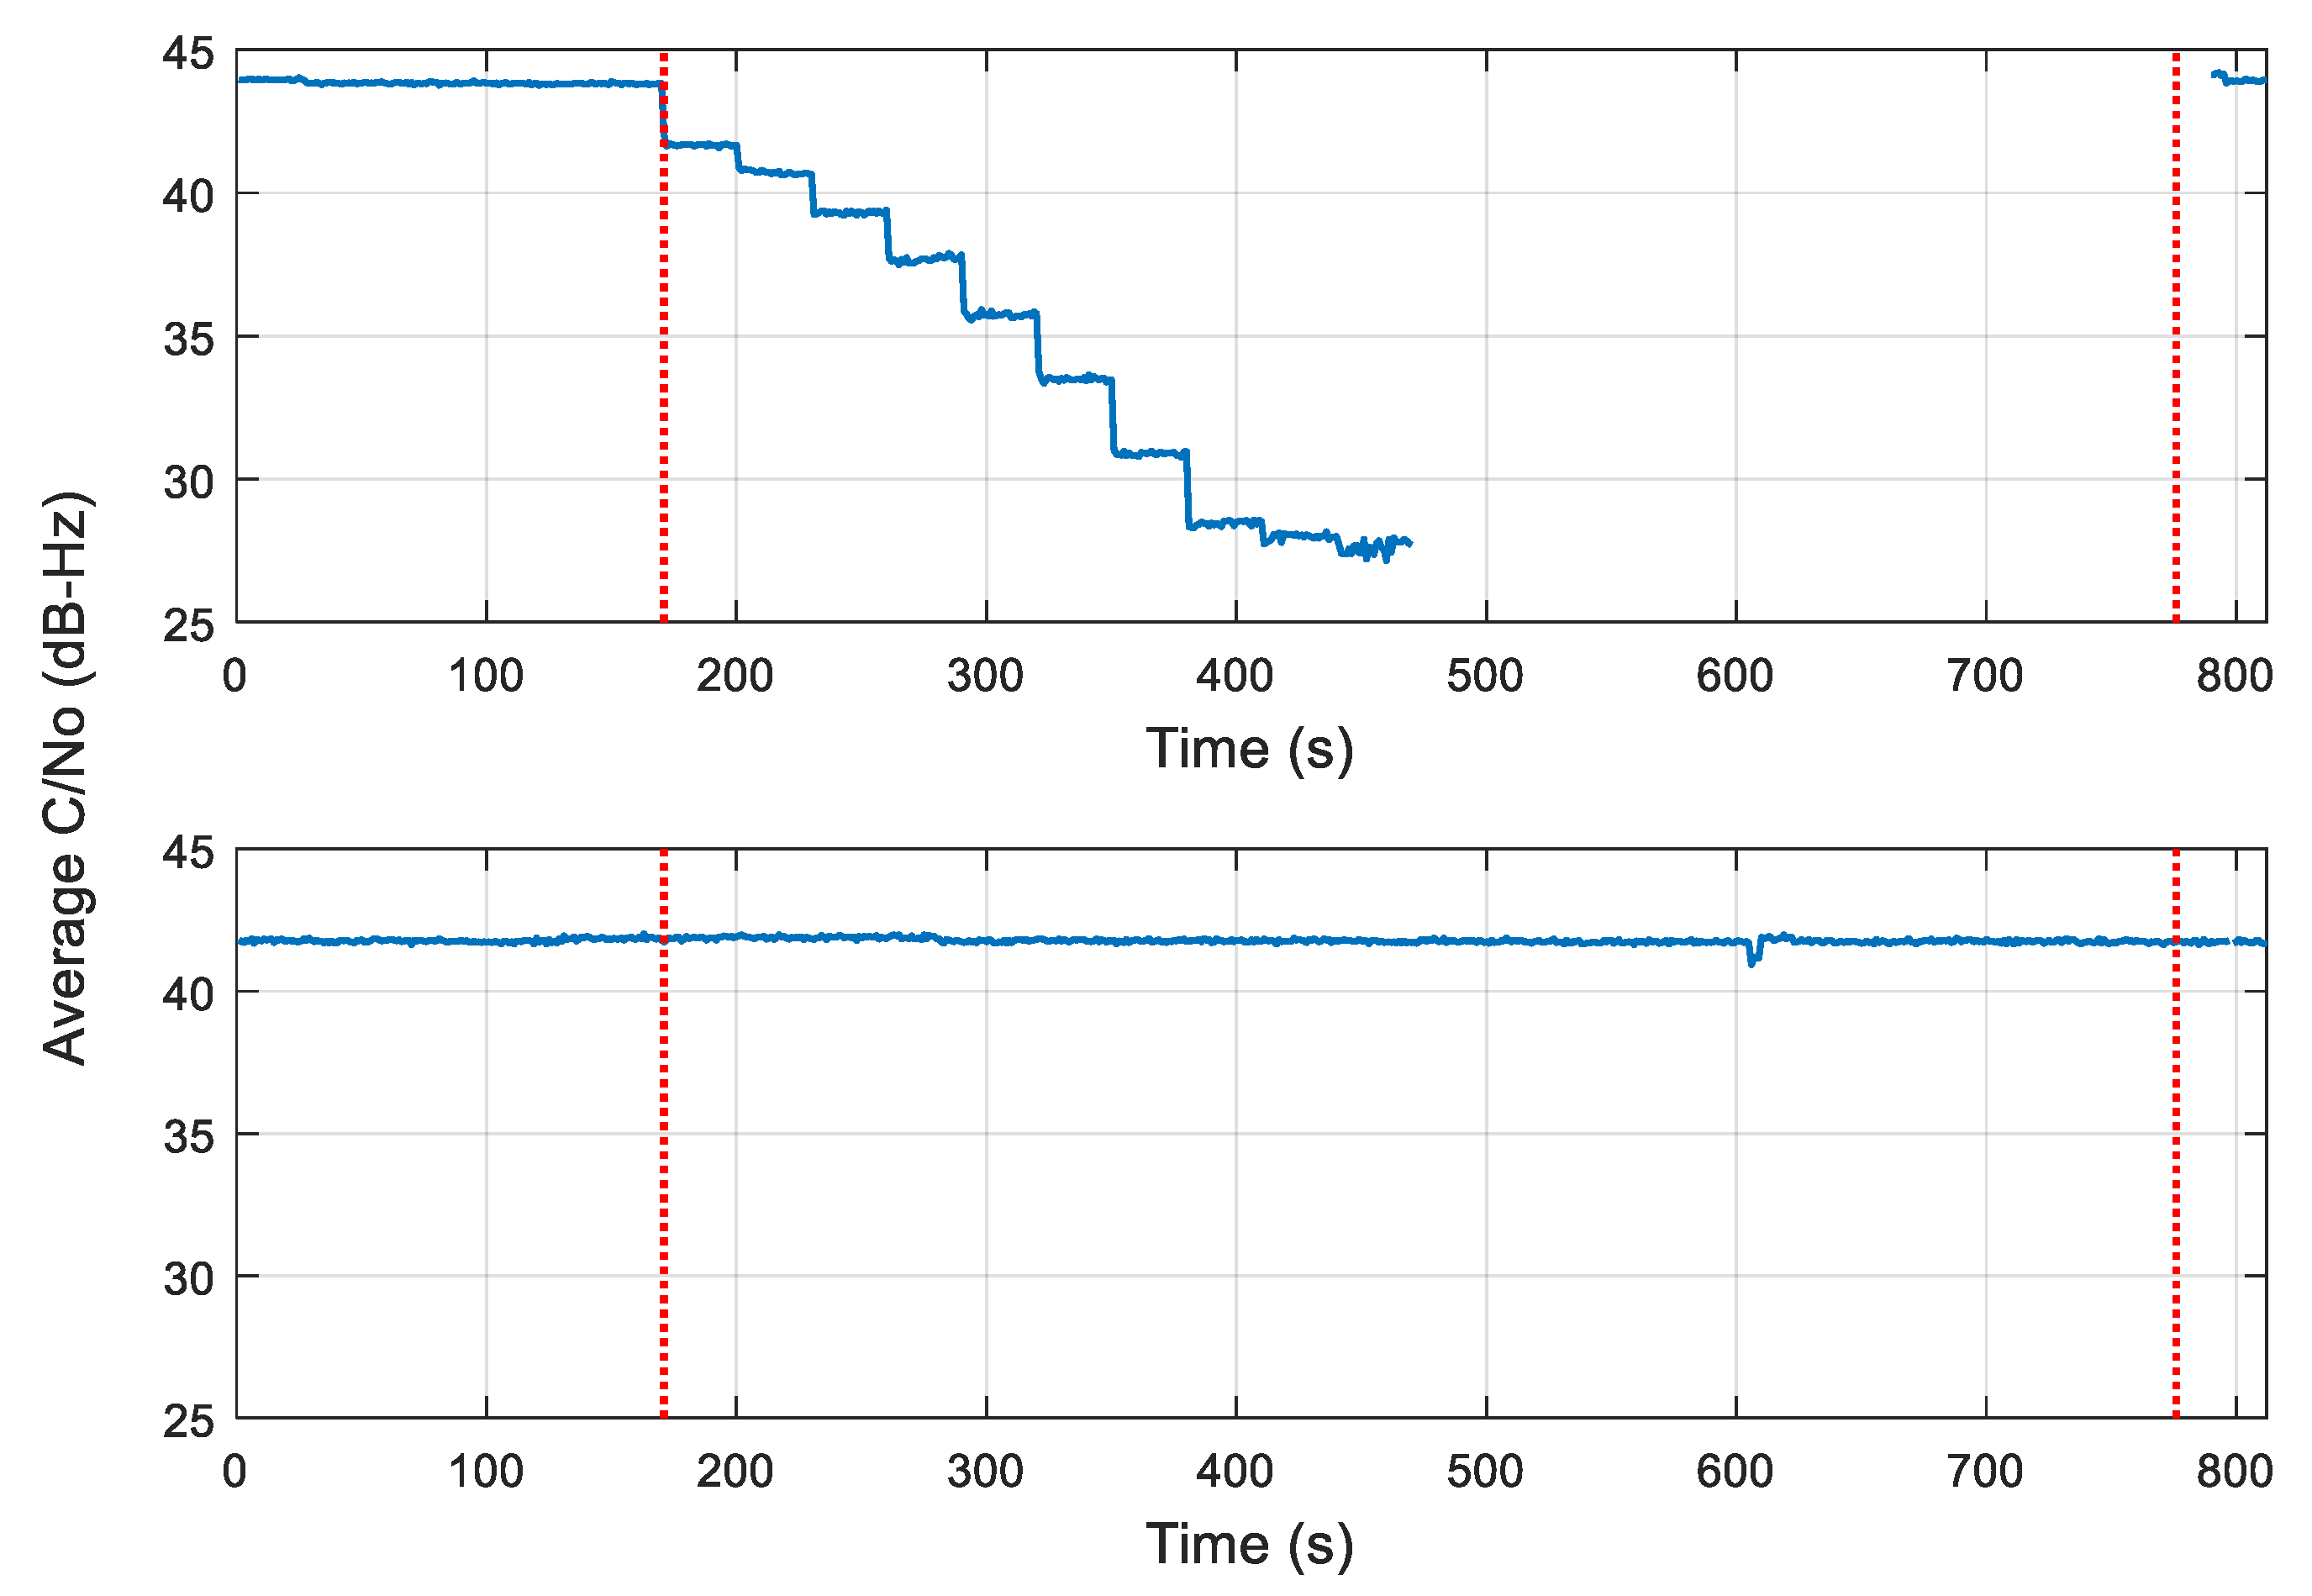
Figure 9 and
Figure 10, the average carrier-to-noise ratio of available GLONASS satellites was not affected when the jamming targeted the GPS band. Similarly, the average carrier-to-noise ratio of available GPS satellites maintained a good value even during the jamming period as the jamming signal was centered on the GLONASS band.
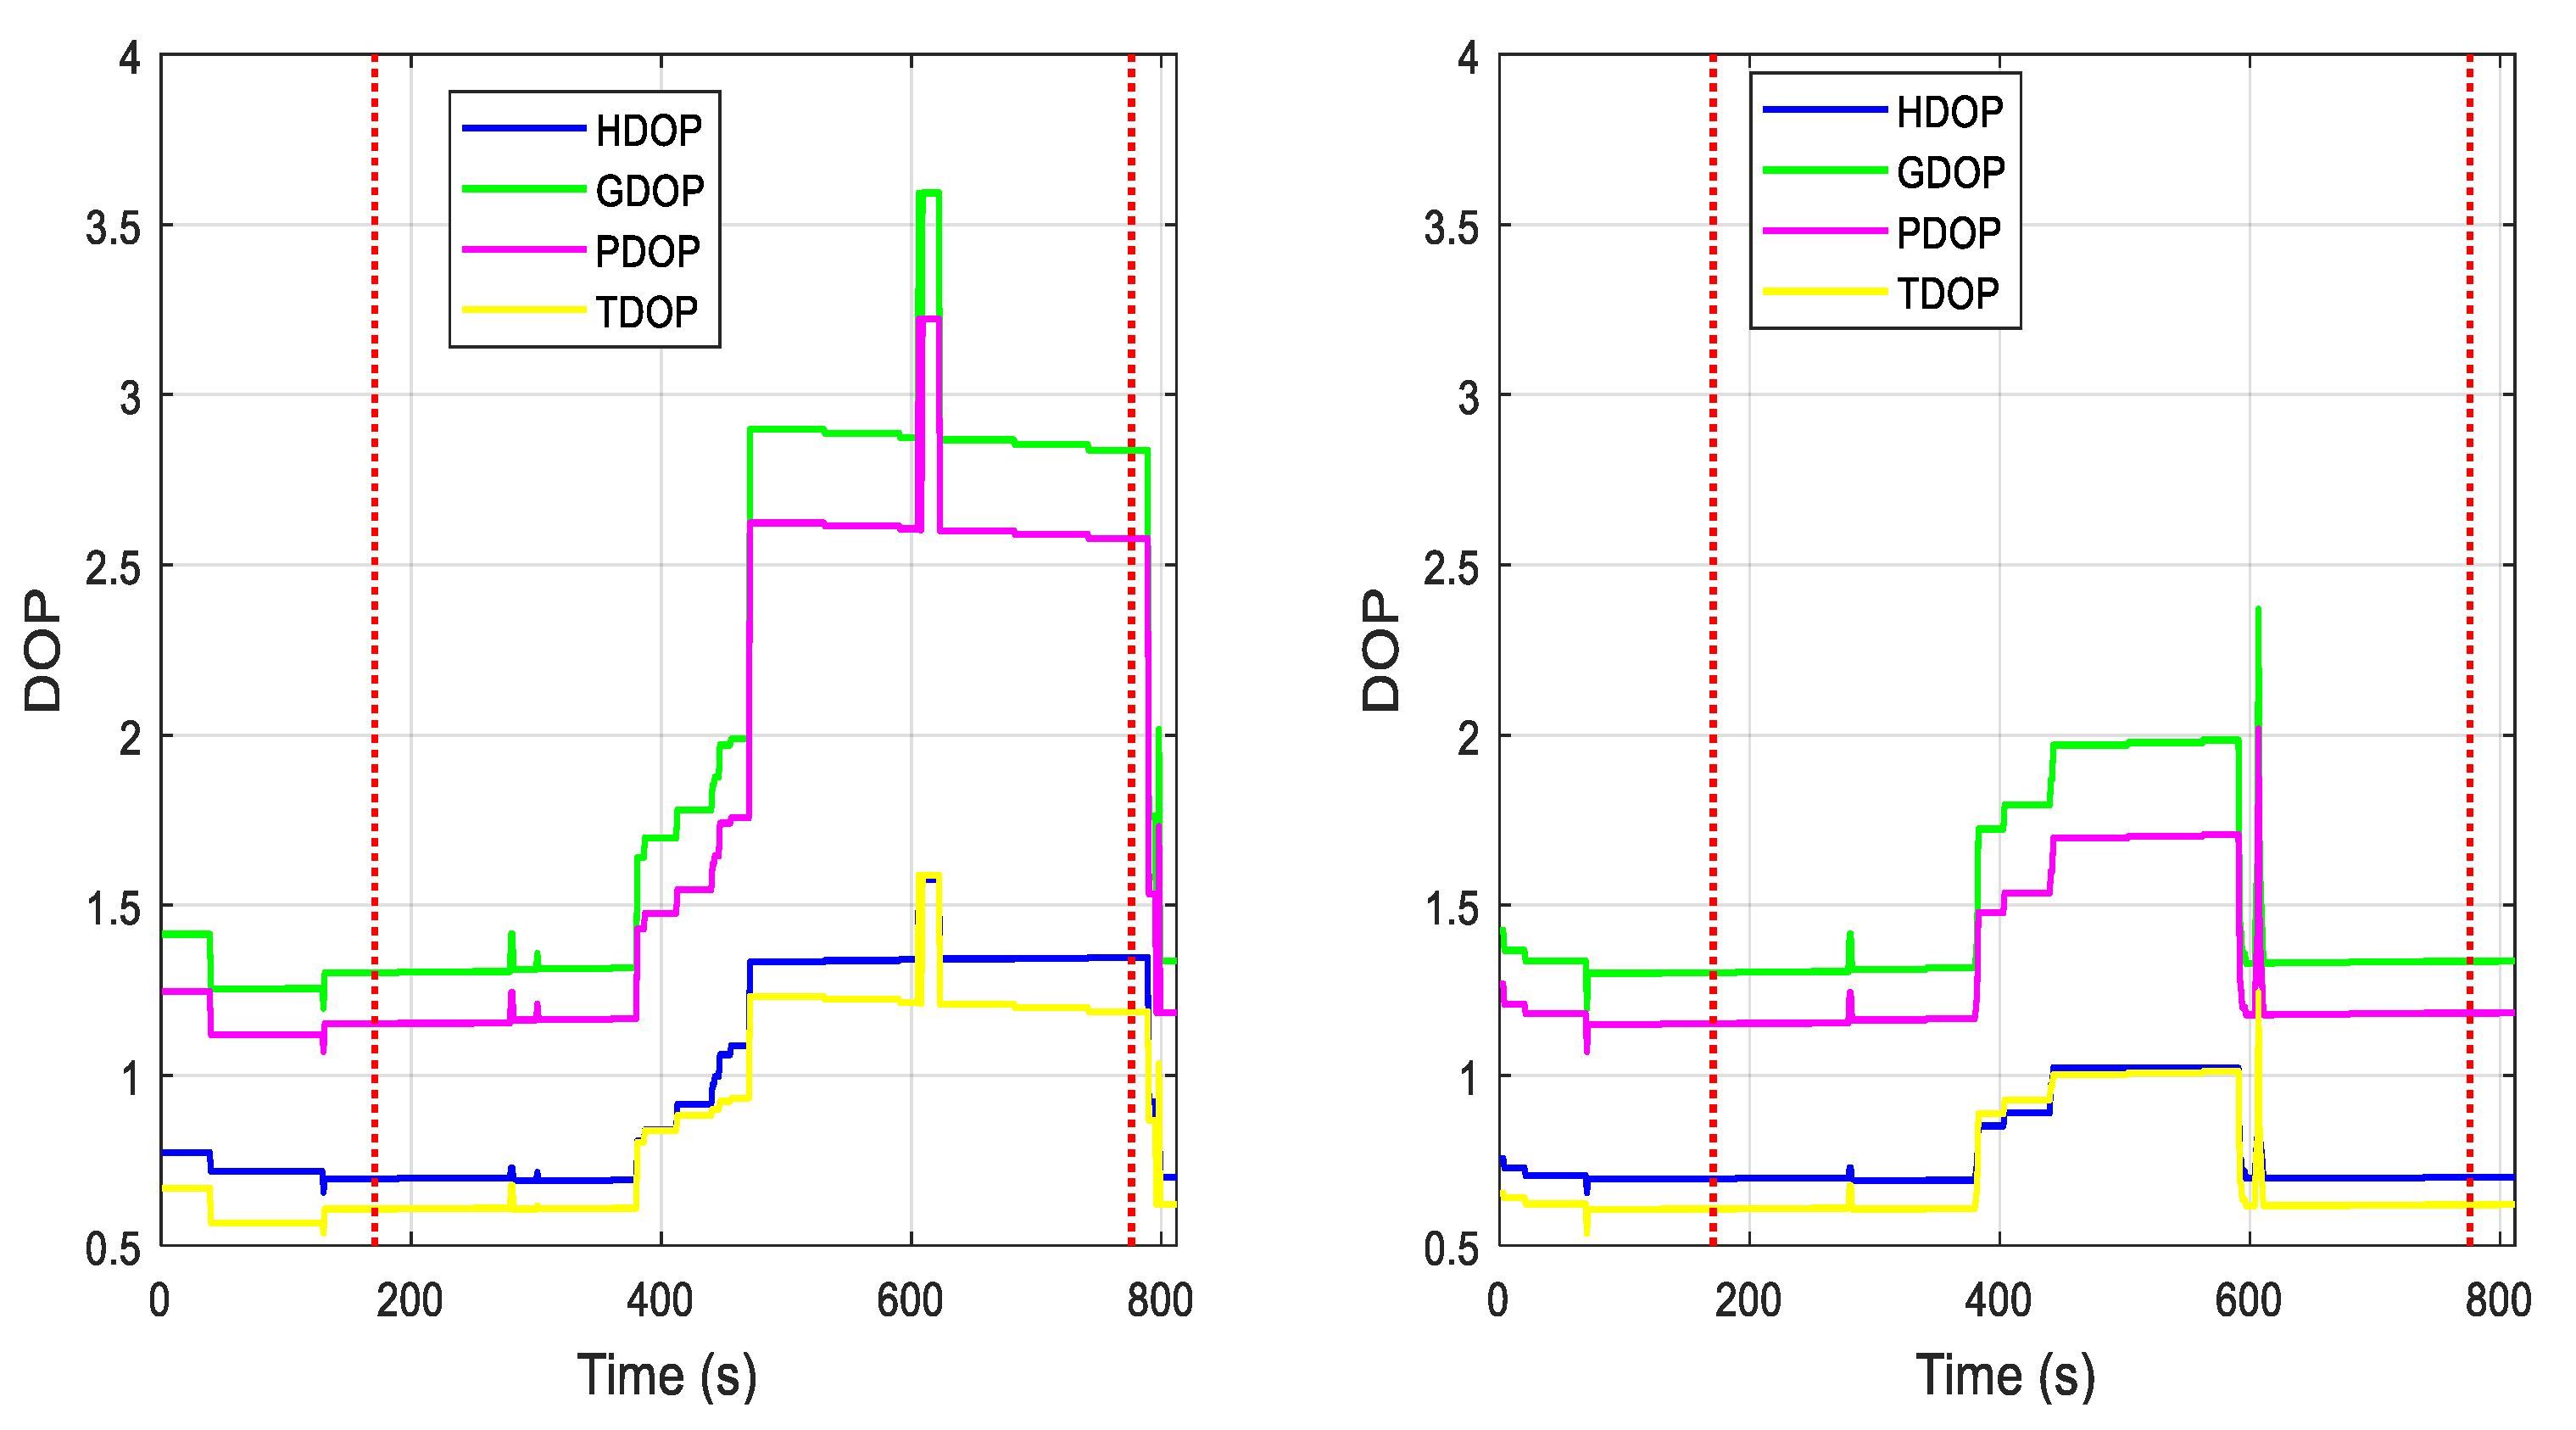
Figure 11 shows the DOP values for both scenarios. It can be illustrated from the figure that the confidence of the position solution was reasonably good throughout the whole trajectory in both scenarios. However, the DOP values were better in scenario #3, which is intuitively understandable due to the availability of more GPS satellites and their better geometry over GLONASS.
5.2.2. Wideband Interference
The benefits of the use of multi-constellation are validated again in the case of wideband interference, where the receiver was able to provide a positioning solution 100% of the time in both scenarios. A breakdown of the solution availability based on constellation is shown in
Figure 12. The position solution was based on at least 7 and 9 available satellites for scenarios #5 and #6, respectively, as noted from
Table 7 and
Table 8.
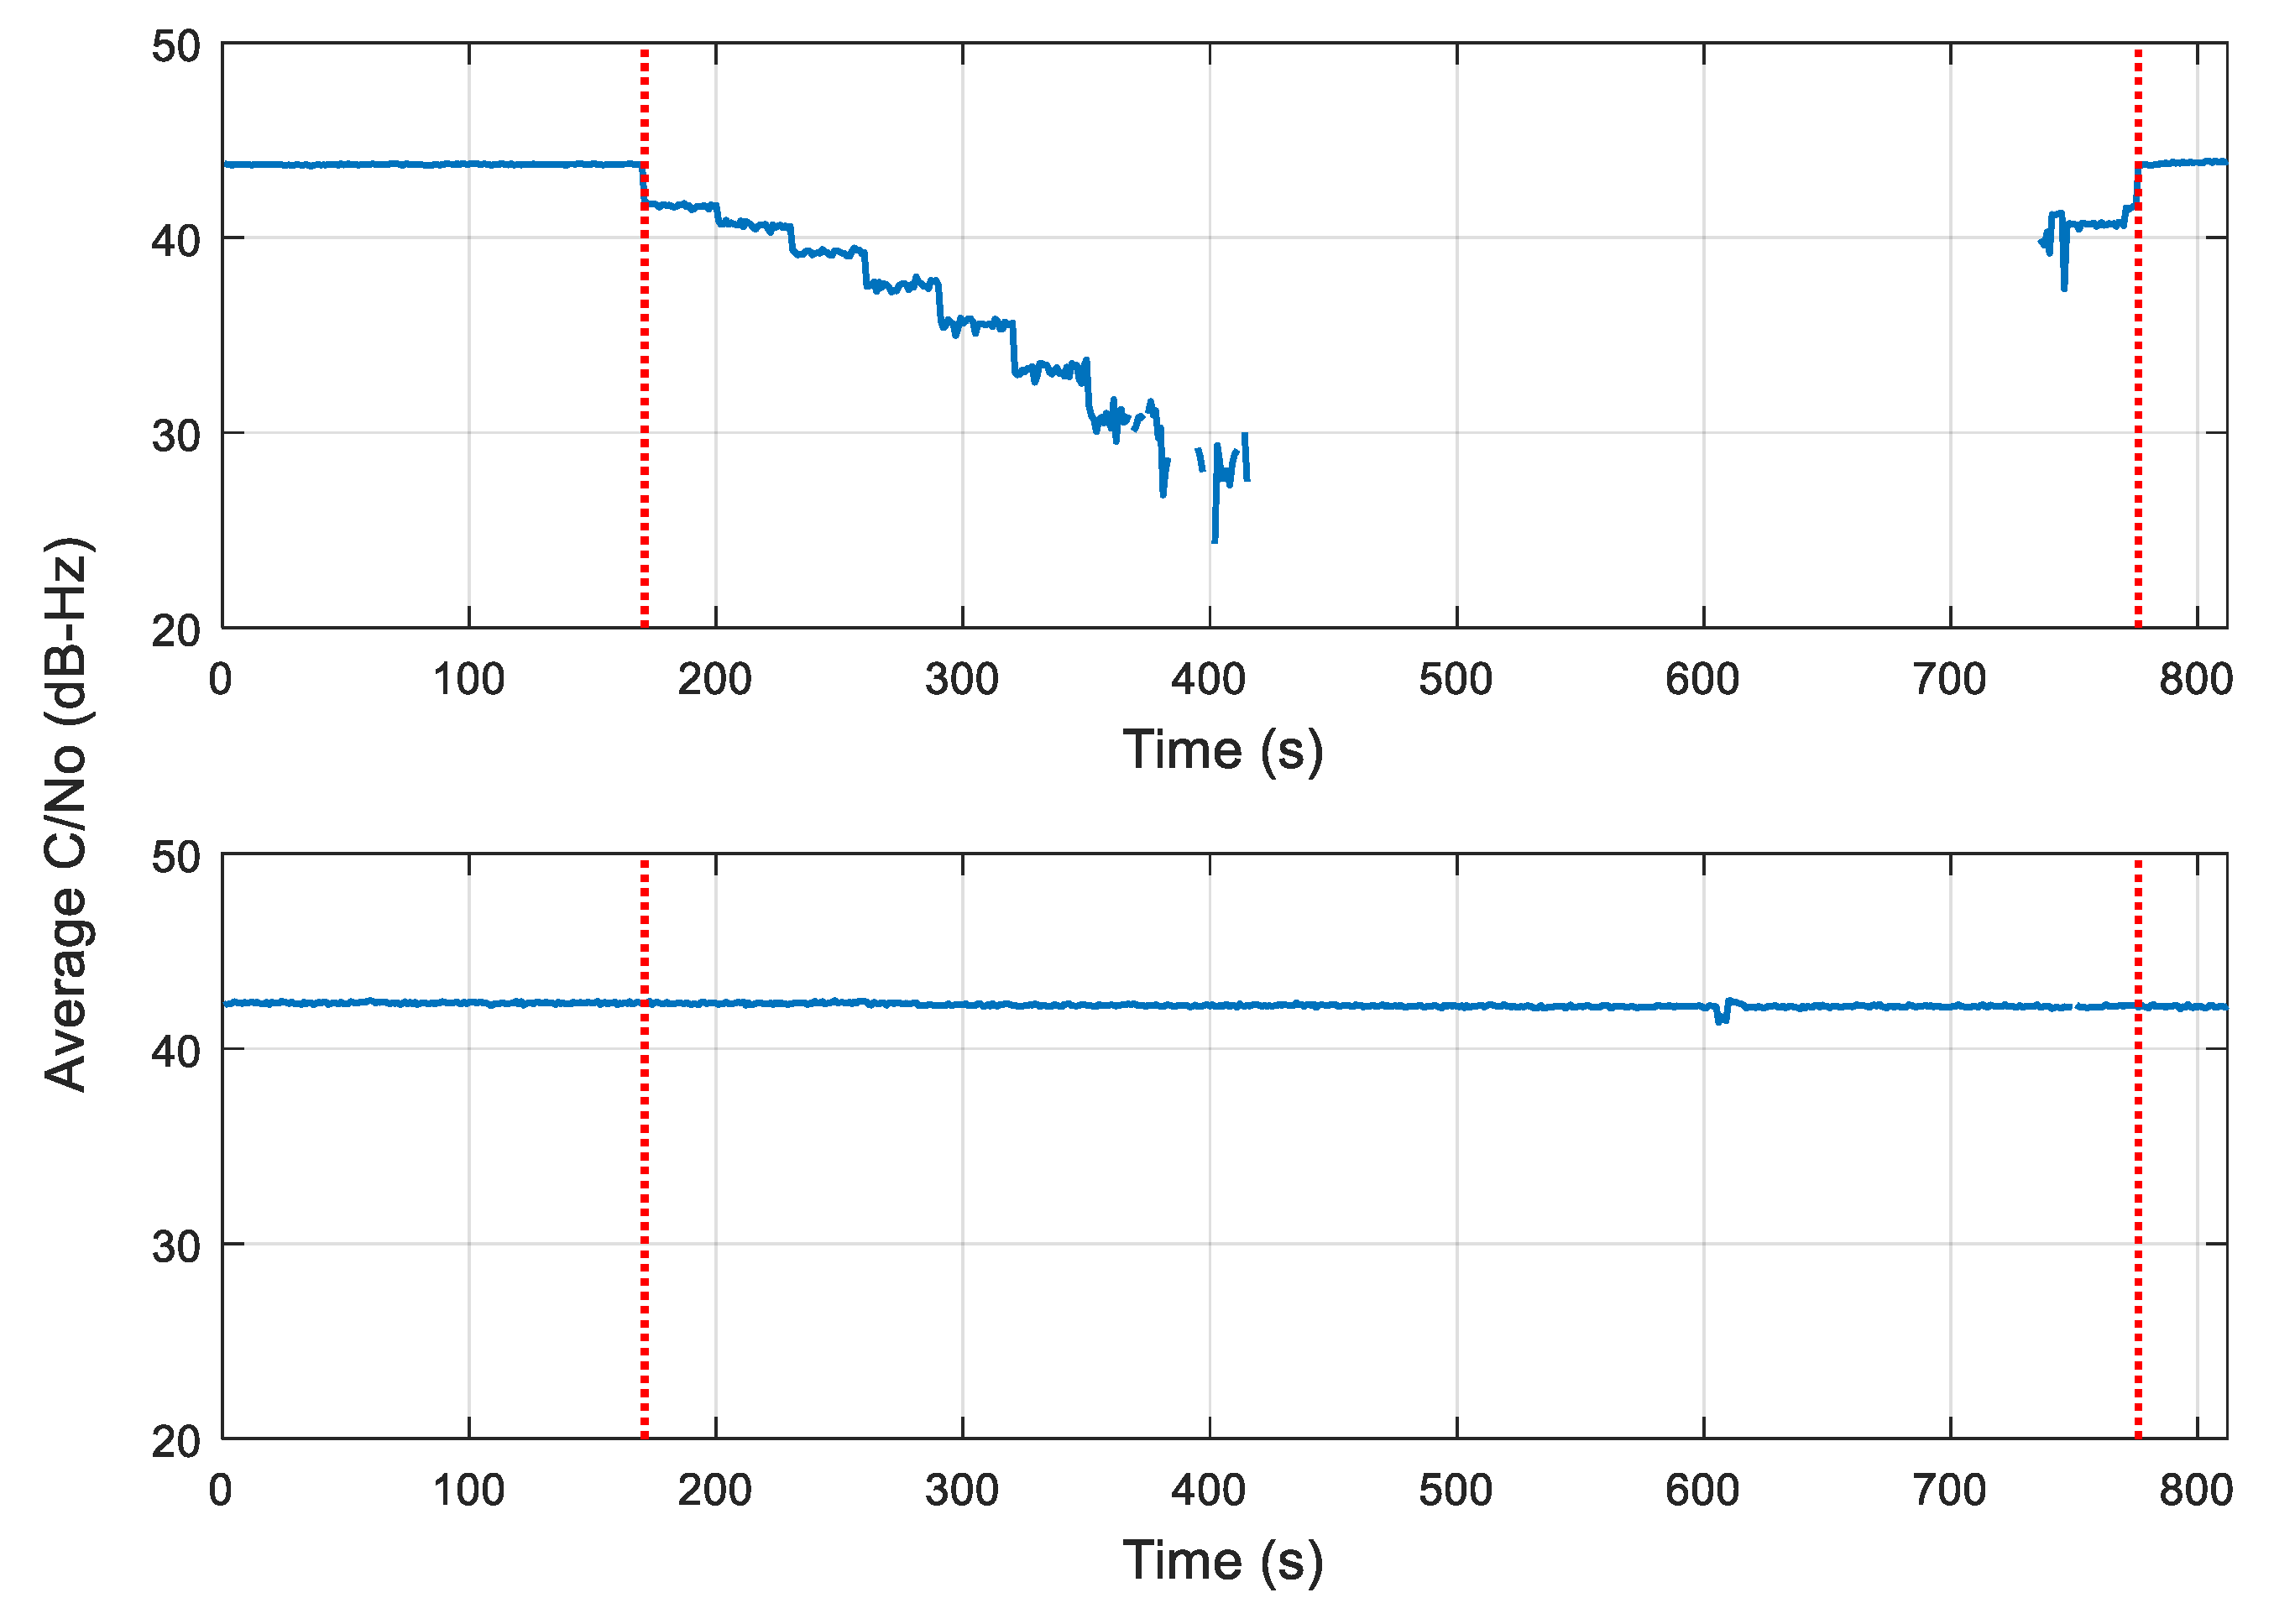
Similar to the narrowband interference scenarios, GLONASS constellation was not affected when the jamming was centered on the GPS band and vice versa, as shown in
Figure 13 and
Figure 14. It can also be observed from the figures that GLONASS satellites were more resistive to interference in terms of the signal outage.
Figure 15 shows that the jamming on the GPS band decreased the quality of the provided position solution as the DOP values of scenario #5 were much higher than their counterparts of scenario #6.
Table 9 and
Table 10 show the positioning and velocity errors of all scenarios. It is noted from the tables that the maximum positioning errors were the highest for scenarios #2 and #5, which indicates that jamming the GPS band would yield worse results than jamming the GLONASS band. That is understandable as the GPS constellation has better coverage and geometry in North America compared to the GLONASS constellation. It is also noted from the tables that even if the GPS-only constellation scenarios show a better positioning solution, that came at the cost of at least 43% of total outage.
6. Conclusions
Several experiments were conducted to compare the performance of a high-end commercial receiver in the presence of both narrowband and wideband jamming signals. The advantages of multi-constellation over GPS-only were explored by repeating the same scenario while enabling or disabling the GLONASS constellation. The impact of jamming signals was explored when targeting the GPS band and GLONASS band. It has been concluded that the use of multi-constellation could provide a potential solution for the jamming problem, specifically in terms of solution availability and reliability. Furthermore, jamming the GPS signal would result in higher uncertainty with respect to the solution provided by the receiver as the DOP values increase compared to jamming the GLONASS band. In addition, the positioning solution was much more deteriorated when jamming the GPS band compared to jamming the GLONASS band due to the better coverage and geometry of the GPS constellation in North America.
Author Contributions
H.E. proposed the idea, designed the simulation, analyzed the data and wrote part of the paper. M.K. and M.T. contributed to the idea and wrote part of the paper. A.N. reviewed the paper. All authors have read and agreed to the published version of the manuscript.
Funding
This research received no external funding.
Conflicts of Interest
The authors declare no conflict of interest.
References
- Dow, J.M.; Neilan, R.E.; Gendt, G. The International GPS Service: Celebrating the 10th anniversary and looking to the next decade. Adv. Space Res. 2005, 36, 320–326. [Google Scholar] [CrossRef]
- Zhang, Y.D.; Amin, M.G. Anti-jamming GPS receiver with reduced phase distortions. IEEE SPL 2012, 19, 635–638. [Google Scholar] [CrossRef]
- Kaplan, E.D.; Hegarty, C.J. Understanding GPS/GNSS: Principles and Applications; Artech House: Boston, MA, USA, 2017. [Google Scholar] [CrossRef]
- Maqsood, M.; Gao, S.; Brown, T.W.; Unwin, M.; De Vos Van Steenwijk, R.; Xu, J.D. A compact multipath mitigating ground plane for multiband GNSS antennas. IEEE Trans. Antennas Propag. 2013, 61, 2775–2782. [Google Scholar] [CrossRef]
- Gao, G.X.; Sgammini, M.; Lu, M.; Kubo, N. Protecting GNSS receivers from jamming and interference. Proc. IEEE 2016, 104, 1327–1338. [Google Scholar] [CrossRef]
- Gross Jason, N.; Humphreys Todd, E. GNSS Spoofing, Jamming, and Multipath Interference Classification using a Maximum-Likelihood Multi-Tap Multipath Estimator. In Proceedings of the 2017 International Technical Meeting of The Institute of Navigation, Monterey, CA, USA, 30 December 2016–2 January 2017; pp. 662–670. [Google Scholar]
- How Common is GPS Jamming? (And How to Protect Yourself). Available online: https://www.orolia.com/resources/blog/jeremy-onyan/2018/how-common-gps-jamming-and-how-protect-yourself (accessed on 7 August 2019).
- Inside GNSS. Criminal Investigation Underway in GPS Jamming Incident That Crashed Drones, Caused HK$1M in Damage; Inside GNSS: Red Bank, NJ, USA, 2018. [Google Scholar]
- Seferoglu, K.T.; Turk, A.S. Review of Spoofing and Jamming Attack on the Global Navigation Systems Band and Countermeasure. In Proceedings of the 2019 9th International Conference on Recent Advances in Space Technologies (RAST), Istanbul, Turkey, 11–14 June 2019; pp. 513–520. [Google Scholar]
- Borre, K.; Kudryavtsev, I. Software defined GNSS Receiver. Sci. Technol. Exp. Autom. Space Veh. Small Satell. 2015, 104, 9–14. [Google Scholar] [CrossRef][Green Version]
- Tamazin, M. High Resolution Signal Processing Techniques for Enhancing GPS Receiver Performance; Queen’s University: Kingston, ON, Canada, 2015. [Google Scholar]
- Seals, K.C. Enhanced Acquisition Techniques for GPS L1C Receivers; Worcester Polytechnic Institute: Worcester, MA, USA, 2014. [Google Scholar]
- Mollaiyan, K.; Santerre, R. Acquisition of Weak Signals in Multi-Constellation Frequency Domain Receivers. Positioning 2013, 4, 144. [Google Scholar] [CrossRef]
- Tamazin, M.; Noureldin, A.; Korenberg, M.J. Acquisition of Weak GNSS Signals Using Fast Orthogonal Search. In Proceedings of the ION GNSS 2012, Nashville, TN, USA, 17–21 September 2012; pp. 1399–1405. [Google Scholar]
- Im, S.H.; Song, J.H.; Lee, B.H.; Jee, G.I.; Han, S.Y.; Bae, J.S.; Kim, J.O. Anti-jamming Technique Performance Evaluation for GPS L1 C/A Software Receiver. In Proceedings of the 20th International Technical Meeting of the Satellite Division of The Institute of Navigation (ION GNSS 2007), Fort Worth, TX, USA, 25–28 September 2007; pp. 2787–2796. [Google Scholar]
- Badke, B.P. Global Positioning System Anti-Jamming Techniques. Ph.D. Thesis, Arizona State University, Tempe, AZ, USA, 2003. [Google Scholar]
- Kandangath, A. Jamming mitigation techniques for spread spectrum communication systems. Signal Process. Wirel. Commun. 2003, 1–13. [Google Scholar]
- Zhang, Y.; Amin, M.G.; Lindsey, A.R. Anti-jamming GPS receivers based on bilinear signal distributions. In Proceedings of the 2001 MILCOM Proceedings Communications for Network-Centric Operations: Creating the Information Force (Cat. No.01CH37277), McLean, VA, USA, 28–31 October 2001; Volume 2, pp. 1070–1074. [Google Scholar]
- Sun, W.; Amin, M.G. A self-coherence anti-jamming GPS receiver. IEEE Trans. Signal Process. 2005, 53, 3910–3915. [Google Scholar] [CrossRef]
- Li, L.; Xi, X.; Wang, J. Research on GPS anti-jamming algorithm based on adaptive antennas. In Proceedings of the 2010 International Symposium on Signals, Systems and Electronics, Nanjing, China, 17–20 September 2010; pp. 1–4. [Google Scholar]
- Borio, D.; O’Driscoll, C.; Fortuny, J. Jammer impact on Galileo and GPS receivers. In Proceedings of the 2013 International Conference on Localization and GNSS (ICL-GNSS), Turin, Italy, 25–27 June 2013; pp. 1–6. [Google Scholar]
Figure 1.
High-level architecture of a global positioning system (GPS) receiver.
Figure 1.
High-level architecture of a global positioning system (GPS) receiver.
Figure 2.
The complete experimental setup.
Figure 2.
The complete experimental setup.
Figure 3.
The full experiment trajectory.
Figure 3.
The full experiment trajectory.
Figure 4.
Sky-plot of the available satellites.
Figure 4.
Sky-plot of the available satellites.
Figure 5.
Jamming profile.
Figure 5.
Jamming profile.
Figure 6.
Average carrier-to-noise ratio of GPS constellation scenarios. (Top figure)—narrowband interference; (bottom figure)—wideband interference.
Figure 6.
Average carrier-to-noise ratio of GPS constellation scenarios. (Top figure)—narrowband interference; (bottom figure)—wideband interference.
Figure 7.
Dilution of precision (DOP) values of GPS constellation scenarios. (Left figure)—narrowband interference, (right figure)—wideband interference.
Figure 7.
Dilution of precision (DOP) values of GPS constellation scenarios. (Left figure)—narrowband interference, (right figure)—wideband interference.
Figure 8.
Constellation availability of narrowband interference scenarios. (a) Scenario #2; (b) Scenario #3.
Figure 8.
Constellation availability of narrowband interference scenarios. (a) Scenario #2; (b) Scenario #3.
Figure 9.
Average carrier-to-noise ratio of scenario #2. (Top figure)—GPS measurements; (bottom figure)—GLONASS measurements.
Figure 9.
Average carrier-to-noise ratio of scenario #2. (Top figure)—GPS measurements; (bottom figure)—GLONASS measurements.
Figure 10.
Average carrier-to-noise ratio of scenario #3. (Top figure)—GPS measurements; (bottom figure)—GLONASS measurements.
Figure 10.
Average carrier-to-noise ratio of scenario #3. (Top figure)—GPS measurements; (bottom figure)—GLONASS measurements.
Figure 11.
DOP values. (Left figure)—scenario #2, (right figure)—scenario #3.
Figure 11.
DOP values. (Left figure)—scenario #2, (right figure)—scenario #3.
Figure 12.
Constellation availability of wideband interference scenarios. (a) Scenario #5; (b) Scenario #6.
Figure 12.
Constellation availability of wideband interference scenarios. (a) Scenario #5; (b) Scenario #6.
Figure 13.
Average carrier-to-noise ratio of scenario #5. (Top figure)—GPS measurements; (bottom figure)—GLONASS measurements.
Figure 13.
Average carrier-to-noise ratio of scenario #5. (Top figure)—GPS measurements; (bottom figure)—GLONASS measurements.
Figure 14.
Average carrier-to-noise ratio of scenario #6. (Top figure)—GPS measurements; (bottom figure)—GLONASS measurements.
Figure 14.
Average carrier-to-noise ratio of scenario #6. (Top figure)—GPS measurements; (bottom figure)—GLONASS measurements.
Figure 15.
DOP values. (Left figure)—scenario #5, (right figure)—scenario #6.
Figure 15.
DOP values. (Left figure)—scenario #5, (right figure)—scenario #6.
Table 1.
Jamming signal specifications.
Table 1.
Jamming signal specifications.
| Jamming Signal
| Narrowband Interference | Wideband Interference |
|---|
| Target band | GPS | GLONASS | GPS | GLONASS |
| Type | CW | CW | SCW | SCW |
| Frequency (MHz) | 1575.42 | 1602 | 1576.42–1574.42 | 1605.38–1598.06 |
Table 2.
Simulated scenarios description.
Table 2.
Simulated scenarios description.
| Scenario # | Jamming Signal | Constellation |
|---|
| 1 | Narrowband–GPS band | GPS |
| 2 | Narrowband–GPS band | GPS/GLONASS |
| 3 | Narrowband–GLONASS band | GPS/GLONASS |
| 4 | Wideband–GPS band | GPS |
| 5 | Wideband–GPS band | GPS/GLONASS |
| 6 | Wideband–GLONASS band | GPS/GLONASS |
Table 3.
Minimum number of available GPS satellites.
Table 3.
Minimum number of available GPS satellites.
| Jamming Power (dBm) | −90 | −88 | −86 | −84 | −82 | −80 | −78 | −76 | −75.6 | −75.2 | −74.8 |
|---|
| Narrowband | 10 | 10 | 10 | 9 | 9 | 9 | 9 | 7 | 5 | 0 | 0 |
| Wideband | 9 | 8 | 8 | 9 | 5 | 0 | 0 | 0 | 0 | 0 | 0 |
Table 4.
Solution availability during GPS-only constellation scenarios.
Table 4.
Solution availability during GPS-only constellation scenarios.
| Jamming Type | Narrowband Interference | Wideband Interference |
|---|
| Solution availability percentile | 56.3% | 50.6% |
Table 5.
Minimum number of available satellites for scenario #2.
Table 5.
Minimum number of available satellites for scenario #2.
| Jamming Power (dBm) | −90 | −88 | −86 | −84 | −82 | −80 | −78 | −76 | −75.6 | −75.2 | −74.8 |
|---|
| GPS satellites | 10 | 10 | 10 | 9 | 9 | 9 | 9 | 7 | 6 | 2 | 0 |
| GLONASS satellites | 6 | 6 | 6 | 6 | 7 | 7 | 7 | 7 | 7 | 7 | 7 |
| Total | 16 | 16 | 16 | 15 | 16 | 16 | 16 | 14 | 13 | 9 | 7 |
Table 6.
Minimum number of available satellites for scenario #3.
Table 6.
Minimum number of available satellites for scenario #3.
| Jamming Power (dBm) | −90 | −88 | −86 | −84 | −82 | −80 | −78 | −76 | −75.6 | −75.2 | −74.8 |
|---|
| GPS satellites | 10 | 10 | 10 | 10 | 9 | 9 | 9 | 9 | 9 | 9 | 9 |
| GLONASS satellites | 6 | 6 | 6 | 6 | 7 | 7 | 7 | 3 | 3 | 1 | 0 |
| Total | 16 | 16 | 16 | 16 | 16 | 16 | 16 | 12 | 12 | 10 | 9 |
Table 7.
Minimum number of available satellites for scenario #5.
Table 7.
Minimum number of available satellites for scenario #5.
| Jamming Power (dBm) | −90 | −88 | −86 | −84 | −82 | −80 | −78 | −76 | −75.6 | −75.2 | −74.8 |
|---|
| GPS satellites | 9 | 8 | 8 | 7 | 4 | 3 | 0 | 0 | 0 | 0 | 0 |
| GLONASS satellites | 6 | 6 | 6 | 6 | 7 | 7 | 7 | 7 | 7 | 7 | 7 |
| Total | 15 | 14 | 14 | 13 | 11 | 10 | 7 | 7 | 7 | 7 | 7 |
Table 8.
Minimum number of available satellites for scenario #6.
Table 8.
Minimum number of available satellites for scenario #6.
| Jamming Power (dBm) | −90 | −88 | −86 | −84 | −82 | −80 | −78 | −76 | −75.6 | −75.2 | −74.8 |
|---|
| GPS satellites | 10 | 10 | 10 | 9 | 9 | 9 | 9 | 9 | 9 | 9 | 9 |
| GLONASS satellites | 6 | 5 | 5 | 5 | 6 | 4 | 2 | 0 | 0 | 0 | 0 |
| Total | 16 | 15 | 15 | 14 | 15 | 13 | 11 | 9 | 9 | 9 | 9 |
Table 9.
Positioning error for all scenarios.
Table 9.
Positioning error for all scenarios.
| | East (m) | North (m) | Up (m) | 2D Position (m) |
|---|
| Max. Error | RMSE | Max. Error | RMSE | Max. Error | RMSE | Max. Error | RMSE |
|---|
| Scenario #1 | 0.77 | 0.23 | 0.79 | 0.61 | 3.74 | 2.9 | 0.81 | 0.63 |
| Scenario #2 | 12.96 | 0.63 | 6.88 | 0.88 | 27.83 | 2.9 | 5.86 | 0.87 |
| Scenario #3 | 0.3 | 0.18 | 1.12 | 0.59 | 3.09 | 2.46 | 1.14 | 0.6 |
| Scenario #4 | 2.57 | 0.51 | 3.48 | 0.64 | 7.3 | 3.11 | 3.27 | 0.66 |
| Scenario #5 | 14.07 | 0.68 | 4.58 | 0.95 | 32.61 | 3.17 | 3.48 | 0.94 |
| Scenario #6 | 0.46 | 0.22 | 1.18 | 0.56 | 3.36 | 2.53 | 1.21 | 0.58 |
Table 10.
Velocity error for all scenarios.
Table 10.
Velocity error for all scenarios.
| | Velocity East (m/s) | Velocity North (m/s) | Velocity Up (m/s) | Horizontal Speed (m/s) |
|---|
| Max. Error | RMSE | Max. Error | RMSE | Max. Error | RMSE | Max. Error | RMSE |
|---|
| Scenario #1 | 0.5 | 0.04 | 1.36 | 0.08 | 1.25 | 0.12 | 1.08 | 0.06 |
| Scenario #2 | 3.75 | 0.23 | 1.67 | 0.1 | 8.74 | 0.53 | 3.62 | 0.22 |
| Scenario #3 | 0.37 | 0.02 | 0.39 | 0.02 | 0.1 | 0.03 | 0.36 | 0.02 |
| Scenario #4 | 2.72 | 0.16 | 6.88 | 0.38 | 2.17 | 0.18 | 2.65 | 0.18 |
| Scenario #5 | 3.99 | 0.25 | 0.91 | 0.07 | 10.12 | 0.62 | 3.91 | 0.24 |
| Scenario #6 | 0.39 | 0.02 | 0.44 | 0.03 | 0.09 | 0.03 | 0.44 | 0.02 |
© 2020 by the authors. Licensee MDPI, Basel, Switzerland. This article is an open access article distributed under the terms and conditions of the Creative Commons Attribution (CC BY) license (http://creativecommons.org/licenses/by/4.0/).


