Review

How Fishy Is Your Fish? Authentication, Provenance and Traceability in Fish and Seafood by Means of Vibrational Spectroscopy

1
CREST Technology Gateway of TU Dublin, Dublin 8, Ireland
2
Centre for Nutrition and Food Sciences, Queensland Alliance for Agriculture and Food Innovation (QAAFI), University of Queensland, Brisbane, QLD 4072, Australia
*
Author to whom correspondence should be addressed.
Appl. Sci. 2020, 10(12), 4150; https://doi.org/10.3390/app10124150
Submission received: 22 May 2020 / Revised: 11 June 2020 / Accepted: 11 June 2020 / Published: 17 June 2020
(This article belongs to the Special Issue Application of Spectroscopy in Food Analysis)

Abstract

:
Food authenticity, traceability and provenance are emerging issues of major concern for consumers, industries and regulatory bodies worldwide. In addition, both food safety and security are an intrinsic component of food quality where the above issues are key in modern traceability and management systems. It has been reported that substitution of a high-quality species by less expensive ones might be a frequent practice in seafood products such as fish and shellfish. In this type of products, the source (e.g., origin) and identification of the species are complex. Although different countries have implemented strict regulations and labelling protocols, these issues still are of concern. This article briefly reviews some of the most recent applications of vibrational spectroscopy (near and mid infrared, Raman) combined with chemometrics to target some of these issues in the seafood and fish industries.

1. Introduction

Both the present and future of the food industry is challenged by the increasing complexity and interlinked nature of food supply chains, climate change issues specifically those affecting the production of raw materials, obesity and aging in the population, as well as continuous changes in the consumer choice trends in healthy and nutritious foods (e.g., food security, food fraud, etc.) [1,2,3,4,5,6,7].
Food authenticity, traceability, origin and provenance are major concerns for consumers, industries and regulatory bodies worldwide [1,2]. Additionally, consumers have become increasingly aware of the impacts of food production both on the environment (e.g., sustainability, reduce food waste) and public health, with the emergence of illness, such as avian flu or white spot (e.g., common disease in prawns), and the incidence of malpractice along the whole value chain [3,4,5]. Such issues have compounded, as developed countries increase food imports to focus on more profitable sectors, and endeavour to provide consumers access to exotic and otherwise seasonal food and goods all year round [6,7].
As demand and consumer awareness increases about food safety issues, traceability systems (e.g., blockchain) become an essential component of safety and quality management systems as an intrinsic part of food quality [8,9,10,11]. Traceability systems are utilised to collect data and supply relevant information about the operation of the production chain at set control points [12]. The more precise the traceability system, the more efficiently it can identify and resolve food safety or quality problems in a given food production chain [2,12].
Consumers require accurate and complete information regarding the products they buy and eat. In many cases, food, both raw ingredients and products are deliberately or unintentionally adulterated [13,14,15]. This can be a consequence of either the mislabelling of a product or the substitution of one component with a similar but lower-quality or cheaper counterpart, ultimately leading to commercial fraud [13,14,15]. Consequently, assuring the authenticity of food ingredients and products is critical for preventing not only economic fraud but also to reduce the negative impact on both consumers and industry stakeholders [13,14,15,16,17,18]. Concomitantly, undeclared, mislabelled, or even fake food constituents represent a significant risk to the health and safety of consumers (e.g., undeclared allergens in food due to mislabelling or adulteration) [16,17,18].
Fish and seafood are essential contributors to the global food supply, providing an important source of animal protein [7,19,20,21]. Unfortunately, overfishing of oceans and other waterways continuously increases annually, necessitating alternate production sources for seafood to feed the planet’s ever-growing population [7,19,20,21]. Aquaculture (i.e., aquafarming or fish farming) is a well-known production system that has been steadily increasing since 1950 and currently produces more seafood than capture fisheries [7,19,20,21]. Fish and seafood products are one of the most common food commodities traded, and thus also one of those most prone to mislabelling and fraud at an international level [22]. This is because the source (e.g., aquaculture, wild, fresh water, etc.) and identification of fish and seafood products (species, populations—linked to geographic origin) are highly complex [23,24,25,26]. In both fish and seafood products, the wide biological diversity, the removal of external features during processing steps, as well as the close phylogenetically relationships among them render the morphological identification almost impossible [27,28]. This is reflected in the literature where the substitution of a high-quality seafood products with one of lower cost is frequently reported by both industry and academics [23,24,25,26,27,28].
Despite the implementation of strict regulations and labelling protocols by various nations, these issues remain an international concern [29]. In fact, as a means to avoid food adulteration and food fraud, many regulations have been promulgated all over the world for food products, both generally [30,31,32] and for seafood products specifically [33,34,35]. For instance, the Council Regulation (EC-No. 104/2000) [36] on the common organization of the markets in fishery and aquaculture products requires that seafood products must be labelled with the commercial name of the species at every step of the marketing chain [36].
This article briefly reviews some of the most recent applications of vibrational spectroscopy (near and mid infrared, Raman) combined with chemometric methods to target authenticity, provenance and traceability in the seafood and fish industries.

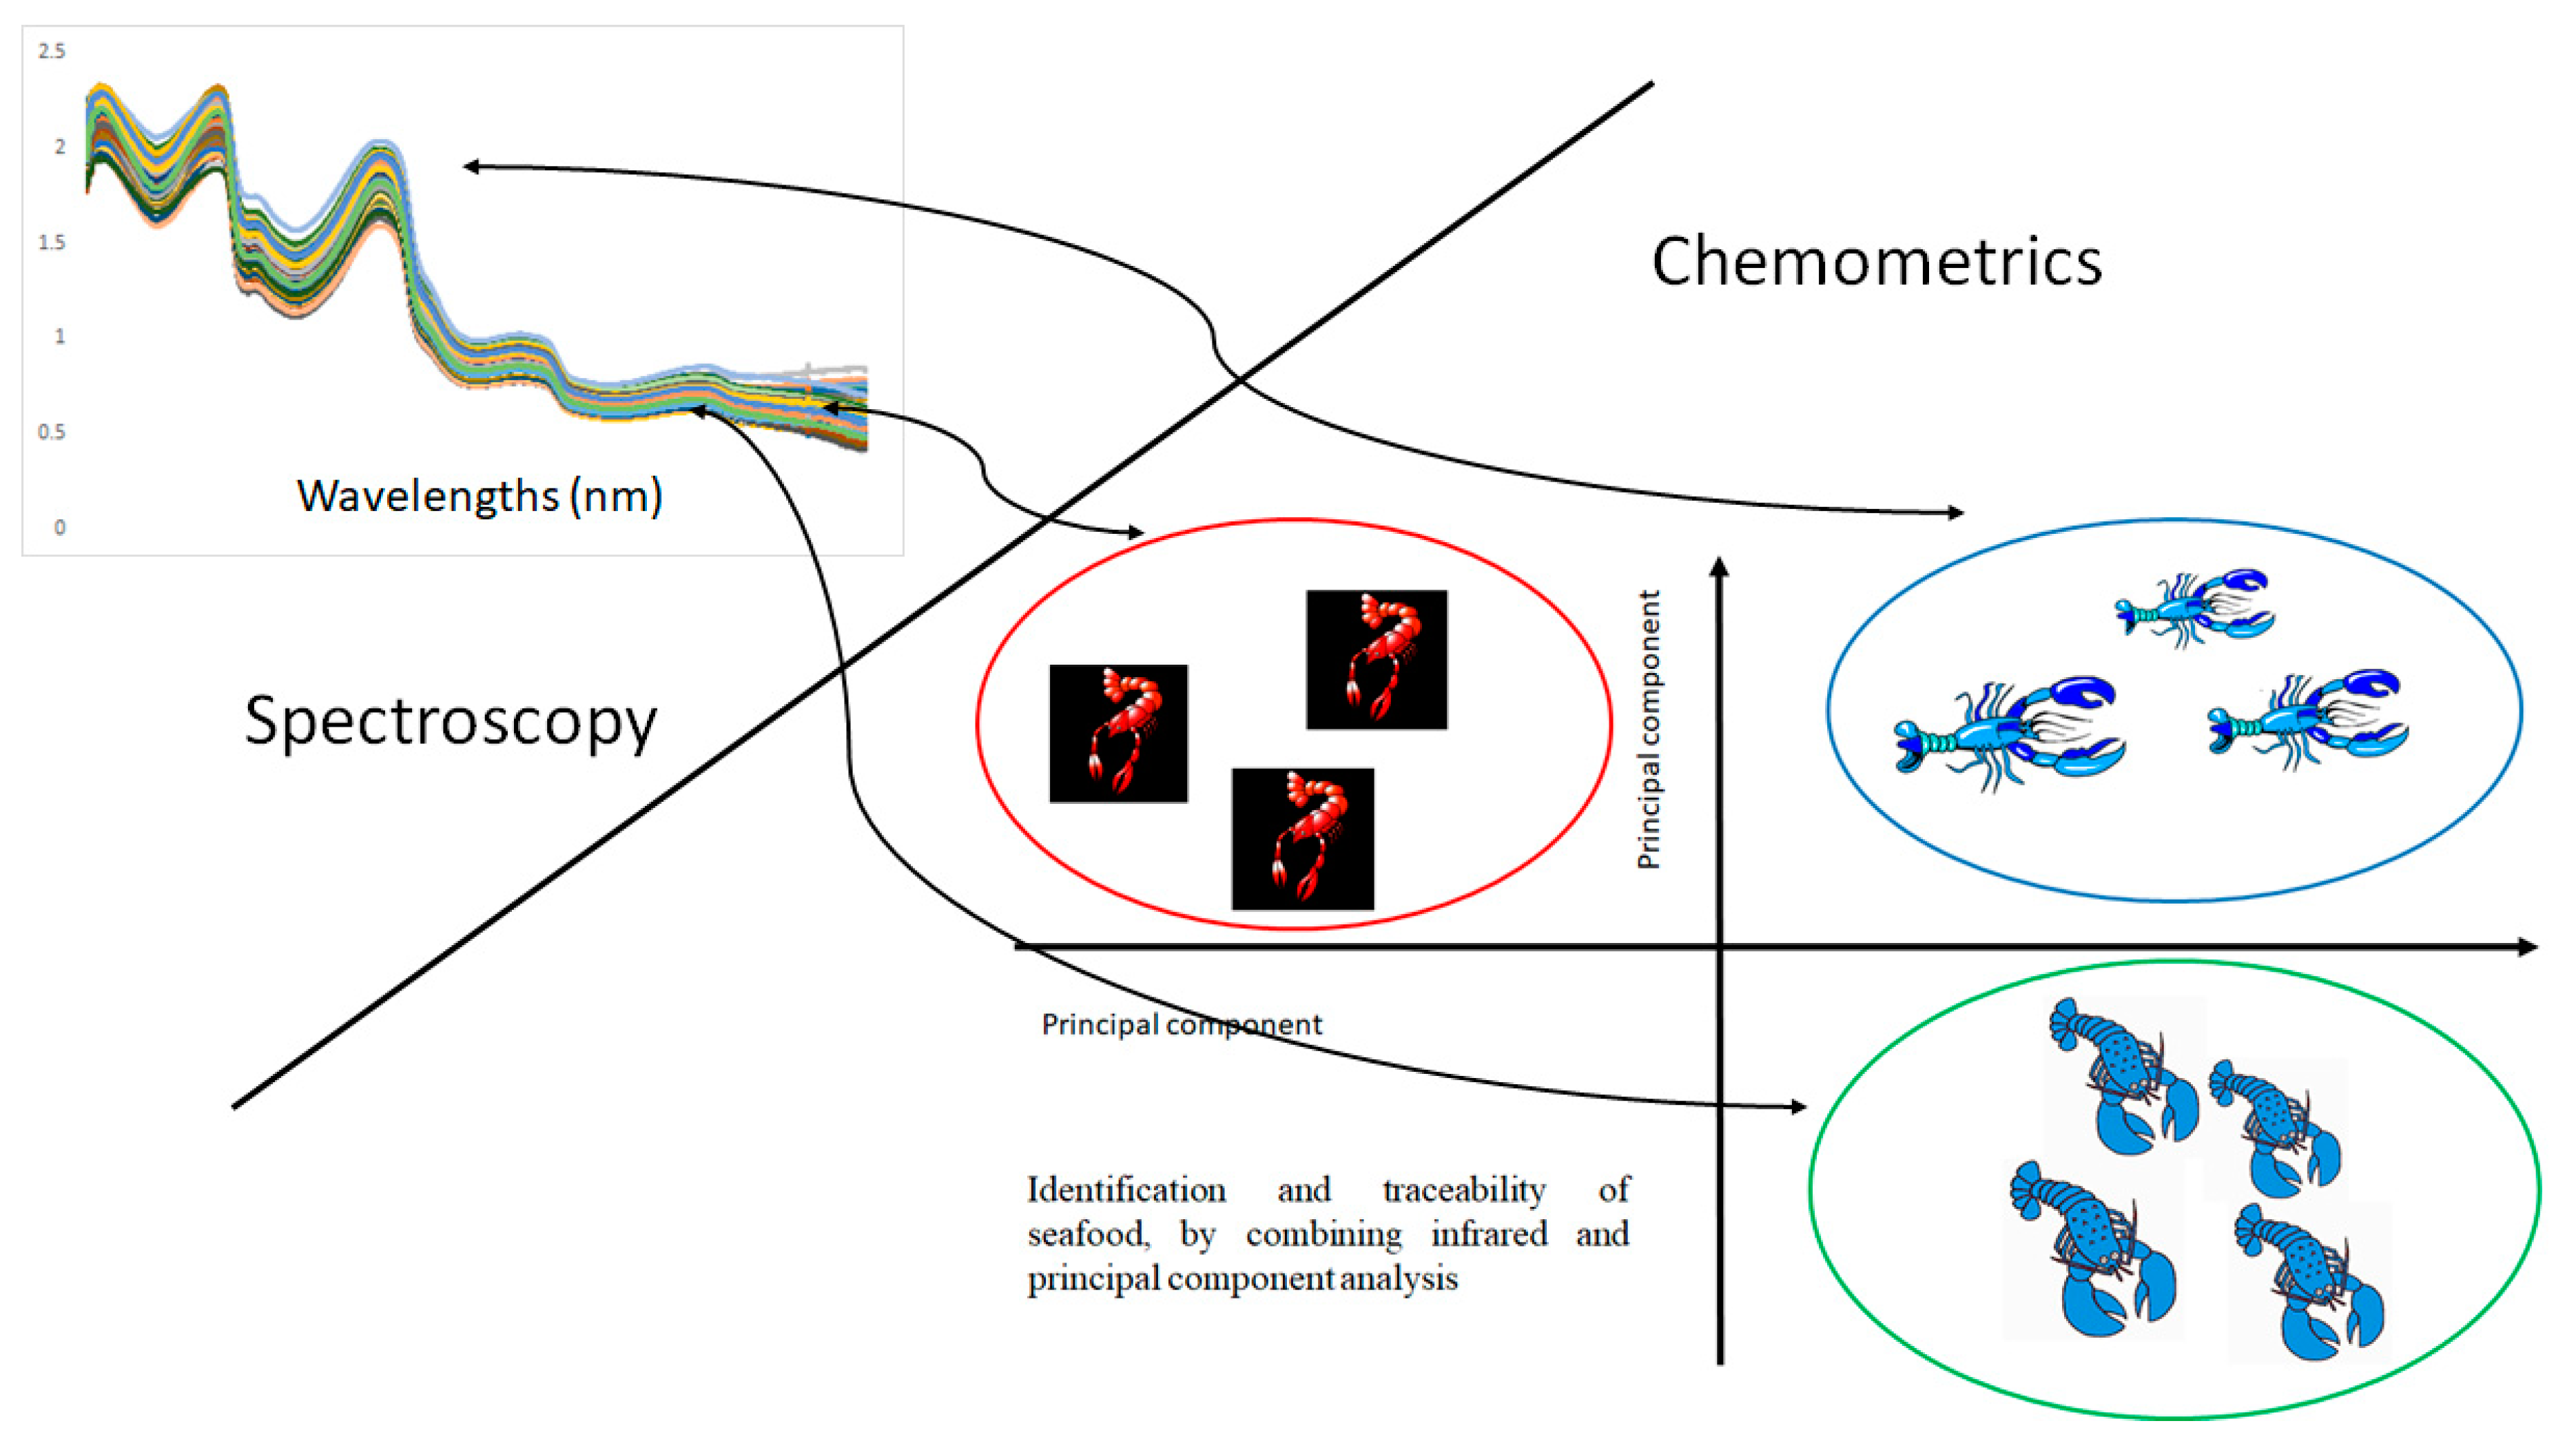
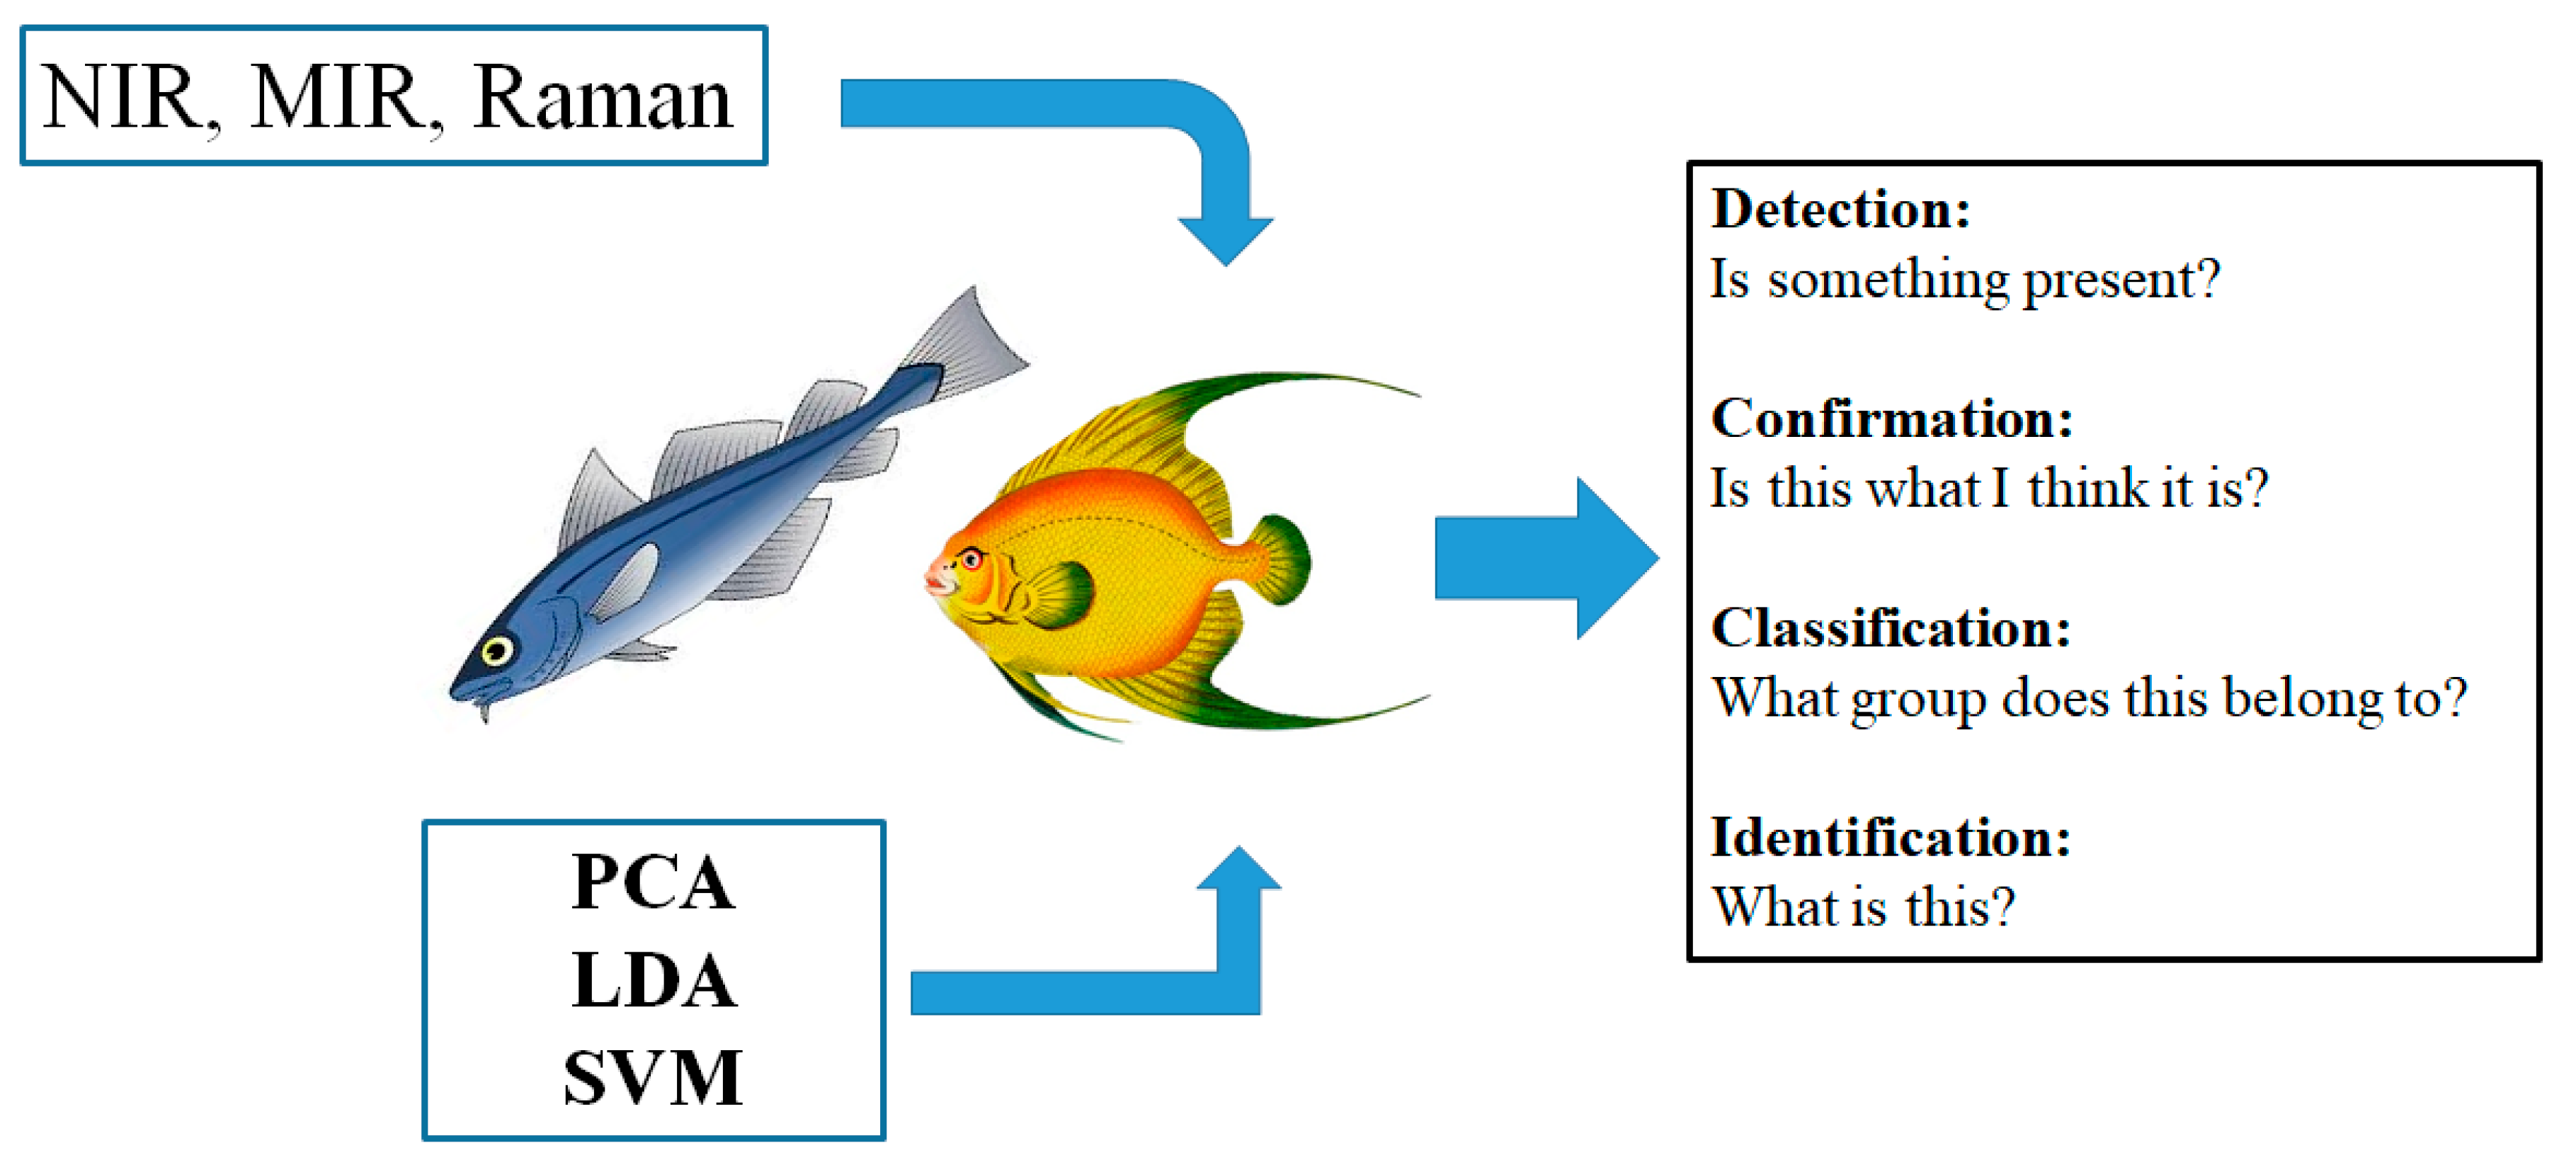
2. The Tools—Chemometrics and Vibrational Spectroscopy

2.1. Chemometrics

Chemometrics may be defined as the combination of algebra, mathematics and statistical analysis techniques to analyse and process data [37,38,39,40,41,42]. It allows for multivariate analysis which is incredibly useful for processing large datasets derived from food analysis, particularly instrumental analysis (e.g., spectroscopy) [37,38,39,40]. The different methods and techniques allow the analyst to isolate and interpret pertinent information from complex datasets, illustrate patterns within the data, and develop calibration and validation models [37,38,39,40]. The application of chemometric methods has become more common in recent years as computing power and the availability of chemometric software packages has increased [41,42]. The chemometric method or technique used in this type of applications (e.g., authenticity, traceability, provenance) can be divided into unsupervised (e.g., samples can be classified without any prior knowledge) or supervised (e.g., prior knowledge about the sample or dataset is required) [37,38,39,40]. While unsupervised methods are useful for the clustering of samples, i.e., determining the internal grouping in a set of unlabelled data, they are not suitable for predicting the category of unknown new objects, which would require supervised methods. In most cases, supervised classification models must be developed using a training set of samples that have a well-defined category or property. The overall performance of the model might be evaluated by contrasting the predicted with the true category samples (validation) [37,38,39,40,41,42,43,44,45].
Principal component analysis (PCA) is the most widely used variable-reduction method utilised in chemometrics. It is a versatile method of providing a clear overview of complex multivariate data and illustrating relationships between variables and samples, showing the existence of clusters or patterns in the data, while also highlighting outliers (see Figure 1) [43,44,45]. In addition to PCA, other classification or pattern recognition techniques have been applied [46,47]. Some of the most common used discriminant analysis methodologies (e.g., supervised and unsupervised) include cluster analysis, K-nearest neighbours (k-NN), linear discriminant analysis (LDA), factorial discriminate analysis (FDA), partial least squares discriminant analysis (PLS-DA), quadratic discriminant analysis (QDA), artificial neural networks (ANN), soft independent modelling of class analogy (SIMCA), and more recently machine learning methods and techniques such as support vector machines (SVM) [46,47].
As well as the algorithms or chemometric method used to develop an application, pre-processing of the spectra is also required in most cases [46,47]. For example, derivatives (e.g., first and second) are often used to reduce the broad overlapping bands that exist in the spectra, in particular in near infrared (NIR) spectroscopy [36,37,38,40,46,47]. Pre-processing techniques also aid in resolving any baseline shift build in the raw data [36,37,38,40,46,47]. Other pre-processing methods widely used in spectroscopy are smoothing, detrending, standard normal variate (SNV) and multiplicative scatter correction (MSC). More details about these techniques can be found in the scientific literature in this topic [36,37,38,40,46,47].

2.2. Vibrational Spectroscopy

Qualitative and quantitative applications of vibrational spectroscopic techniques are well established in the food industry [48,49,50,51]. This is also true for seafood, were specific applications include the evaluation of product freshness, authenticity of fish and seafood ingredients and products, such as geographical origin and production method (e.g., wild vs. farmed, fresh vs. frozen–thawed); and detection or monitoring of spoilage [48,49,50,51]. It is in this context that vibrational spectroscopy (infrared, Raman) has been one of the most attractive and commonly used methods of analysis, as it allows for simultaneous, rapid, and non-destructive determination of major components in many agriculture-related products and plant materials [42,48,52]. Mid (MIR), near infrared (NIR) and Raman spectroscopy are classified as molecular/vibrational spectroscopy techniques and they are used to evaluate and study the interactions of electromagnetic waves with a sample. The electromagnetic spectrum comprises of different types of radiation, ranging from radio waves (lower end of the spectrum) through to gamma rays (upper end) [41,42,51,52,53]. Molecules absorb IR owing to the vibrational movements of their chemical bonds (e.g., bending, stretching, rocking, wagging or scissoring) [41,42,51,52,53]. As these actions occur solely at specific energy levels, chemical bonds absorb IR radiation of defined energies at distinct wavenumbers or wavelengths. Infrared spectroscopy is the measure of this absorption, resulting in a spectrum with peaks representing the chemical bonds present in the given sample [41,42,51,52,53].
The NIR region of the spectrum is located between 700–2500 nm [41,42,51,52,53]. NIR spectroscopy has been established as an efficient analytical technique in the food industry when combined with chemometric tools (e.g., data mining and data processing), as the weaker bands in the NIR region are less intense than those in the MIR (between 10–100 times) [41,42,51,52,53]. This characteristic of the NIR energy facilitates that samples can be analysed directly without the need of pre-processing (e.g., drying, homogenisation, grinding) [41,42,51,52,53]. Overall, the NIR spectra is the result of overtone and combination bands of fundamental vibrations of C—H, O—H, and N—H bonds [41,42,51,52,53]. The interpretation of NIR spectra can be hindered further as consequence of not only the many overlapping bands but also because an individual analyte might absorb at several wavelengths [41,42,51,52,53]. The MIR region (4000–400 cm−1) has been very important in the development of several applications in different fields (e.g., biology, environment and food) [41,42,51,52,53]. The MIR is of particular importance analytically as it contains the so called biochemical and chemical fingerprint region (1800–900 cm−1) [41,42,51,52,53]. The MIR region is known to contain the distinguishing a number of common biochemical and chemical compounds present in complex food matrices such as Amide I, II and III around 1650 cm−1, 1550 cm−1, and 1260 cm−1, carbohydrates around 1155 cm−1, glycogen around 1030 cm−1, lipids and ester groups around 1750 cm−1, asymmetric phosphate stretching vibrations ( PO 2 ) around 1225 cm−1, symmetric phosphate stretching vibrations ( PO 2 ; ∼1080 cm−1) and protein phosphorylation around 970 cm−1 [41,42,51,52,53]. The MIR range between 1500 and 400 cm−1 is also known as the fingerprint region [41,42,51,52,53]. Absorption values or peaks in the fingerprint region are predominantly produced by bending and skeletal vibrations, which are sensitive to large wavenumber shifts, minimising against unambiguous identification of specific functional groups. Analysis of such fingerprints is the basis of many applications of MIR spectroscopy in food analysis [41,42,51,52,53]. In recent years, modern IR instruments have incorporated sampling accessories such as attenuated total reflectance (ATR) [41,42,51,52,53]. The incorporation of ATR has boosted the use of mid infrared (MIR) spectroscopy in food analysis, allowing for the development of new applications as it removes any necessity for sample preparation, as the ATR accessory extends the path length assessed by the instrument significantly [41,42,51,52,53]. Spectra that originate in the MIR region are characterised by intense and more informative bands or peaks of the molecules present in the food matrix (fundamental frequencies) [41,42,51,52,53,54,55].
Raman spectroscopy, based on the inelastic scattering of monochromatic when interacting with molecules, is gaining an increasingly wider area of applications in different industries (e.g., pharmaceutical, food) [56,57,58,59]. Raman spectroscopy provides rich information of the molecule’s vibrational modes, as well as it is characteristic structure [56,57,58,59]. Although only a small amount of the incident light is inelastically scattered, resulting in the Raman scattering being a naturally weak effect, the weak counterpart of the incident light energy is modified by the molecular vibrations of the scattering sample [56,57,58,59]. Therefore, the observed vibrational responses provide the analyst with enough information about the chemical composition of the sample [56,57,58,59]. In recent years, measuring the Raman spectra of complex samples (e.g., muscles, cereals, wine) in situ became more accessible due to the release of high resolution and portable instruments that provide good detection capabilities [56,57,58,59].
Regardless of the method or technique used (chemometric and spectroscopy) during the process of developing the application, important questions must be addressed depending on the objective or target. For example, if the application targets only what is present in the sample (e.g., is something present in the sample?) the objective of the application will be focused on detection; if the application aims to confirm what is in the samples (e.g., is this what we think it is?); the application will focus on classification, if the application questions the environment of the target molecule/atom (e.g., what group does this belong to?) the application targets what is present in the sample and will focus on identification (e.g., what is this?) (see Figure 2).

2.3. Target and Non-Target Analysis

It is widely accepted that several substances have the potential to be a food contaminant which can, and have been, used for adulterating both foods and food ingredients. To monitor and prevent this, two main approaches have been used: (1) Targeted food analysis which involves the identification of specific markers or compounds that are indicative of a particular property. These markers or compounds may be compared with standards in order to assure the authenticity of the food analysed [58,60,61,62]. (2) Alternatively, non-targeted analysis is based on the use of an analytical technique that is able to collect the entire profile of a sample or group of samples [58,60,61,62]. The collected profile of the sample can then be compared with a library of well-known samples that have been characterised and whose origin is proven [58,60,61,62]. Researchers often use genetic barcoding identification in collaboration with molecular biologists or sequencing services providers to affirm authenticity [58,60,61,62].

2.4. The Sample (Authentic Sample, Number and Representative Samples)

One of the most important issues to be considered in this type of applications is establishing what constitutes a genuine/authentic sample or one of known origin and provenance (e.g., the sample must be fully traceable) [58,60,61,62]. Samples must be procured from well-known providers, directly from the source or directly from the same conditions in the supply chain [58,60,61,62]. However, both the collection and definition of an authentic sample is a very difficult task and requires strong collaboration and trust between the researchers and the fish and seafood industry. Moreover, both the total number of samples and sample representation also have a profound effect on the success of the application [58,60,61,62]. Therefore, care must be taken in order to select an adequate and representative number of samples in order to develop a robust method.

3. Examples of Chemometrics and Vibrational Spectroscopy Applications in Seafood

3.1. Authentication, Provenance and Traceability

Seafood processing often removes morphological properties of seafood species that enable the consumer to distinguish one type from another [63,64,65,66]. Consequently, species substitution is an extremely common form of economic adulteration within the seafood industry [63,64,65,66]. Both visible (VIS) and NIR spectroscopy were evaluated to detect and quantify species authenticity and adulteration in crabmeat samples by Gayo and collaborators [67,68,69]. In one study, these authors have reported the adulteration of Atlantic blue (Callinectes sapidus) crabmeat with blue swimmer (Portunus armatus) crab. The authors observed that water absorption bands dominated the main features in the crabmeat spectra, with a decrease in sample absorbance observed with increasing adulteration percentage [67,68,69]. These authors also reported the use of several data pre-treatments to the NIR spectra such as moving average, a combination of first and second derivatives, as well as the use of multiplicative scatter correction in addition to the raw data, prior to developing PLS regression models [67,68,69]. Gayo and team determined that VIS and NIR spectroscopy combined with chemometric tools were useful for detecting and quantifying species authenticity and adulteration in crabmeat [67,68,69]. In a similar study, the same authors utilised both VIS and NIR spectroscopy to detect, monitor and define the economic adulteration of crab meat [67,68,69]. In this study, Atlantic blue (Callinectes sapidus) and blue swimmer (Portunus armatus) crab meat samples were adulterated with surimi-based imitation crab meat. Here, the authors determined that both PLS and principal component (PCR) regression methods after pre-processing the spectra using the first derivative provided the best means of detecting adulteration in crab meat samples adulterated with surimi [67,68,69]. Brodersen and Bremner [70] utilised NIR spectroscopy combined with PCA to differentiate between shrimp (Pandalus borealis) from a commercial freezer trawler. The shrimp was processed in several ways including, iced, stored in fresh water and brine of various salt concentrations before being steam-cooked and peeled [70]. The authors demonstrated that chemometrics combined with NIR spectra obtained from samples of whole shrimp and of minced fresh from the various treatments could differentiate between frozen and thawed material, between salt content, pH in the flesh, cooking period (temperature) as well as the whole or minced shrimp [70].
Qu and co-workers [71] demonstrated the potential of VIS-NIR spectroscopy combined with a hyperspectral imaging system to discriminate fresh, cold-stored and frozen–thawed shelled shrimp (Metapenaeus ensis). Results derived from this study indicated that the combination of both chemometrics and spectroscopy were useful to detect illegally substituted and mislabelled products [71]. The authors confirmed the usefulness of VIS-NIR spectroscopy to classify between fresh shrimps and those from either cold storage or freezing with classification rates higher than 91% and 88%, respectively [71]. Wu and co-workers also exploited hyperspectral imaging combined with chemometric methods to assess the reliability and accuracy of the technique to detect gelatine adulteration in prawns [72].
Ottavian and co-workers investigated the potential of NIR spectroscopy as a means of authentication of wild European sea bass (Dicentrarchus labrax) [73]. The authors explored three different chemometric techniques to process the NIR spectra, and their ability to discriminate between wild and farmed sea bass samples was evaluated [73]. The three chemometric techniques demonstrated that NIR spectroscopy can be reliably applied to discriminate between wild and farmed sea bass, achieving the same classification performance as classification methods that use chemical properties and morphometric traits [73]. Moreover, the NIR-based classification methods do not require reagents and were simpler, faster, more economical, and environmentally safer compared to traditional methods based on chemical analysis [73].
A study by Lv and collaborators, utilised NIR spectroscopy to discriminate different species of freshwater fish including black carp (Mylopharyngodon piceus), grass carp (Ctenopharyngodon idellus), silver carp (Hypophthalmichthys molitrix), bighead carp (Aristichthys nobilis), common carp (Cyprinus carpio), crucian (Carassius auratus), and bream (Parabramis pekinensis) [74]. The authors evaluated several chemometric techniques including PLS-DA, PCA, competitive adaptive reweighted sampling, and fast Fourier transform (FT) applied to LDA to classify and monitor the origin of the samples [74]. The authors concluded that the developed methodology was effective in distinguishing between freshwater fish species [74].
The ability of handheld instruments was evaluated to identify both fillets and patties of Atlantic cod (Gadus morhua) and haddock (Melanogrammus aeglefinus) [75,76]. The authors of this study used LDA and SIMCA to analyse the NIR data. The models developed were able to classify 100% using LDA, while a sensitivity higher than 65% and specificity higher than 74% using SIMCA [72,73]. The use of IR spectroscopy was also evaluated as a rapid tool to identify valuable species (e.g., red mullet (Mullus surmuletus) and plaice (Pleuronectes platessa)) substitution with cheaper varieties (e.g., Atlantic mullet (Mugil cephalus) and flounder (Paralichthys dentatus)) in combination with LDA and SIMCA [60]. The authors reported 100% correct classification when LDA was used, while a sensitivity higher than 70% and a specificity of 100% was obtained using SIMCA [60]. The ability of Fourier transform MIR (FT-MIR) was also evaluated by Wu et al. to study the adulteration of Norwegian salmon with Heilongjiang salmon at local fish markets [77]. The authors reported that the Norwegian and Heilongjiang salmon samples could be identified using PLS-DA. However, the method was unable to classify the extent of adulteration between levels of 20–80% [77].
The use of NIR and hyperspectral imaging (900–1700 nm) was evaluated as a tool to automatically check fish quotas [78]. The authors assumed that different small pelagic fish species have different spectral signatures [78]. In this study, samples of Chilean silverside (Odontesthes regia), southern rays bream (Brama australis), and silver hake (Merlucciidae) were scanned and their spectral signatures analysed using k-nearest neighbour (k-NN) and SVM [78]. The authors reported classification rates between 80% and 90% depending on the NIR region used during the development of the application [78].
Raman spectroscopy (wavelength of 532 nm) was evaluated to classify deep frozen fish fillets [79]. The spectra of the fillet samples sourced from twelve types of fish were scanned using Raman spectroscopy, and analysed using hierarchical cluster. The authors identified three groups namely fish from salmonid family; the second group comprised of fish reared in fresh or brackish water; and the third group comprised of saltwater reared fish. The authors demonstrated the potential of Raman spectroscopy as a screening tool prior to routine standard industry methods for the identification of fish fillets [79].

3.2. Freshness, Spoilage and Storage

Dai and colleagues [80] investigated the potential of VIS and NIR hyperspectral imaging as a rapid and non-invasive method to assess the freshness of prawns. The authors evaluated both unfrozen and frozen samples (280 prawns total) and reported the rapid non-invasive classification of unfrozen and frozen prawn samples with an average correct prediction rate of 98.33% and 95%, respectively [80]. The authors noted that their study should encourage greater research efforts in regard to the on-line application of hyperspectral imaging for classification and prediction of seafood products. However, they also acknowledged that as the number of samples analysed in the study was low and only a limited number of storage periods were investigated, that additional samples possessing a more varied range of freshness levels should be considered to improve the accuracy and reliability of the models in future studies. The authors also recommended that more advanced algorithms should be developed to determine the relationship between freshness and hyperspectral datasets [80].
Ding and co-workers [49] reported the rapid and non-destructive assessment of silver chub (Macrhybopsis storeriana) freshness using FT-NIR spectroscopy. The authors reported that the eye-ball of the fish was the best position to locate the NIR fibre optic in order to collect the spectra [49]. The main explanation of this by the authors was related to the structure of the fish-eyes and the direct relationship that exist between eye characteristics with the overall freshness of the fish during cold storage [49]. The authors reported that the combination of spectral analysis combined with chemometrics successfully identified the freshness of samples with a correlation coefficient of 95.59% [49]. Similarly, Zhou and co-workers [81] determined the freshness of big head carp (Hypophthalmichthys nobilis) with NIR spectroscopy combined with different regression methods. The authors reported the prediction of chemical parameters directly associated with freshness using NIR spectroscopy such as pH, total volatile basic nitrogen (TVN), and thiobarbituric acid (TBARS) [81]. The prediction models reported yield a coefficient prediction of 0.945, 0.932 and 0.954 and root mean square error of prediction of 0.081, 2.099 and 0.107 for pH, TVN and TBARS, respectively [81].
In another study, Saraiva and collaborators [82] reported the use of FT-MIR to identify and monitor spoilage of salmon samples stored in three different environments, in real time. The homogenised salmon samples were analysed using an attenuated total reflectance (ATR) cell where PCA was used to identify the regions in the MIR region associated with the spoilage process [82]. The researchers also used LDA to analyse the MIR spectral data in combination with sensory to better quantify sample freshness [82]. The use of hyperspectral imaging to monitor freshness in cod fillets (freeze storage, thawing, vacuum packed) was reported [83]. The authors concluded that the freezing history could be predicted on frozen and thawed samples [83].
The combination of VIS and NIR hyperspectral imaging was evaluated to differentiate between frozen/thawed samples of halibut (Psetta maxima) [84]. The classification rates reported by the authors were above 97% for the prediction samples [84]. However, the classification rates were lower when the different freezing rates were considered. The authors concluded that VIS and NIR hyperspectral imaging was able to differentiate between fresh and frozen/thawed samples [85]. A recent article provides more details about the current state-of-the-art application of hyperspectral imaging to monitor freshness, safety and storage conditions of fish [86].
Raman spectroscopy was evaluated as a means to identify and classify the species of fish as well as to determine their freshness (e.g., freezing vs. thawing) by Murat et al. [87]. The fish species analysed in this study included horse mackerel (Trachurus trachurus), European anchovy (Engraulis encrasicolus), red mullet (Mullus surmuletus), bluefish (Pomatamus saltatrix), Atlantic salmon (Salmo salar) and flying gurnard (Trigla lucerna) [87]. In this study, the authors split the samples into different freezing and thawing cycles where three batches were defined as fresh, once frozen–thawed and twice frozen–thawed. The Raman data were analysed using PCA models. The authors concluded that the Raman method was able to differentiate and classify the fresh and frozen samples with up to 99.29% confidence [87].

4. Summary (Present and Future Challenges)

Although, sensory, physicochemical, rheological, and other traditional methods have been used to assess the quality of fish and seafood products, the need for rapid analytical techniques is still of a growing interest to the food industry, particularly in regards to costs both monetary and time and the conservation of samples (non-destructive/non-invasive methods of analysis are preferred).
The last 20 years have seen a considerable investment into research targeting food quality and safety methods, as consequence of the number of food scandals, which have seriously undermined consumer confidence. This is particularly true in the case of fish and seafood products, as they possess a wide biological diversity, and their processing often results in the removal of external features (which ultimately hinders classification). The close phylogenetically relationships among most of the more commonly consumed species can render their identification almost impossible to achieve.
This review has shown that different vibrational spectroscopy (e.g., NIR, MIR, Raman and hyperspectral imaging systems) techniques available have the ability to qualitatively (e.g., classify, identify, monitor) analyse fish and seafood products. The several applications of vibrational spectroscopy highlighted the need to incorporate different data analysis and processing techniques (e.g., PLS-DA, LDA, SVM) during the analysis. The most recent developments in hardware (e.g., image techniques, optical sensors, handheld instrumentation) are adding new analytical possibilities, making them very attractive to be used use in the whole value chain (e.g., objective tools in blockchain and food traceability). The development of applications based upon vibrational spectroscopy from the collection of the spectra is not insignificant, and it requires an understanding of the fundamentals of spectroscopy, data processing and analysis, sampling protocols, limit of detection, among others, that will better accomplish the requirements for the target application.
Adapting and using advanced technologies (e.g., vibrational spectroscopy and chemometrics) are promising ways to efficiently and reliably improve traceability in the food value chain towards sustainability. These new tools (e.g., handheld instruments, hyperspectral imaging methods) will allow the industry and researchers alike to move forward and develop novel applications that can address the best management practices in the production, process and commercialisation of raw ingredients and food products.
However, various hurdles still hinder the growth and development of vibrational spectroscopy applications by the fish and seafood industries. Among them is the reluctance of the fish and seafood industry to accept the incorporation of vibrational spectroscopy with new statistical tools such as chemometric techniques as routine analytical or quality control methods. Furthermore, most of the current courses and training programmes in food analysis and technology still focus on the so-called classical approach, which do not incorporate several aspects related to new technologies, sensors and programming in their curricula. The same can apply to research and other aspects of informal training and extension [88]. It is in our view that the silo mentality [88] that still exists among the researchers in the food industry is hindering the industry’s ability to exploit the full potential of chemometric systems.

Author Contributions

All authors contributed equally to this work. Conceptualization, D.C.; writing—original draft preparation, A.P.; writing—review and editing, D.C. and A.P. All authors have read and agreed to the published version of the manuscript.

Funding

This research received no external funding.

Conflicts of Interest

The authors declare no conflict of interest.

References

  1. Carcea, M.; Brereton, P.; Hsu, R.; Kelly, S.; Marmiroli, N.; Melini, F.; Soukoulis, C.; Wenping, D. Food authenticity assessment: Ensuring compliance with food legislation and traceability requirements. Qual. Assur. Saf. Crop. Foods 2009, 1, 93–100. [Google Scholar] [CrossRef]
  2. Gálvez, J.F.; Mejuto, J.; Simal-Gandara, J. Future challenges on the use of blockchain for food traceability analysis. TrAC Trends Anal. Chem. 2018, 107, 222–232. [Google Scholar] [CrossRef]
  3. Hansen, H.; Onozaka, Y. When diseases hit aquaculture: An experimental study of spillover effects from negative publicity. Mar. Resour. Econ. 2011, 26, 281–291. [Google Scholar] [CrossRef] [Green Version]
  4. Käferstein, F.K. Foodborne diseases in developing countries: Aetiology, epidemiology and strategies for prevention. Int. J. Environ. Health Res. 2003, 13, S161–S168. [Google Scholar] [CrossRef]
  5. Raspor, P.; Jevšnik, M. Good nutritional practice from producer to consumer. Crit. Rev. Food Sci. Nutr. 2008, 48, 276–292. [Google Scholar] [CrossRef]
  6. Marshall, D. Food availability and the European consumer. In Food, People and Society; Springer: Berlin/Heidelberg, Germany, 2001; pp. 317–338. [Google Scholar]
  7. Muir, J. Managing to harvest? Perspectives on the potential of aquaculture. Philos. Trans. R. Soc. B Biol. Sci. 2005, 360, 191–218. [Google Scholar] [CrossRef] [Green Version]
  8. Dabbene, F.; Gay, P.; Tortia, C. Traceability issues in food supply chain management: A review. Biosyst. Eng. 2014, 120, 65–80. [Google Scholar] [CrossRef]
  9. King, T.; Cole, M.; Farber, J.M.; Eisenbrand, G.; Zabaras, D.; Fox, E.M.; Hill, J.P. Food safety for food security: Relationship between global megatrends and developments in food safety. Trends Food Sci. Technol. 2017, 68, 160–175. [Google Scholar] [CrossRef]
  10. Trienekens, J.; Zuurbier, P. Quality and safety standards in the food industry, developments and challenges. Int. J. Prod. Econ. 2008, 113, 107–122. [Google Scholar] [CrossRef]
  11. Manning, L.; Baines, R. Effective management of food safety and quality. Br. Food J. 2004, 106, 598–606. [Google Scholar] [CrossRef]
  12. Aung, M.M.; Chang, Y.S. Traceability in a food supply chain: Safety and quality perspectives. Food Control 2014, 39, 172–184. [Google Scholar] [CrossRef]
  13. Granato, D.; Branco, G.F.; Nazzaro, F.; Da Cruz, A.G.; Faria, J.A. Functional foods and nondairy probiotic food development: Trends, concepts, and products. Compr. Rev. Food Sci. Food Saf. 2010, 9, 292–302. [Google Scholar] [CrossRef]
  14. Ortea, I.; O’Connor, G.; Maquet, A. Review on proteomics for food authentication. J. Proteom. 2016, 147, 212–225. [Google Scholar] [CrossRef] [PubMed]
  15. Rodríguez, E.M.; Ortea, I. Food authentication of seafood species. In Proteomics in Food Science; Elsevier: Amsterdam, The Netherlands, 2017; pp. 331–342. [Google Scholar]
  16. Björkstén, B.; Crevel, R.; Hischenhuber, C.; Løvik, M.; Samuels, F.; Strobel, S.; Taylor, S.; Wal, J.-M.; Ward, R. Criteria for identifying allergenic foods of public health importance. Regul. Toxicol. Pharmacol. 2008, 51, 42–52. [Google Scholar] [CrossRef] [PubMed]
  17. Falci, K.J.; Gombas, K.L.; Elliot, E.L. Food allergen awareness: An FDA priority. Food Safety Magazine. February–March 2001. Available online: https://www.foodsafetymagazine.com/magazine-archive1/februarymarch-2001/food-allergen-awareness-an-fda-priority/ (accessed on 16 June 2020).
  18. Spanjersberg, M.; Knulst, A.; Kruizinga, A.; Van Duijn, G.; Houben, G. Concentrations of undeclared allergens in food products can reach levels that are relevant for public health. Food Addit. Contam. Part A 2010, 27, 169–174. [Google Scholar] [CrossRef] [PubMed]
  19. Béné, C.; Barange, M.; Subasinghe, R.; Pinstrup-Andersen, P.; Merino, G.; Hemre, G.-I.; Williams, M. Feeding 9 billion by 2050—Putting fish back on the menu. Food Secur. 2015, 7, 261–274. [Google Scholar] [CrossRef] [Green Version]
  20. Tacon, A.G.; Metian, M. Global overview on the use of fish meal and fish oil in industrially compounded aquafeeds: Trends and future prospects. Aquaculture 2008, 285, 146–158. [Google Scholar] [CrossRef]
  21. Tidwell, J.H.; Allan, G.L. Fish as food: Aquaculture’s contribution. EMBO Rep. 2001, 2, 958–963. [Google Scholar] [CrossRef] [Green Version]
  22. Smith, M.D.; Roheim, C.A.; Crowder, L.B.; Halpern, B.S.; Turnipseed, M.; Anderson, J.L.; Asche, F.; Bourillón, L.; Guttormsen, A.G.; Khan, A.; et al. Sustainability and global seafood. Science 2010, 327, 784–786. [Google Scholar] [CrossRef]
  23. Hellberg, R.S.R.; Morrissey, M.T. Advances in DNA-based techniques for the detection of seafood species substitution on the commercial market. J. Lab. Autom. 2011, 16, 308–321. [Google Scholar] [CrossRef]
  24. Hu, Y.; Huang, S.Y.; Hanner, R.; Levin, J.; Lu, X. Study of fish products in Metro Vancouver using DNA barcoding methods reveals fraudulent labeling. Food Control 2018, 94, 38–47. [Google Scholar] [CrossRef]
  25. Leal, M.C.; Pimentel, T.; Ricardo, F.; Rosa, R.; Calado, R. Seafood traceability: Current needs, available tools, and biotechnological challenges for origin certification. Trends Biotechnol. 2015, 33, 331–336. [Google Scholar] [CrossRef] [PubMed]
  26. Jacquet, J.; Pauly, D. Trade secrets: Renaming and mislabeling of seafood. Mar. Policy 2008, 32, 309–318. [Google Scholar] [CrossRef]
  27. Teletchea, F. Molecular identification methods of fish species: Reassessment and possible applications. Rev. Fish Biol. Fish. 2009, 19, 265–293. [Google Scholar] [CrossRef]
  28. Ward, R.D.; Hanner, R.; Hebert, P.D. The campaign to DNA barcode all fishes, FISH-BOL. J. Fish Biol. 2009, 74, 329–356. [Google Scholar] [CrossRef]
  29. Griffiths, A.M.; Sotelo, C.G.; Mendes, R.; Pérez-Martín, R.I.; Schröder, U.; Shorten, M.; Silva, H.; Verrez-Bagnis, V.; Mariani, S. Current methods for seafood authenticity testing in Europe: Is there a need for harmonisation? Food Control 2014, 45, 95–100. [Google Scholar] [CrossRef] [Green Version]
  30. Hallerman, E.M.; Kapuscinski, A.R. Transgenic fish and public policy: Regulatory concerns. Fisheries 1990, 15, 12–20. [Google Scholar] [CrossRef]
  31. Hooker, N.H. Food safety regulation and trade in food products. Food Policy 1999, 24, 653–668. [Google Scholar] [CrossRef]
  32. Echols, M.A. Food safety regulation in the European Union and the United States: Different cultures, different laws. Columbia J. Eur. Law 1998, 4, 525–544. [Google Scholar]
  33. D’Amico, P.; Armani, A.; Gianfaldoni, D.; Guidi, A. New provisions for the labelling of fishery and aquaculture products: Difficulties in the implementation of Regulation (EU) n. 1379/2013. Mar. Policy 2016, 71, 147–156. [Google Scholar] [CrossRef]
  34. Hofherr, J.; Martinsohn, J.; Cawthorn, D.; Rasco, B.; Naaum, A.M. Regulatory frameworks for seafood authenticity and traceability. Seaf. Authent. Traceability 2016, 47–82. [Google Scholar] [CrossRef]
  35. Nguyen, A.V.T.; Wilson, N.L. Effects of Food Safety Standards on Seafood Exports to US, EU and Japan. In Proceedings of the 2009 Annual Meeting, Atlanta, GA, USA, 31 January–3 February 2009. [Google Scholar]
  36. Regulation, E. No 1379/2013 of the European Parliament and of the Council of 11 December 2013 on the common organisation of the markets in fishery and aquaculture products, amending Council Regulations (EC) No 1184/2006 and (EC) No 1224/2009 and repealing Council Regulation (EC) No 104/2000. Off. J. Eur. Union 2013, 354, 12–14. [Google Scholar]
  37. Amigo, J.M.; Martí, I.; Gowen, A. Hyperspectral imaging and chemometrics: A perfect combination for the analysis of food structure, composition and quality. Data Handl. Sci. Technol. 2013, 28, 343–370. [Google Scholar]
  38. Brown, S.D.; Blank, T.B.; Sum, S.T.; Weyer, L.G. Chemometrics. Anal. Chem. 1994, 66, 315–359. [Google Scholar] [CrossRef] [PubMed]
  39. Kamal, M.; Karoui, R. Analytical methods coupled with chemometric tools for determining the authenticity and detecting the adulteration of dairy products: A review. Trends Food Sci. Technol. 2015, 46, 27–48. [Google Scholar] [CrossRef]
  40. Workman, J.J.; Mobley, P.R.; Kowalski, B.R.; Bro, R. Review of chemometrics applied to spectroscopy: 1985-95, Part I. Appl. Spectrosc. Rev. 1996, 31, 73–124. [Google Scholar] [CrossRef]
  41. Cozzolino, D.; Daniel, C. Foodomics and infrared spectroscopy: From compounds to functionality. Curr. Opin. Food Sci. 2015, 4, 39–43. [Google Scholar] [CrossRef]
  42. Cozzolino, D.; Murray, I. A review on the application of infrared technologies to determine and monitor composition and other quality characteristics in raw fish, fish products, and seafood. Appl. Spectrosc. Rev. 2012, 47, 207–218. [Google Scholar] [CrossRef]
  43. Cozzolino, D.; Power, A.; Chapman, J. Interpreting and reporting principal component analysis in food science analysis and beyond. Food Anal. Methods 2019, 12, 2469–2473. [Google Scholar] [CrossRef]
  44. Bro, R.; Smilde, A.K. Principal component analysis. Anal. Methods 2014, 6, 2812–2831. [Google Scholar] [CrossRef] [Green Version]
  45. Wold, S.; Esbensen, K.; Geladi, P. Principal component analysis. Chemom. Intell. Lab. Syst. 1987, 2, 37–52. [Google Scholar] [CrossRef]
  46. Defernez, M.; Kemsley, E.K. The use and misuse of chemometrics for treating classification problems. TrAC Trends Anal. Chem. 1997, 16, 216–221. [Google Scholar] [CrossRef]
  47. Szymanska, E.; Gerretzen, J.; Engel, J.; Geurts, B.; Blanchet, L.; Buydens, L.M. Chemometrics and qualitative analysis have a vibrant relationship. TrAC Trends Anal. Chem. 2015, 69, 34–51. [Google Scholar] [CrossRef]
  48. Cheng, J.; Dai, Q.; Sun, D.; Zeng, X.; Liu, D.; Pu, H.-B. Applications of non-destructive spectroscopic techniques for fish quality and safety evaluation and inspection. Trends Food Sci. Technol. 2013, 34, 18–31. [Google Scholar] [CrossRef]
  49. Ding, R.; Huang, X.; Han, F.; Dai, H.; Teye, E.; Xu, F. Rapid and nondestructive evaluation of fish freshness by near infrared reflectance spectroscopy combined with chemometrics analysis. Anal. Methods 2014, 6, 9675–9683. [Google Scholar] [CrossRef]
  50. Hernández-Martínez, D.M.; Gallardo-Velázquez, T.; Osorio-Revilla, G.; Almaraz-Abarca, N.; Castañeda-Pérez, E. Application of MIR-FTIR spectroscopy and chemometrics to the rapid prediction of fish fillet quality. CyTA-J. Food 2014, 12, 369–377. [Google Scholar] [CrossRef]
  51. Karoui, R.; Downey, G.; Blecker, C. Mid-infrared spectroscopy coupled with chemometrics: A tool for the analysis of intact food systems and the exploration of their molecular structure—Quality relationships—A review. Chem. Rev. 2010, 110, 6144–6168. [Google Scholar] [CrossRef]
  52. Weeranantanaphan, J.; Downey, G.; Allen, P.; Sun, D. A review of near infrared spectroscopy in muscle food analysis: 2005–2010. J. Near Infrared Spectrosc. 2011, 19, 61–104. [Google Scholar] [CrossRef]
  53. Liu, D.; Zeng, X.; Sun, D. NIR spectroscopy and imaging techniques for evaluation of fish quality—A review. Appl. Spectrosc. Rev. 2013, 48, 609–628. [Google Scholar] [CrossRef]
  54. Nilsen, H.A.; Esaiassen, M.; Heia, K.; Sigernes, F. Visible/near-infrared spectroscopy: A new tool for the evaluation of fish freshness? J. Food Sci. 2002, 67, 1821–1826. [Google Scholar] [CrossRef]
  55. Nilsen, H.A.; Heia, K. VIS/NIR spectroscopy. Fish. Prod. 2009, 2009, 89–104. [Google Scholar] [CrossRef]
  56. Ellis, D.I.; Eccles, R.; Xu, Y.; Griffen, J.; Muhamadali, H.; Matousek, P.; Goodall, I.; Goodacre, R. Through-container, extremely low concentration detection of multiple chemical markers of counterfeit alcohol using a handheld SORS device. Sci. Rep. 2017, 7, 12082. [Google Scholar] [CrossRef]
  57. Zheng, J.; He, L. Surface-enhanced raman spectroscopy for the chemical analysis of food. Compr. Rev. Food Sci. Food Saf. 2014, 13, 317–328. [Google Scholar] [CrossRef]
  58. Ellis, D.I.; Muhamadali, H.; Haughey, S.A.; Elliott Ch, T.; Goodacre, R. Point-and-shoot: Rapid quantitative detection methods for on-site food fraud analysis—Moving out of the laboratory and into the food supply chain. Anal. Methods 2015, 7, 9401–9414. [Google Scholar] [CrossRef] [Green Version]
  59. Ozaki, Y.; Sasic, S. Introduction to raman spectroscopy. In Pharmaceutical Applications of Raman Spectroscopy; Sasic, S., Ed.; John Wiley and Sons: Hoboken, NJ, USA, 2007; pp. 1–28. [Google Scholar]
  60. Alamprese, C.; Casiraghi, E. Application of FT-NIR and FT-IR spectroscopy to fish fillet authentication. LWT Food Sci. Technol. 2015, 63, 720–725. [Google Scholar] [CrossRef]
  61. Esslinger, S.; Riedl, J.; Fauhl-Hassek, C. Potential and limitations of non-targeted fingerprinting for authentication of food in official control. Food Res. Int. 2014, 60, 189–204. [Google Scholar] [CrossRef]
  62. McGrath, T.F.; Haughey, S.; Patterson, J.; Fauhl-Hassek, C.; Donarski, J.; Alewijn, M.; Van Ruth, S.M.; Elliott, C.T. What are the scientific challenges in moving from targeted to non-targeted methods for food fraud testing and how can they be addressed?—Spectroscopy case study. Trends Food Sci. Technol. 2018, 76, 38–55. [Google Scholar] [CrossRef]
  63. Buck, E.H. Seafood Marketing: Combating Fraud and Deception 2007; Congressional Research Service; Library of Congress: Washington, DC, USA, 2007. [Google Scholar]
  64. Cawthorn, D.-M.; Steinman, H.A.; Hoffman, L.C. A high incidence of species substitution and mislabelling detected in meat products sold in South Africa. Food Control 2013, 32, 440–449. [Google Scholar] [CrossRef] [Green Version]
  65. Everstine, K.; Spink, J.; Kennedy, S. Economically Motivated Adulteration (EMA) of food: Common characteristics of EMA incidents. J. Food Prot. 2013, 76, 723–735. [Google Scholar] [CrossRef]
  66. Reilly, A. Overview of food fraud in the fisheries sector. FAO Fish. Aquac. Circ. 2018, C1165, I-21. [Google Scholar]
  67. Gayo, J. Species Authenticity and Detection of Economic Adulteration of Atlantic Blue Crab Meat Using VIS/NIR Spectroscopy. Ph.D. Thesis, North Carolina State University, Raleigh, NC, USA, 2006. [Google Scholar]
  68. Gayo, J.; Hale, S.A. Detection and quantification of species authenticity and adulteration in crabmeat using visible and near-infrared spectroscopy. J. Agric. Food Chem. 2007, 55, 585–592. [Google Scholar] [CrossRef] [PubMed]
  69. Gayo, J.; Hale, S.A.; Blanchard, S.M. Quantitative analysis and detection of adulteration in crab meat using visible and near-infrared spectroscopy. J. Agric. Food Chem. 2006, 54, 1130–1136. [Google Scholar] [CrossRef] [PubMed]
  70. Brodersen, K.; Bremner, H. Exploration of the use of NIR reflectance spectroscopy to distinguish and measure attributes of conditioned and cooked shrimp (Pandalus borealis). LWT Food Sci. Technol. 2001, 34, 533–541. [Google Scholar] [CrossRef]
  71. Qu, J.-H.; Cheng, J.; Sun, D.; Pu, H.; Wang, Q.-J.; Ma, J. Discrimination of shelled shrimp (Metapenaeus ensis) among fresh, frozen-thawed and cold-stored by hyperspectral imaging technique. LWT Food Sci. Technol. 2015, 62, 202–209. [Google Scholar] [CrossRef]
  72. Wu, D.; Shi, H.; He, Y.; Yu, X.; Bao, Y. Potential of hyperspectral imaging and multivariate analysis for rapid and non-invasive detection of gelatin adulteration in prawn. J. Food Eng. 2013, 119, 680–686. [Google Scholar] [CrossRef]
  73. Ottavian, M.; Facco, P.; Fasolatoa, L.; Novelli, E.; Mirisola, M.; Perini, M.; Barolo, M. Use of near-infrared spectroscopy for fast fraud detection in seafood: Application to the authentication of wild European Sea Bass (Dicentrarchus labrax). J. Agric. Food Chem. 2012, 60, 639–648. [Google Scholar] [CrossRef]
  74. Lv, H.; Xu, W.; You, J.; Xiong, S. Classification of freshwater fish species by linear discriminant analysis based on near infrared reflectance spectroscopy. J. Near Infrared Spectrosc. 2017, 25, 54–62. [Google Scholar] [CrossRef]
  75. Grassi, S.; Casiraghi, E.; Alamprese, C. Handheld NIR device: A non-targeted approach to assess authenticity of fish fillets and patties. Food Chem. 2018, 243, 382–388. [Google Scholar] [CrossRef]
  76. O’Brien, N.; Hulse, C.A.; Pfeifer, F.; Siesler, H.W. Near infrared spectroscopic authentication of seafood. J. Near Infrared Spectrosc. 2013, 21, 299–305. [Google Scholar] [CrossRef] [Green Version]
  77. Wu, T.; Zhong, N.; Yang, L. Identification of adulterated and non-adulterated norwegian salmon using FTIR and an improved PLS-DA method. Food Anal. Methods 2017, 11, 1501–1509. [Google Scholar] [CrossRef]
  78. Ramirez, D.A.; Pezoa, J.E.E. Spectral vision system for discriminating small pelagic species caught by small-scale fishing. In Proceedings of the Conference on Infrared Sensors, Devices, and Applications VIII, San Diego, CA, USA, 22–23 August 2018. [Google Scholar]
  79. Rašković, B.; Heinke, R.; Rösch, P.; Popp, J. The potential of Raman spectroscopy for the classification of fish fillets. Food Anal. Methods 2015, 9, 1301–1306. [Google Scholar] [CrossRef]
  80. Dai, Q.; Cheng, J.; Sun, D.; Pu, H.; Zeng, X.; Xiong, Z. Potential of visible/near-infrared hyperspectral imaging for rapid detection of freshness in unfrozen and frozen prawns. J. Food Eng. 2015, 149, 97–104. [Google Scholar] [CrossRef]
  81. Zhou, J.; Wu, X.; Chen, Z.; You, J.; Xiong, S. Evaluation of freshness in freshwater fish based on near infrared reflectance spectroscopy and chemometrics. LWT 2019, 106, 145–150. [Google Scholar] [CrossRef]
  82. Saraiva, C.; Vasconcelos, H.; De Almeida, J. A chemometrics approach applied to Fourier transform infrared spectroscopy (FTIR) for monitoring the spoilage of fresh salmon (Salmo salar) stored under modified atmospheres. Int. J. Food Microbiol. 2017, 241, 331–339. [Google Scholar] [CrossRef] [PubMed]
  83. Washburn, N.K.; Stormo, S.K.; Skjelvareid, M.H.; Hei, K. On-invasive assessment of packaged cod freeze-thaw history by hyperspectral imaging. J. Eng. 2017, 205, 64–73. [Google Scholar] [CrossRef]
  84. Zhu, F.; Zhang, D.; He, Y.; Liu, F.; Sun, D.-W. Application of visible and near infrared hyperspectral imaging to differentiate between fresh and frozen–thawed fish fillets. Food Bioprocess Technol. 2013, 6, 2931–2937. [Google Scholar] [CrossRef]
  85. Zhang, H.-L.; Chu, B.-Q.; Ye, Q.; Liu, X.-M.; Luo, W. Classification of Fishness Based on Hyperspectra. Imaging Technol. Spectrosc. Spectr. Anal. 2018, 38, 559–563. [Google Scholar]
  86. He, H.-J.; Wu, D.; Sun, D.-W. Nondestructive spectroscopic and imaging techniques for quality evaluation and assessment of fish and fish products. Crit. Rev. Food Sci. Nutr. 2015, 55, 864–886. [Google Scholar] [CrossRef]
  87. Velioğlua, H.M.; Temiz, H.T.; Boyaci, I.H. Differentiation of fresh and frozen-thawed fish samples using Raman spectroscopy coupled with chemometric analysis. Food Chem. 2015, 172, 283–290. [Google Scholar] [CrossRef]
  88. Bateman, T.S.; Mann, M.E. The supply of climate leaders must grow. Nat. Clim. Chang. 2016, 6, 1052–1054. [Google Scholar] [CrossRef]
Figure 1. An illustration of the application of principal component analysis combined to vibrational spectroscopy to identify the origin of seafood.
Applsci 10 04150 g001
Figure 2. Fish and seafood authenticity, traceability and provenance. The combination of chemometrics and vibrational spectroscopy. What is the right question to ask?
Applsci 10 04150 g002

