Evaluation and Monitoring of Slope Stability in Cold Region: Case Study of Man-Made Slope at Øysand, Norway
Abstract
1. Introduction
2. Site Investigations and Laboratory Tests
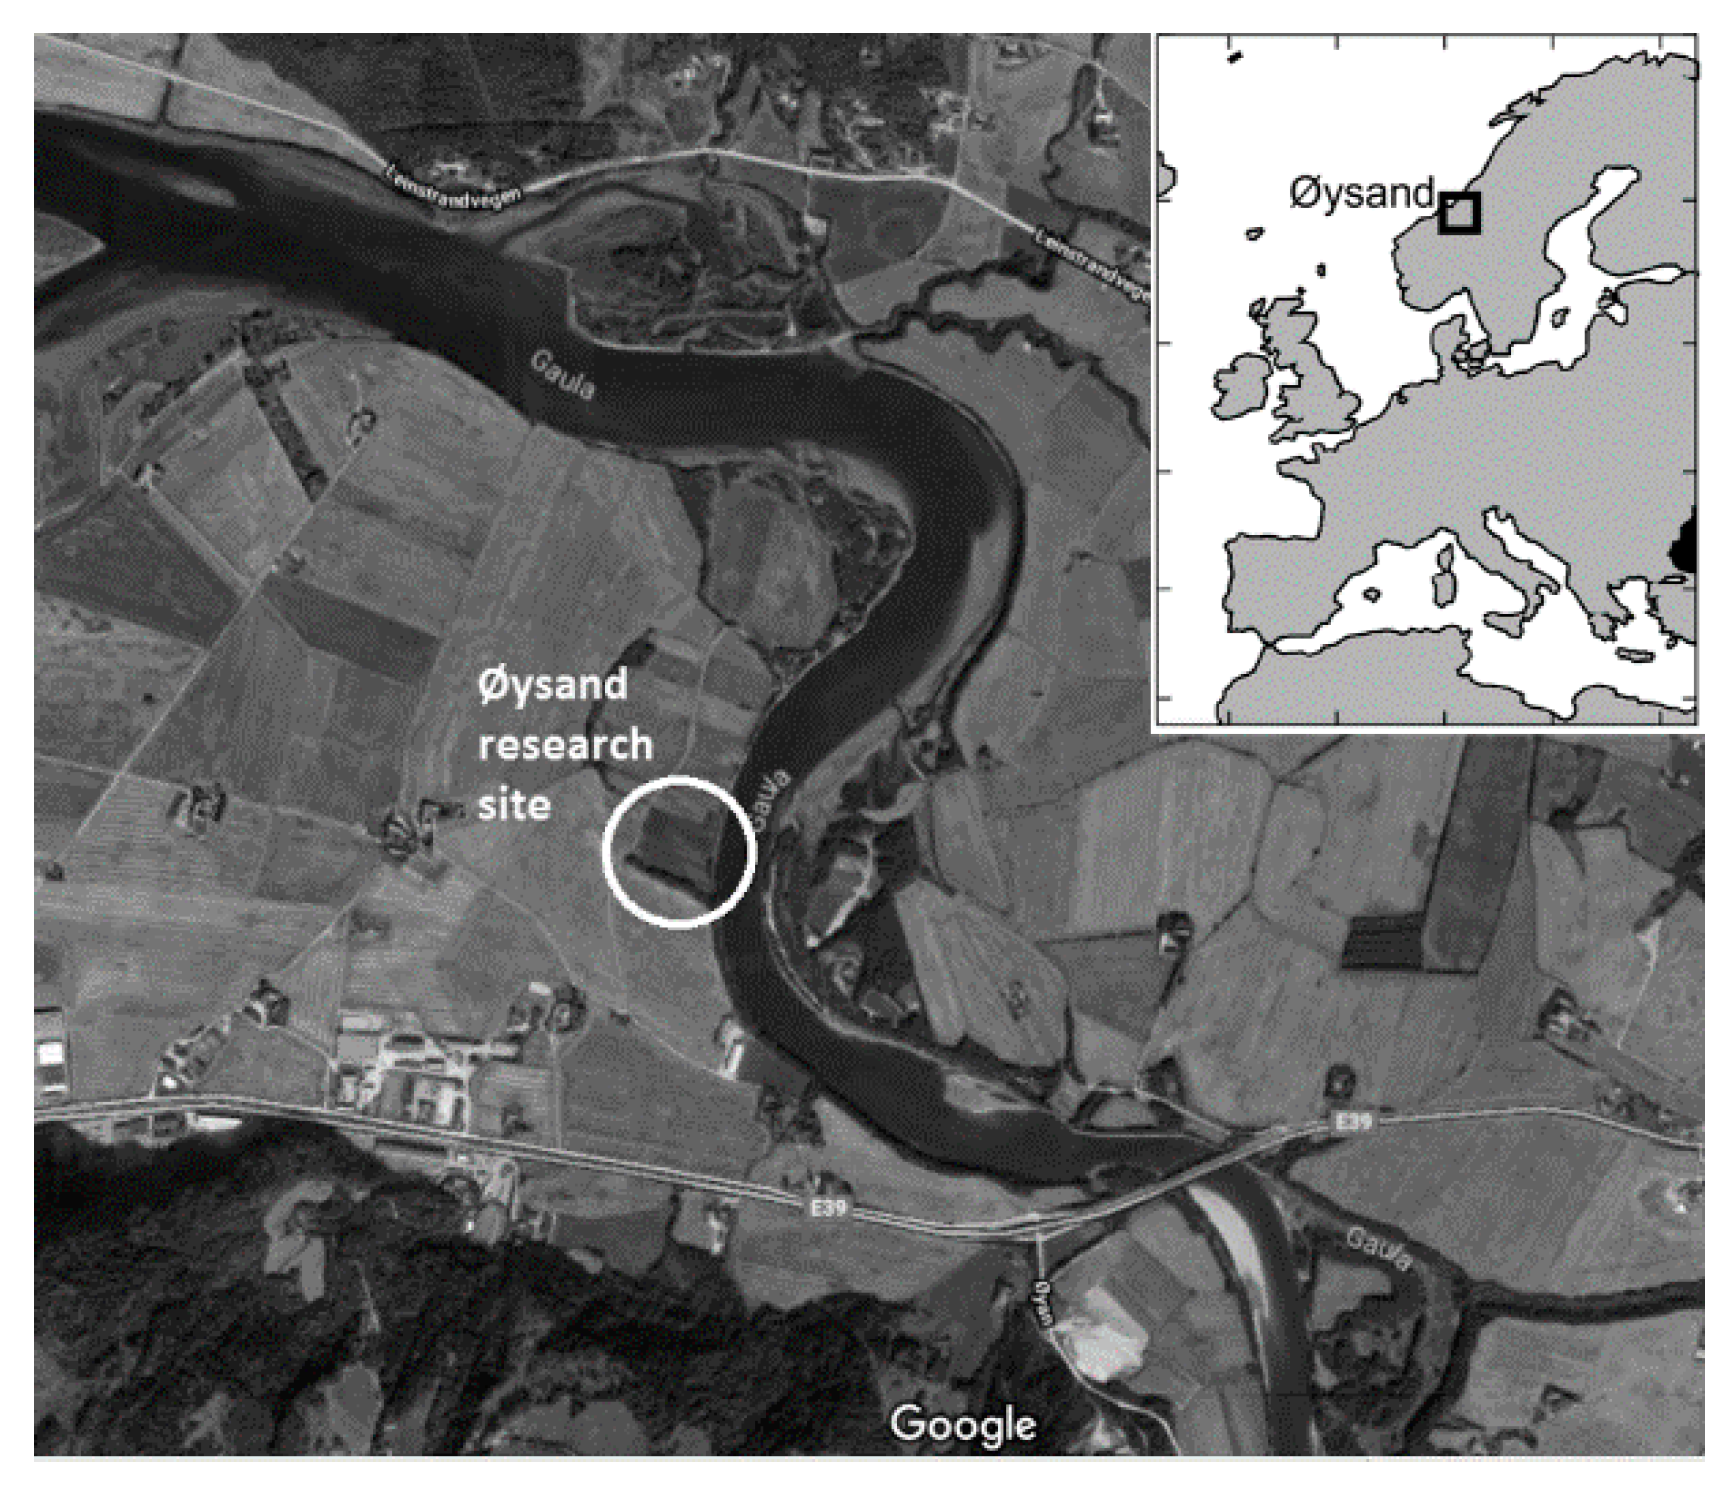
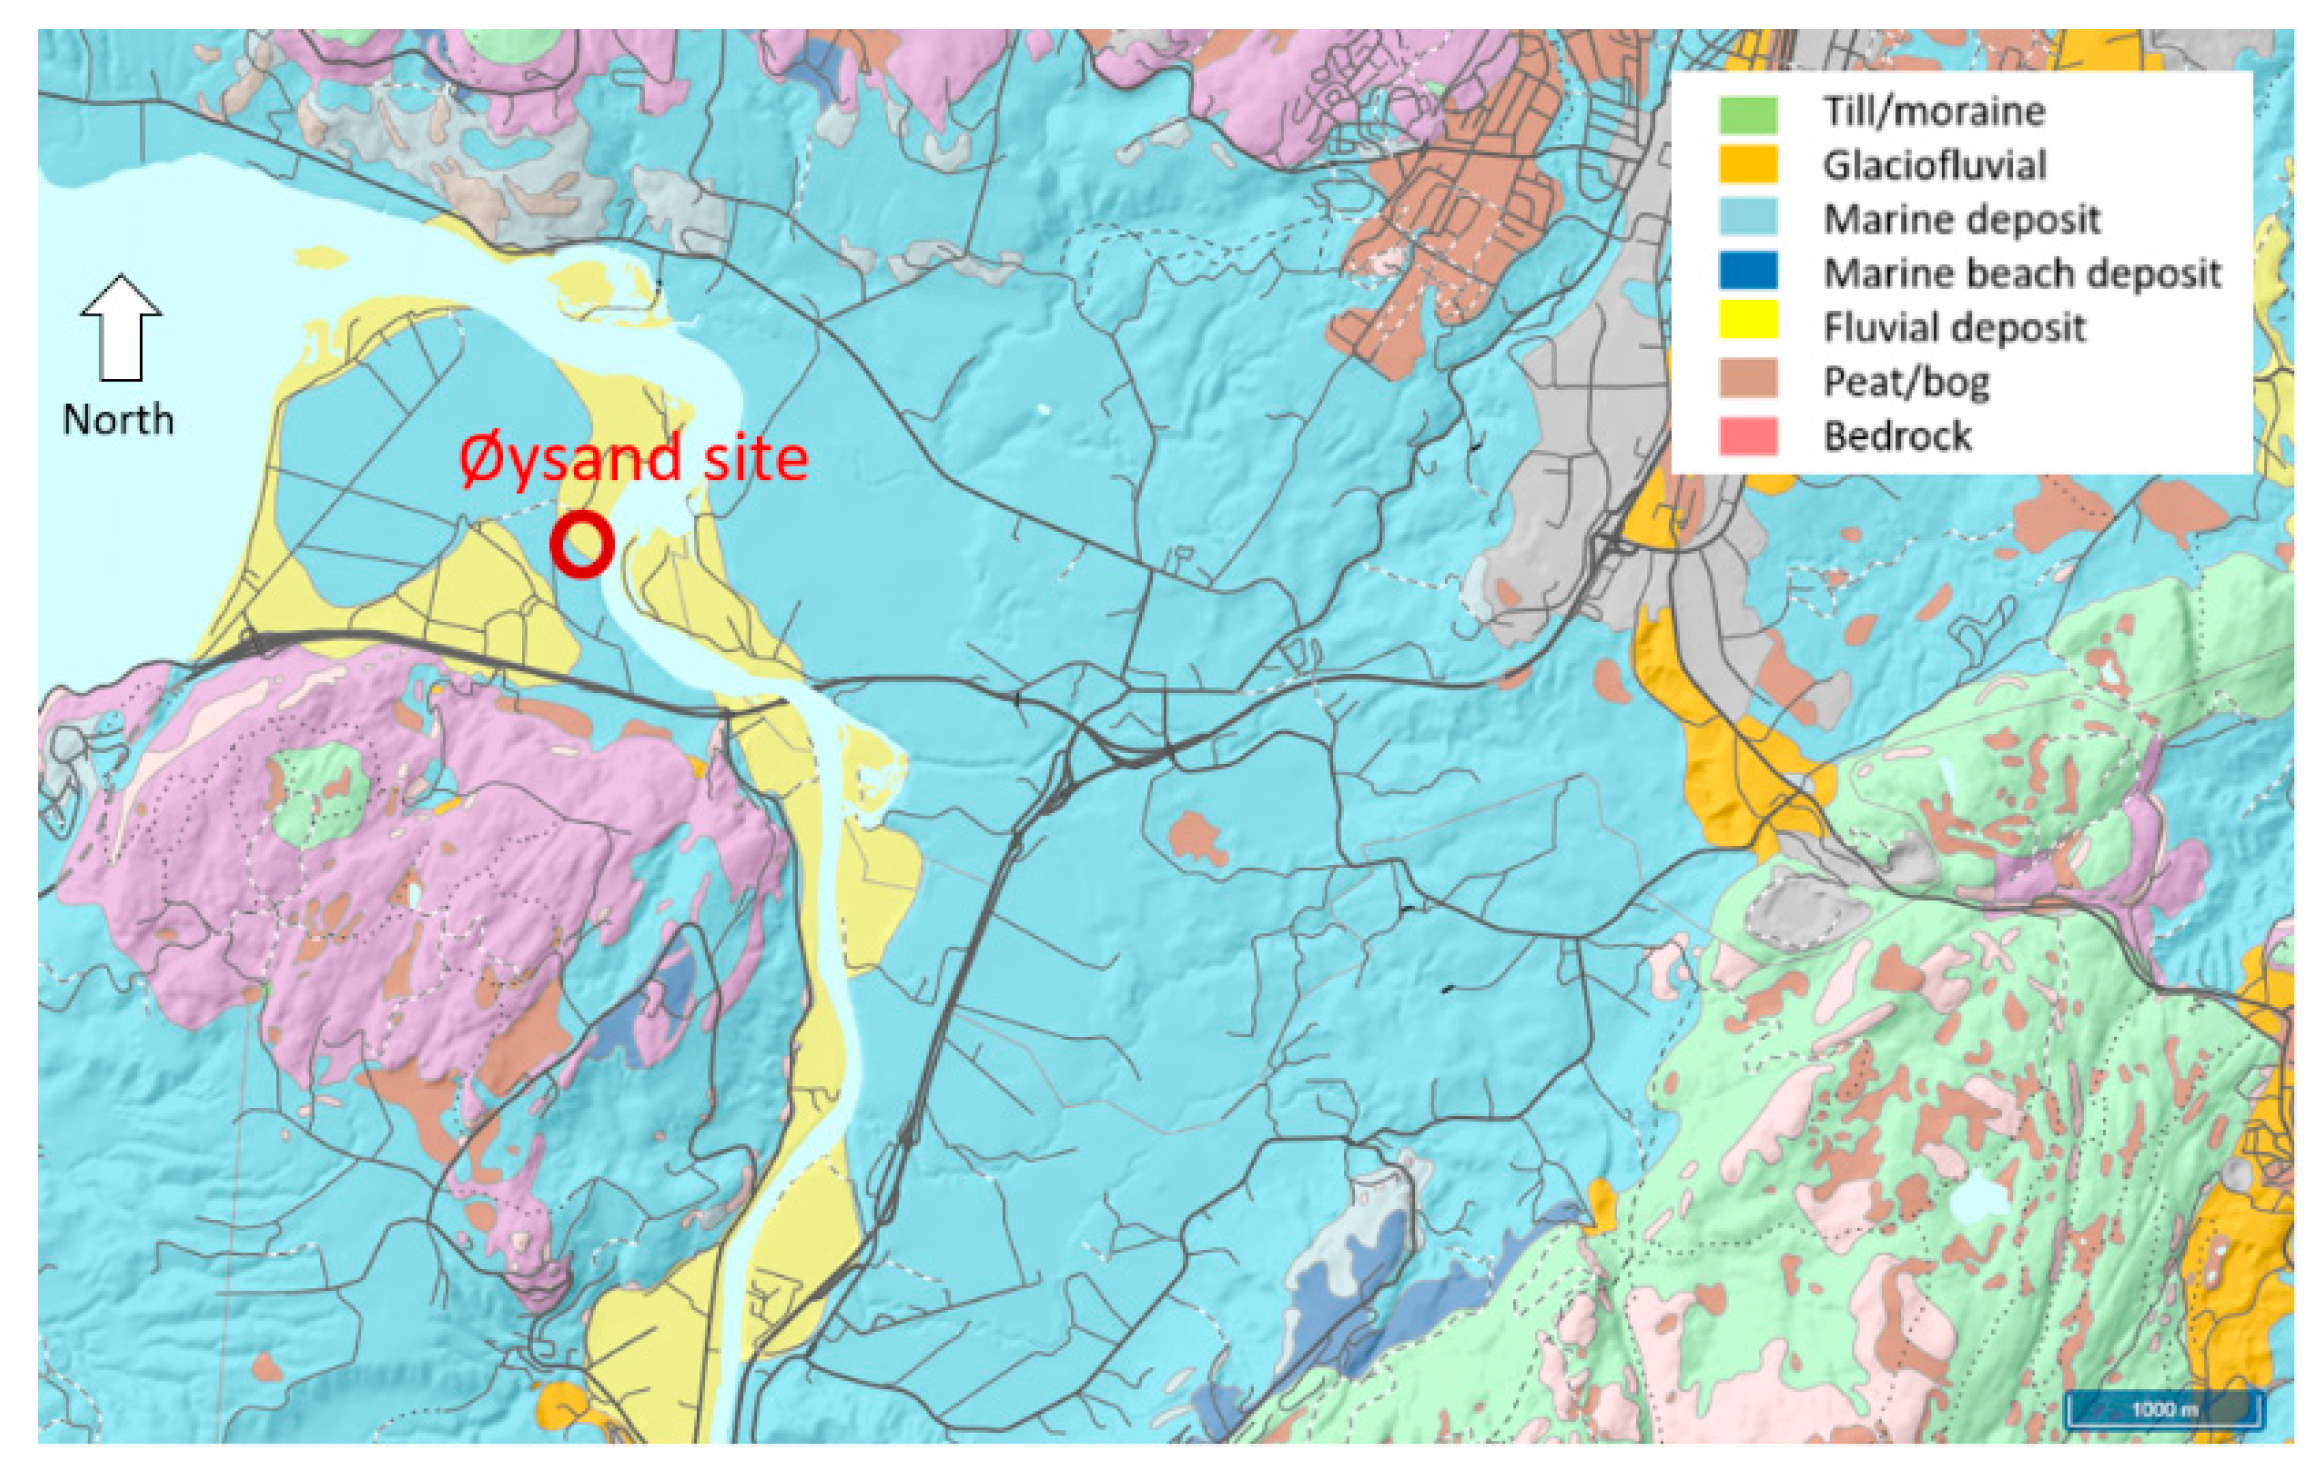
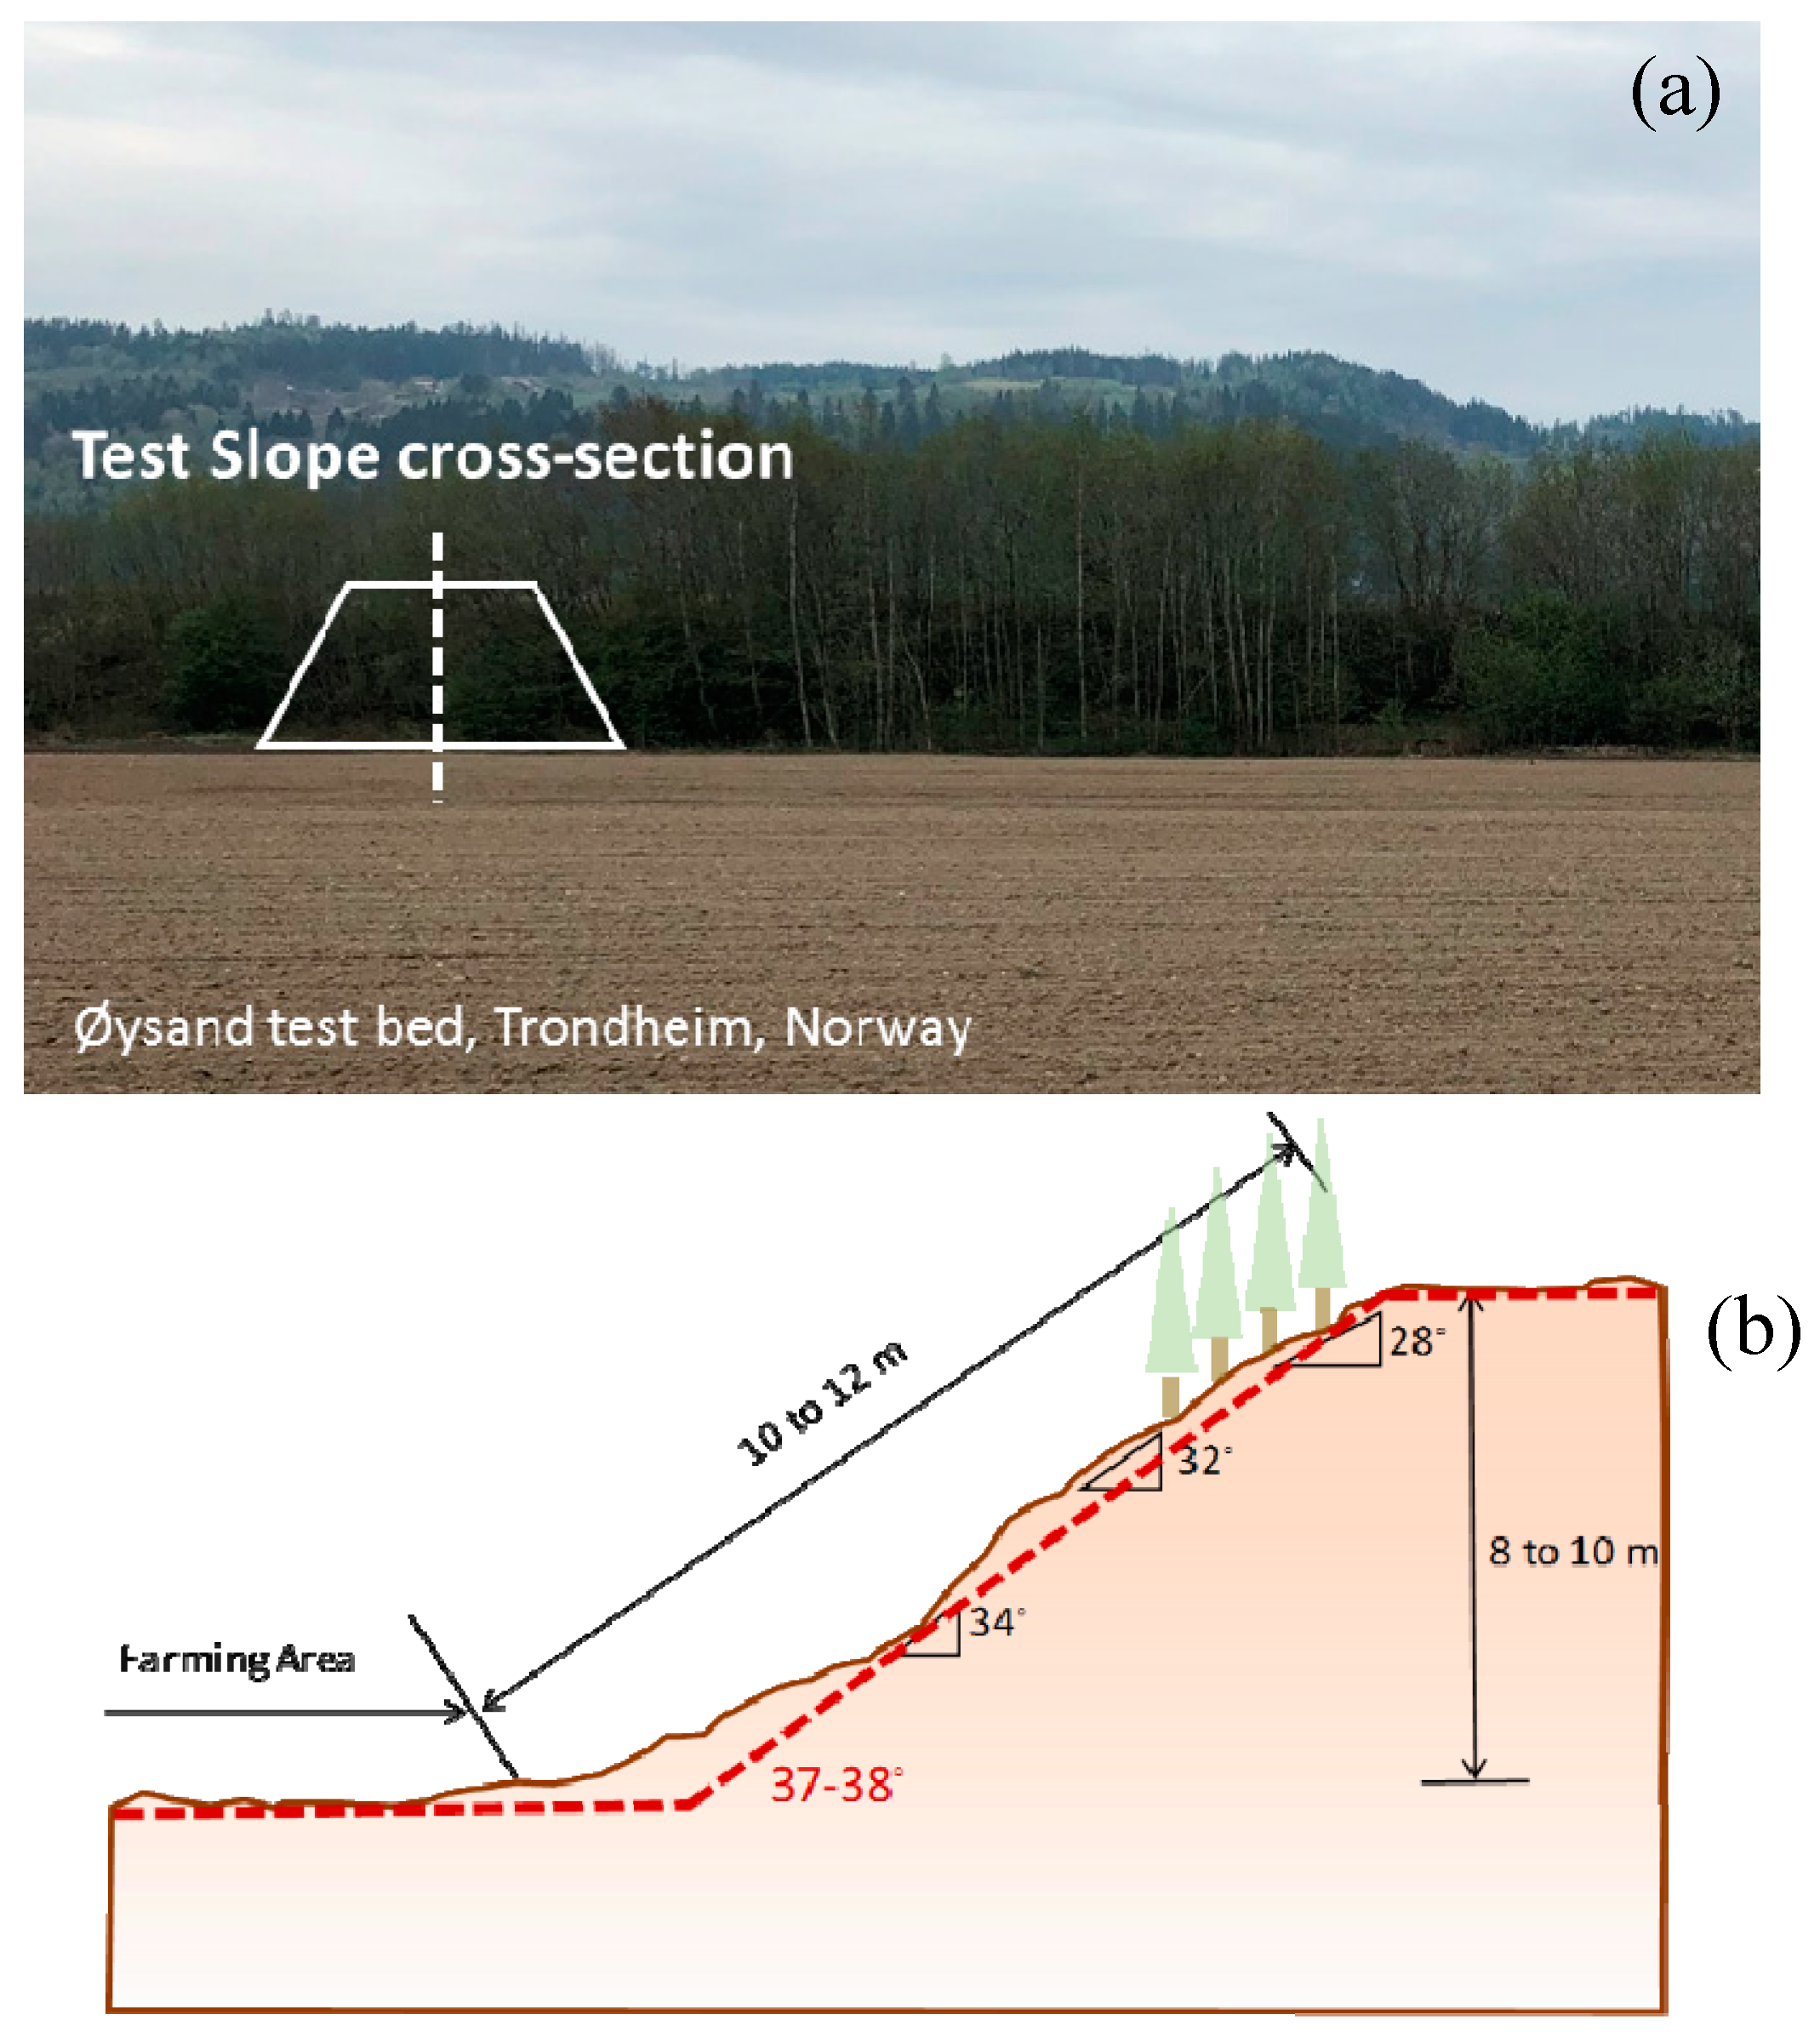
2.1. Ø. Ysand Test Site
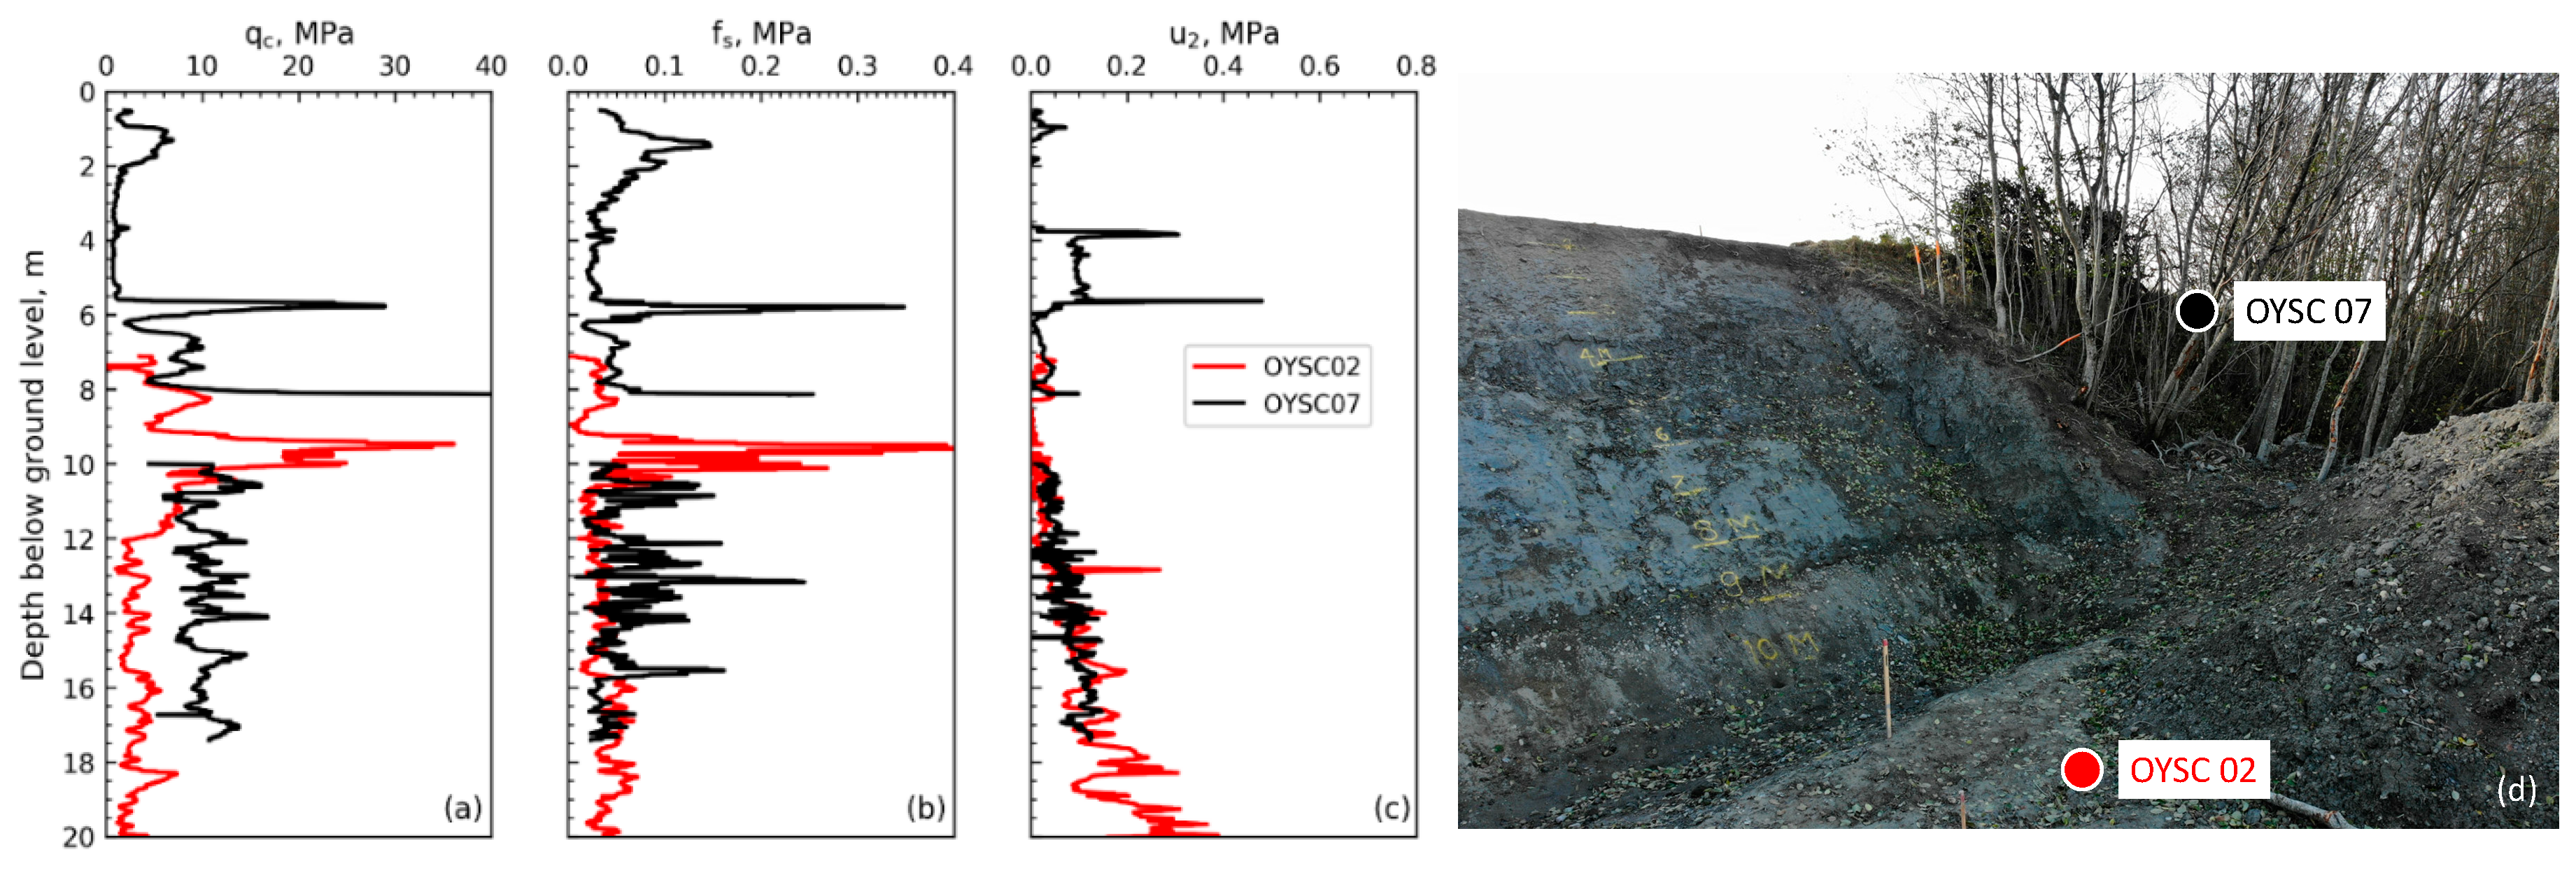
2.2. Geotechnical Investigation
2.3. Laboratory Testing
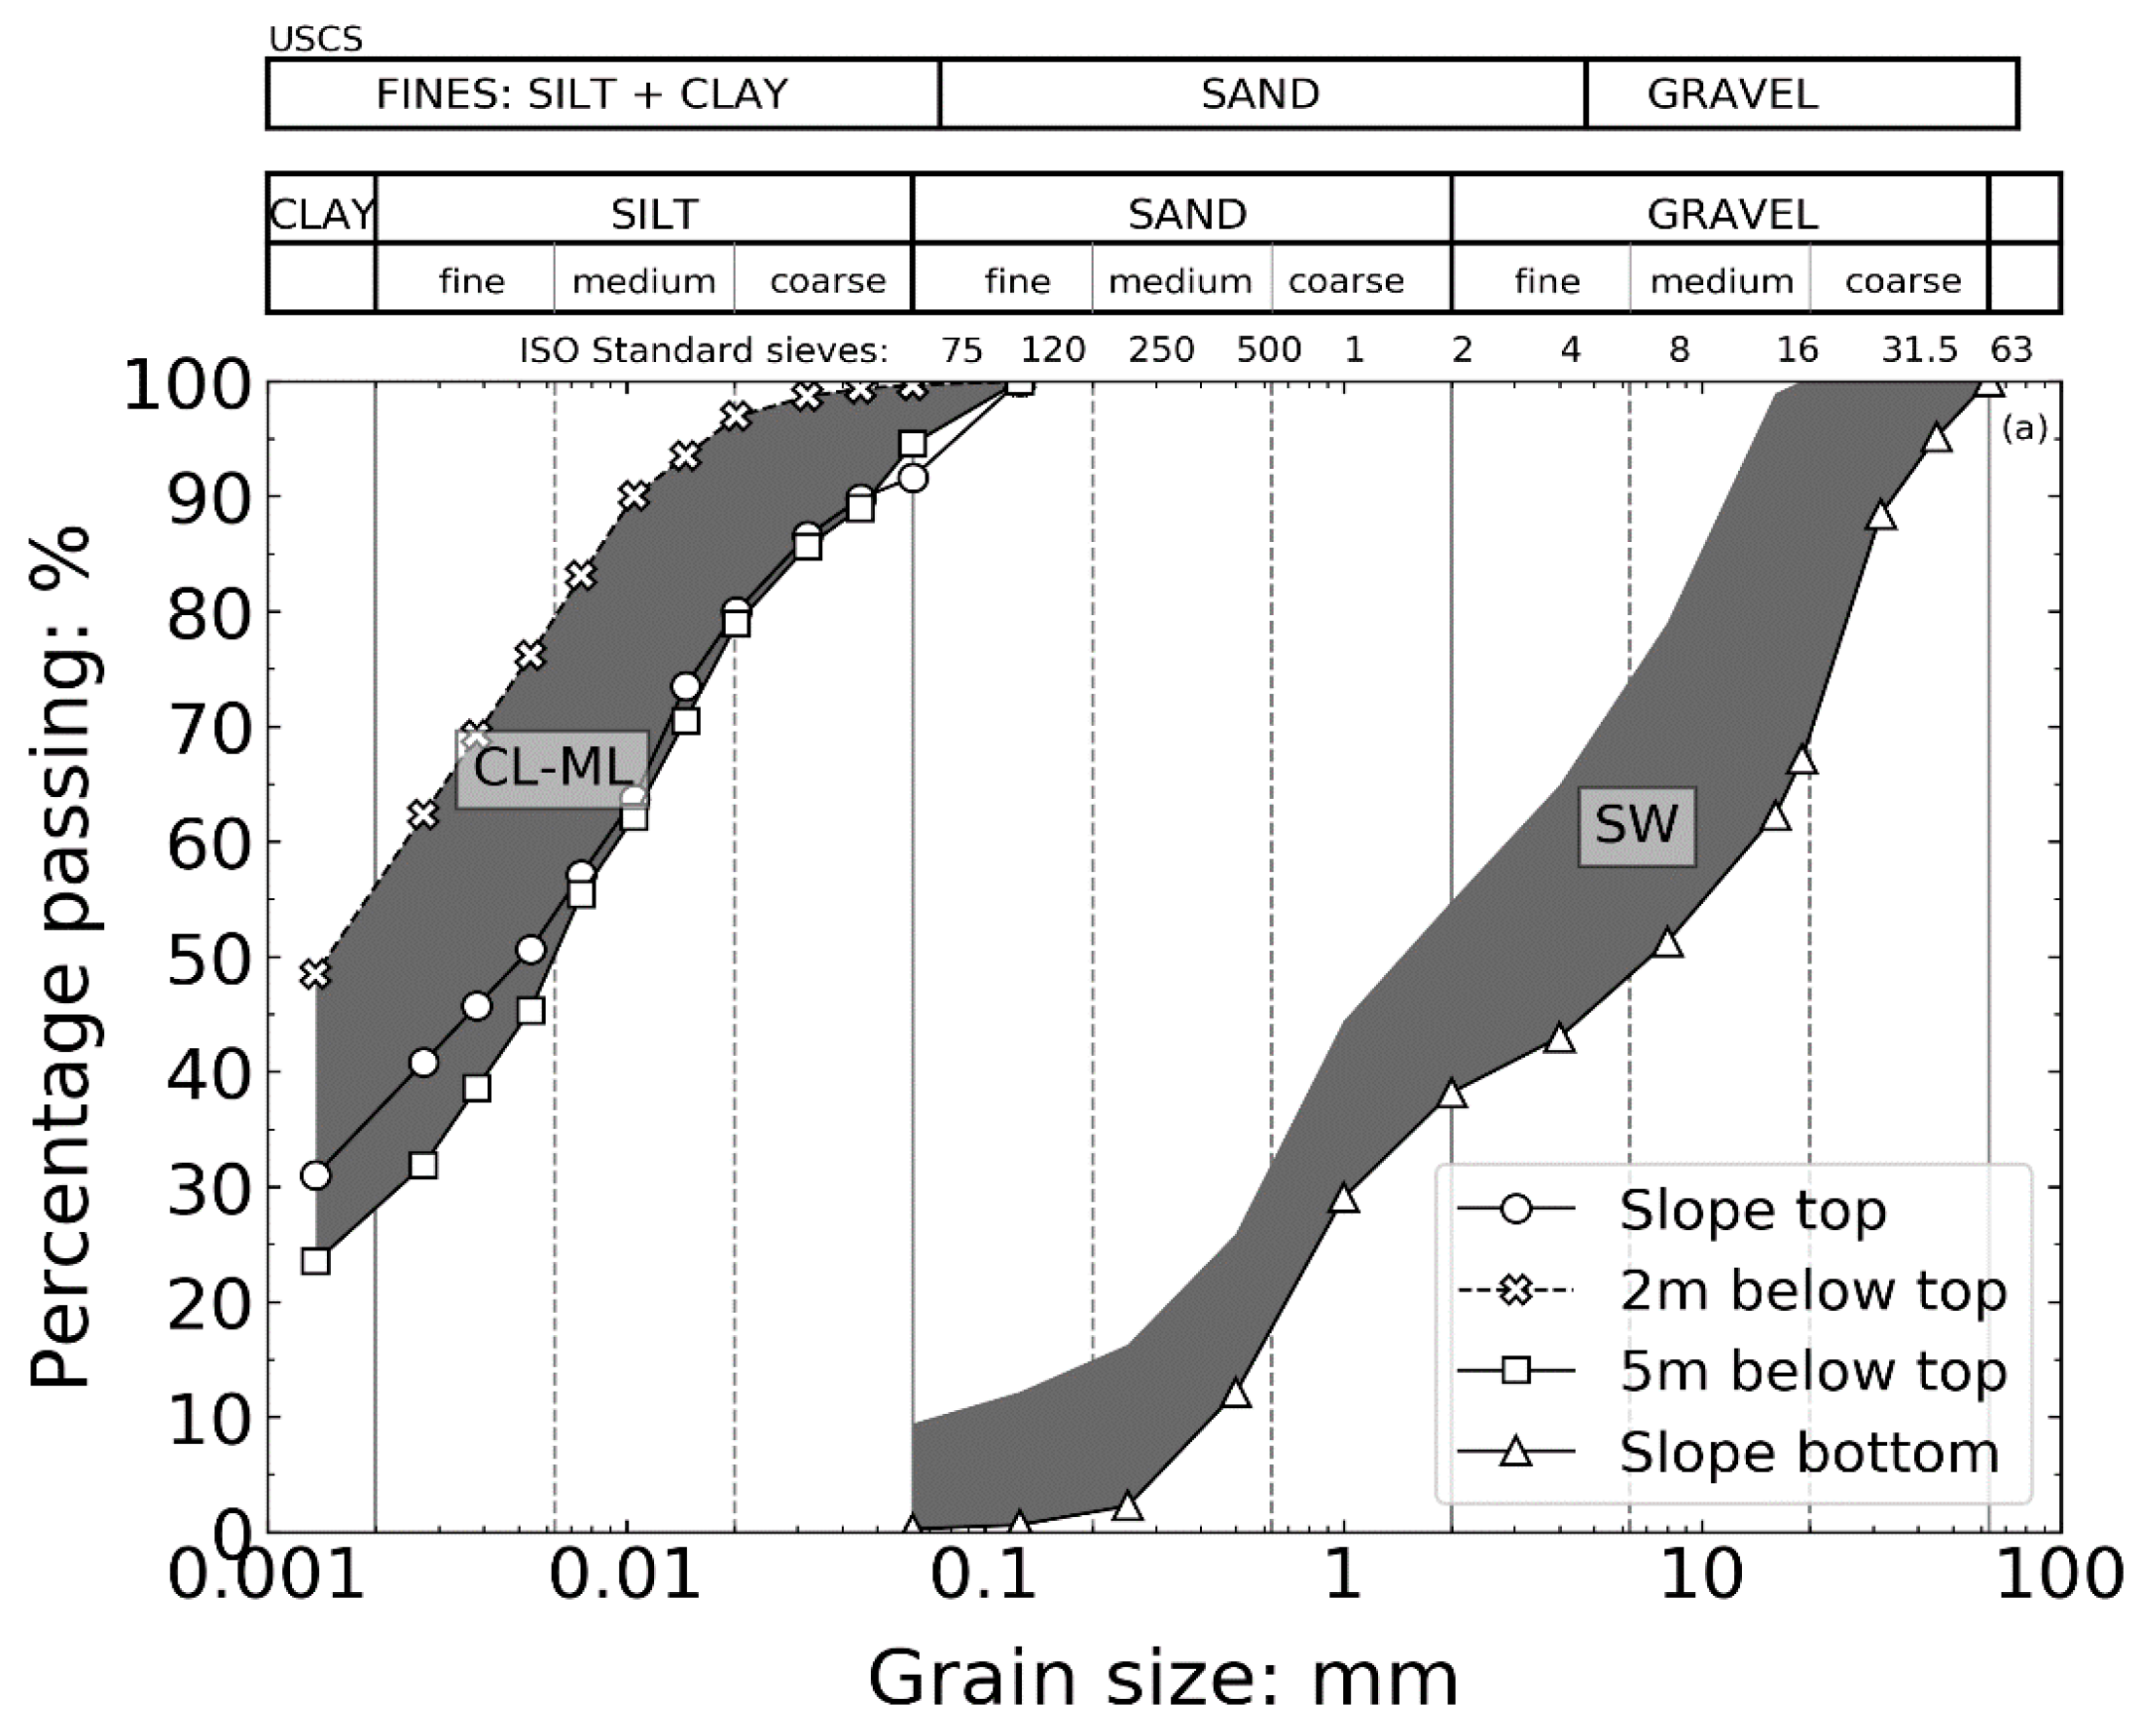
2.3.1. Grain size Distribution
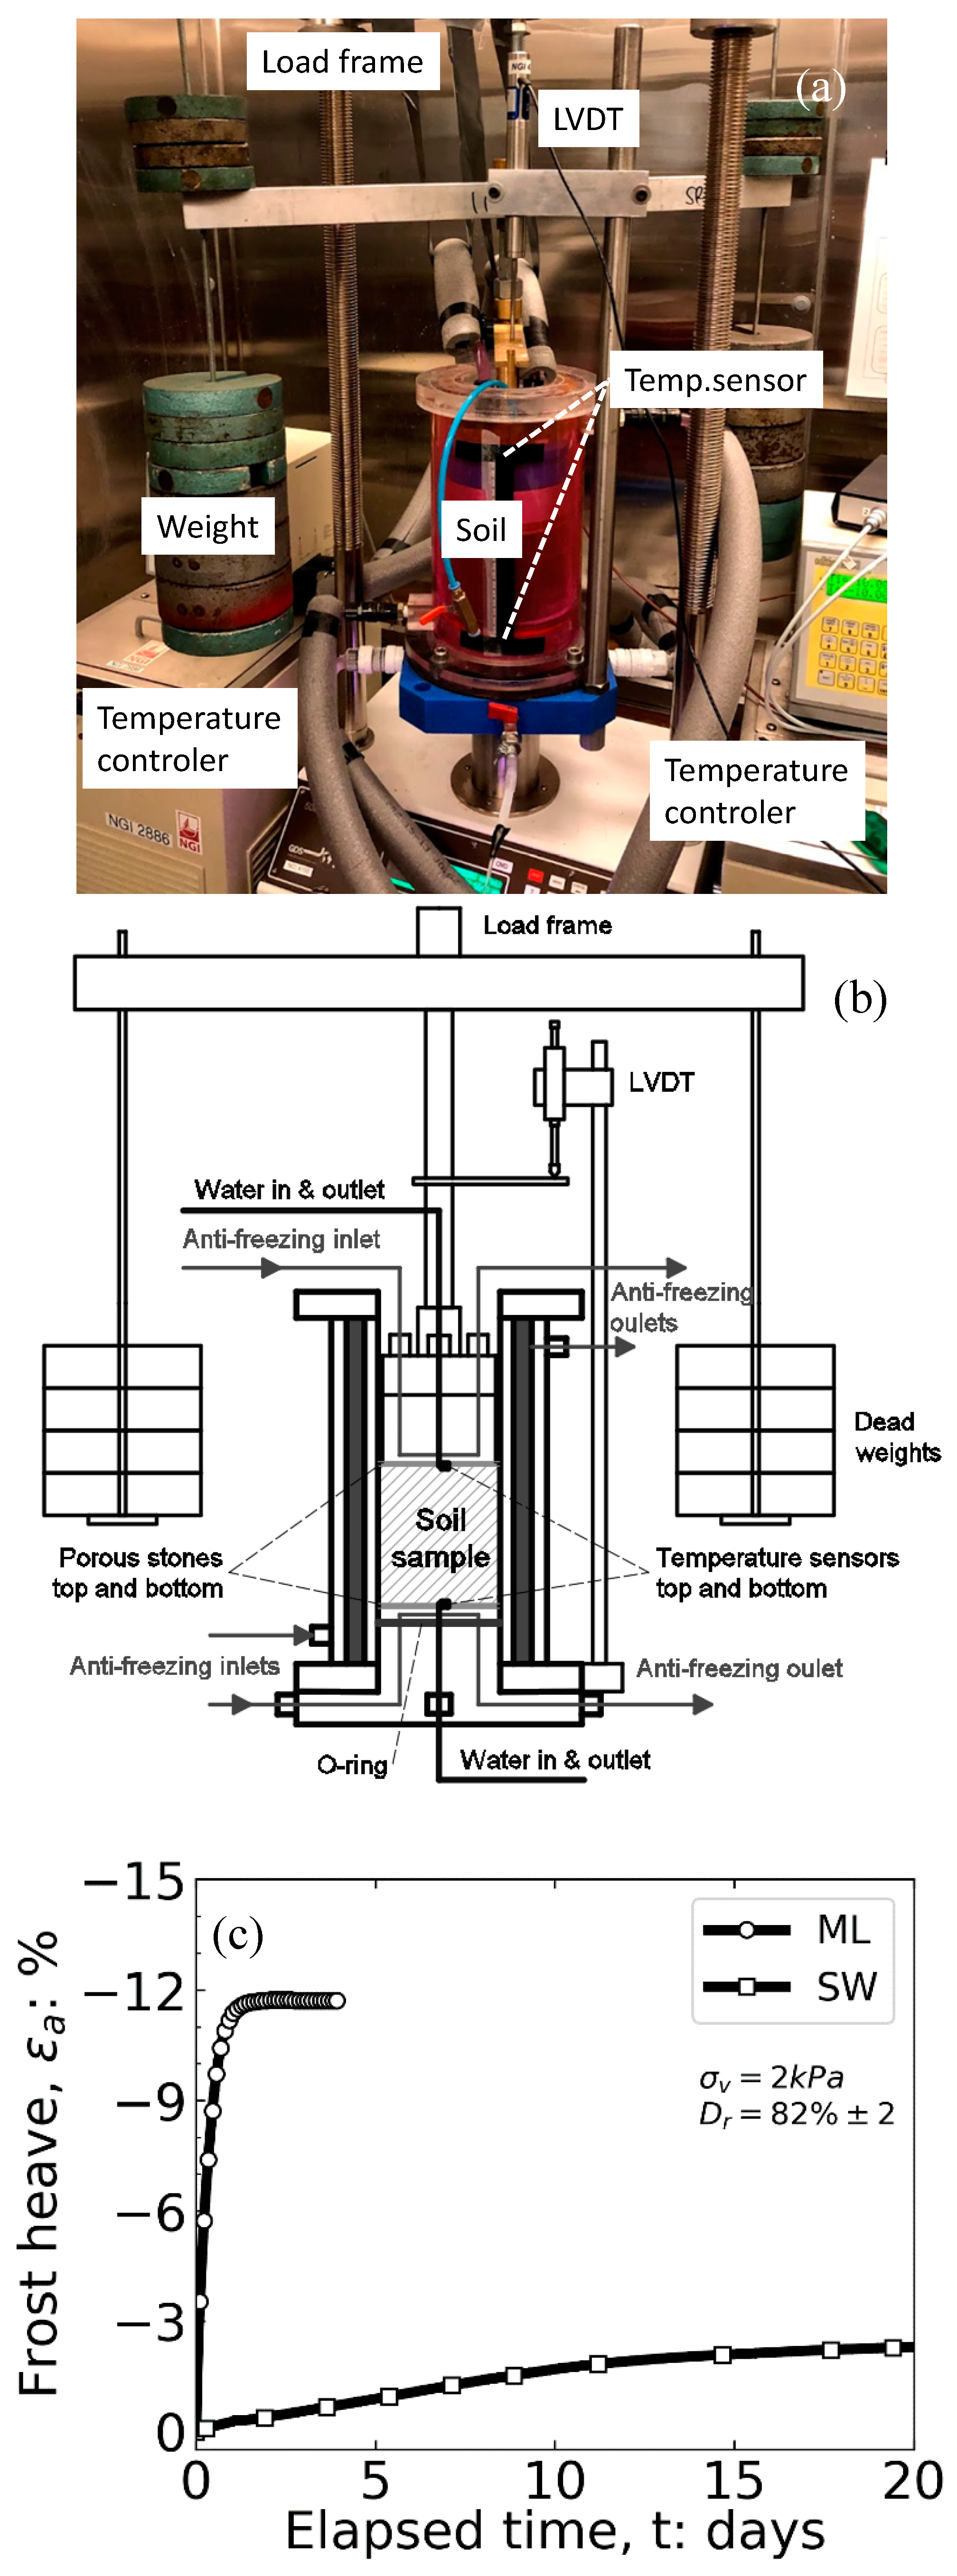
2.3.2. Frost Heave Testing
3. Methods of Slope Stability
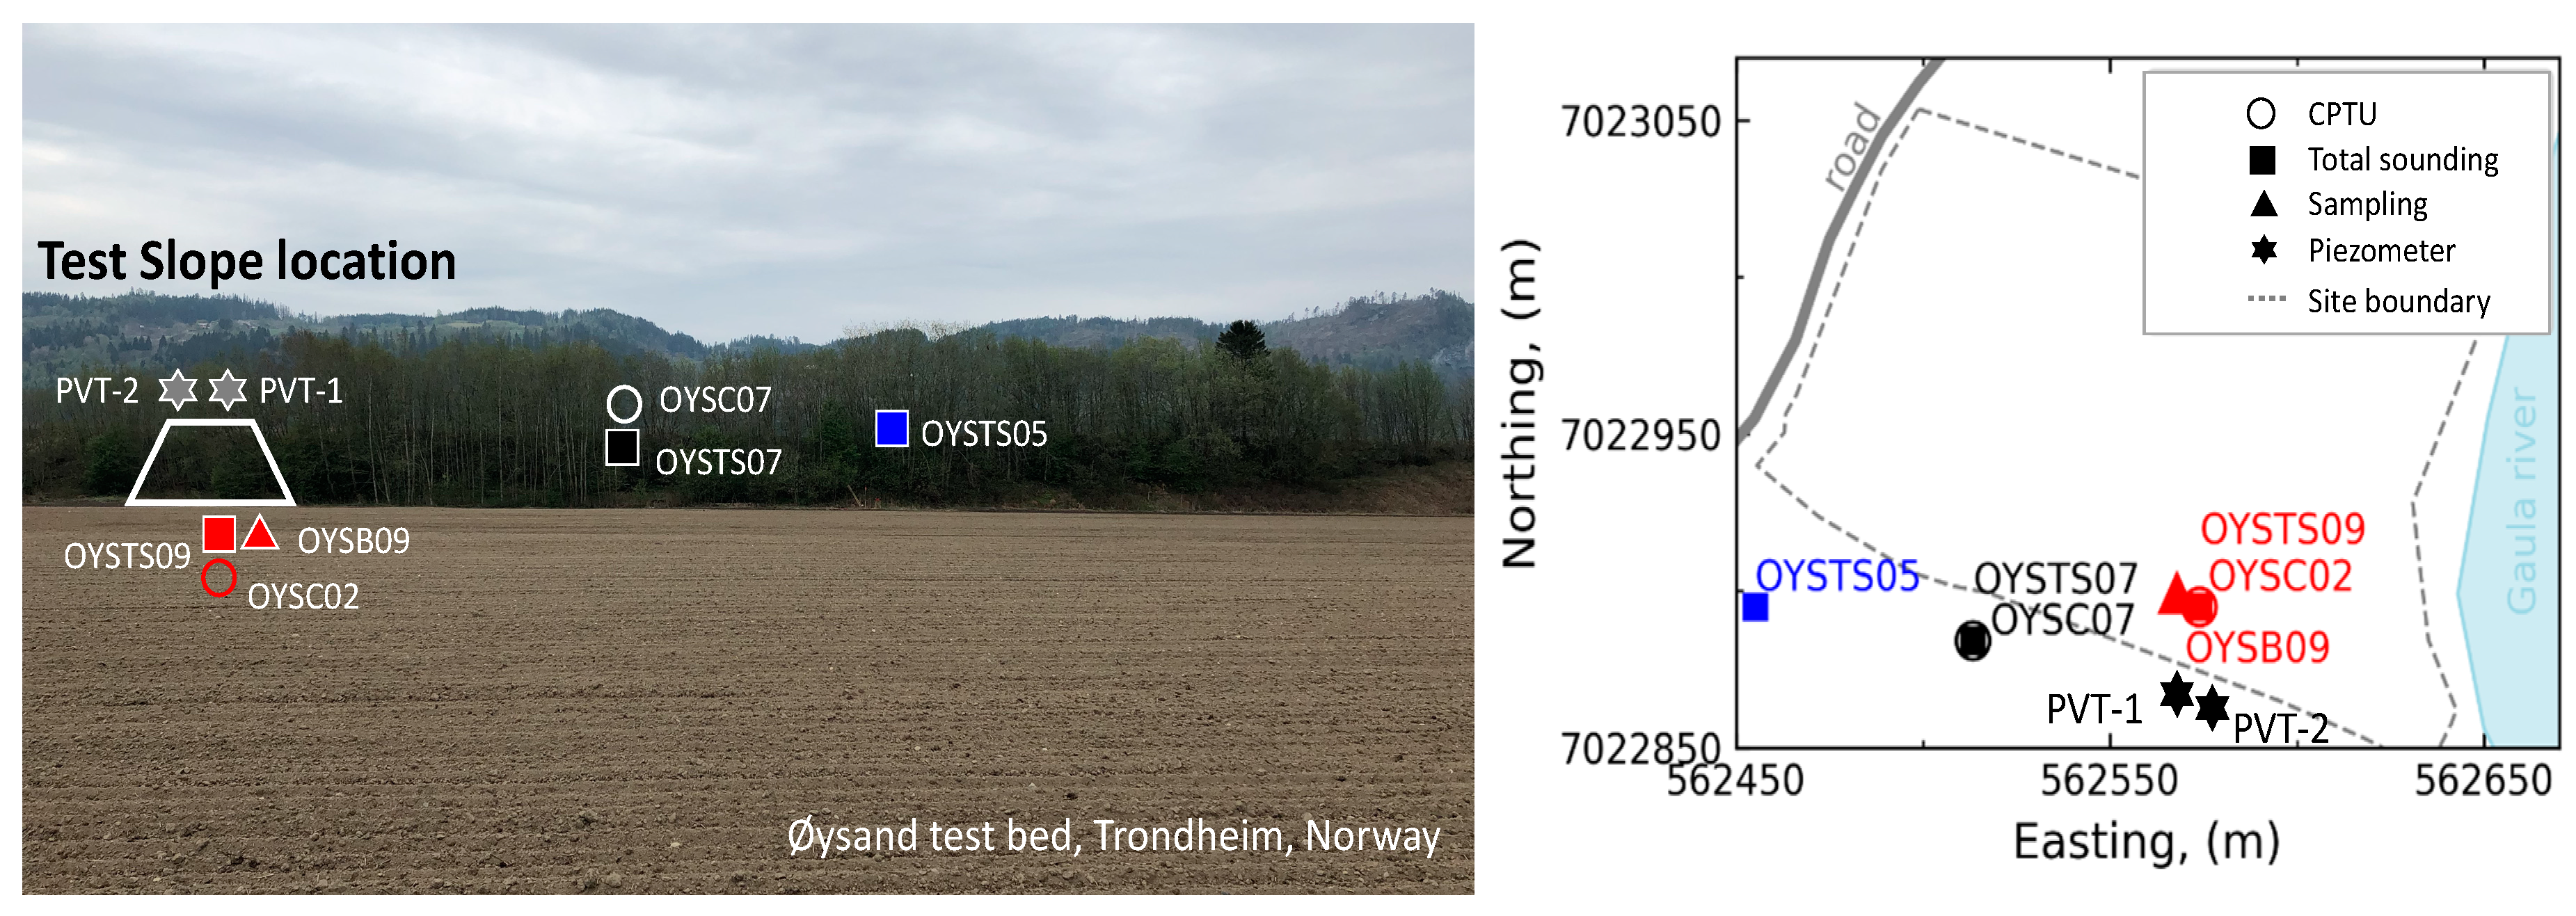
3.1. Slope Location
3.2. Input Parameters
3.2.1. Methodology
3.2.2. Geometry and Boundary Conditions
3.2.3. Soil Parameters
3.3. Parametric Study
4. Results: Monitoring and Slope Stability
4.1. Site Preparation and Sensor Planning
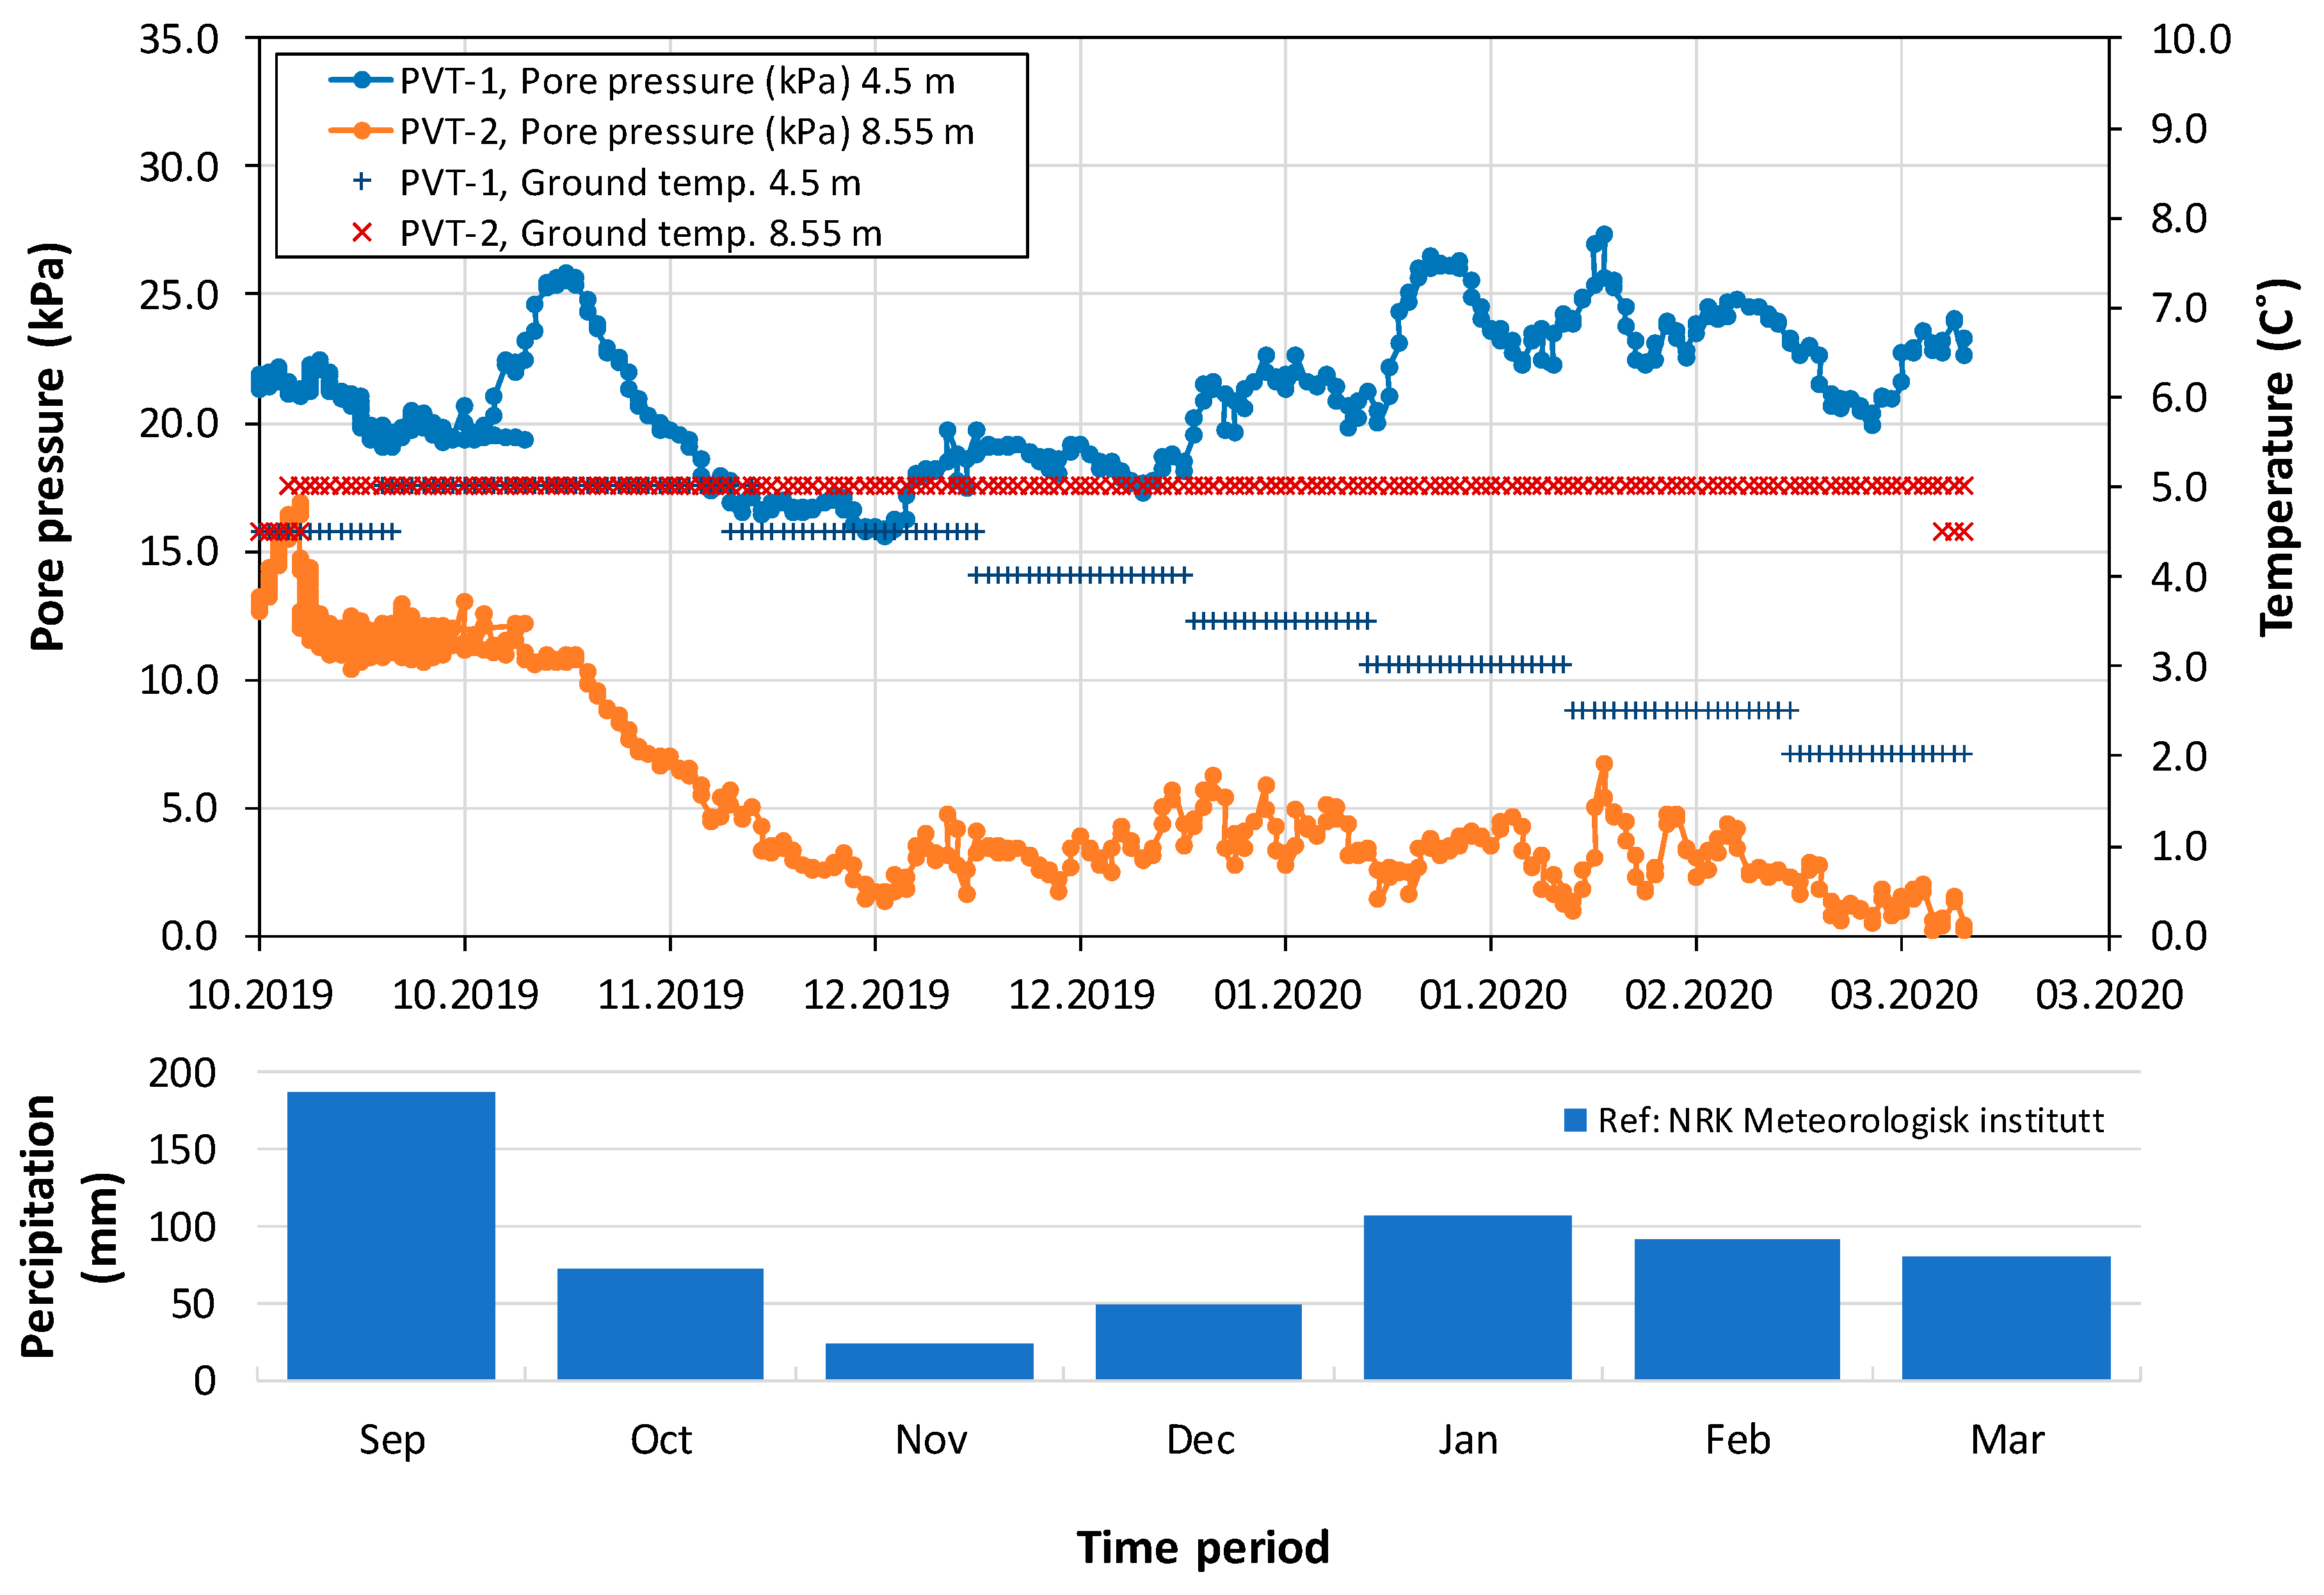
4.2. Measured Data
4.3. Slope Stability with Measured Data
5. Summary and Conclusions
- Measured pore water pressure underground increases proportionally to the decrease of ground temperature. It is explained that the frozen ground absorbs unfrozen water, developing a gradient in the water potential in the same direction as the temperature gradient and formulating ice lenses, which can cause soil heaving. The frozen ground might increase the level of the groundwater table, but the ice lenses were not formulated because the temperature was often fluctuating above and below 0 °C.
- Measured ground temperature from PVT agreed with the temperature of the integrated sensor pack showing 2–4 °C at 1–4 m depth from the ground. While the ground temperature at 8.55 m depth remained constant of 5 °C. It means that the ground temperature deeper than 8 m from the surface remains constant, and is not influenced by the change of temperature in the air.
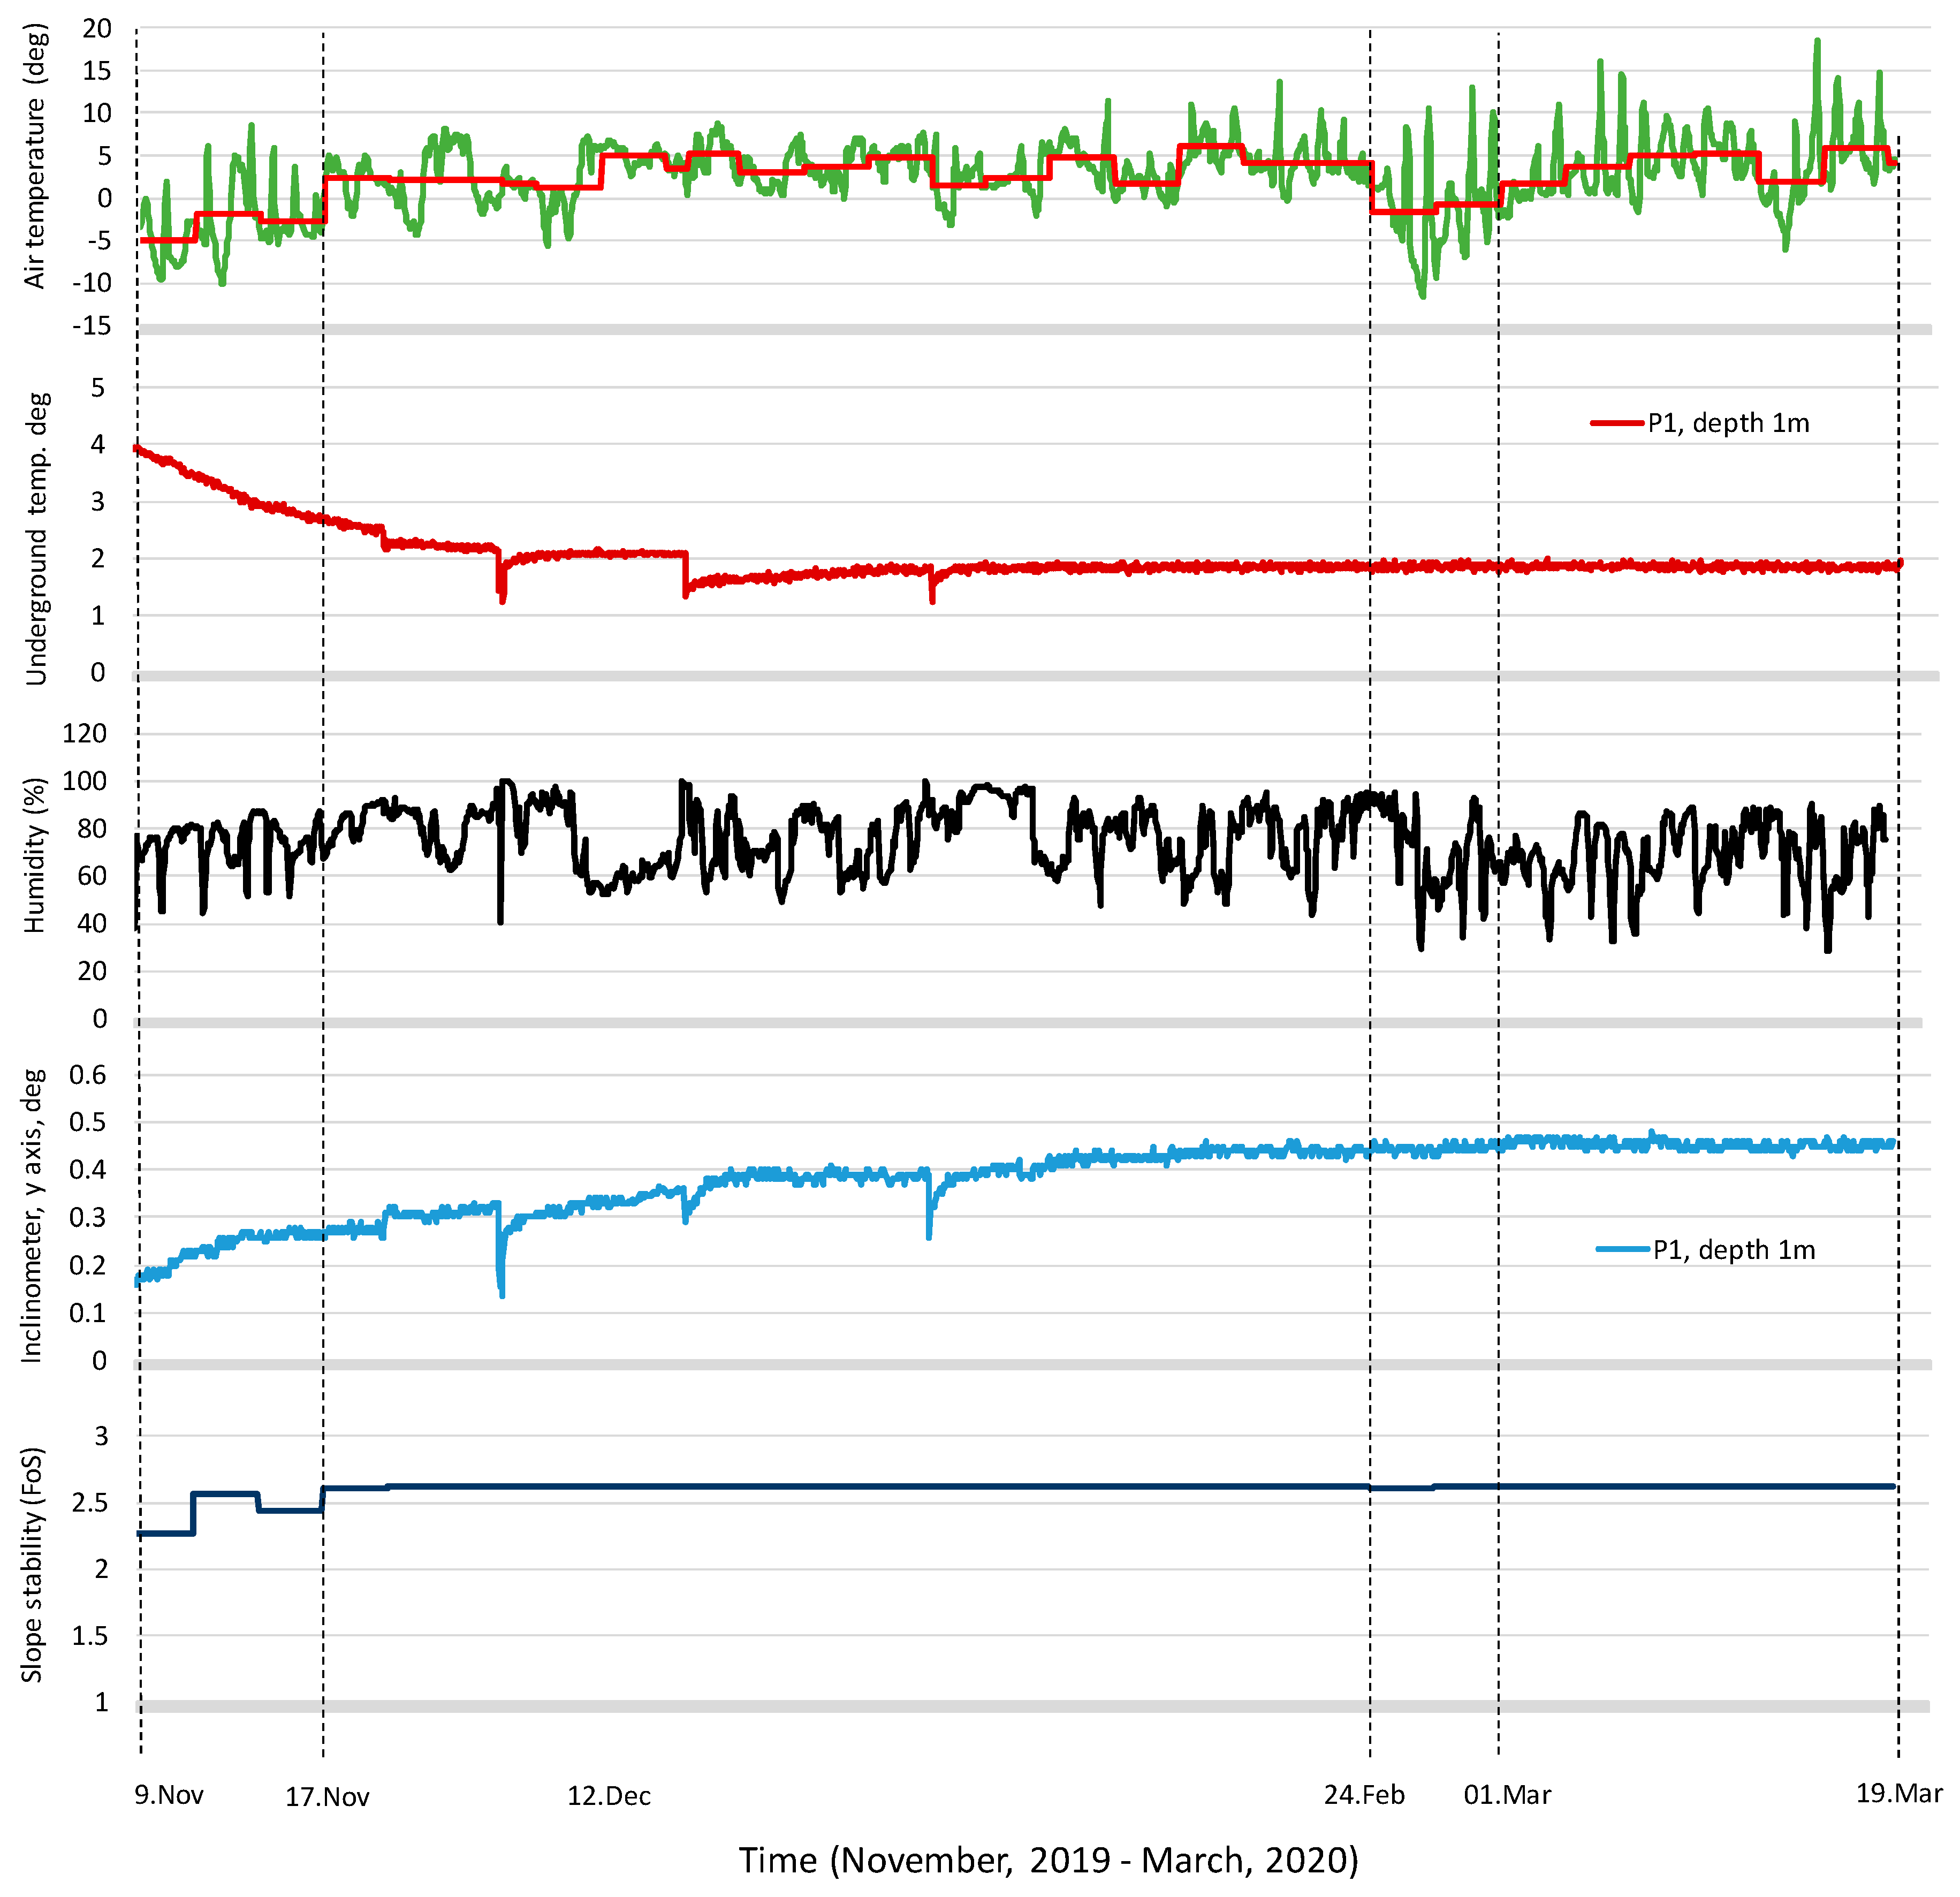
- Slope stability analyses versus time were performed, taking the measured pore pressure and ground temperature into account. Full thermal and saturated/unsaturated models were applied to simulate ground temperature distribution and water flow into the soils. The factors of safety of the man-made slope from November to March were calculated, ranging between 2.24 to 2.61. The slope stability in a cold region is affected by the weather condition, i.e., freezing–thawing action and precipitation, and this phenomenon should be continuously observed over the years by an installed monitoring system.
- The continuously measured data from not only piezometers and integrated sensor packs, but also water potential sensors and Lidar, can be applied to update soil parameters and provide much of the information necessary to monitor slope behavior and to obtain some of the necessary parameters for mitigation and remediation.
Author Contributions
Acknowledgments
Conflicts of Interest
References
- Zwissler, B.; Oommen, T.; Vitton, S. A study of the impacts of freeze-thaw on cliff recession at the Calvert cliffs in Calvert county, Maryland. Geotech. Geol. Eng. 2014, 32, 1133–1148. [Google Scholar] [CrossRef]
- Heidari, M.; Torabi-Kaveh, M.; Mohseni, H. Assessment of the effects of freeze-thaw and salt crystallization ageing tests on Anahita temple stone, Kangavar, west of Iran. Geotech. Geol. Eng. 2017, 35, 121–136. [Google Scholar] [CrossRef]
- Yilmaz, F.; Fidan, D. Influence of freeze-thaw on strength of clayey soil stabilized with lime and perlite. Geomech. Eng. 2018, 14, 301–306. [Google Scholar] [CrossRef]
- Chamberlain, E.J.; Gow, A.J. Effect of freezing and thawing on the permeability and structure of soils. In Proceedings of the International Symposium on Ground Freezing, Bochum, Germany, 8–10 March 1978. [Google Scholar]
- Graham, J.; Au, V.C.S. Effects of freeze–thaw and softening on a natural clay at low stresses. Can. Geotech. J. 1985, 22, 69–78. [Google Scholar] [CrossRef]
- Korshunov, A.A.; Doroshenko, S.P.; Nevzorov, A.L. The Impact of Freezing-thawing Process on Slope Stability of Earth Structure in Cold Climate. In Proceedings of the 3rd International Conference on Transportation Geotechnics, Guimaraes, Portugal, 4–7 September 2016; Volume 143, pp. 682–688. [Google Scholar]
- Andersland, O.B.; Ladanyi, B. Frozen Ground Engineering, 2nd Edition ed. Available online: https://www.wiley.com/en-us/Frozen+Ground+Engineering%2C+2nd+Edition-p-9780471615491 (accessed on 16 June 2020).
- Harries, N.J.; Robert, H. The use of slope stability radar (SSR) In Managing SLOPE Instability Hazards. In Proceedings of the 1st Canada—US Rock Mechanics Symposium, Vancouver, BC, Canada, 27–31 May 2007; American Rock Mechanics Association: Alexandria, VA, USA, 27–31 May 2007. [Google Scholar]
- Pirone, M.; Papa, R.; Nicotera, M.V.; Urciuoli, G. In situ monitoring of the groundwater field in an unsaturated pyroclastic slope for slope stability evaluation. Landslides 2014, 12, 259–276. [Google Scholar] [CrossRef]
- L’Heureux, J.S.; Lunne, T.; Lacasse, S. Norway’s national geotest site research infrastructure (NGTS). In Proceedings of the 19th International Conference on Soil Mechanics and Geotechnical Engineering, Seoul, Korea, 17–21 September 2017. [Google Scholar]
- Geotech. Users Manual, Geotech PVT Direct Push Piezometer. Available online: http://www.geotech.eu/index.php/equipment/piezometer (accessed on 1 November 2019).
- Quinteros, S.; Gundersen, A.; L’Heureux, J.S.; Carraro, A.H.; Jardine, R. Øysand research site: Geotechnical characterization of deltaic sandy-silty soils. AMIS Geosci. 2019, 5, 750–783. [Google Scholar] [CrossRef]
- ASTM D2487-17. Standard Practice for Classification of Soils for Engineering Purposes, Unified Soil Classification System; ASTM International: West Conshohocken, PA, USA, 2017. [Google Scholar]
- Statens Vegvesens. Vegbygging Håndbok N200; Statens Vegvesens: Oslo, Norway, 2014.
- Ishihara, K. Soil Behaviour in Earthquake Geotechnics; Clarendon Press: Oxford, UK, 1996. [Google Scholar]
- Croney, D.; Jacobs, J.C. The frost susceptibility of soils and road materials. Nat. Acad. Sci. Eng. Med. 1967. [Google Scholar]
- Jin, H.W.; Lee, J.; Ryu, B.H.; Akagawa, S. Simple frost heave testing method using a temperature-controllable cell. Cold Reg. Sci. Technol. 2019, 157, 119–132. [Google Scholar] [CrossRef]
- Geostudio. An Engineering Methodology. Available online: http://www.geo-slope.com (accessed on 15 December 2019).
- Morgenstern, N.R.; Price, V.E. The Analysis of the Stability of General Slip Surfaces. Géotechnique 1965, 15, 79–93. [Google Scholar] [CrossRef]
- Decagon Devices. MPS-2 & MPS-6 Dielectric Water Potential Sensors, Operator’s Manual; Decagon Devices: Pullman, WA, USA, 2017. [Google Scholar]
- Korea Infrastructure Safety and Technology Corporation. Remote Monitoring System R&D Project; KISTEC: Seoul, Korea, 2016. [Google Scholar]
- NRK Meteorologisk Institutt. Available online: https://www.yr.no/en/statistics (accessed on 16 June 2020).




| Layer | Depth (m) | Soil Unit Weight (kN/m3) | Friction Angle, φ′ (deg) | Cohesion, c′ (kPa) | Grain Size Distribution | Classification | |||
|---|---|---|---|---|---|---|---|---|---|
| Gravel, % | Sand, % | Silt, % | Clay, % | ||||||
| Unit I | 0–6 | 19.0 | - | 100.0 | - | 17.8 | 60.5 | 31.0 | Silty clay |
| Unit II | 6–10 | 19.0 | 30.0 | - | 61.8 | 26.4 | 0.3 | - | Sand, gravel |
| Slop ID | Slope Angle, deg | Slope Height, m | Factor of Safety | |||
|---|---|---|---|---|---|---|
| Watertable GL-10 m | Watertable GL-3 m | Watertable GL-2 m | Watertable GL-1 m | |||
| S-22 | 22 | 20 | 1.96 | 1.15 | 1.10 | 1.05 |
| S-24 | 25 | 20 | 1.81 | 1.12 | 1.07 | 1.03 |
| S-27 | 27 | 20 | 1.64 | 1.09 | 1.04 | 1.00 |
| S-30 | 30 | 20 | 1.49 | 1.06 | 1.01 | 0.97 |
| S-34 | 35 | 20 | 1.32 | 1.02 | 0.98 | 0.93 |
| S-39 | 40 | 20 | 1.16 | 0.96 | 0.93 | 0.90 |
| S-45 | 45 | 20 | 1.00 | 0.89 | 0.85 | 0.84 |
| Sensors | No. of Sensors | ID | Depth m | Locations |
|---|---|---|---|---|
| PVT (Piezometer) | 4 | P-1 | 4.5 | Top of the slope |
| P-2 | 8.55 | Top of the slope | ||
| P-3 1 | 5 | Bottom of the slope | ||
| P-4 1 | 3 | Bottom of the slope | ||
| Temperature sensors (PVT) | 4 | P-1 | 4.5 | Top of the slope |
| P-2 | 8.55 | Top of the slope | ||
| P-3 1 | 5 | Bottom of the slope | ||
| P-4 1 | 3 | Bottom of the slope | ||
| Integrated sensor pack (wc, temparature, tilt) | 2 | I-1 | 1 | Top of the slope |
| I-2 | 2 | Halfway down the slope | ||
| Suction sensors (MPS-6) | 10 | S-1, S-2 | 0.25, 0.5 | Three-quarters of the way down the slope |
| S-3, S-4 | 0.5, 0.25 | Halfway down the slope | ||
| S-5, S-6 | 0.5 | Westernmost hole at the top of the slope | ||
| S-7, S-8 | 0.7 | Centre hole at the top of the slope | ||
| S-9, S-0 | 1.05 | Easternmost hole at top of the slope | ||
| Lidar/Radar | 1 set | - | - | 10 m distance at the bottom |
| Air temperature, hygrometer | 1 set | - | - | Top of the slope |
| Precipitation measure | 1 set | - | - | Top of the slope |
© 2020 by the authors. Licensee MDPI, Basel, Switzerland. This article is an open access article distributed under the terms and conditions of the Creative Commons Attribution (CC BY) license (http://creativecommons.org/licenses/by/4.0/).
Share and Cite
Shin, Y.; Choi, J.C.; Quinteros, S.; Svendsen, I.; L'Heureux, J.-S.; Seong, J. Evaluation and Monitoring of Slope Stability in Cold Region: Case Study of Man-Made Slope at Øysand, Norway. Appl. Sci. 2020, 10, 4136. https://doi.org/10.3390/app10124136
Shin Y, Choi JC, Quinteros S, Svendsen I, L'Heureux J-S, Seong J. Evaluation and Monitoring of Slope Stability in Cold Region: Case Study of Man-Made Slope at Øysand, Norway. Applied Sciences. 2020; 10(12):4136. https://doi.org/10.3390/app10124136
Chicago/Turabian StyleShin, Yunsup, Jung Chan Choi, Santiago Quinteros, Ida Svendsen, Jean-Sebastien L'Heureux, and Joohyun Seong. 2020. "Evaluation and Monitoring of Slope Stability in Cold Region: Case Study of Man-Made Slope at Øysand, Norway" Applied Sciences 10, no. 12: 4136. https://doi.org/10.3390/app10124136
APA StyleShin, Y., Choi, J. C., Quinteros, S., Svendsen, I., L'Heureux, J.-S., & Seong, J. (2020). Evaluation and Monitoring of Slope Stability in Cold Region: Case Study of Man-Made Slope at Øysand, Norway. Applied Sciences, 10(12), 4136. https://doi.org/10.3390/app10124136


