Article

Evaluation and Monitoring of Slope Stability in Cold Region: Case Study of Man-Made Slope at Øysand, Norway

1
Norwegian Geotechnical Institute, Sognsveien 72, N-0855 Oslo, Norway
2
Department of Civil and Environmental Engineering, Norwegian University of Science and Technology (NTNU), 7491 Trondheim, Norway
3
Norwegian Geotechnical Institute, 7034 Trondheim, Norway
4
Korea Infrastructure Safety and Technology Corporation, Jinju 52856, Korea
*
Author to whom correspondence should be addressed.
Appl. Sci. 2020, 10(12), 4136; https://doi.org/10.3390/app10124136
Submission received: 8 May 2020 / Revised: 1 June 2020 / Accepted: 9 June 2020 / Published: 16 June 2020
(This article belongs to the Section Civil Engineering)

Abstract

:
Recently, the road and railways infrastructure developments in Norway have led to renewed interests on the geotechnical challenges associated with slope stability under freezing-thawing cycles. Despite the amount of research available on the topic, there are few comprehensive studies involving laboratory testing, numerical analysis, and field monitoring of a slope during a freezing–thawing. In this case study, a critical slope was identified in a cold region based on field and laboratory tests, and a series of numerical simulations were carried out to evaluate the governing factor of slope stability using finite element methods. A remote monitoring system was installed on a real scale man-made slope to observe its behavior against the governing factors of slope stability. As a result, it was found that slope stability at the critical slope was significantly impacted by the freezing–thawing action, which was confirmed by the initial field observations from 2019 to 2020. Later, continuous monitoring data could be used to update soil parameters and to implement an early warning system for the high risky slope areas effected by freezing–thawing action in many cold regions.

1. Introduction

Research on the frost behavior of soils has been carried out since the 1960s in the cold regions of northern America, northern Asia, and northern Europe. Recent infrastructure developments of road and railways networks in Norway have led to renewed interests on the geotechnical challenges associated with slope stability under freezing–thawing cycles. The freezing–thawing cycles may cause slope instability due to soil deformation and strength reduction [1,2,3].
When saturated fine-grained soil is subjected to freezing temperatures (below 0 °C), part of the water in the soil voids is frozen to ice. A film of unfrozen water closed to the frozen soil particles is absorbed into the ice and formulate ice lenses. In this procedure, water is sucked up from the unfrozen soil void developing a gradient in the water potential in the same direction as the temperature gradient. [4]. Once freezing stops, due to the air temperature above 0 °C, the thawing progresses from the ground surface begins. During thawing, water escapes easily through the spaces formerly occupied by the ice, leaving the void empty and leading high compressibility and low soil strength [5]. This freezing–thawing cycles in a soil can significantly impact on the stability of a slope. The impact of freezing–thawing on the stability of slopes has been studied by numerical simulations using, e.g., coupled thermal–hydraulic–mechanical models [6]. Such numerical research concluded that freezing of the soil on the slope increases its volume by attracting water from the groundwater table, while thawing reduces the effective soil strength by increasing hydraulic gradients, which can lead to slope failure (Andersland, 2004) [7]. To prevent slope failure, slope monitoring practices typically involve the periodic measurement of slope stability by scanning the slope surface to identify and quantify the nature and extent of pit slope movements [8]. Field monitoring techniques may also include devices that measure matric suction and volumetric water content [9].
The individual study of laboratory testing, numerical analysis, or field monitoring on the slope has been done to evaluate the stability of a slope subjected to freezing–thawing cycles. However, there are few studies available that have tested the soil in the laboratory, evaluated the slope stability, and monitored a man-made real scale slope. The purposes of this study are to investigate the changes of the slope stability at the Øysand site by performing site investigation (Section 2), laboratory test (Section 2), to evaluate the governing factor influencing the slope stability using numerical simulations (Section 3), establishing a suitable monitoring system and predicting the slope stability based on the measured data (Section 4).

2. Site Investigations and Laboratory Tests

2.1. Ø. Ysand Test Site

Several possible sites were screened for this study; those sites form part of the Norwegian Geotechnical Test Sites project [10], which characterize five different sites with soil compositions ranging from gravel to clay. The most suitable site was the Øysand site, because of its soil composition and the presence of a natural slope.
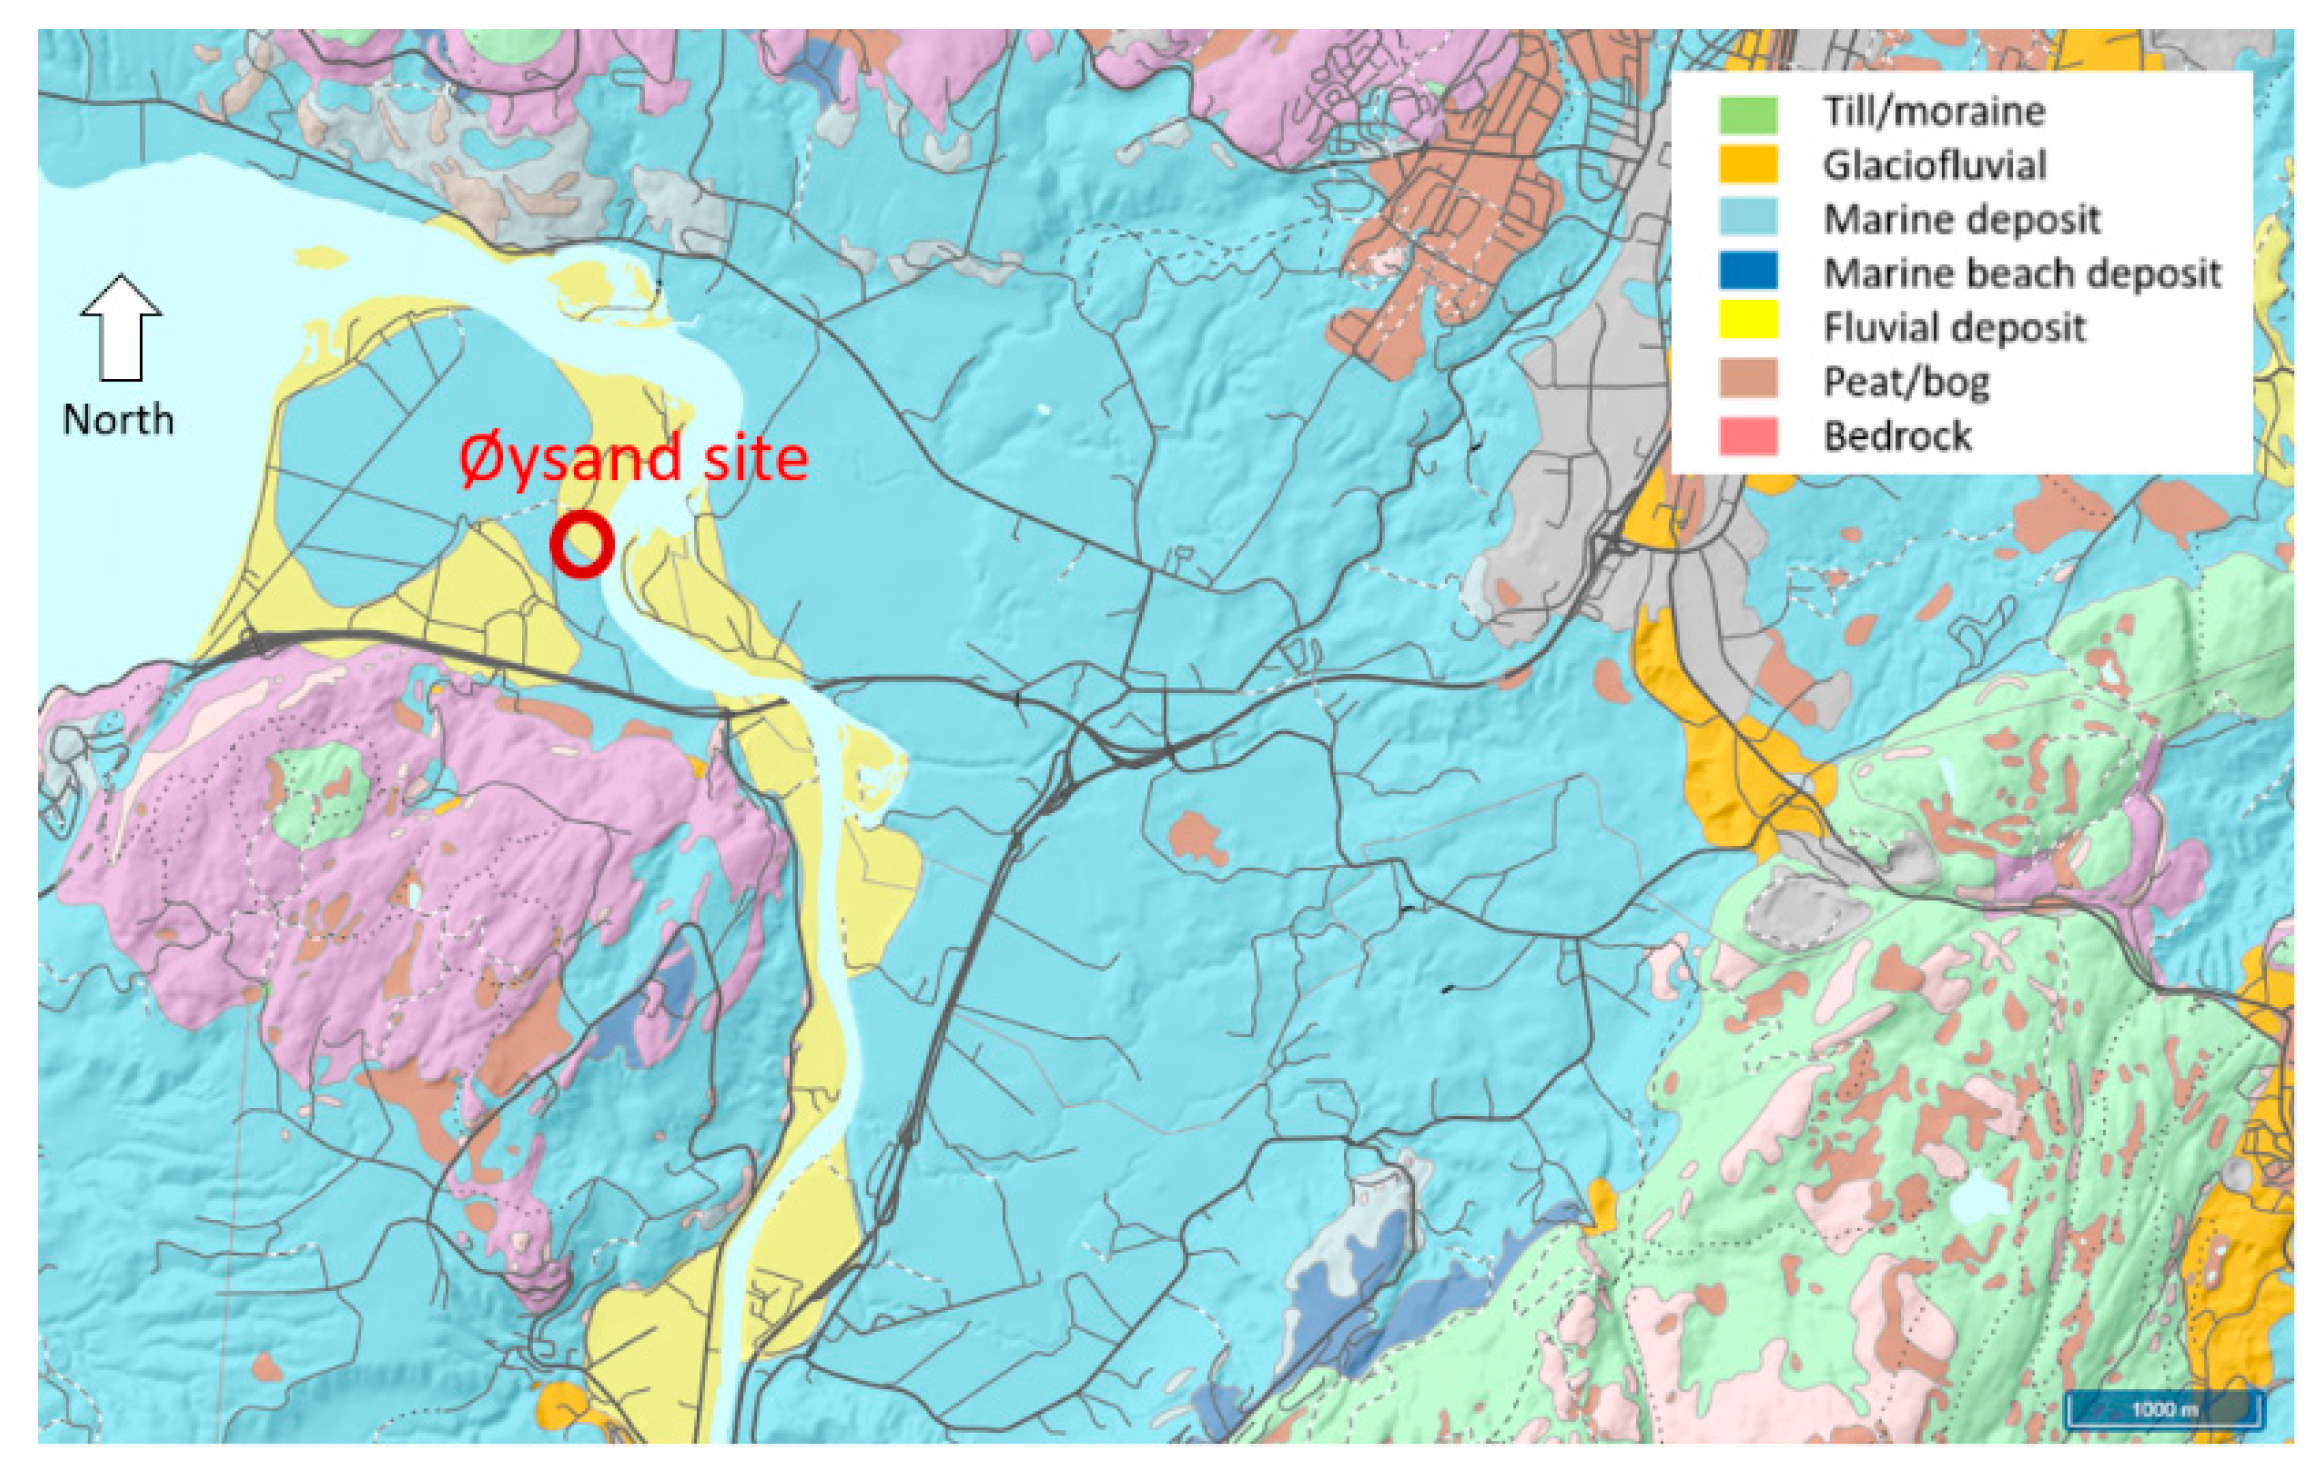
The Øysand site is located 15 km south-west from Trondheim, Norway. The soil deposit consists of fluvial material, underlain by deltaic and marine soil. The meandering Gaula River, which flows into the Trondheimsfjord, borders the site to the east, see Figure 1.

2.2. Geotechnical Investigation

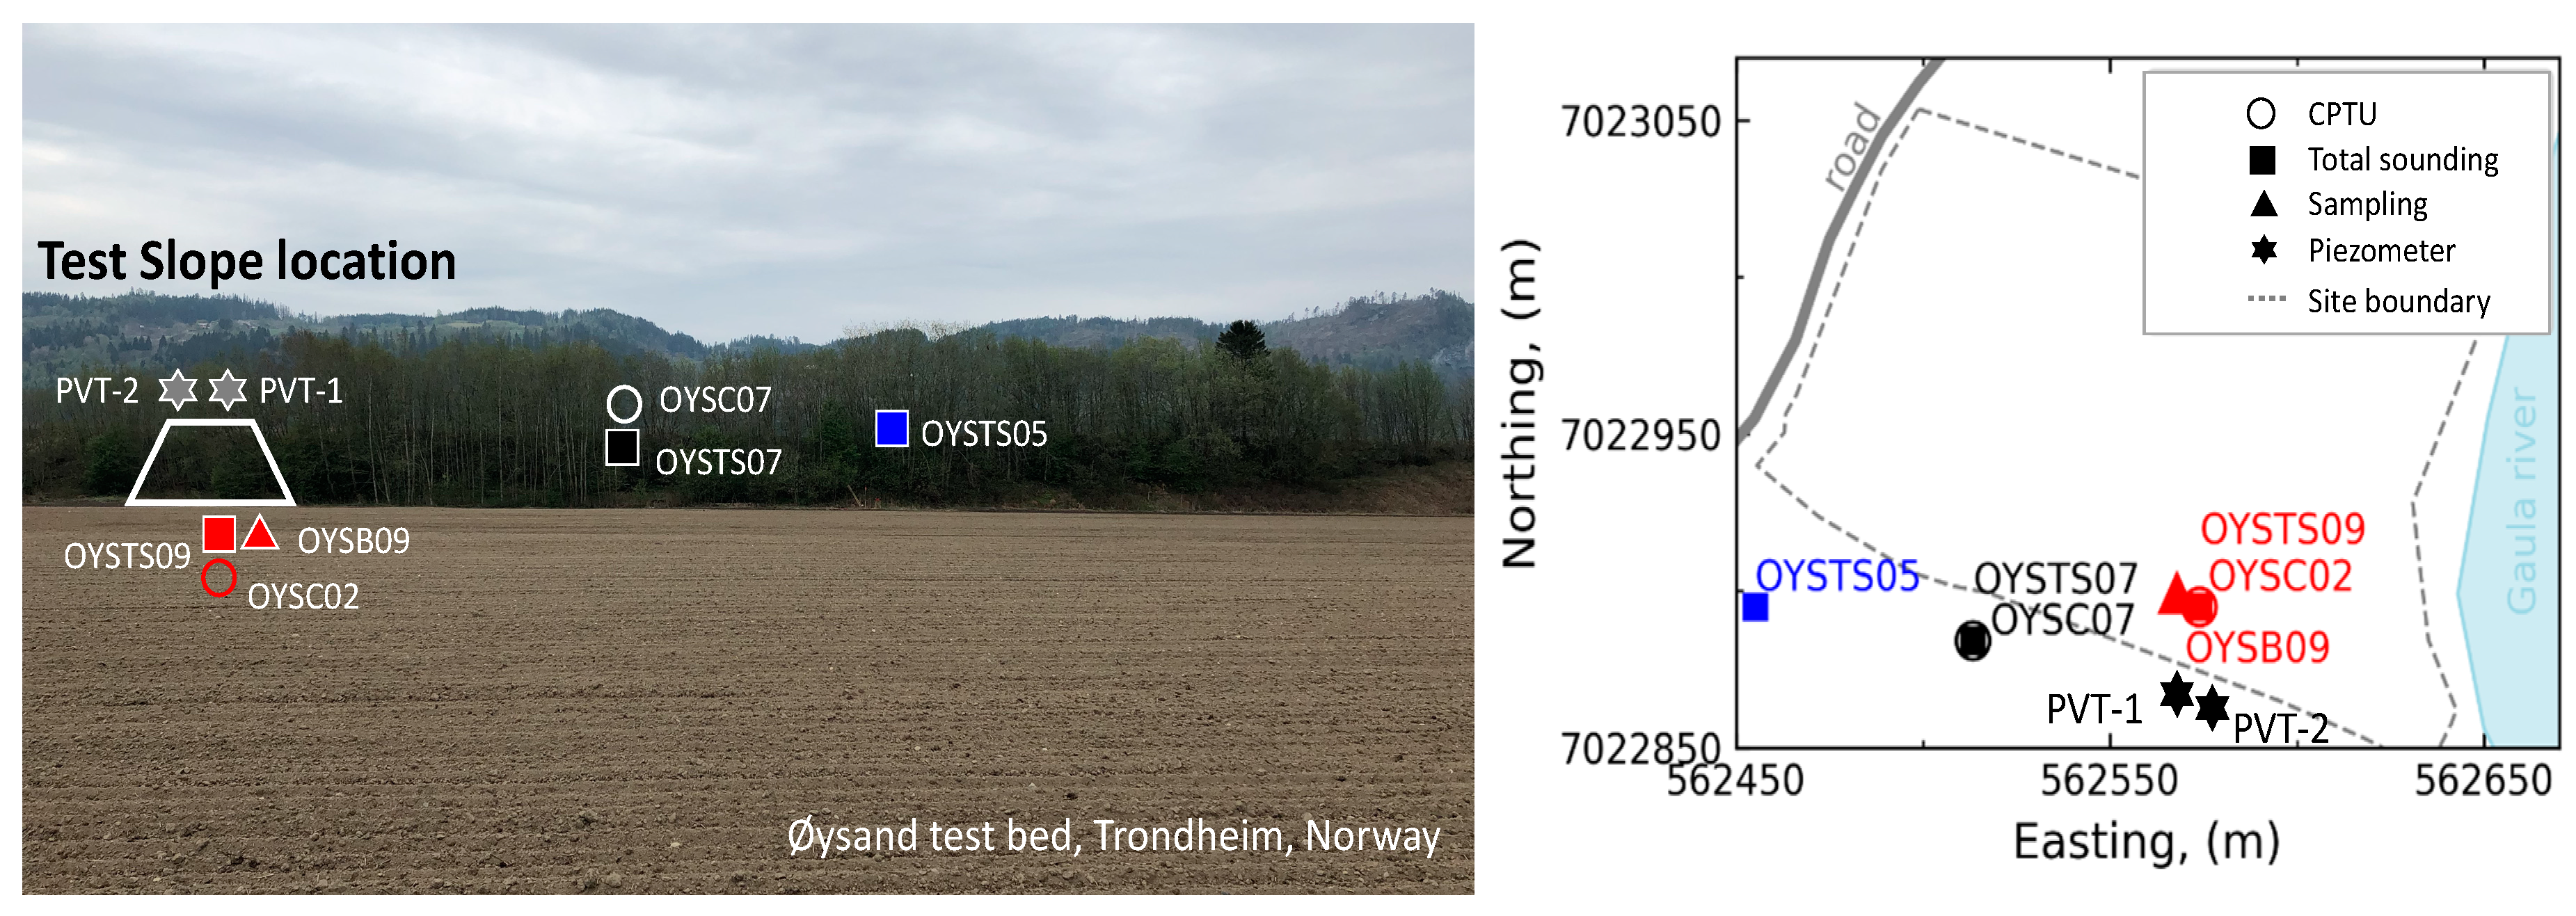
Cone penetration tests (CPTu), total sounding (TS), and a borehole were performed in 2017 and 2019 in the study area (Figure 2). For the first phase, two TS (OYSTS05 and OYSTS07) and one CPTu (OYSC07) were performed on the top of the slope and one TS (OYSTS09) and one CPTu (OYSC02) at the bottom of the slope were done in 2017. CPTu and TS are used for the identification of the main soil layers. CPTu is also used to derive strength parameters, which are critical for stability analysis of the slope. (OYS: Øysand site, TS: total sounding, C: CPT)
Additionally, two Piezometers (PVT-1 and PVT-2) were installed in 2019 at different depths (4.5 m and 8.8 m from the top of the slope) to measure the pore water pressure and changes in identified in the groundwater table level. Geotech PVT Direct Push Piezometers were used in this study [11]. The accuracy is 0.05% FS at 0–25 m (6 °C), and the device has a built-in temperature measurement at the tip of the cone with an accuracy of ± 2 °C. Recording was set up twice a day, i.e., every 12 h.
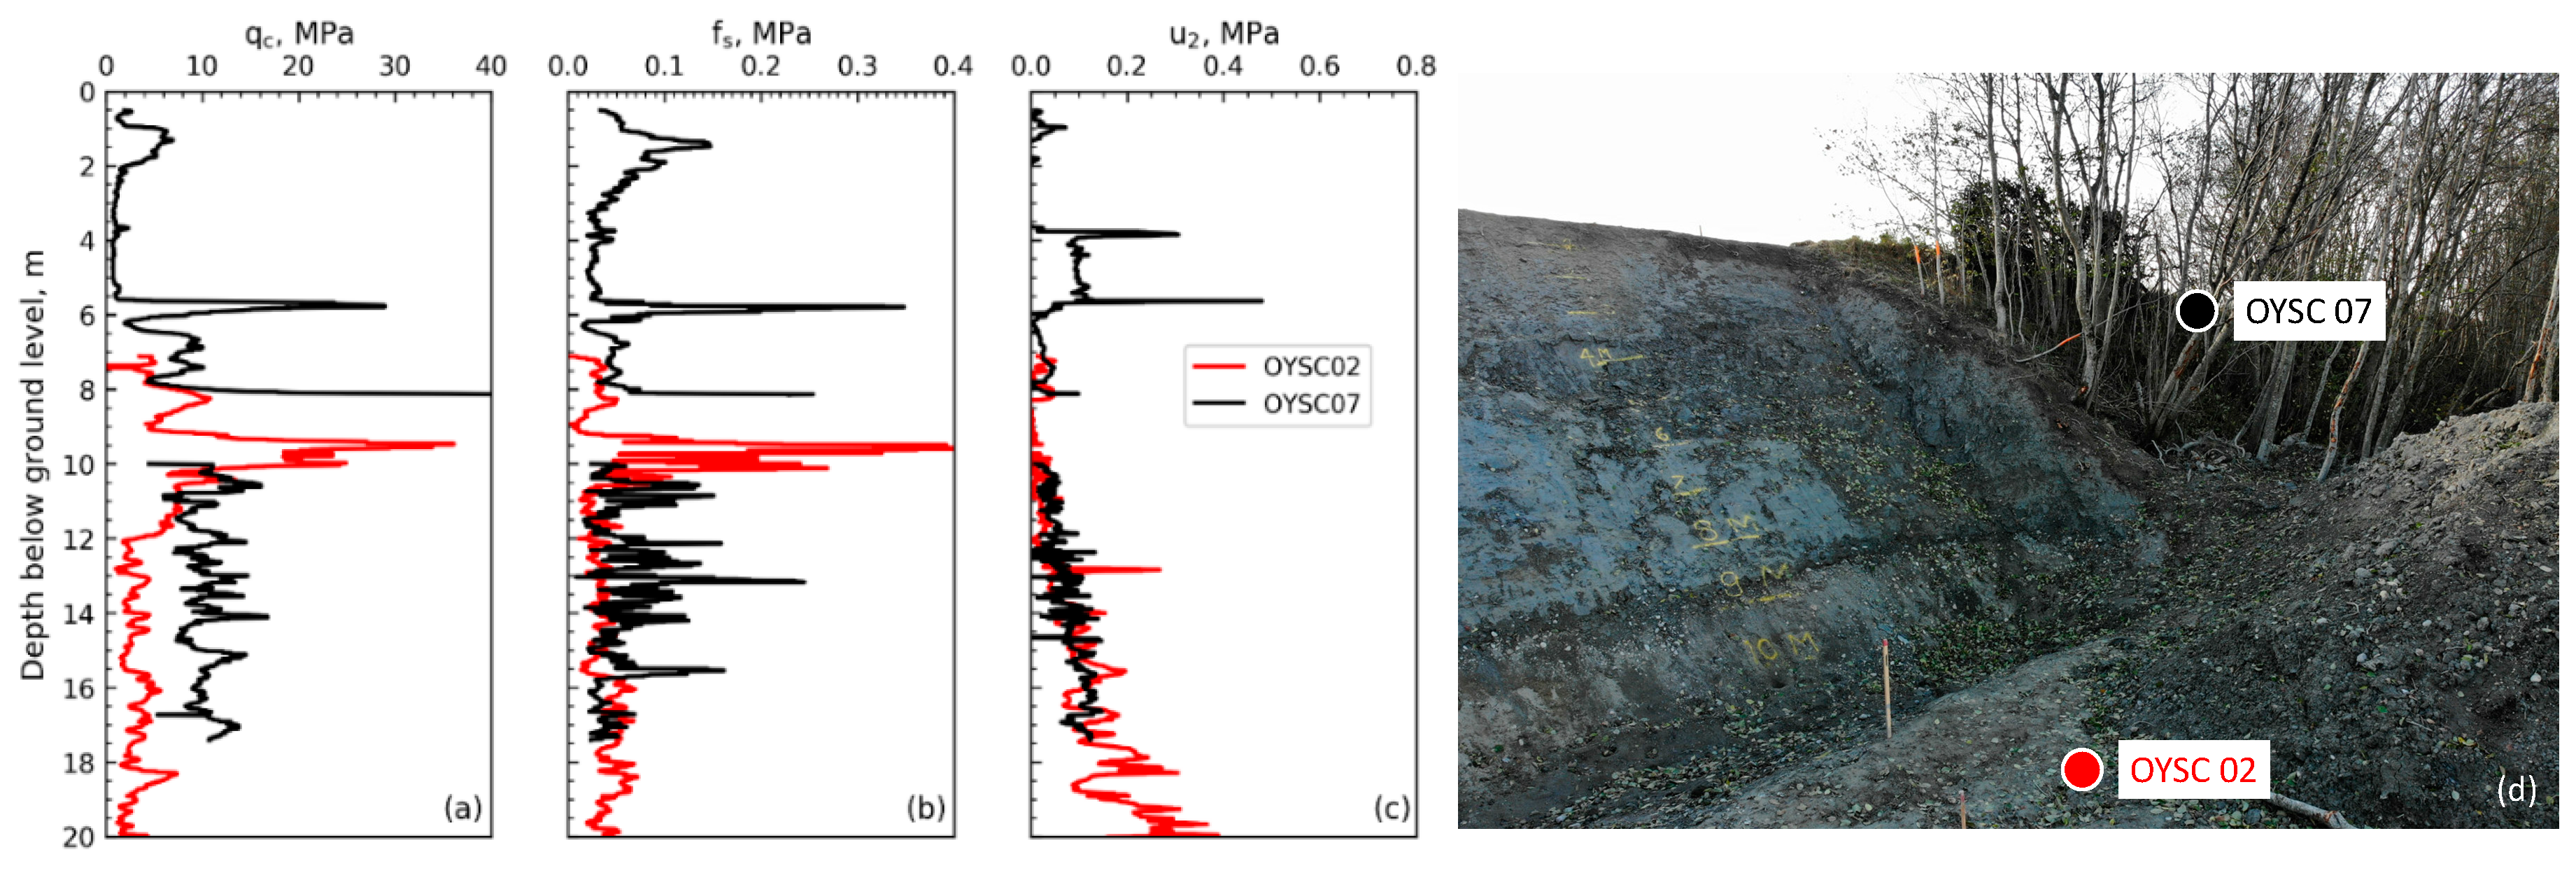
Figure 3 shows the CPTu results in terms of cone resistance (qc), sleeve friction (fs), and pore water pressure (u2). The zero depth is fixed at the top of the slope, hence the depth of OYSC02 (performed at the bottom of the slope) was corrected by adding 6.1 m to the measured depth in the field. A surficial silty sandy layer is identified in the very first meter of the slope, while clayey, silty soil was found from 2 m to about 5.5 m depth, the clay content seemed to increase with depth because the pore water pressure u2 increased between 3.5 and 5.5 m. Below 5.5 m and down to about 10 m depth interlayered gravelly sand and gravels were found, below that depth and down to 20 m sandy silty and gravelly sands were found.
In general, the stratigraphy down to a depth of 10 m from the top of the slope can be divided into two main units: (a) A top 6 m of clayey silt and silty soils and (b) a lower unit of deposited gravelly sand and gravels. The level of the groundwater table was identified by plotting the hydrostatic pore pressure (kPa) versus the depth (m) of the piezometer readings. A correction was applied to the pressure measured by the piezometer, namely by subtracting the piezometer to the air-pressure obtained from a nearby installed weather station. The groundwater level from two piezometers is estimated to be about 2 m from the slope surface.
Total sounding tests were also used to determine the soil stratification in addition to the CPTs. Results of OYSTS05, OYSTS07 performed at the slope top are compared against the results of OYSTS09 located at the bottom of the slope. A correction of the depth was also applied to OYSTS09. Similar deductions, as for the ones reached from CPTu, were obtained from the TS. Silty clayey material over sand and gravels were found across the slope. Note that hammering and flushing were required to advance through sections of the gravel layers, the applied forces exceeded 20 kN in the deeper gravel layers. The TS results, (a) rotary speed rate (b) rotary force shown in Figure 4, provides a good indication of the soil variability with depth. A comprehensive geotechnical soil investigation of the Øysand site is given in Quinteros et al. [12].

2.3. Laboratory Testing

2.3.1. Grain size Distribution

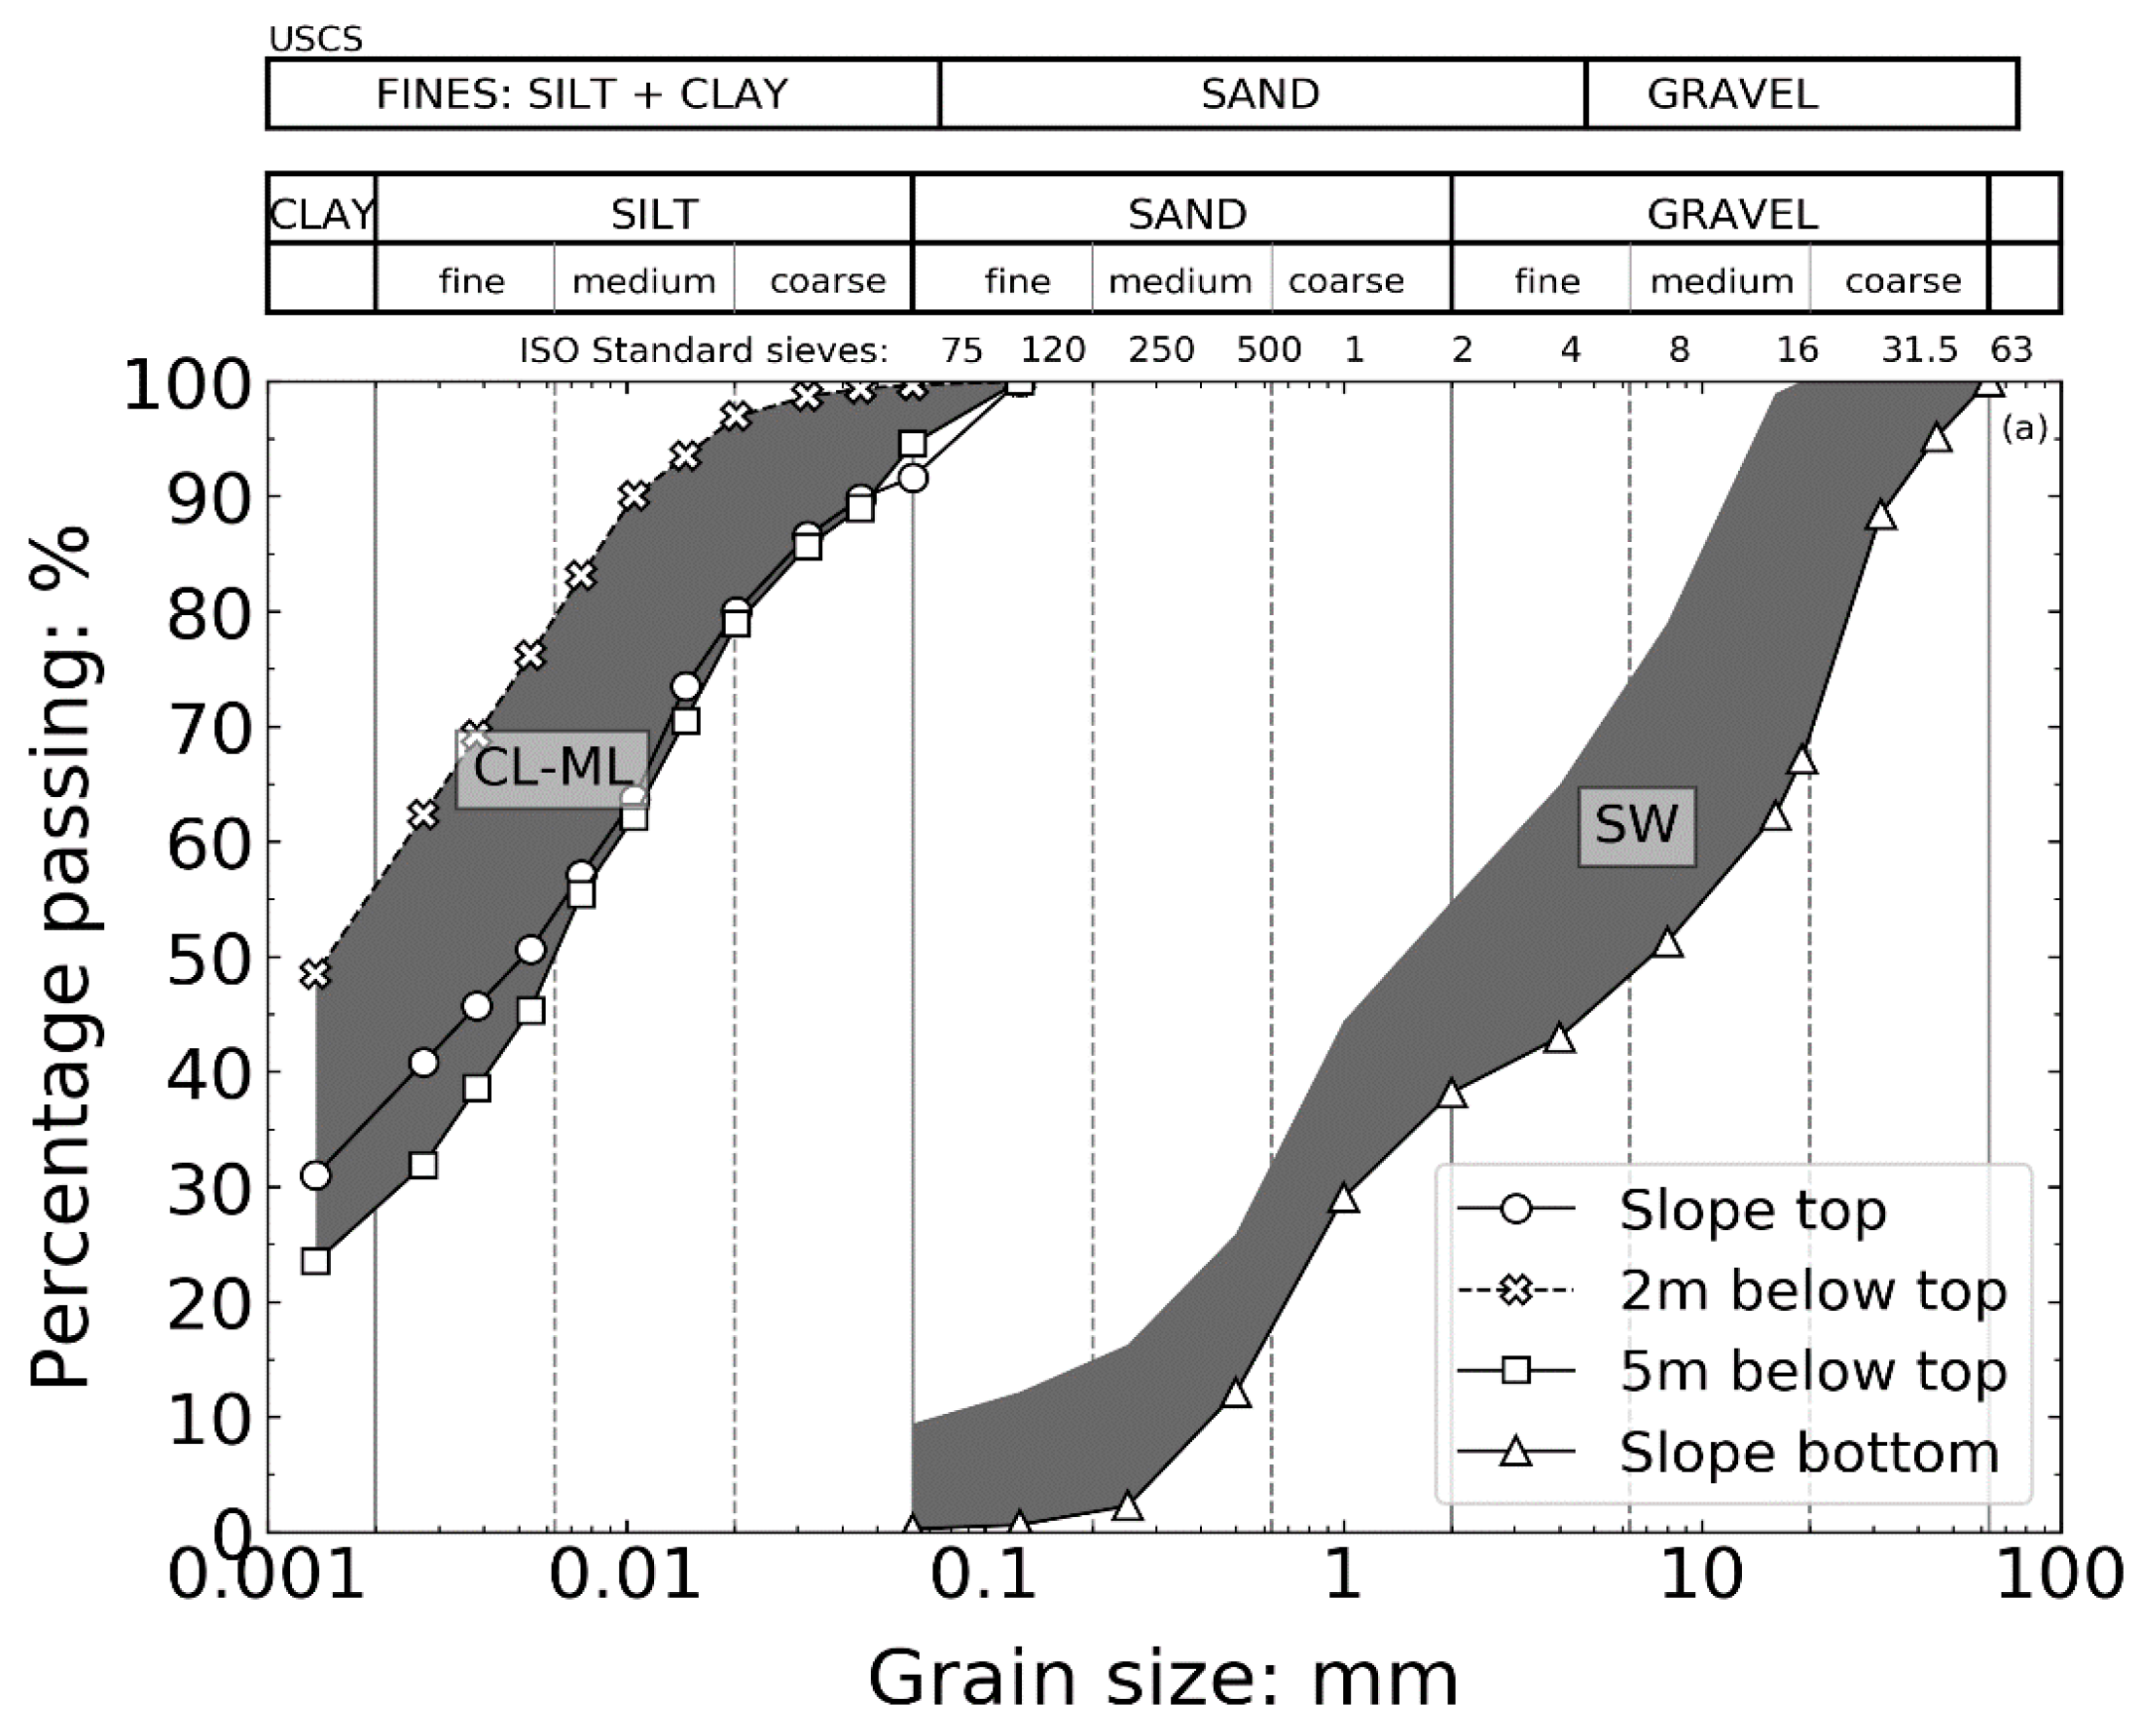
Representative grain size distribution (GSD) curves obtained from samples at the slope surface are presented in Figure 5. Samples were collected at the top of the slope, at about 2 m below the top of the slope, at around 5 m downwards, and at the bottom of the slope. GSDs are useful for preliminary assessment of the frost-heave susceptibility of the soils at Øysand. Soils found on the slope were classified as CL-ML (top to 5 m below) and as SW at the bottom of the slope by American Society for Testing and Materials (ASTM) [13]. Those soils are deemed as frost-susceptible after the Norwegian frost classification system NS200 (Statens Vegvesens, Norway) [14], which is based on GSD comparison. Frost heave tests were performed on the main soils (ML and SW) to confirm the frost susceptibility of the soils found at the slope surface, results are subsequently presented.

2.3.2. Frost Heave Testing

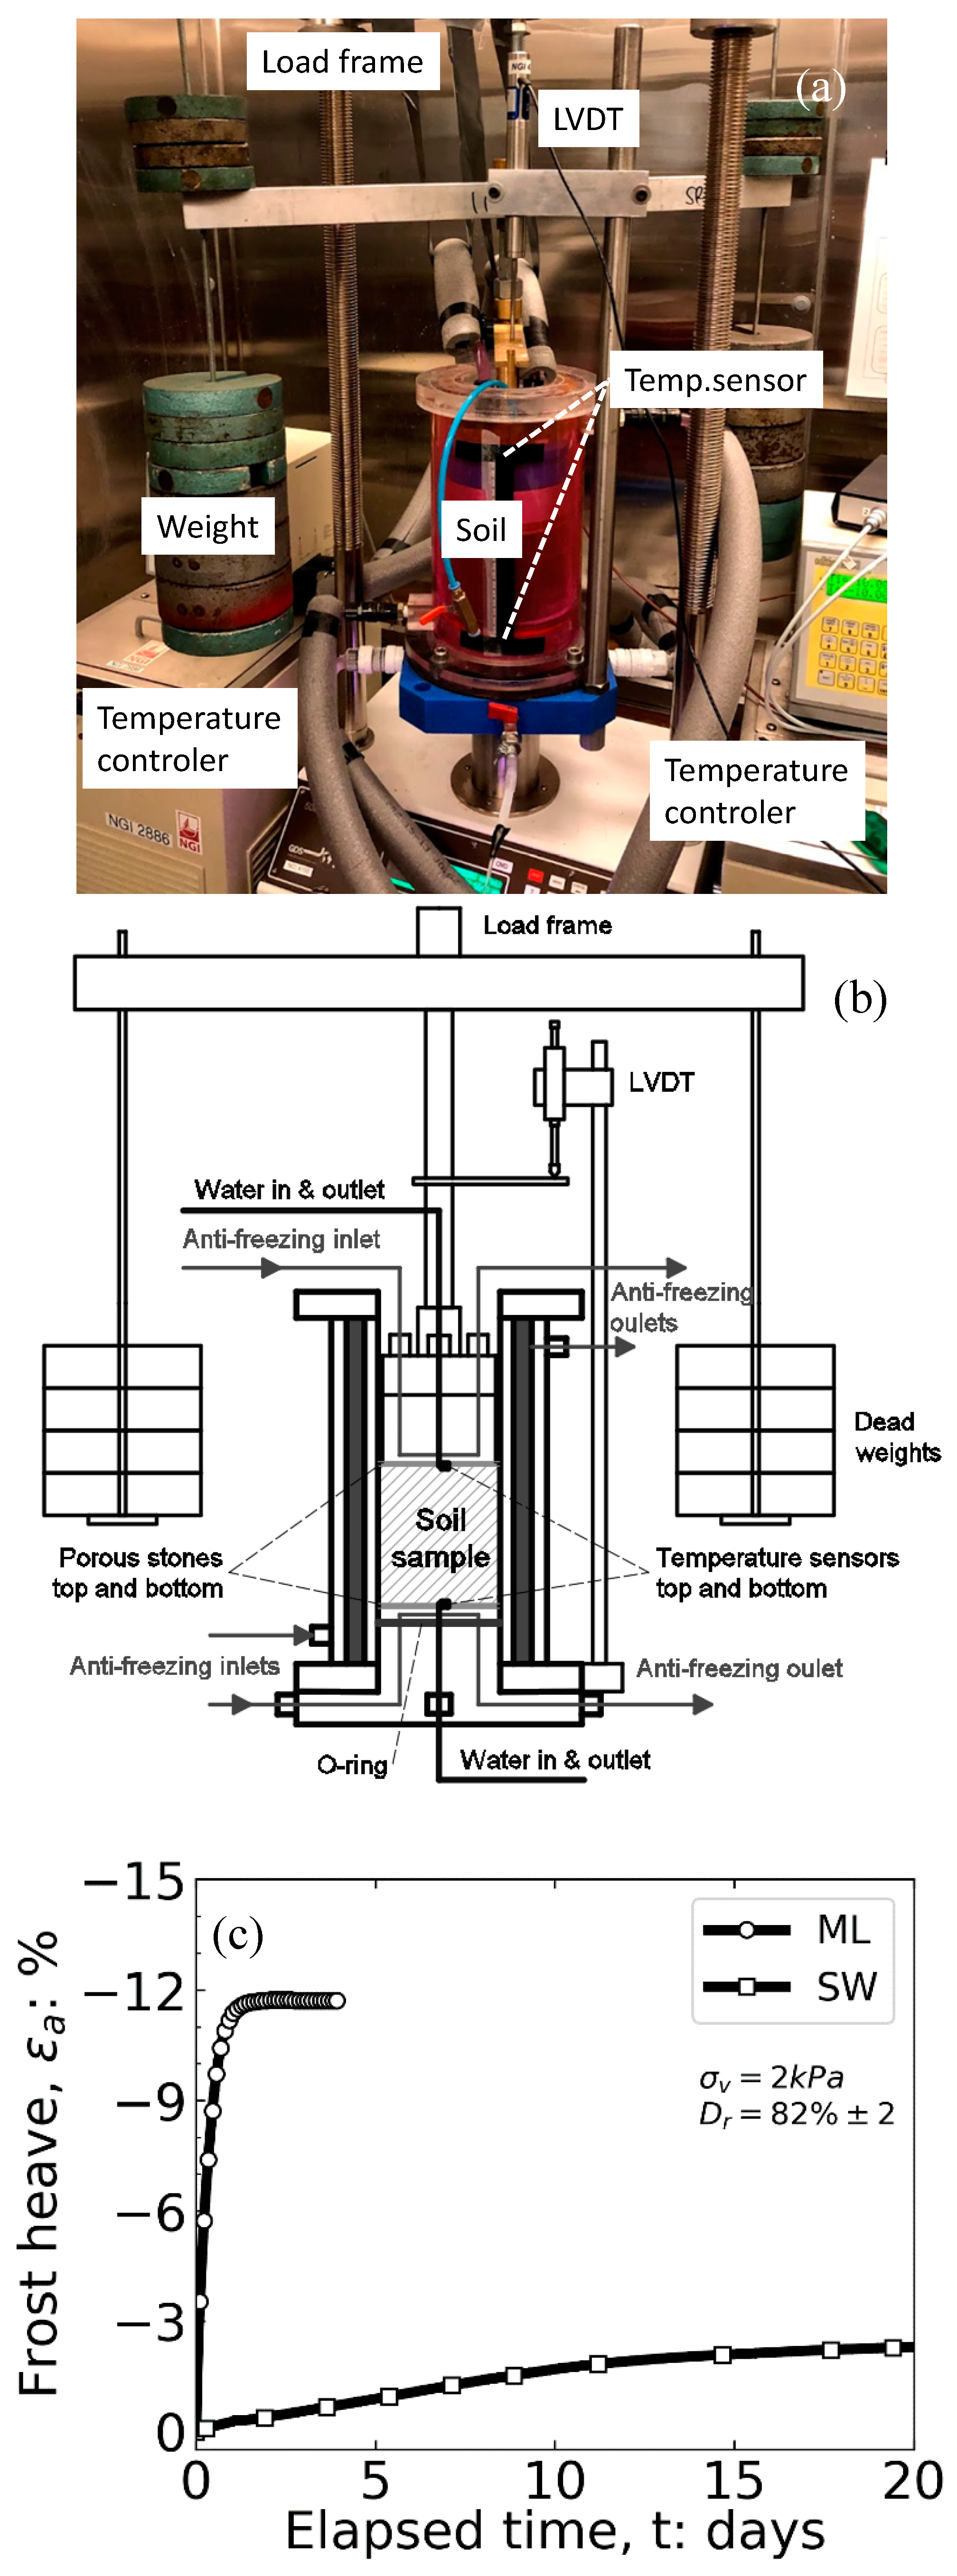
Using a one-dimensional temperature controllable cell, frost heave expansion of the two soils at the soil slope were investigated, namely ML and SW. The experimental setup used in this study consisted of a walk-in environmental room, a temperature-controllable cell for inducing one-dimensional freezing, and three independently working thermostats for imposing temperatures to the top, bottom, and periphery of the soil inside the cell (see Figure 6a,b). A linear variable differential transformer (LVDT) was used to measure the change in specimen height induced by freezing. The temperature controllable cell was developed by the Korean Geotechnical Research Institute (KICT, Korea) and slightly modified by NGI. The soil was reconstituted following Ishihara [15] air pluviation by funneling. The specimen height target was 100 mm and the diameter of the cell was 99.72 mm. A relative density of ~80% on SW soil, and a unit weight of 18 kN/m3 on ML was achieved by tamping. The specimens were then saturated with de-aired water using a small hydrostatic gradient. Finally, freezing was achieved by setting the temperature of the thermostat controlling the bottom cap at −10 °C, the thermostat controlling the temperature of the cell at 1 °C, and the temperature of the top cap at 3 °C. Hence the temperature gradient imposed was 0.13 °C/mm, which is in agreement with the recommendation with the Transport and Road Research Laboratory standard (TRRL) in the UK [16]. The vertical effective stresses σ’v applied to the soil (due to the own weight of the top cap and half of the soil) was 2 kPa.
The experimental results are presented in Figure 6c in terms of the elapsed time after the start of freezing versus the frost heave expansion as axial strain (εa). Experimental results confirmed the suspicion that Øysand soils on the slope face are frost susceptible. The ML soil expansion is about εa = 12%, and four times higher than the frost heave expansion of the SW soil (εa = 3%).

3. Methods of Slope Stability

3.1. Slope Location

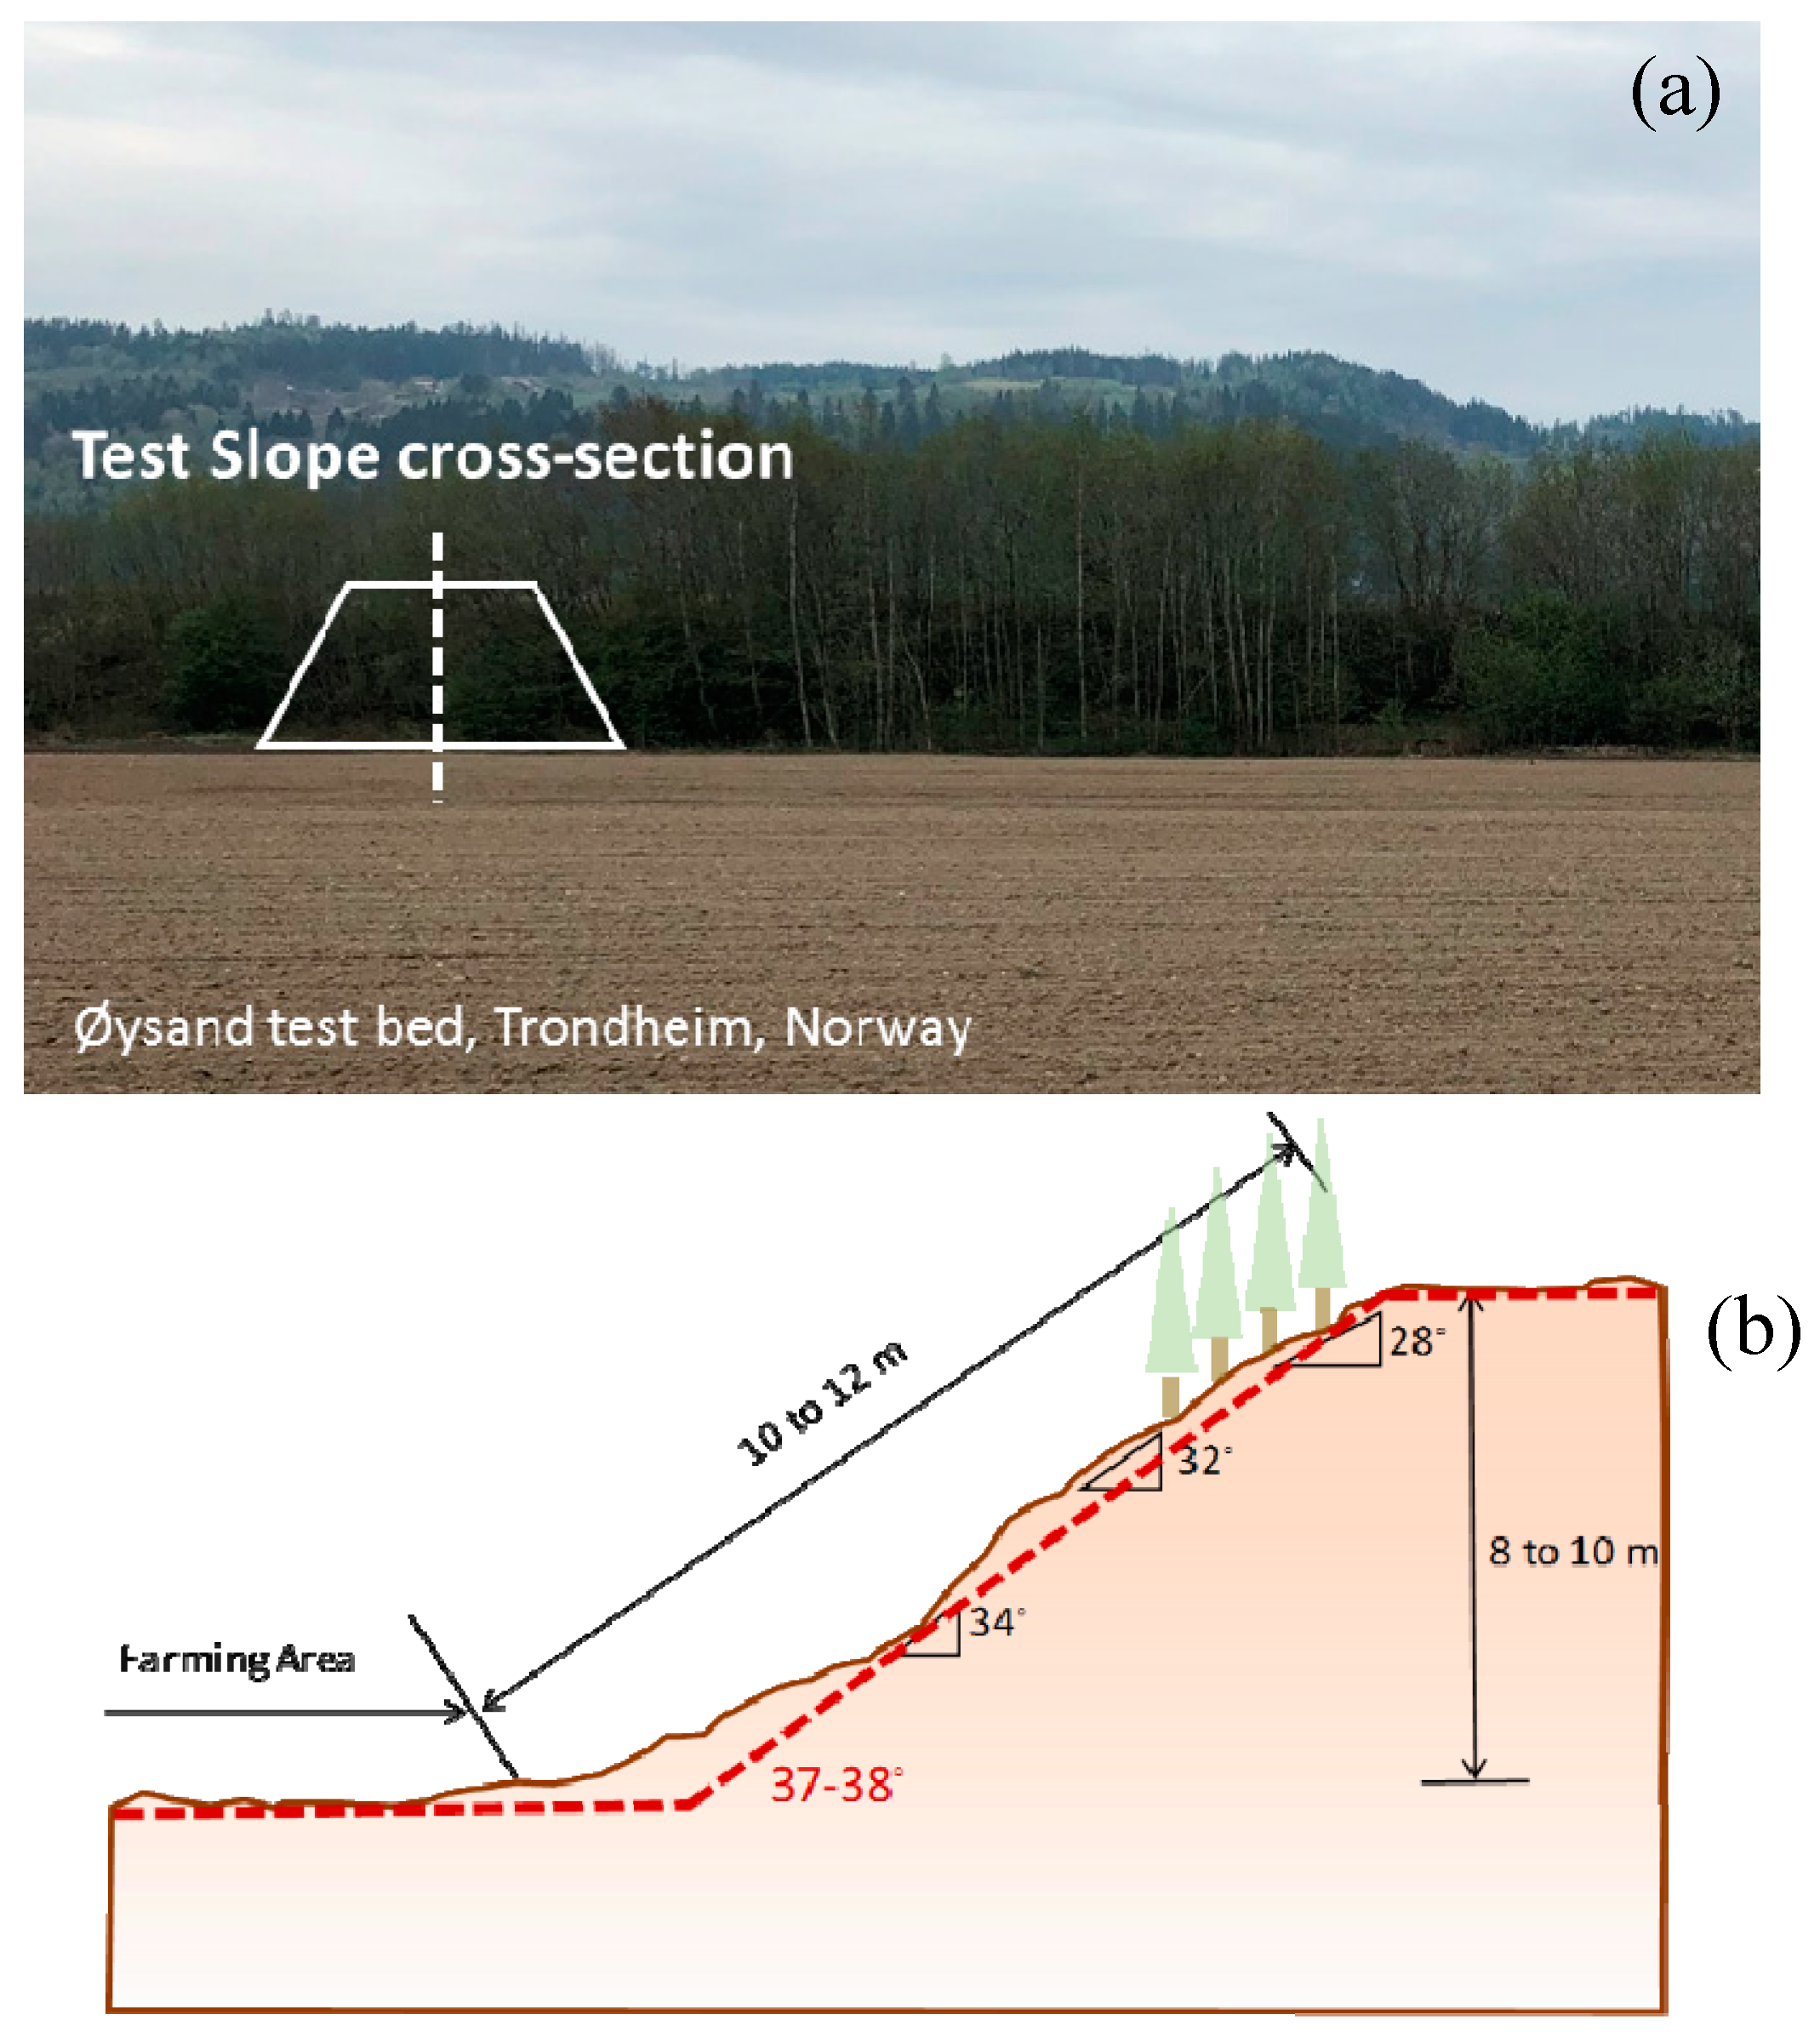
The Øysand site is located at 63.329097° N and 10.250308° E in Trondheim, Norway. A cross-section of the instrumented slope at Øysand is shown in Figure 7. Originally the slope had a dense vegetation cover with large trees and plants, and the slope angle varied between 28° at the top to 34° near the foot. For the purpose of this study, the vegetation cover was removed using an excavator on a 15 m wide portion of the slope in the east area. The 10 m high slope was reconfigured with a constant gradient of 37–38°.

3.2. Input Parameters

3.2.1. Methodology

Deterministic slope stability analyses were conducted through 2D limit equilibrium analyses for the identified critical slope profile in Section 3.1. Numerical simulation of ground freezing was done using the software GeoStudio [18] and the modules TEMP/W, SEEP/W, and SLOPE/W. The Morgenstern–Price method [19], which ensures both force and moment equilibrium, was applied. The method allows for variable distribution of the ratio of vertical and horizontal inter-slice forces along the slip surface. The commonly used solution of a half-sine ratio was chosen for analysis. The search for the critical slip surface can be controlled through different methods. In the most common method and the one selected for analysis, a grid of slip surface centers was specified together with a set of slip surface radii. After finding the critical slip surface using SLOPE/W had an additional optimization feature, which incrementally altered portions of the slip surface, searching for additional surfaces between the surfaces specified in the first portion of the analysis. The geometries of the critical cross-sections were imported into SLOPE/W from the given topography data. The soil was modeled as Mohr–Coulomb material under drained condition.

3.2.2. Geometry and Boundary Conditions

The geometry for 2D slope stability analyses was generated with a slope angle of 37° and a slope height of 10 m. Soil layers are divided into Unit I (silty clay) and Unit II (sand, gravel) based on the site investigation and observation during excavation. The groundwater table was set at 2 m below the ground, as measured by the piezometers. The initial excess pore pressure was activated by total water heads, and the drainage boundary condition was set on the surface of the slope to ensure zero pressure on the surface of the slope and soil remaining saturated. The temperature boundary condition was applied on the surface of the ground.

3.2.3. Soil Parameters

The soil parameters for Units I and II (Table 1) were derived based on the CPT data, laboratory tests, and recommendations by the Norwegian Road Authorities handbook V220. The selected parameters were best estimates.
The governing differential equation used in the formulation of coupled convective analysis in TEMP/W and SEEP/W was:
x ( K x T x ) + y ( K y T y ) + c w ( q w T ) y + Q = ( c + L w W u T ) T t
where T = temperature; Kx, Ky = thermal conductivity in the x- and y-directions respectively; cw = volumetric heat capacity of water; qw = the specific discharge of water; Q = applied boundary flux; c = volumetric heat capacity of soil; L = latent heat of water; w = the volumetric water content; Wu = the total unfrozen volumetric water content; t = time.
The full thermal model (TEMP/W) was applied to simulate freezing–thawing of soils. The water content in the model was changed during the analysis. The main parameters for the thermal model were thermal conductivity vs. temperature and unfrozen water content vs. temperature (see Figure 8). The saturated/unsaturated model (SEEP/W) was applied to simulate water flow into the soils. The model allows seepage analysis in fully saturated and unsaturated soils. The main parameters of the model are water conductivity vs. matrix suction and water content vs. matrix suction (see Figure 9). Those parameters were verified and revised based on the continuous field monitoring and the data from instruments on the slope, as discussed below.

3.3. Parametric Study

Prior to the slope stability analysis for the chosen cross-section, a parametric study was carried out to evaluate the change in the factor of safety as a function of slope angle and groundwater table. Table 2 shows the changes in the factor of safety as a function of varying slope angles from 22° to 45° and changing groundwater tables from 1 m to 3 m below the slope surface. The lowest factor of safety is for the slope where the slope angle is steepest, and the groundwater table is closest to the terrain.
The factors of safety were calculated, assuming the temperature in the test site for 2 years, 2017 to 2018. A large deviation between the highest and lowest temperature is observed in Figure 10a. The average temperature was implemented to the surface of the ground. The temperature at the surface is gradually transmitted under the ground, depending on the soil conductivity. If a temperature decreases under zero, for instance during December and January, the low temperature is transmitted to a certain depth below the surface, where ice lenses can lead to a rise in groundwater level. The increased groundwater level decreases the factor of safety of slope stability. Figure 10b presents the changing factor of safety with temperature for a slope angle of 37° for the last 2 years period.
When the temperature drops below zero, the factor of safety decreases below one. When the temperature is high (summer months), the factor of safety is not influenced. It was confirmed that the factor of safety of slope stability was mainly affected by changing (1) temperature, (2) slope angle, and (3) level of the groundwater table.

4. Results: Monitoring and Slope Stability

4.1. Site Preparation and Sensor Planning

The remote monitoring instruments used consisted of: PVT piezometers to monitor changes of the groundwater table with built-in temperature sensor, inclinometers (installed on the middle of the slope) to monitor slope deformations (Figure 11c), dielectric water potential sensors, Decagon MPS-6 (Decagon devices, Pullman, WA, United States) [20], see Figure 11d. The global deformations of the slope were assessed by Radar/Lidar system (Figure 11e). Some of these instruments were connected to a re-programmed datalogger (KISTEC, jinju, Korea) [21] with a data transfer unit, see Figure 11f. The readings were sent to NGI offices using wireless wi-fi router.
A good understanding of the causes of slope failure in a cold region is essential to make a proper monitoring plan. In a cold region, the governing factors of slope failure are severe weather conditions, freezing–thawing effects on the slope, an increase of water content, pore pressure, and the rising of groundwater table. The slope stability monitoring should be designed to measure and detect those factors effectively. The following sensors were selected for slope stability monitoring at the identified critical slope, see Table 3:
Integrated sensor packs, including water content sensors, temperature sensors, and inclinometers, were placed at two locations. The dielectric water potential sensors, Decagon MPS-6 with temperature sensors were installed at five locations. The range of soil suction is −9 to −100,000 kPa, resolution was 0.1 kPa, and accuracy was ± 10% of reading +2kPa from −9 to −100 kPa. The temperature range was −40 °C to 60 °C (resolution 0.1 °C, accuracy ± 1 °C). Radar was set up to scan the images of the slope surface to provide the changes in slope surface behavior. The scanned images can be investigated in connection with the inclinometer data and pore pressure changes, which can be implemented to provide a slope warning system and be used for setting out threshold value.

4.2. Measured Data

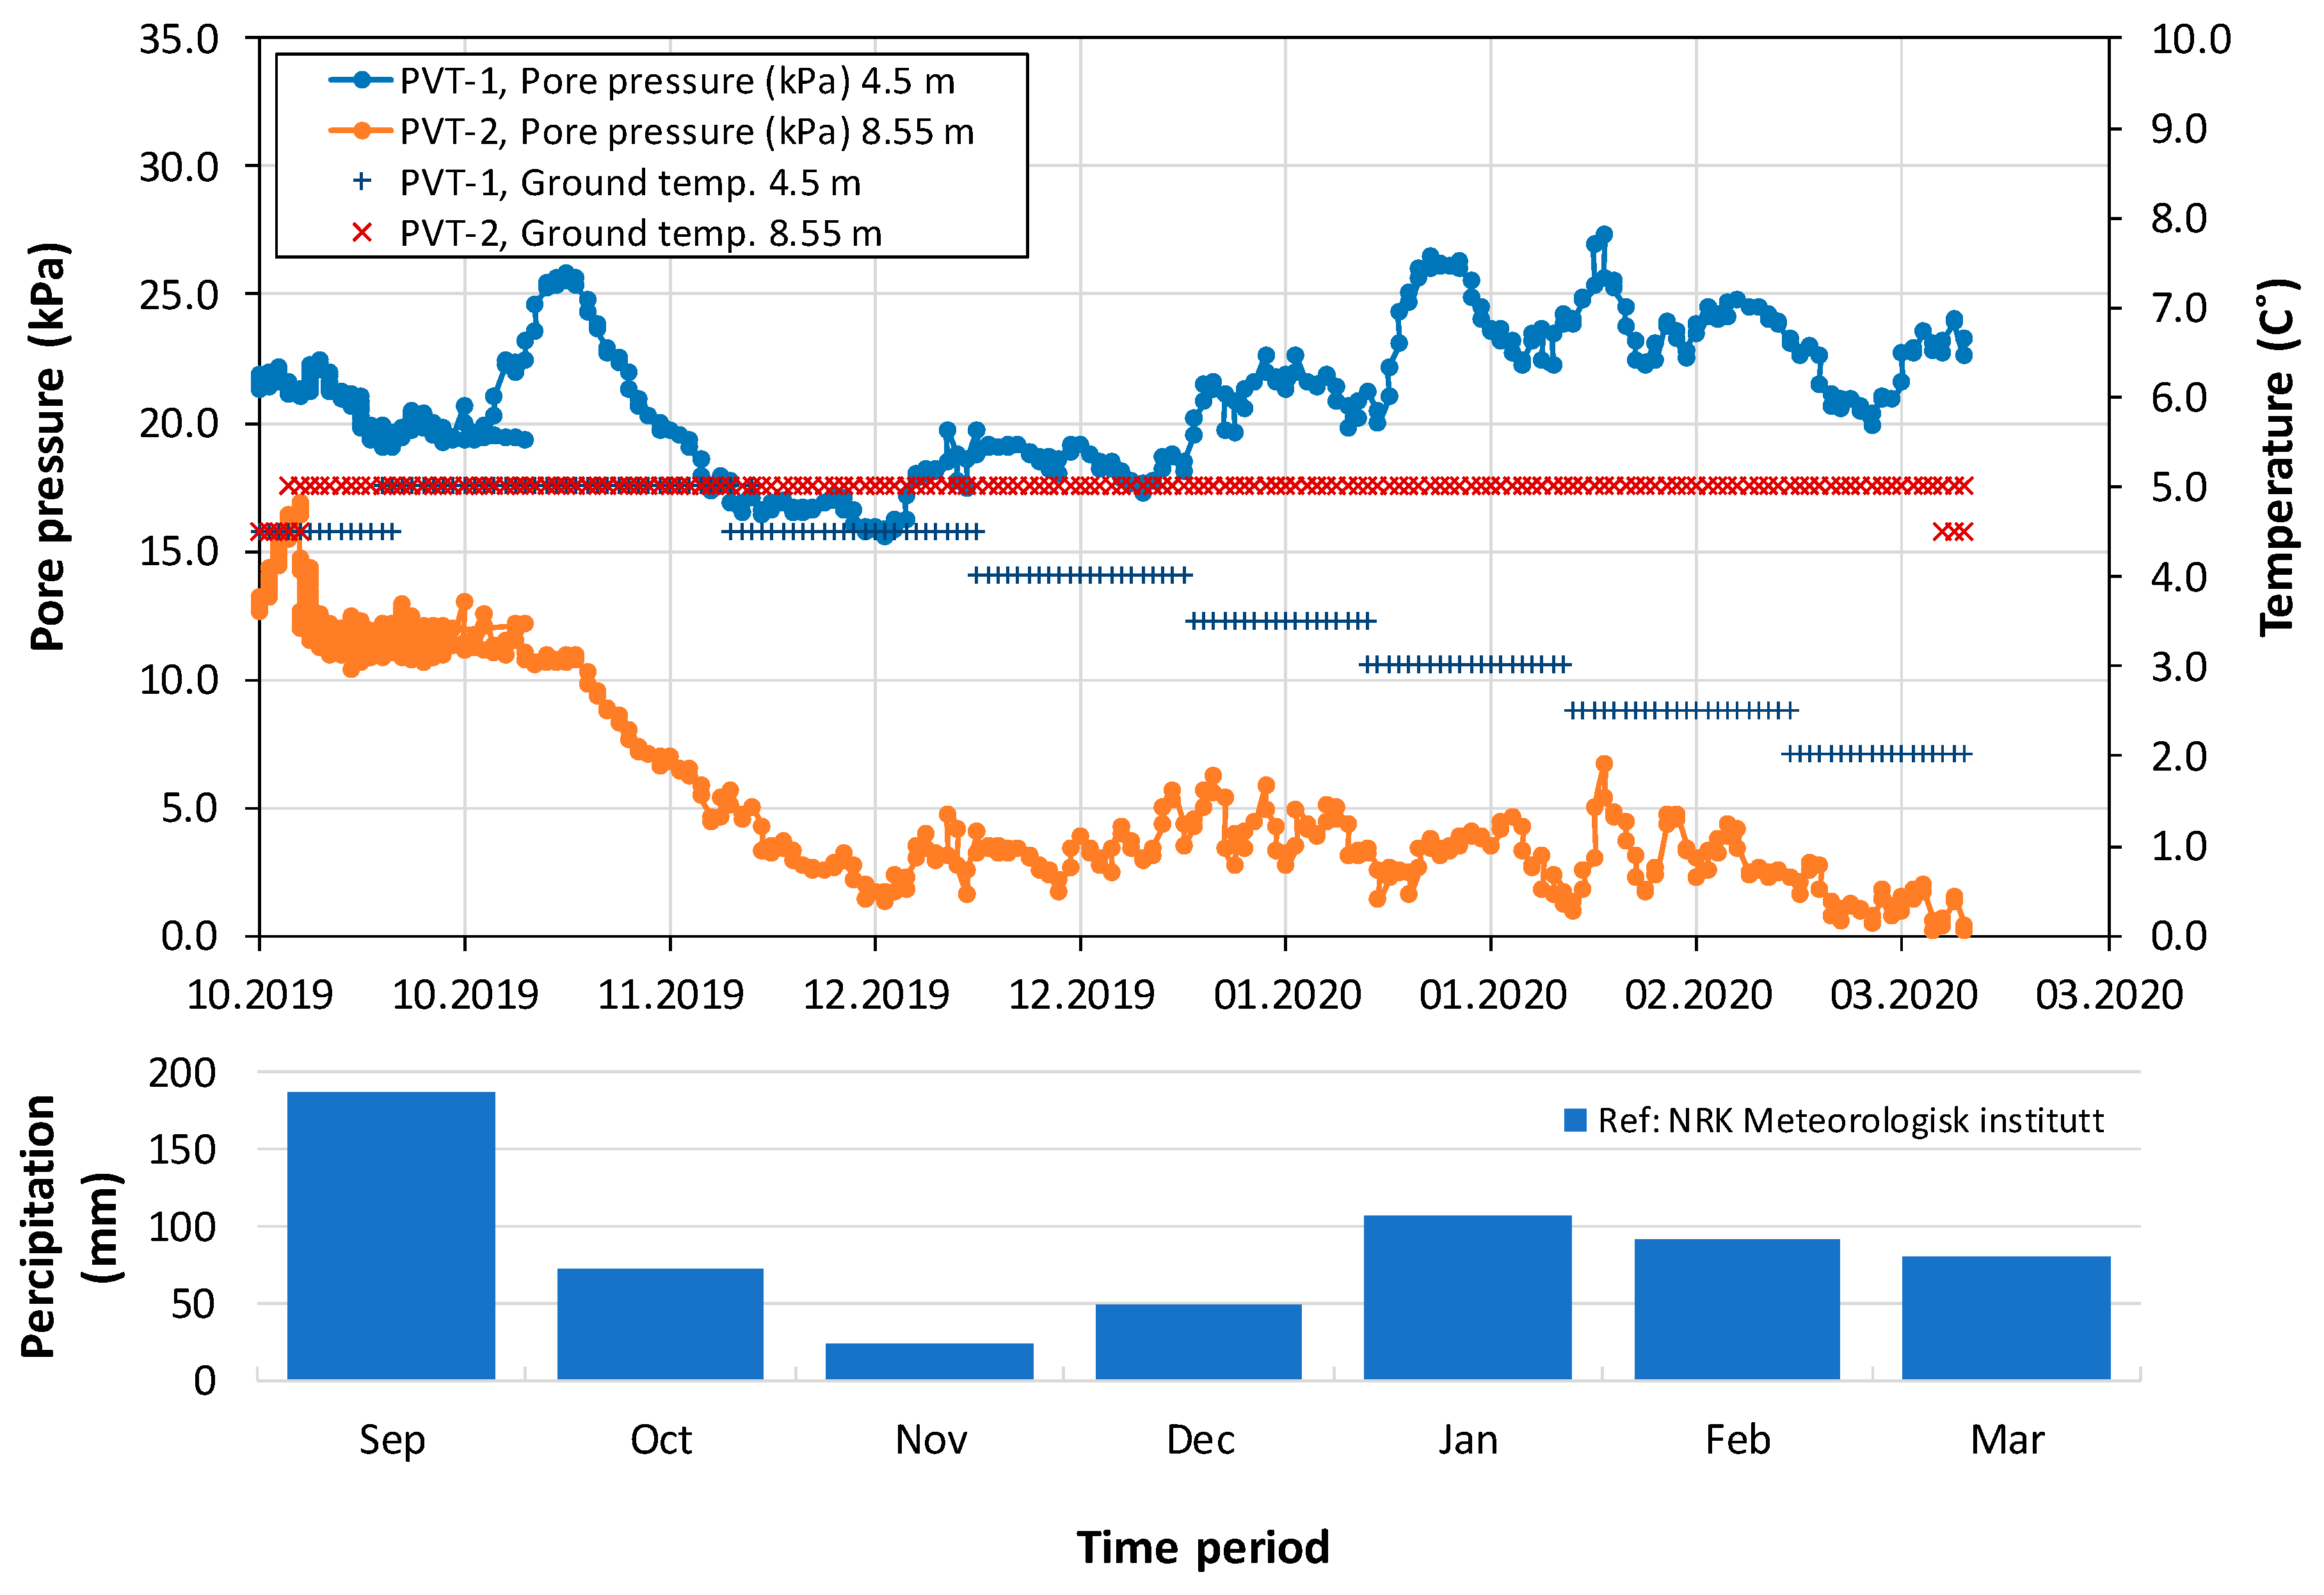
Measured pore water pressure and ground temperature from PVTs are presented in Figure 12. PVT-1 and PVT-2 were embedded at 4.5 m (Unit I, silty clay) and 8.55 m (Unit II, sand) depth, respectively. Measured pore water pressure at PVT-1 was average 21 kPa, indicating the groundwater level was about 2 m from the slope surface, which was supported by CPT results in Section 2.1. Measured pore water pressure at PVT-1 increased from 15 kPa to 27 kPa proportionally to the decrease of ground temperature from 4.2 °C to 2 °C from November to January. It is estimated that the frozen ground absorbs unfrozen water developing a gradient of water in the same direction as the temperature gradient, which can increase the level of the groundwater table. Another reason for the pore pressure increase is the increase of precipitation in this period, according to the recording data from the weather station (NRK Meteorologisk institutt, Øysand, Norway) [22]. Pore water pressure at PVT-2 measured around 15 kPa in early October converged to less than 5 kPa because the pore pressure was dissipated after heavy rain in September at a depth of Unit II, consisting of gravelly sand. Measured temperature from PVT-1 decreased and converged to 2 °C at 4.5 m depth while the temperature from PVT-2 remained constant of 5 °C at a depth of 8.55 m.
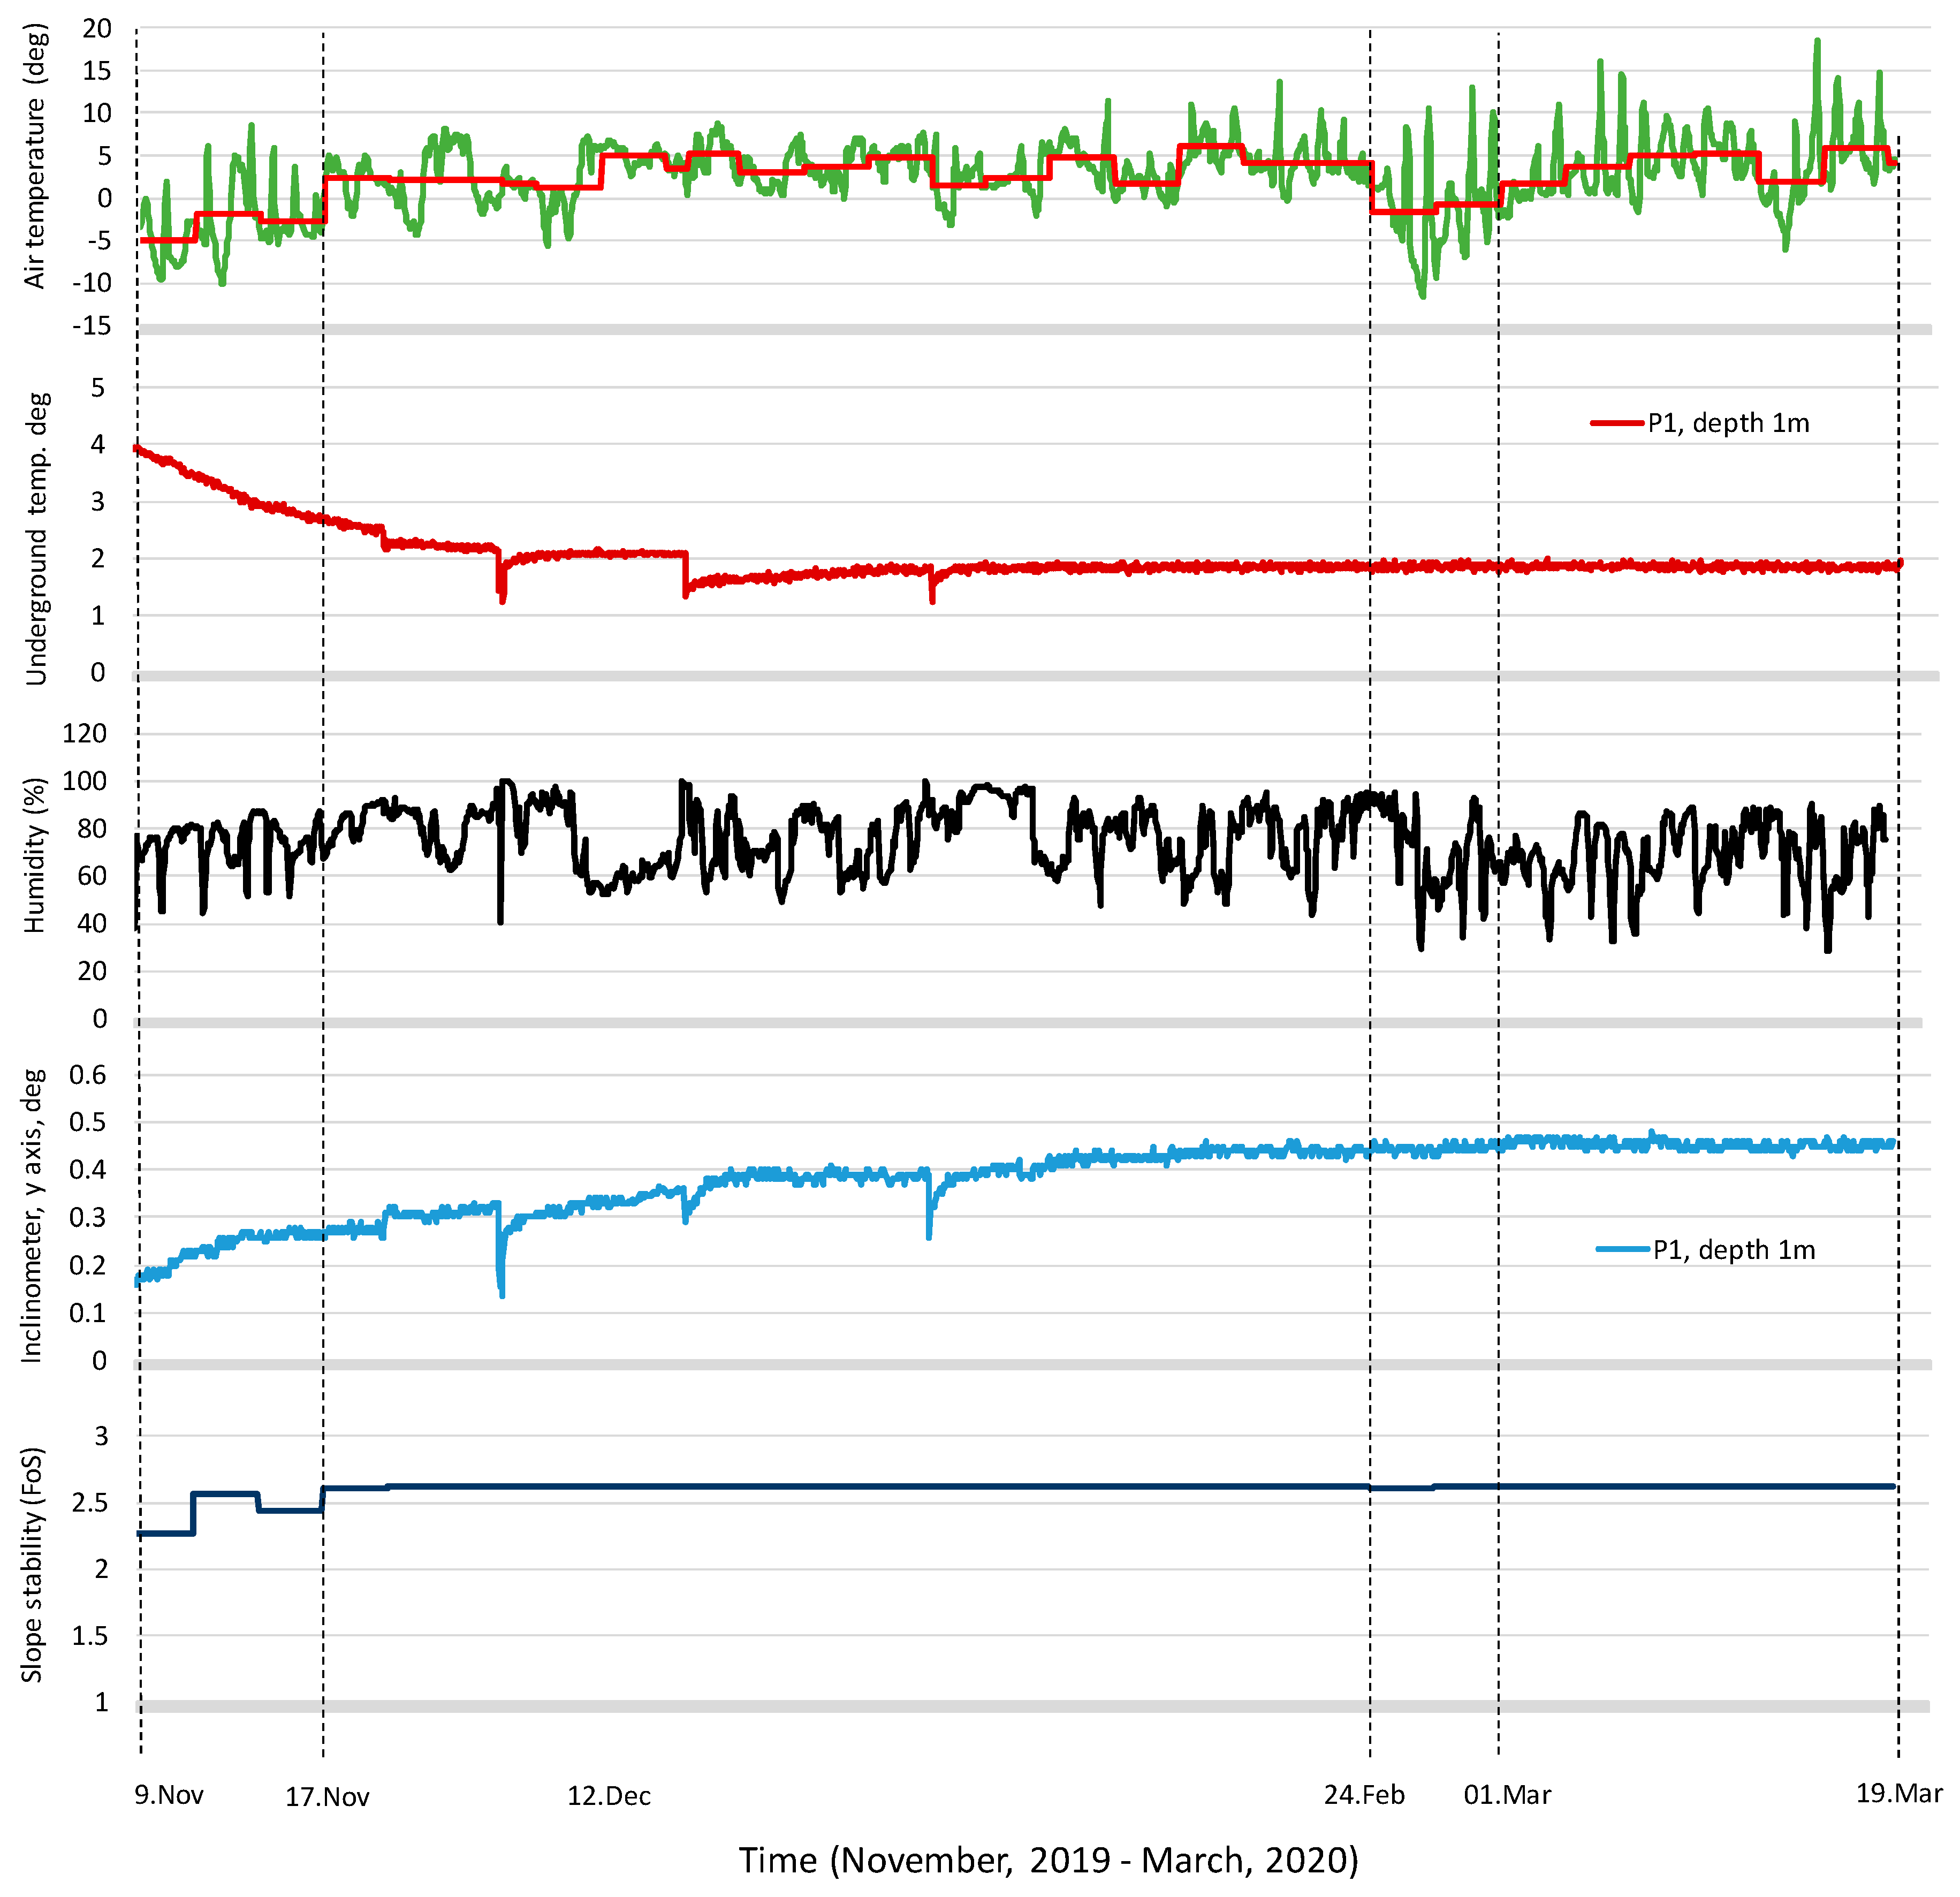
Another measured data set from the integrated sensor pack I-1, shows the slope inclination, ground temperature, together with air temperature and humidity obtained from November 2019 to March 2020 in Figure 13. Air temperature fluctuated between −12 to +18 °C. Those values were slightly higher than the average temperature in 2017 and 2018 used in the parametric study (see Figure 10). Meanwhile, ground temperature was almost constant, ranging from 1.8 to 2 °C at 1.0 m below the surface from the ground. Air humidity varied between 30 to 100%. The values of slope inclination were recorded every hour. The inclination of the slope increased slightly from 0.2° to 0.45°, which meant 2 mm displacement in a downward direction. Even though this change of inclination is negligible, it is important to keep monitoring the inclination of the slope depending on the changes of ground temperature. A threshold inclination was set to increase the interval of logging of inclinometer data from 1 h to every 10 min.

4.3. Slope Stability with Measured Data

The parametric study was carried out to evaluate the change in the factor of safety as a function of slope angle and groundwater table in Section 3.3. In this section, the slope stability analysis for the man-made slope was carried out applying the measured data, i.e., pore pressure, groundwater table, air and ground temperature, to evaluate a change of stability with time. The average air temperature for 3 days was applied from November to March in Figure 13. Note that the effect of precipitation was not applied in this study.
The full thermal model (TEMP/W) was applied to simulate ground temperature distribution along with the depth, and the saturated/unsaturated model (SEEP/W) was applied to simulate water flow into the soils, as shown in Figure 14. The average air temperature for 3 days was applied to the surface of the ground because the ground temperature was not changed immediately as the air temperature changes. The boundary at the slope surface was modeled with temperature, which is supposed to be transmitted to the ground corresponding to the measured temperature. Coupled seepage analysis was carried out to model groundwater table and pore water pressure, which are matching to the measured pore pressure. The input parameters used for the slope stability analyses have been verified by measured data. Those parameters will be revised by the continuous field monitoring and the data from instruments for the whole year.
Consequently, the factor of safety of slope stability was calculated to a range of 2.24 to 2.61 from November 2019 to March 2020, considering the measured pore water pressure, groundwater table, air, and ground temperature.
In a short period, the factor of safety does not change dramatically depending on the temperature changes in the air because the ground temperature was slowly affected by temperature transmission. But it is necessary to observe the slope behaviors, i.e., pore water pressure, ground temperature, inclination, soil suction, surface movement, over the year by the installed monitoring system. Those measured data can update soil parameters and provide much of the information necessary to monitor slope behavior for mitigation and remediation.

5. Summary and Conclusions

For a real scale man-made slope in a cold region, a practical monitoring system has been established to measure and observe slope behaviors, i.e., pore pressure, air and ground temperature, inclination, and surface displacement. Slope stability analyses were performed with the measured data to evaluate factors of safety during the winter season from November 2019 to March 2020. As a result, it was found that:
  • Measured pore water pressure underground increases proportionally to the decrease of ground temperature. It is explained that the frozen ground absorbs unfrozen water, developing a gradient in the water potential in the same direction as the temperature gradient and formulating ice lenses, which can cause soil heaving. The frozen ground might increase the level of the groundwater table, but the ice lenses were not formulated because the temperature was often fluctuating above and below 0 °C.
  • Measured ground temperature from PVT agreed with the temperature of the integrated sensor pack showing 2–4 °C at 1–4 m depth from the ground. While the ground temperature at 8.55 m depth remained constant of 5 °C. It means that the ground temperature deeper than 8 m from the surface remains constant, and is not influenced by the change of temperature in the air.
  • Slope stability analyses versus time were performed, taking the measured pore pressure and ground temperature into account. Full thermal and saturated/unsaturated models were applied to simulate ground temperature distribution and water flow into the soils. The factors of safety of the man-made slope from November to March were calculated, ranging between 2.24 to 2.61. The slope stability in a cold region is affected by the weather condition, i.e., freezing–thawing action and precipitation, and this phenomenon should be continuously observed over the years by an installed monitoring system.
  • The continuously measured data from not only piezometers and integrated sensor packs, but also water potential sensors and Lidar, can be applied to update soil parameters and provide much of the information necessary to monitor slope behavior and to obtain some of the necessary parameters for mitigation and remediation.

Author Contributions

Y.S. is the first author who have done a conceptualization, draft writing, site investigation, sensor installation, and numerical analyses. J.C.C. has done funding acquisition, review and editing. S.Q. has done site investigation, review and editing. I.S. has done data acquisition and laboratory testing. J.-S.L. have done review and editing. J.S. has done funding acquisition and supervision. All authors have read and agreed to the published version of the manuscript.

Acknowledgments

This study was performed under a research contract between the Norwegian Geotechnical Institute (NGI) and Korea Infrastructure Safety and Technology Corporation (KISTEC) in connection with the project of “Development of site-inspection, risk assessment, monitoring and overall maintenance methods based on ICT technology for slope safety of Ice-melting season”. This research was funded by KISTEC (KAIA project number: 18CTAP-C145146-01). The authors would like to thank KISTEC and the Norwegian GeoTest Sites for access to the Øysand research site.

Conflicts of Interest

The authors declare no conflict of interest.

References

  1. Zwissler, B.; Oommen, T.; Vitton, S. A study of the impacts of freeze-thaw on cliff recession at the Calvert cliffs in Calvert county, Maryland. Geotech. Geol. Eng. 2014, 32, 1133–1148. [Google Scholar] [CrossRef] [Green Version]
  2. Heidari, M.; Torabi-Kaveh, M.; Mohseni, H. Assessment of the effects of freeze-thaw and salt crystallization ageing tests on Anahita temple stone, Kangavar, west of Iran. Geotech. Geol. Eng. 2017, 35, 121–136. [Google Scholar] [CrossRef]
  3. Yilmaz, F.; Fidan, D. Influence of freeze-thaw on strength of clayey soil stabilized with lime and perlite. Geomech. Eng. 2018, 14, 301–306. [Google Scholar] [CrossRef]
  4. Chamberlain, E.J.; Gow, A.J. Effect of freezing and thawing on the permeability and structure of soils. In Proceedings of the International Symposium on Ground Freezing, Bochum, Germany, 8–10 March 1978. [Google Scholar]
  5. Graham, J.; Au, V.C.S. Effects of freeze–thaw and softening on a natural clay at low stresses. Can. Geotech. J. 1985, 22, 69–78. [Google Scholar] [CrossRef]
  6. Korshunov, A.A.; Doroshenko, S.P.; Nevzorov, A.L. The Impact of Freezing-thawing Process on Slope Stability of Earth Structure in Cold Climate. In Proceedings of the 3rd International Conference on Transportation Geotechnics, Guimaraes, Portugal, 4–7 September 2016; Volume 143, pp. 682–688. [Google Scholar]
  7. Andersland, O.B.; Ladanyi, B. Frozen Ground Engineering, 2nd Edition ed. Available online: https://www.wiley.com/en-us/Frozen+Ground+Engineering%2C+2nd+Edition-p-9780471615491 (accessed on 16 June 2020).
  8. Harries, N.J.; Robert, H. The use of slope stability radar (SSR) In Managing SLOPE Instability Hazards. In Proceedings of the 1st Canada—US Rock Mechanics Symposium, Vancouver, BC, Canada, 27–31 May 2007; American Rock Mechanics Association: Alexandria, VA, USA, 27–31 May 2007. [Google Scholar]
  9. Pirone, M.; Papa, R.; Nicotera, M.V.; Urciuoli, G. In situ monitoring of the groundwater field in an unsaturated pyroclastic slope for slope stability evaluation. Landslides 2014, 12, 259–276. [Google Scholar] [CrossRef]
  10. L’Heureux, J.S.; Lunne, T.; Lacasse, S. Norway’s national geotest site research infrastructure (NGTS). In Proceedings of the 19th International Conference on Soil Mechanics and Geotechnical Engineering, Seoul, Korea, 17–21 September 2017. [Google Scholar]
  11. Geotech. Users Manual, Geotech PVT Direct Push Piezometer. Available online: http://www.geotech.eu/index.php/equipment/piezometer (accessed on 1 November 2019).
  12. Quinteros, S.; Gundersen, A.; L’Heureux, J.S.; Carraro, A.H.; Jardine, R. Øysand research site: Geotechnical characterization of deltaic sandy-silty soils. AMIS Geosci. 2019, 5, 750–783. [Google Scholar] [CrossRef]
  13. ASTM D2487-17. Standard Practice for Classification of Soils for Engineering Purposes, Unified Soil Classification System; ASTM International: West Conshohocken, PA, USA, 2017. [Google Scholar]
  14. Statens Vegvesens. Vegbygging Håndbok N200; Statens Vegvesens: Oslo, Norway, 2014.
  15. Ishihara, K. Soil Behaviour in Earthquake Geotechnics; Clarendon Press: Oxford, UK, 1996. [Google Scholar]
  16. Croney, D.; Jacobs, J.C. The frost susceptibility of soils and road materials. Nat. Acad. Sci. Eng. Med. 1967. [Google Scholar]
  17. Jin, H.W.; Lee, J.; Ryu, B.H.; Akagawa, S. Simple frost heave testing method using a temperature-controllable cell. Cold Reg. Sci. Technol. 2019, 157, 119–132. [Google Scholar] [CrossRef]
  18. Geostudio. An Engineering Methodology. Available online: http://www.geo-slope.com (accessed on 15 December 2019).
  19. Morgenstern, N.R.; Price, V.E. The Analysis of the Stability of General Slip Surfaces. Géotechnique 1965, 15, 79–93. [Google Scholar] [CrossRef]
  20. Decagon Devices. MPS-2 & MPS-6 Dielectric Water Potential Sensors, Operator’s Manual; Decagon Devices: Pullman, WA, USA, 2017. [Google Scholar]
  21. Korea Infrastructure Safety and Technology Corporation. Remote Monitoring System R&D Project; KISTEC: Seoul, Korea, 2016. [Google Scholar]
  22. NRK Meteorologisk Institutt. Available online: https://www.yr.no/en/statistics (accessed on 16 June 2020).
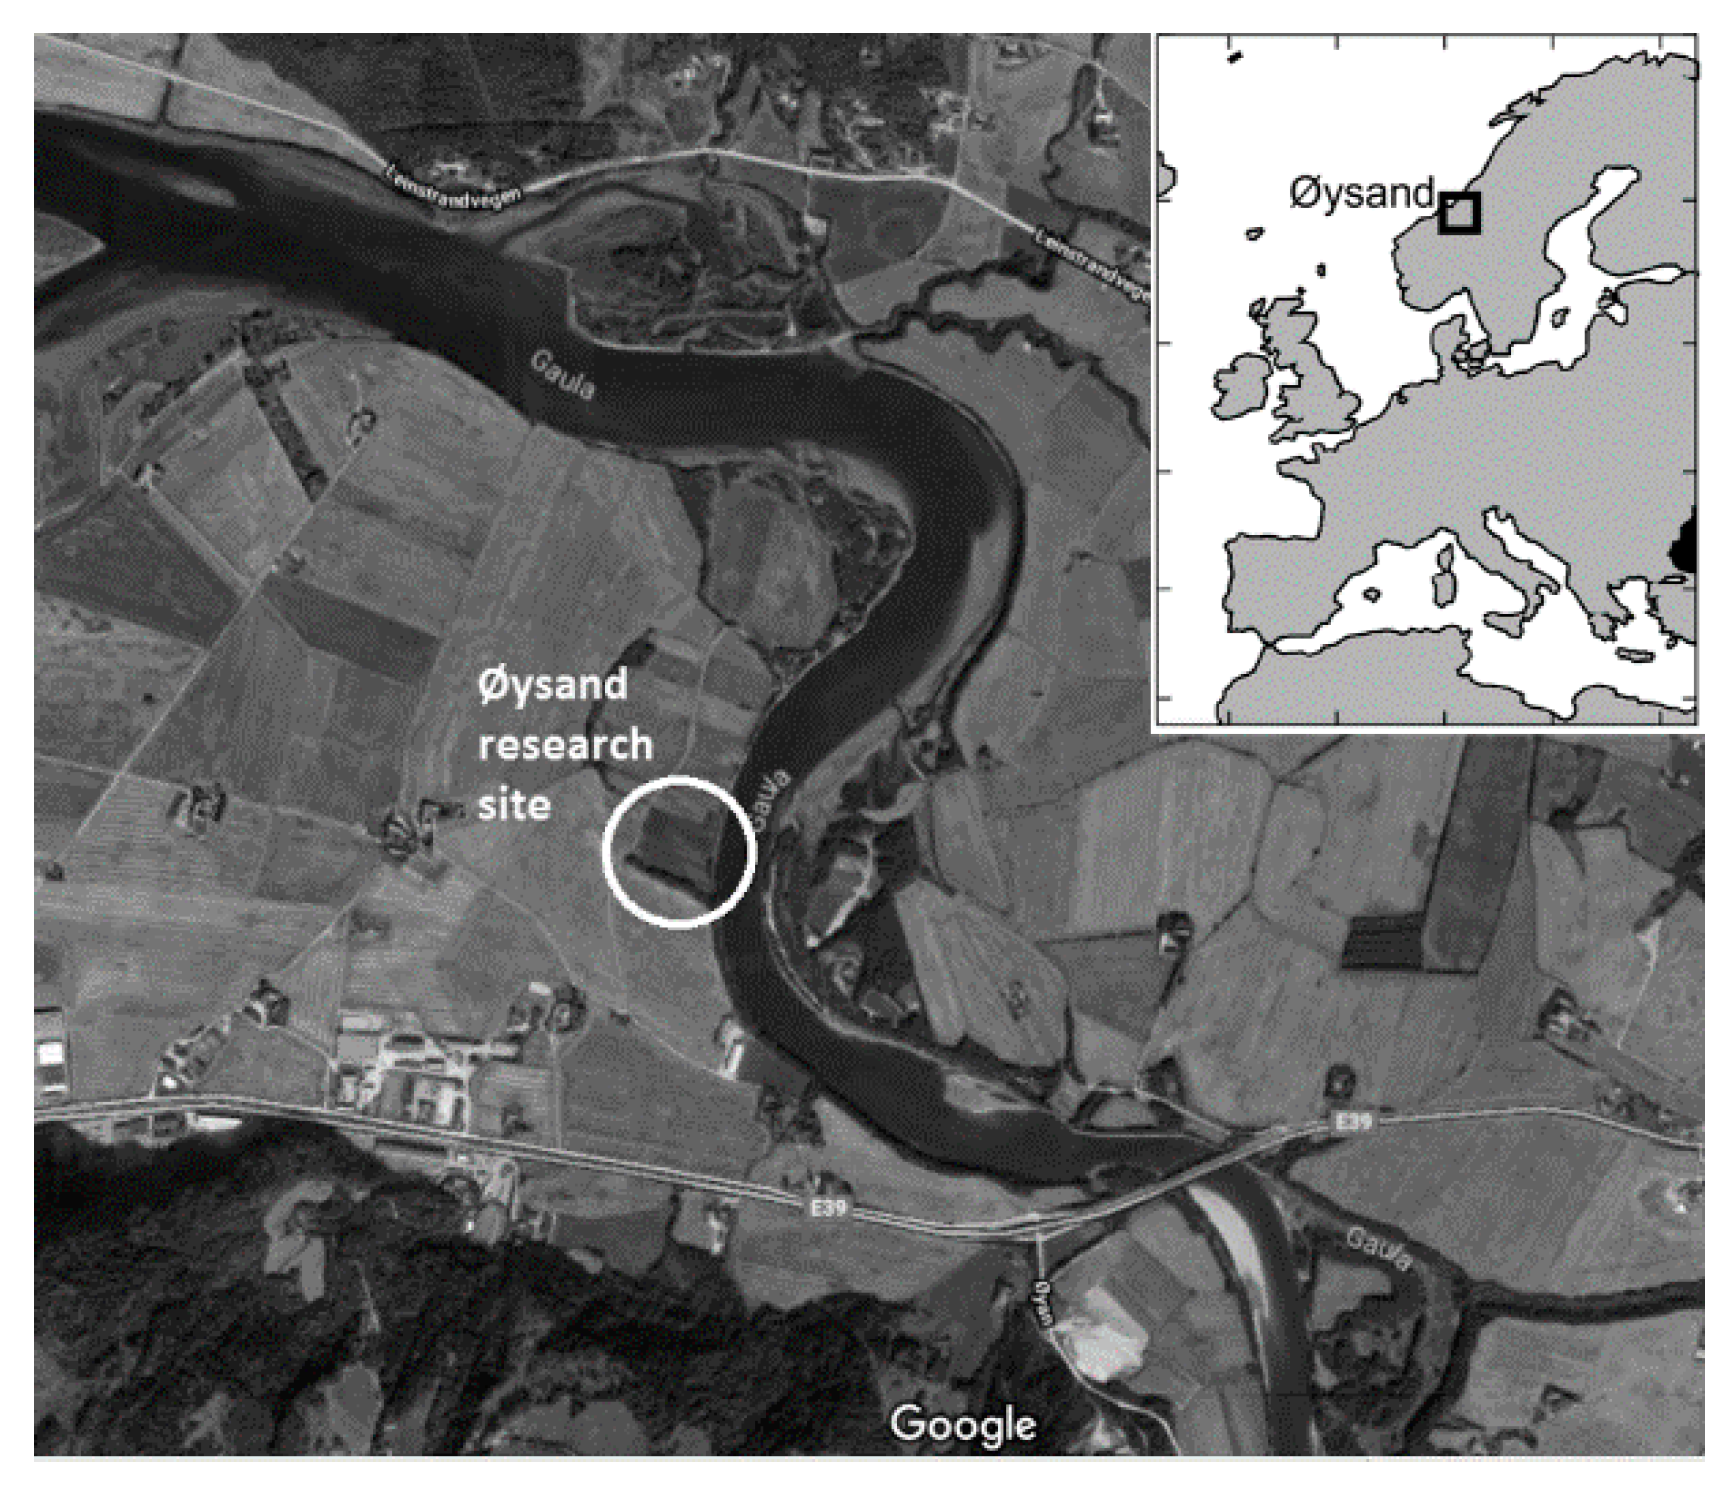
Figure 1. Location and geological map of Øysand research site (google.maps and www.ngu.no).
Applsci 10 04136 g001aApplsci 10 04136 g001b
Figure 2. Location of test slope and field tests at Øysand site.
Applsci 10 04136 g002
Figure 3. Cone penetration tests (CPTu)s close to the slope at Øysand: (a) qc, (b) fs, (c) u2, and (d) location of CPTu.
Applsci 10 04136 g003
Figure 4. Location of most relevant field tests for slope stability screening analysis. (a) rotary speed rate with depth; (b) rotary force with depth.
Applsci 10 04136 g004
Figure 5. Representative grain size distributions from the slope surface.
Applsci 10 04136 g005
Figure 6. (a) Soil heave test apparatus with temperature controller (NGI and KICT); (b) Sketch of temperature-controllable cell (modified from Jin et al.) [17]; (c) Frost heave results on ML and SW soils.
Applsci 10 04136 g006
Figure 7. (a) Location and (b) cross-section of the instrumented slope at Øysand.
Applsci 10 04136 g007
Figure 8. Thermal conductivity vs. temperature and unfrozen water content vs. temperature.
Applsci 10 04136 g008
Figure 9. Water conductivity vs. matrix suction and water content vs. matrix suction.
Applsci 10 04136 g009
Figure 10. (a) Temperature distribution in 2017–2018 and (b) difference in the factor of safety considering freeze–thaw influence.
Applsci 10 04136 g010aApplsci 10 04136 g010b
Figure 11. Test slope at Øysand Trondheim Norway: (a) 37 degree man-made test slope; (b) Layers of test slope; (c) inclinometer installation; (d) MPS-6 sensors; (e) Lidar system; (f) data logger box.
Applsci 10 04136 g011
Figure 12. Measured pore water pressure and ground temperature by PVT 1 and PVT 2.
Applsci 10 04136 g012
Figure 13. Slope stability analysis with measured data from test slope at Øysand site, Norway.
Applsci 10 04136 g013
Figure 14. Coupled analysis using the modules TEMP/W, SEEP/W, and SLOPE/W. (a) Full thermal model analysis, (b) seepage and slope stability analysis.
Applsci 10 04136 g014
Table 1. Best estimated soil parameters at the Øysand slope site.
LayerDepth (m)Soil Unit Weight (kN/m3)Friction Angle, φ′ (deg)Cohesion, c′ (kPa)Grain Size DistributionClassification
Gravel, %Sand, %Silt, %Clay, %
Unit I0–619.0-100.0-17.860.531.0Silty clay
Unit II6–10 19.030.0-61.826.40.3-Sand, gravel
Table 2. Summary of factors of safety depending on slope angles and groundwater tables.
Slop IDSlope Angle, degSlope Height, mFactor of Safety
Watertable GL-10 mWatertable GL-3 mWatertable GL-2 mWatertable GL-1 m
S-2222201.961.151.101.05
S-2425201.811.121.071.03
S-2727201.641.091.041.00
S-3030201.491.061.010.97
S-3435201.321.020.980.93
S-3940201.160.960.930.90
S-4545201.000.890.850.84
Table 3. Planning of sensors on the slope at Øysand.
SensorsNo. of SensorsIDDepth mLocations
PVT (Piezometer)4P-14.5Top of the slope
P-28.55Top of the slope
P-3 15Bottom of the slope
P-4 13Bottom of the slope
Temperature sensors (PVT)4P-14.5Top of the slope
P-28.55Top of the slope
P-3 15Bottom of the slope
P-4 13Bottom of the slope
Integrated sensor pack (wc, temparature, tilt)2I-11Top of the slope
I-22Halfway down the slope
Suction sensors (MPS-6)10S-1, S-20.25, 0.5Three-quarters of the way down the slope
S-3, S-40.5, 0.25Halfway down the slope
S-5, S-60.5Westernmost hole at the top of the slope
S-7, S-80.7Centre hole at the top of the slope
S-9, S-01.05Easternmost hole at top of the slope
Lidar/Radar1 set--10 m distance at the bottom
Air temperature, hygrometer1 set--Top of the slope
Precipitation measure1 set--Top of the slope
1 Two out of four PVTs will be installed afterwards.