Article

Characterization of Demolition Construction Waste Containing Asbestos, and the Release of Fibrous Dust Particles

1
Faculty of Civil Engineering, Technical University of Kosice, Vysokoskolska 4, 042 00 Kosice, Slovakia
2
Institute of Experimental Physics of the Slovak Academy of Sciences, Watsonova 47, 043 53 Kosice, Slovakia
*
Author to whom correspondence should be addressed.
Appl. Sci. 2020, 10(11), 4048; https://doi.org/10.3390/app10114048
Submission received: 14 May 2020 / Revised: 8 June 2020 / Accepted: 10 June 2020 / Published: 11 June 2020
(This article belongs to the Section Civil Engineering)

Abstract

:
This paper focuses on the characterization of demolition construction waste containing asbestos fibers and the monitoring of fibrous dust released from asbestos–cement products (ACPs) during their removal from a three-story industrial building. Asbestos-containing products removal was carried out according to a demolition management system in terms of protection of workers. The results of a chemical analysis, X-ray diffraction analysis, infrared analysis and scanning electron microscopy of demolition waste samples confirmed the same material quality of asbestos–cement (AC) elements used throughout the building. In addition, a MgO/SiO2 ratio corresponding to a serpentine silicate mineral of chrysotile was detected by means of X-ray fluorescence analysis. Also, crystalline phase calcium silicates and calcium carbonates from the cement matrix were identified in the AC waste. The relatively large differences in the elemental analysis between the sample area and the individual points found by energy-dispersive X-ray spectroscopic mapping are related to the composition heterogeneity. The highest content of magnesium occurs where asbestos fibers predominate in the cement matrix. The measured number concentrations of asbestos fibers before, during, and after asbestos–cement products removal were compared to outdoor concentrations. Indoor concentrations of asbestos fibers during the removal of AC materials did not exceed the permissible limit for a working environment (1000 fibers per one m3), except in three spots out of all the working sites inside the building. A relationship between the number and mass concentrations of asbestos dust is shown.

1. Introduction

Removal of asbestos–cement products/materials (ACPs/ACMs) from old buildings is companied by the release of asbestos microfibers from the cement matrix and represents a serious problem for environmental and occupational health [1,2]. Asbestos dust is one of the most dangerous types of dust formed during demolition work and poses a risk for workers’ health [3,4]. On the basis of the World Health Organization campaign to ban asbestos usage because of its negative health impacts [5], more than 52 countries respected this requirement. The production of asbestos-containing materials has declined in all the member countries of the European Union due to the introduction of strict regulations for exposure and/or outright bans on exposure in 1999 [6]. Some Asian and less-developed countries in the world refused to ban it [7,8,9].
Asbestos-fiber emissions are respirable fractions of the total fibrogenic aerosols present in the lower layers of the atmosphere [10]. The term respirable asbestos fibers means asbestos fibers with a diameter of less than 3 μm, a length greater than 5 μm, and an aspect ratio (length-to-diameter ratio) greater than 3:1. The exposure caused by disturbing an asbestos-containing product occurs through inhalation of respirable fibers present in the working environment air into the lungs and depends mainly on fiber diameter and length. The practice of monitoring and controlling work environments in terms of the presence of such hazardous particles of asbestos dust is very important to ensure occupational hygiene [11]. The Occupational Safety and Health Administration (OSHA) determined the permissible exposure limit (PEL) as the normalized average concentration of asbestos fibers in the air over 8 h work shifts. This value was gradually reduced to 0.1 cm−3 [12] in accordance with the occupational exposure limit for airborne asbestos in workplaces in European Union countries [13,14].
To the best of our knowledge, there is limited workplace air-monitoring data of asbestos dust emissions during the removal of asbestos-containing products in buildings [15,16,17]. Exposure to respirable asbestos fibers at various stages of removal work was investigated [15,18]. The levels of released asbestos fibers present during ACMs demolition inside buildings vary from very low concentrations to relatively high concentrations [18,19,20,21,22,23].
Contrary to studies related to knowing the exposure to respirable asbestos fibers in the indoor working environment [4,15,18,19,20,24,25] and its impact on human health (asbestosis, lung cancer, and mesothelioma [26,27,28,29,30,31,32,33,34], there is a lack of published work in the area of development of new strategies and policies for demolition asbestos waste management [7]. Some studies tried to quantify the issue of waste management following a disaster [35]. However, the safe management of asbestos-containing products removal, including a survey of the occurrence in buildings, and measurements of the amount of asbestos fibers present in the indoor working air before, during, and after demolition, is a matter of considerable importance [15,18,36]. To minimize the continual asbestos presence in an indoor environment during the ACMs removal process, there is a need to have a monitoring plan of the indoor and outdoor environment for mineral dust and asbestos fibers concentration [37].
Therefore, the aim of this work was to study the safety of the indoor environment during a professional performed demolition and the removal of asbestos–cement (AC) partitions from the selected building. This paper reports the results of the monitoring of the released asbestos particles from composite structures during the removal of the construction elements containing asbestos fibers, as well as chemical and phase compositions, and micro structural morphology of ACMs samples.

2. Materials and Methods

2.1. Building Containing Asbestos–Cement (AC) Materials

A three-story industrial building with a floor plan of 55 × 15 m, located in the East Slovakia, was selected for this study. It contained AC partitions as was confirmed by a thorough inspection of the entire building by a qualified person who detected asbestos fibers in the construction systems. The thin AC boards from the 80 windows were removed from rooms, and dismantling of AC partitions, separating individual rooms was undertaken on the 1st floor and 2nd floors. About 20,000 m2 of AC materials were removed from this building. Demolition waste sampling was performed on different locations in the three-story industrial building, and average samples were used for their representative characterization.

2.2. Characterization of Demolition Asbestos-Containing Waste

As is well known, the application of a detection strategy for asbestos-containing materials in demolition waste is very important in order to control their presence in subsequent possible recycling processes [38].
Three representative samples after crushing and milling in a laboratory ball mill to a powder of particle size less than 40 μm, were subjected to X-ray fluorescence chemical analysis (SPECTRO iQ II; Bruker, Germany) to determine the main chemical components.
A TESCAN MIRA 3 FE scanning electron microscope (SEM) (Brno, Czech Republic) with a Schottky emitter for high-resolution images was used to observe the surface morphology. The samples were glued onto carbon-adhesive films coated with a gold layer using a vacuum-sputtering coater to avoid charging them under the electron beam. The accelerating voltage of the SEM was 10 kV. SEM micrographs were taken at five different magnifications (31; 115; 138; 298; and 505). The determination of the elemental chemical composition of samples was performed by an energy-dispersive X-ray unit (EDS).
Fourier transform infrared spectra (FTIR) were measured on an Alpha Bruker Platinum-ATR (attenuated total reflectance) spectrometer within the wave number range 4000–400 cm−1 at a resolution of 4 cm−1. A total of 24 scans were taken for each sample.
The phase analysis of the samples has been performed using a Bruker D2 Phaser X-ray powder diffractometer (Bruker AXS, GmbH, Germany) in Bragg Brentano geometry. The diffraction patterns were recorded using CuKα radiation (λ = 0.154060 nm), Ni Kβ filters, and a scintillation detector at a voltage of 30 kV and a current of 10 mA. The X-ray diffraction (XRD) patterns include the data collected over an angular range 10° < 2Θ < 80° with step size of 0.01° (2Θ) and step time of 20 s. The XRD patterns were processed using the software Diffrac. EVA v4.2.2. The ICDD PDF (The International Centre for Diffraction Data, Powder Diffraction File) database (version 2 Release 2009) was utilized for the phase identification.

2.3. Sampling Plan for Measuring Asbestos Dust

For measuring asbestos-fiber concentration in indoor air, a detailed sampling plan was carefully elaborated. This plan included the designation in the rooms of the monitored building in which the sampling was performed, the distribution of sampling posts, the sampling schedule (averaging time), the sample volume, and blank sampling in accordance with the intended measurement goal.

2.4. Sampling Posts for Quality Monitoring of Indoor Air

The optimal air sampling points in the building with asbestos-containing building materials in smaller and larger spaces were determined after screening the occurrence and type of asbestos-containing materials used in the entire building and the location of the ventilation systems and the workers´ activities. Where asbestos-containing material was present, multiple samples were taken. In asbestos-free areas, comparative samples were sampled. The set of sampling sites on each floor of the building was determined by the number and size of rooms using an empirical Equation (1) [39].
n = 14A/(730 + A)
where n is unit number of individual rooms, and A is total area of rooms. Seven dust sampling sites were calculated for the total area of rooms (Table 1).

2.5. Sampling of Released Asbestos Dust

Two parallel samplers were used for the collection of asbestos dust: one for gravimetric determination of dust concentration (mg/m3) and a second for fiber counting (m−3). Asbestos particulate samples from contaminated air were collected on a 25 mm diameter cellulose nitrate membrane filter (Synpor 3) with a pore size of 1.2 μm (Milipore, UK) inserted into the holder of the sampling apparatus MCS-10. The sampler was located in the breathing zone (at a height of 1.5 m from the ground) using a calibrated low flow pump set at a flow rate of 1 L/min before, during, and after the removal of the AC elements. The sampling of the indoor air was undertaken under conditions which ensure a uniform collection of representative samples (at closed windows and doors due to undesirable air exchange) on all determined sites in the building.
The sampling time was programmed so that the amount of collected air was 1000–2000 L and concentrations of asbestos fibers in the air were recalculated for 8 h (time-weighted average) in terms of the level at which a person can be exposed. The total number of collected dust samples was 174 (Table 1). The first series of dust collections was performed during normal operation before the dismantling of the AC materials in the building, which is considered as an indoor background value. Air sampling was carried out inside the buildings before, during, and after the removal of the AC products, as well as in the ambient and indoor air after completing the dismantling work. Exterior air sampling to determine the airborne fiber concentration in the immediate vicinity of the building exterior was carried out during similar weather conditions (dry and windless weather) because the concentration of fibers in the air is strongly dependent on them [40]. A triple repetition of air sampling in the outdoor areas was performed. The asbestos dust concentration was determined from the difference in filter weights before and after the measurements.

2.6. Determining the Number and Mass Concentration

Optical microscopy with phase contrast [41] was used to calculate the number concentration of asbestos fibers in the occupational environment. Since this method allows one to identify only the fibers with a diameter exceeding 5.0 µm, a scanning electron microscope capable of identifying fibers with a thickness in the range of 0.2 to 3.0 µm was used as well [42,43]. Numerous fiber concentration determinations were performed on areas randomly distributed on the filter, with the area being a minimum of 1 mm2 [43].
Mean values of number concentration of fibers in the air were calculated as the ratio of the resulting number of fibers on the filter and the corresponding volume of sampled air. The mass concentration of asbestos dust was determined from the difference in weight between the clean filter and the filter with trapped dust particles.

2.7. Removal of Asbestos–Cement Materials (ACMs)

ACM removal was performed by an accredited company with the appropriate authorization according to the procedure defined in the standards that guarantees a proper and safe technological process of dismantling and the subsequent safe storage of the resulting asbestos waste in a hazardous waste landfill [44]. Demolition waste containing asbestos was properly encapsulated for the fixation of asbestos fibers. The asbestos waste thus secured was placed in an impermeable high-strength plastic bag labeled asbestos. This was then placed in special containers for hazardous waste.
In the demolition area where removal of parts of the construction containing AC materials took place (the so-called controlled zone, CZ), it was necessary to adhere to a special regime (no eating, drinking, and smoking). This zone was clearly marked, indicating that work with asbestos was under way and entry of unauthorized persons was not permitted [45].
A personnel decontamination system (PD) was located before the CZ. This space consisted of a set of chambers arranged one after another, where workers changed their clothes to/from protective working clothes and equipment at the entry/exit to/from the CZ. Decontamination of working clothes and respirators and total cleansing of workers always took place on their exit of the CZ in the PD space. One chamber in the PD space was connected to a HEPA (High-efficiency particulate air)filtering device so there was no leakage of asbestos fibers outside the decontamination area.
In addition to the personnel decontamination system, a material zone (MZ) consisting of two chambers was established. It served to collect disassembled and penetrated asbestos waste material sealed in closed airtight bags. This waste was subsequently transported from the CZ to an intermediate landfill located outside the CZ, and from there it was loaded into the containers and further transported to the predetermined landfill.
Final cleaning of all areas and spaces was performed with powerful vacuum cleaners after AC materials’ removal and air exchange was ensured. These work activities were performed over approximately six months. After completing these activities, the final control measurements of the number concentration of respirable asbestos fibers were taken [46,47].

3. Results and Discussion

3.1. Characterization of AC Waste

The AC waste was subjected to chemical and phase analyses, and a morphological study together with mapping of the distribution of elements in the sample to determine both the content of asbestos and its distribution in the cement matrix using adequate methods.

3.1.1. Chemical Composition and Surface Morphology of AC Waste

No significant differences in the chemical composition of the representative AC waste samples were recorded (Table 2). This confirmed the use of the same material in the construction of the entire building. The CaO, SiO2, and MgO are the main components related to cement and the asbestos raw minerals.
The content of MgO (5.62 wt.%,on average) in the AC samples is probably related to asbestos, where magnesium atoms are coordinated with oxygen atoms in the serpentine silicate [27]. The stoichiometric percentage of MgO and SiO2 in chrysotile as the dihydrate of magnesium silicate Mg3Si2O5(OH)4 is almost the same (43.63 wt.% MgO and 43.36 wt.% SiO2). Therefore, it can be estimated that about 5.58 wt.% of the total SiO2 content (20.04 wt.%, on average—Table 2) comes from asbestos. The determined amounts of these oxide components are very similar to the data published in [48,49,50,51] and in a good agreement with the Mg/Si ratio for chrysotile.
The Mg/Si ratio as the characteristic indicator for natural chrysotile is 0.712 [52]. In our case, the ratio of these main elements (Table 2) is lower (0.362) because the Si is also bounded in silicates present in the cement matrix.
The CaO/SiO2 ratio in AC sample is 1.987. However, the CaO/SiO2 ratio converted to the SiO2 content belonging to the cement is 2.75. This value found by our determination falls within the range of the CaO/SiO2 ratio (3.1 to 2.68) in Portland cement (type I).
The presence of Al2O3, Fe2O3 and other oxides is related to cement and the asbestos raw material. The amount of chlorine found in the samples proves that some hydroxyl ions in the chrysotile structure had been substituted with chlorine ions.

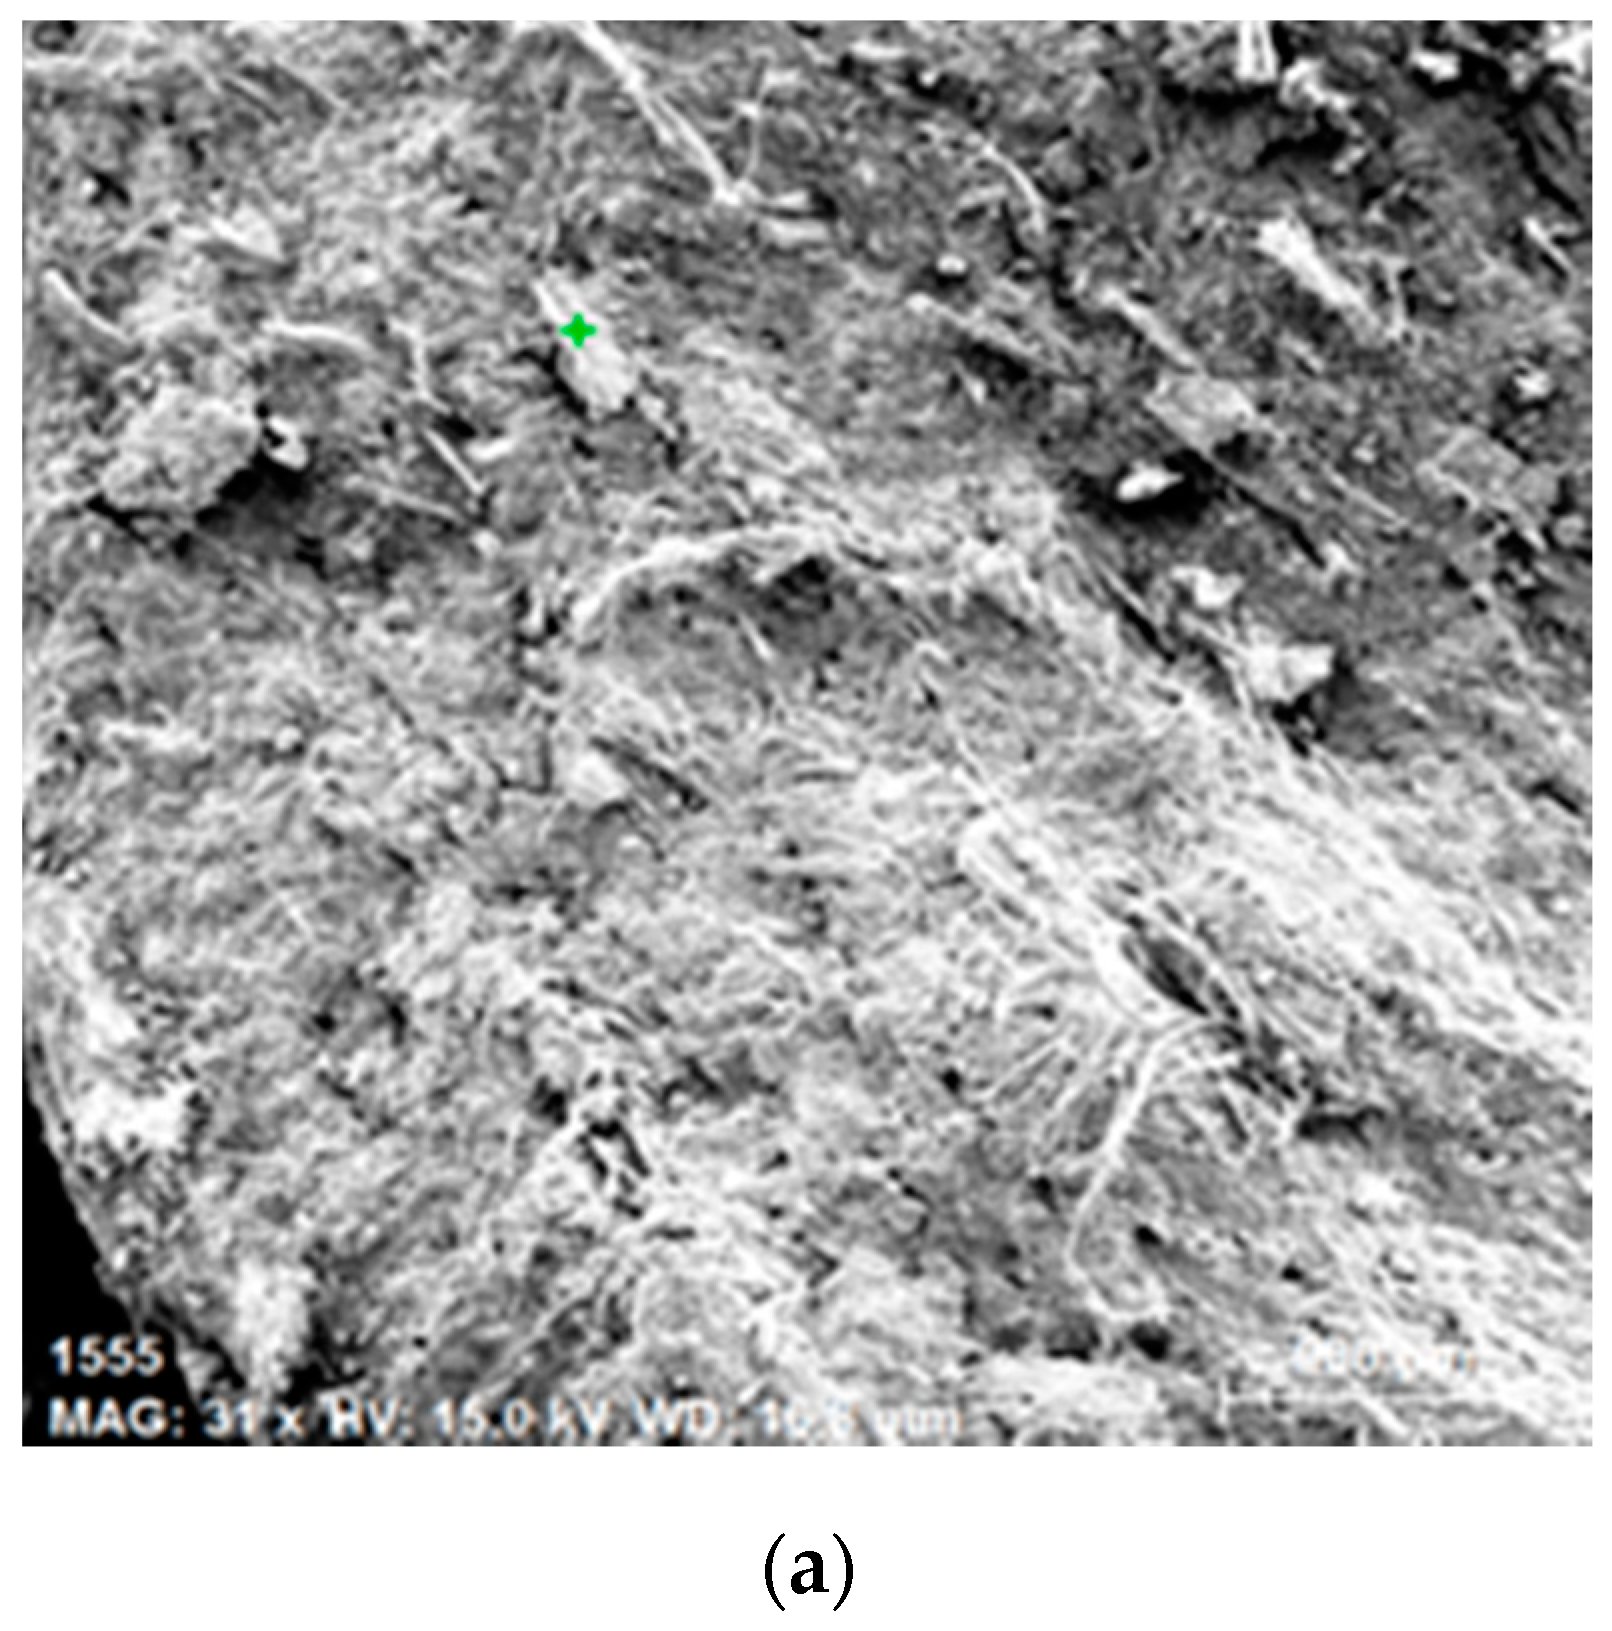
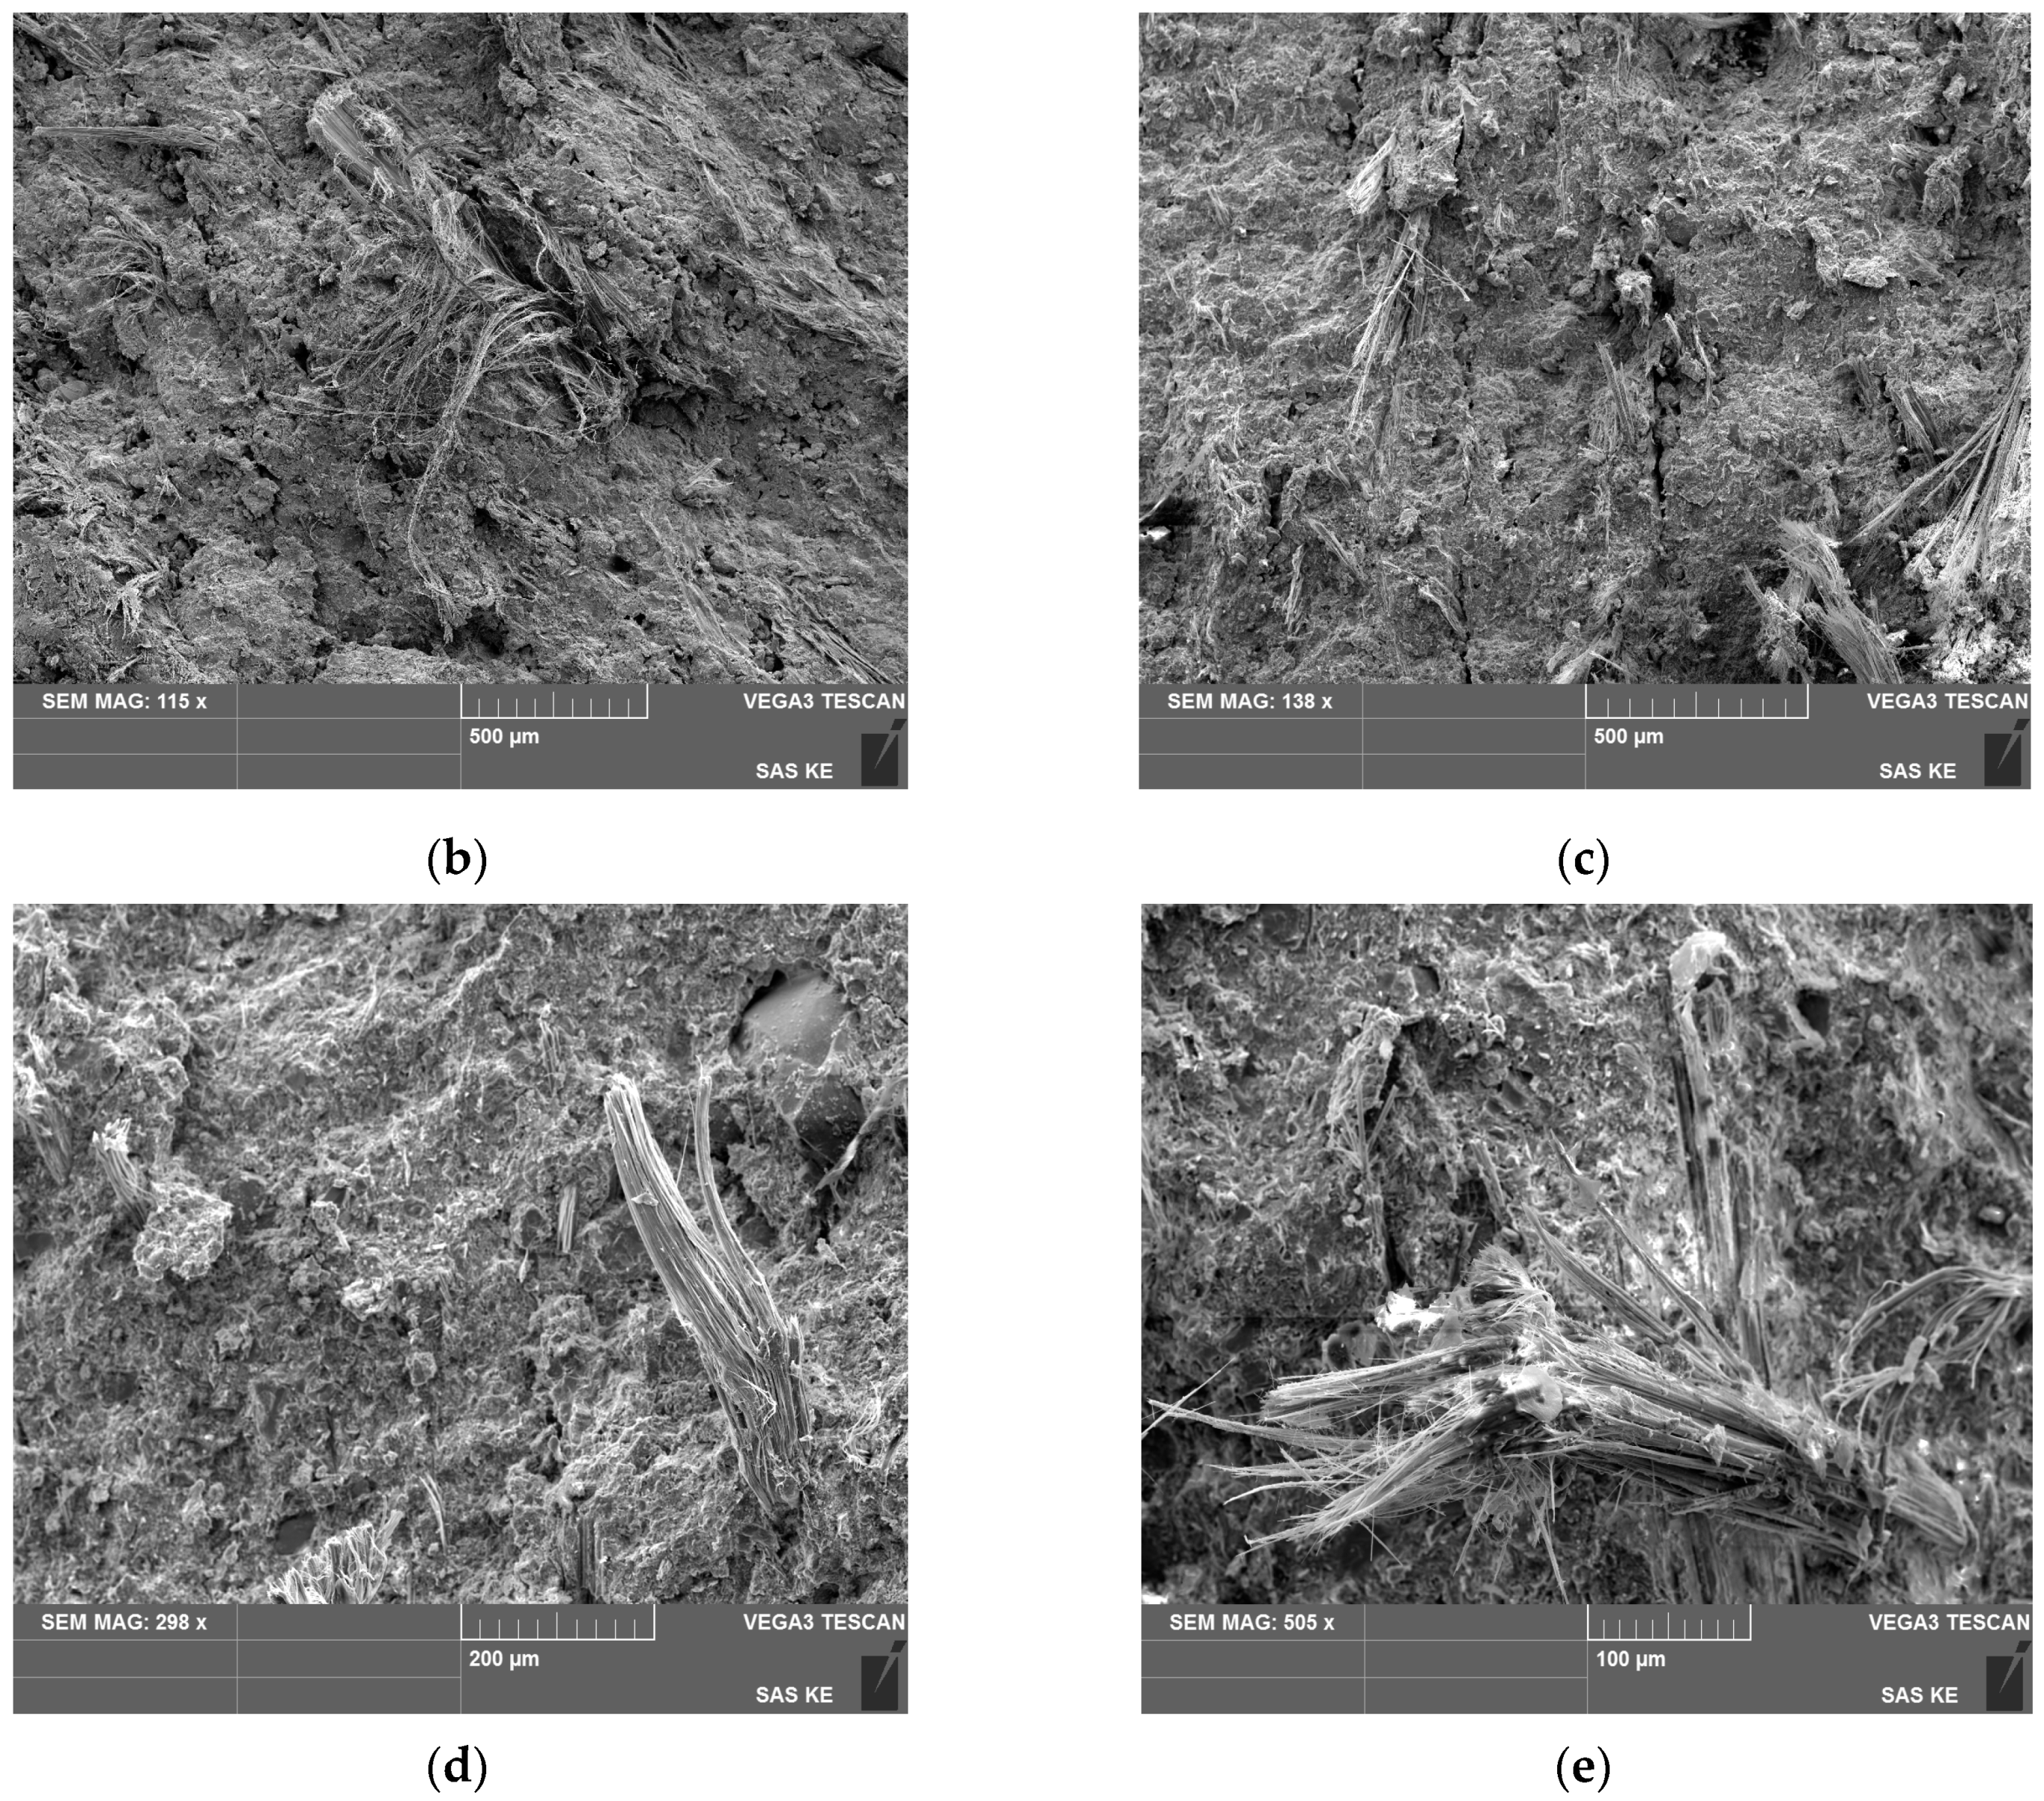
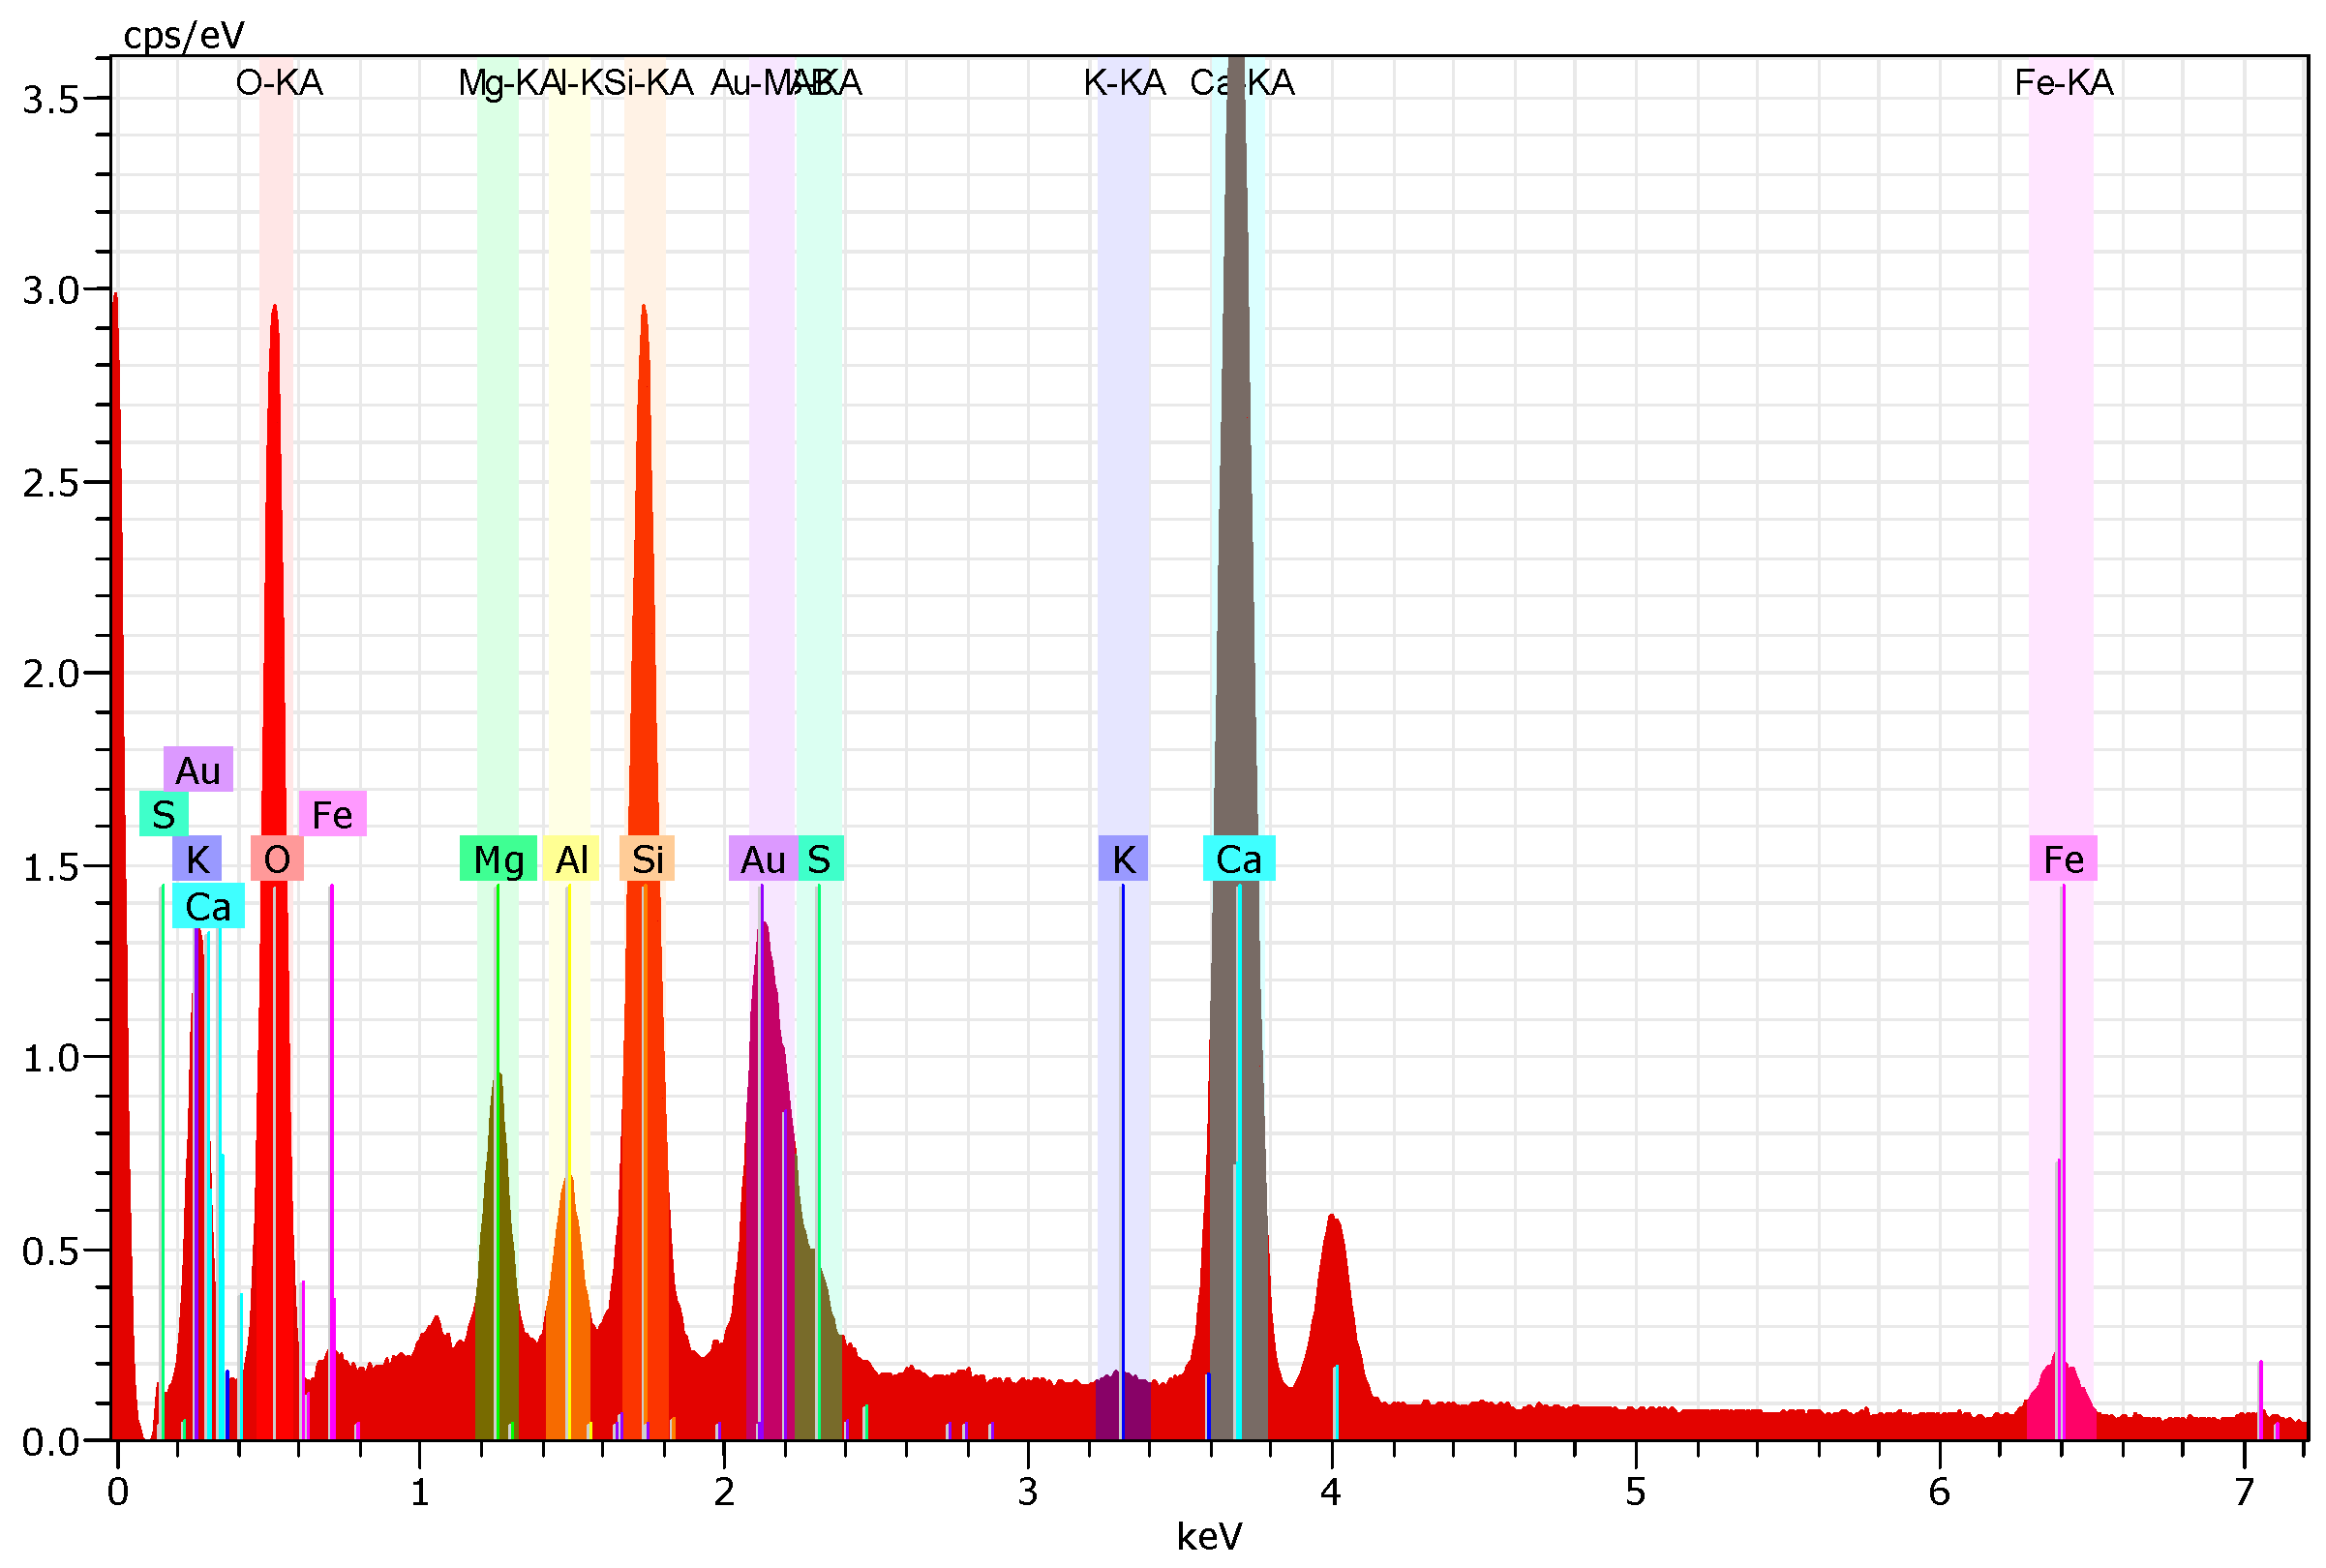
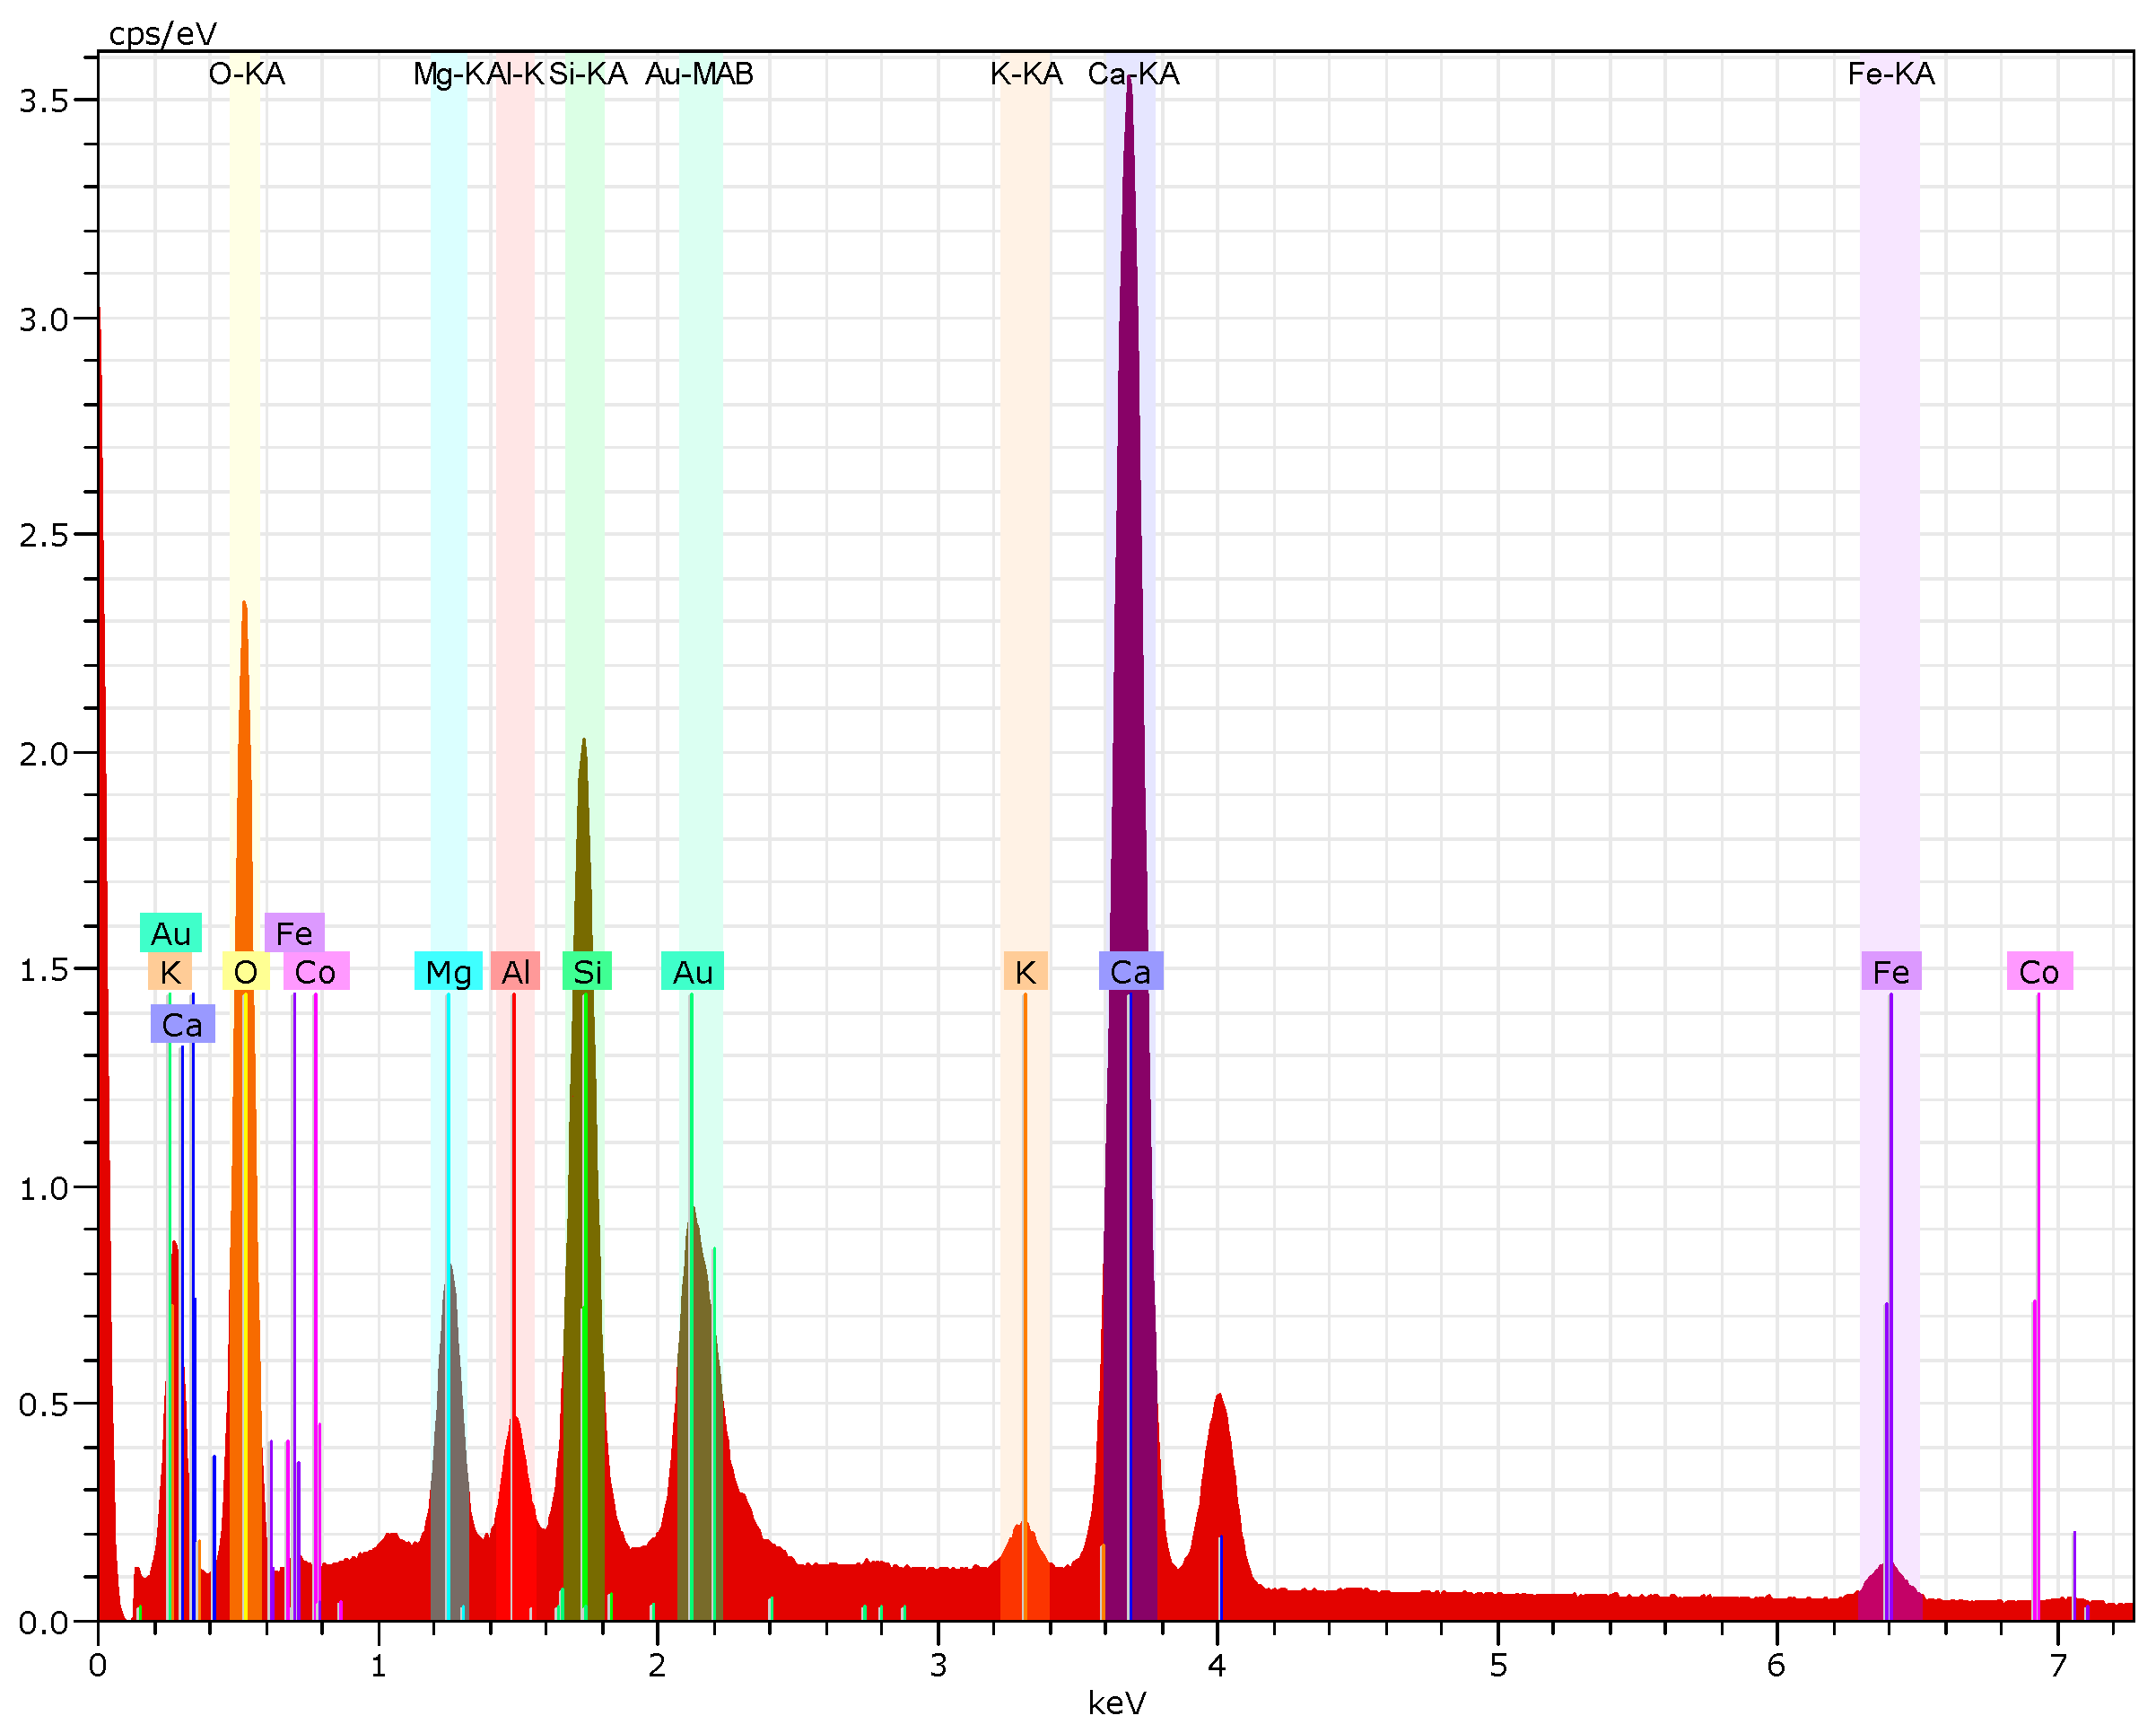
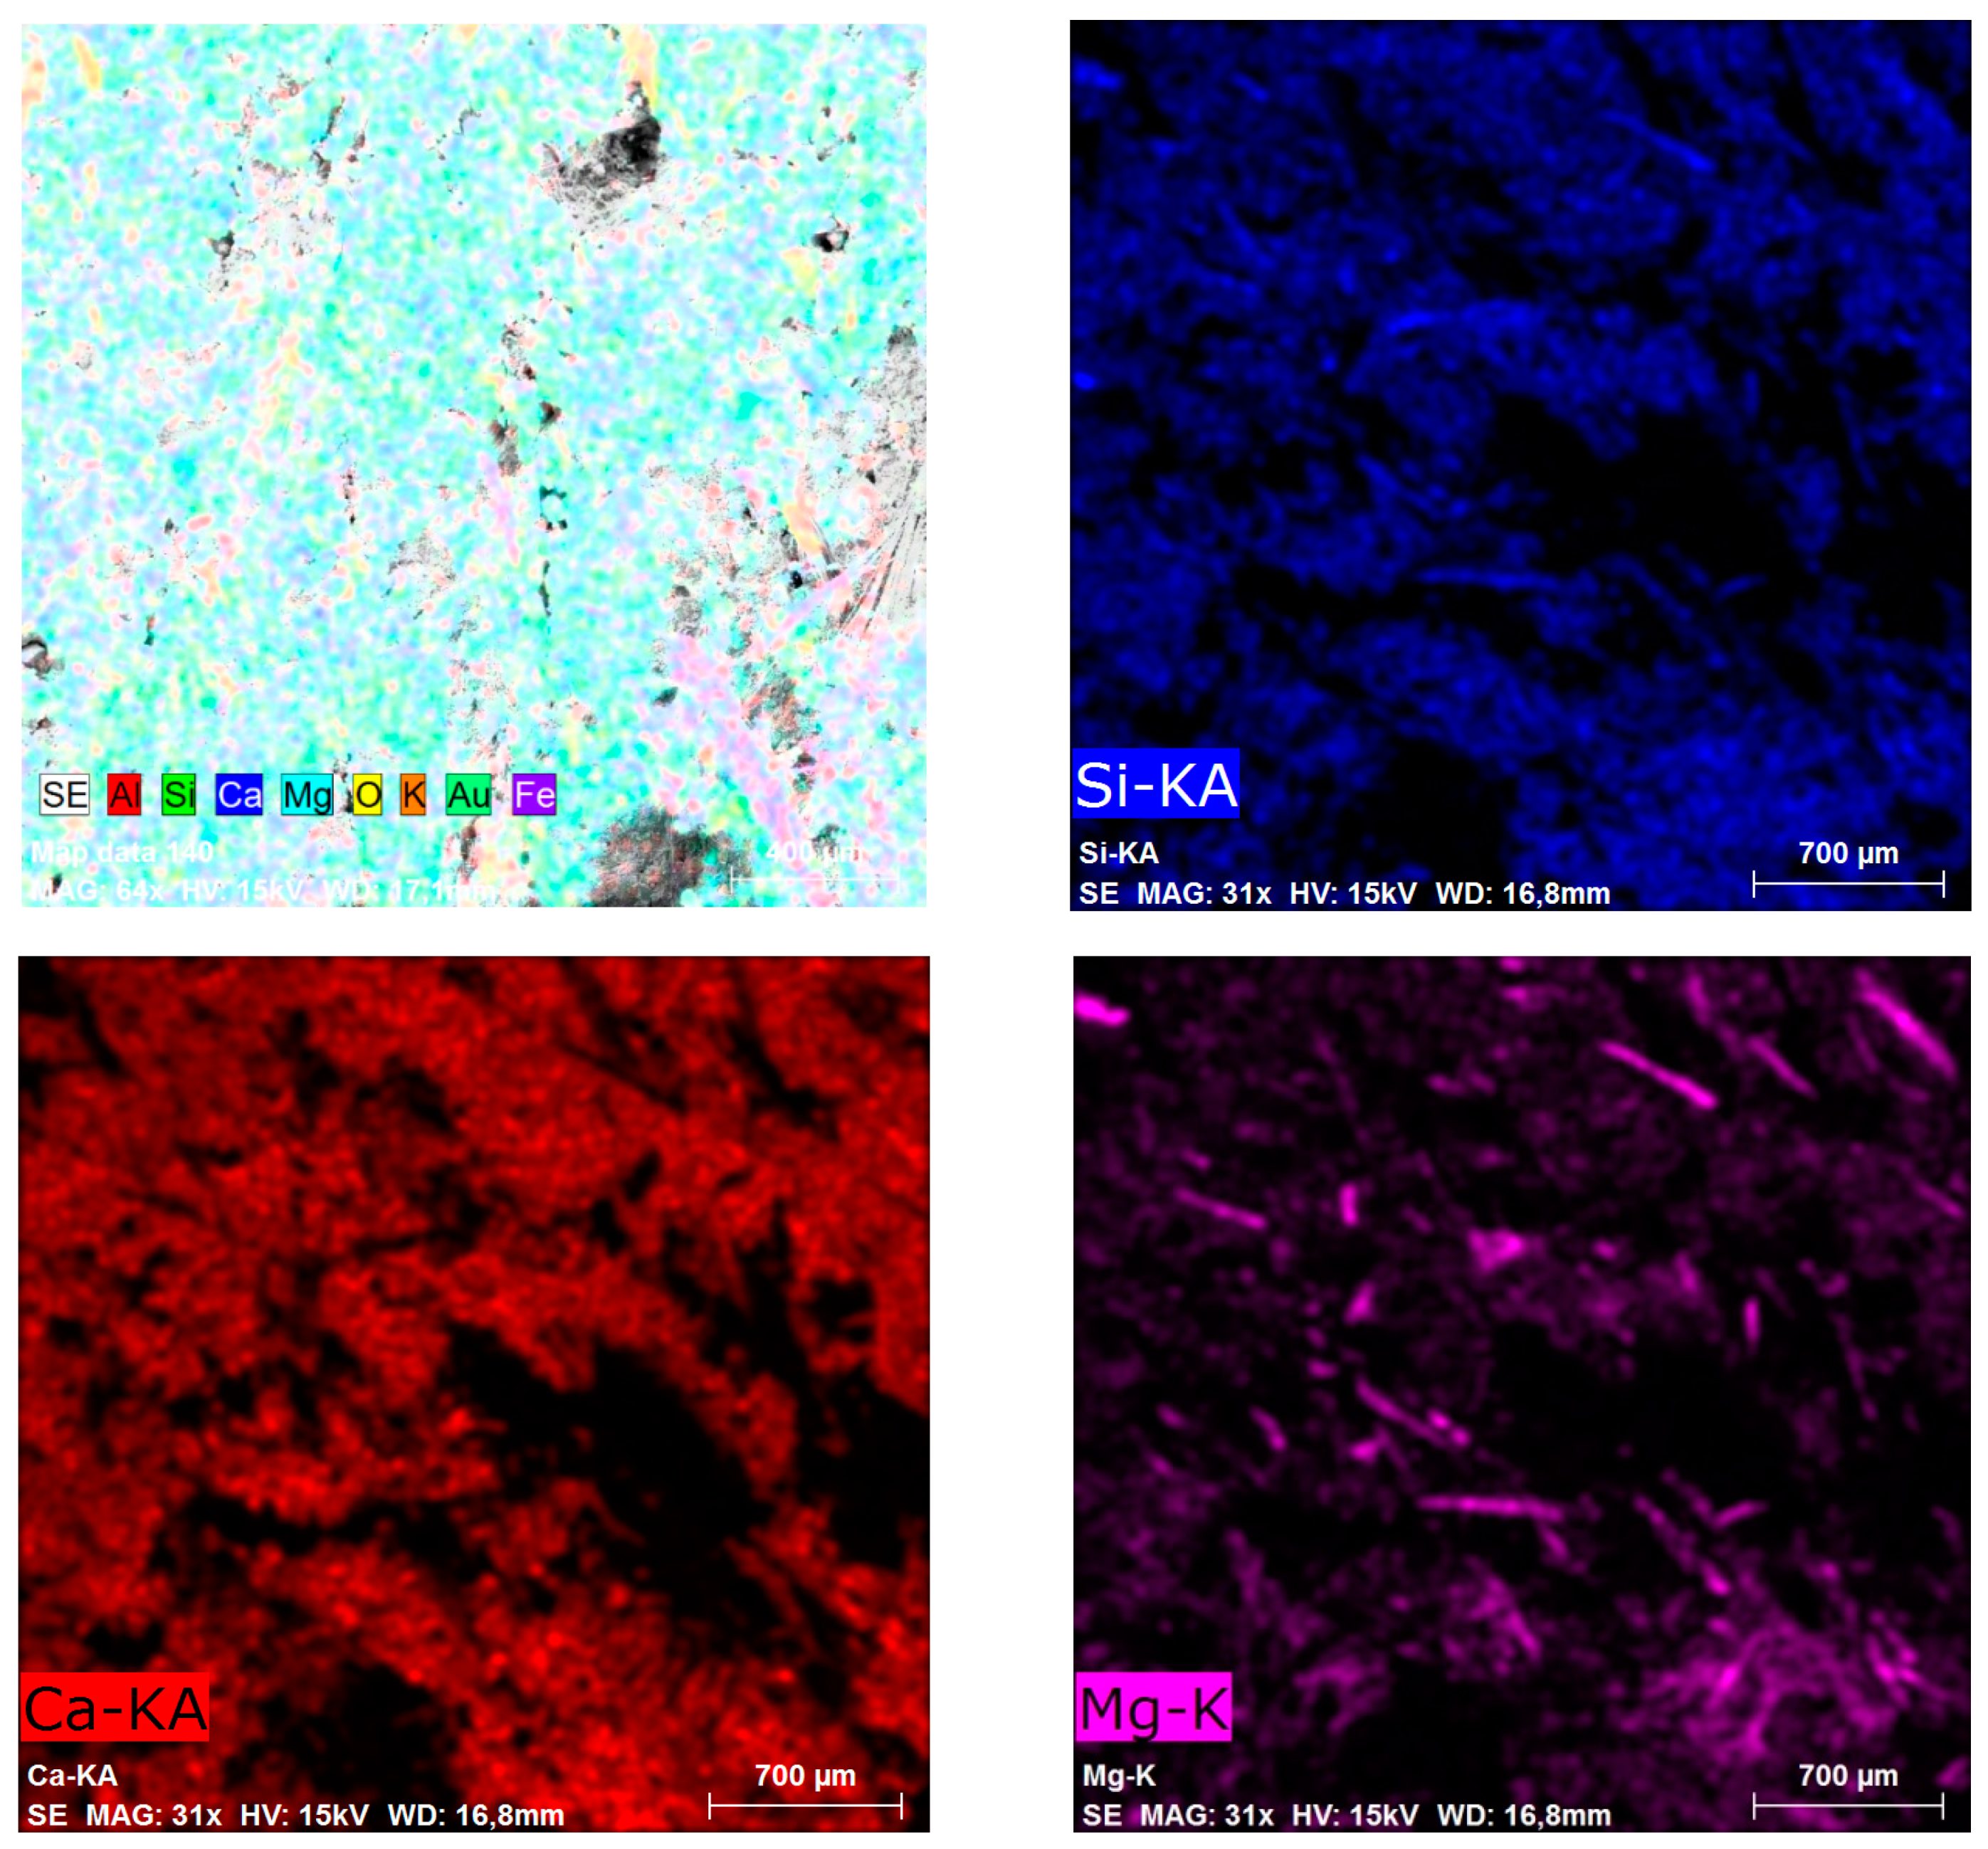
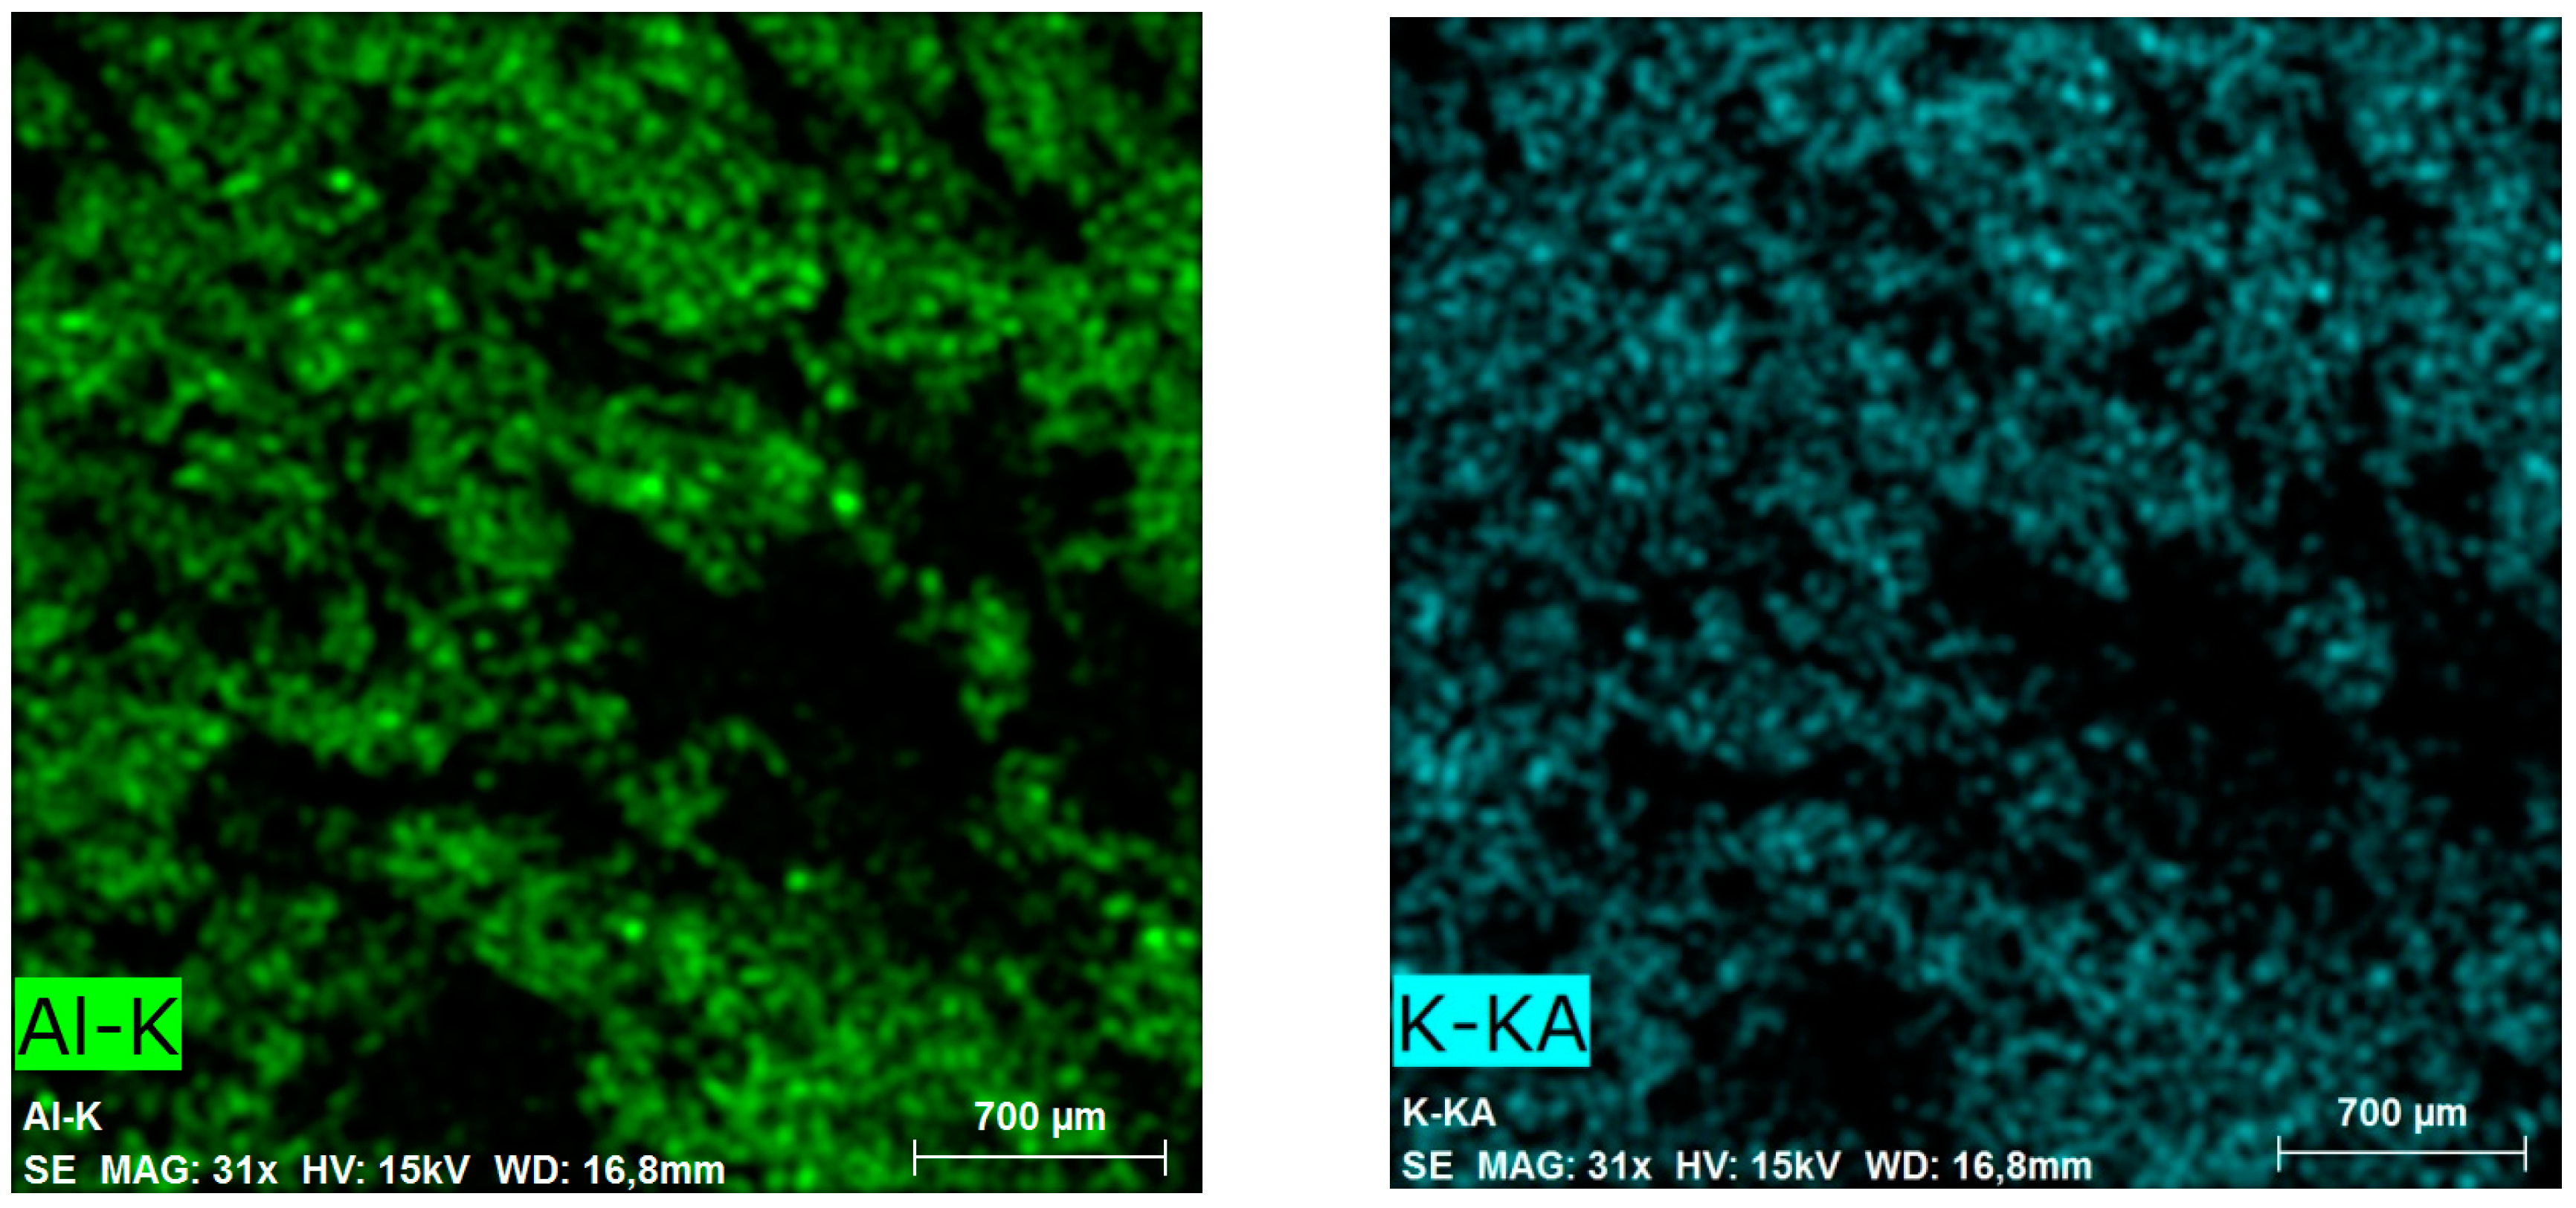
3.1.2. Scanning Electron Microscopy (SEM) and Energy-Dispersive X-ray Spectroscopy (EDS) Investigations of AC Waste

The correctness of the X-ray fluorescence (XRF) results of ACMs was also controlled by SEM investigations; this was, based on EDS determining and mapping the element distributions through the color and morphology characteristics of asbestos.
The morphological study of the asbestos–cement sample surface at various magnifications (Figure 1a–e) showed the rough and inhomogeneous distribution of asbestos fibers.
At some locations on the surface of this compact composite material sample, bundles of asbestos fibers composed of primary fibers are clearly visible. The length of the fibers exceeded a few hundred micrometers and their thickness was less than 1 μm. EDS analysis was carried out on the whole area of the samples, see Figure 1c,e.
Typical EDS spectra of the samples (Figure 1c,e) are shown in Figure 2 and Figure 3. The elemental analysis of the areas shows some differences in the proportion of the characteristic elements found on and near the surface of the samples. In accordance with the XRF data, the EDS spectra show the major elements from the cement matrix and chrysotile fibers of the AC samples. Low contents of elements such as K, S and Co were observed resulting from foreign matter.
The resulting contents obtained from the whole area of the asbestos–cement samples (Figure 1c,e) and point marked with a green cross (see Figure 1a) are compared in Table 3.
Relatively large differences in the elemental analysis of the sample area and the individual point on the micrographs of different magnification were recorded. These differences observed in the content of elements are related to the composition heterogeneity. The highest content of magnesium was in the place where asbestos fibers predominate in the cement matrix.
The distribution of all and the selected elements on the whole area of the AC sample identified by EDS mapping is illustrated in Figure 4. Here, the inhomogeneity of the fiber bundles’ distribution can be observed.

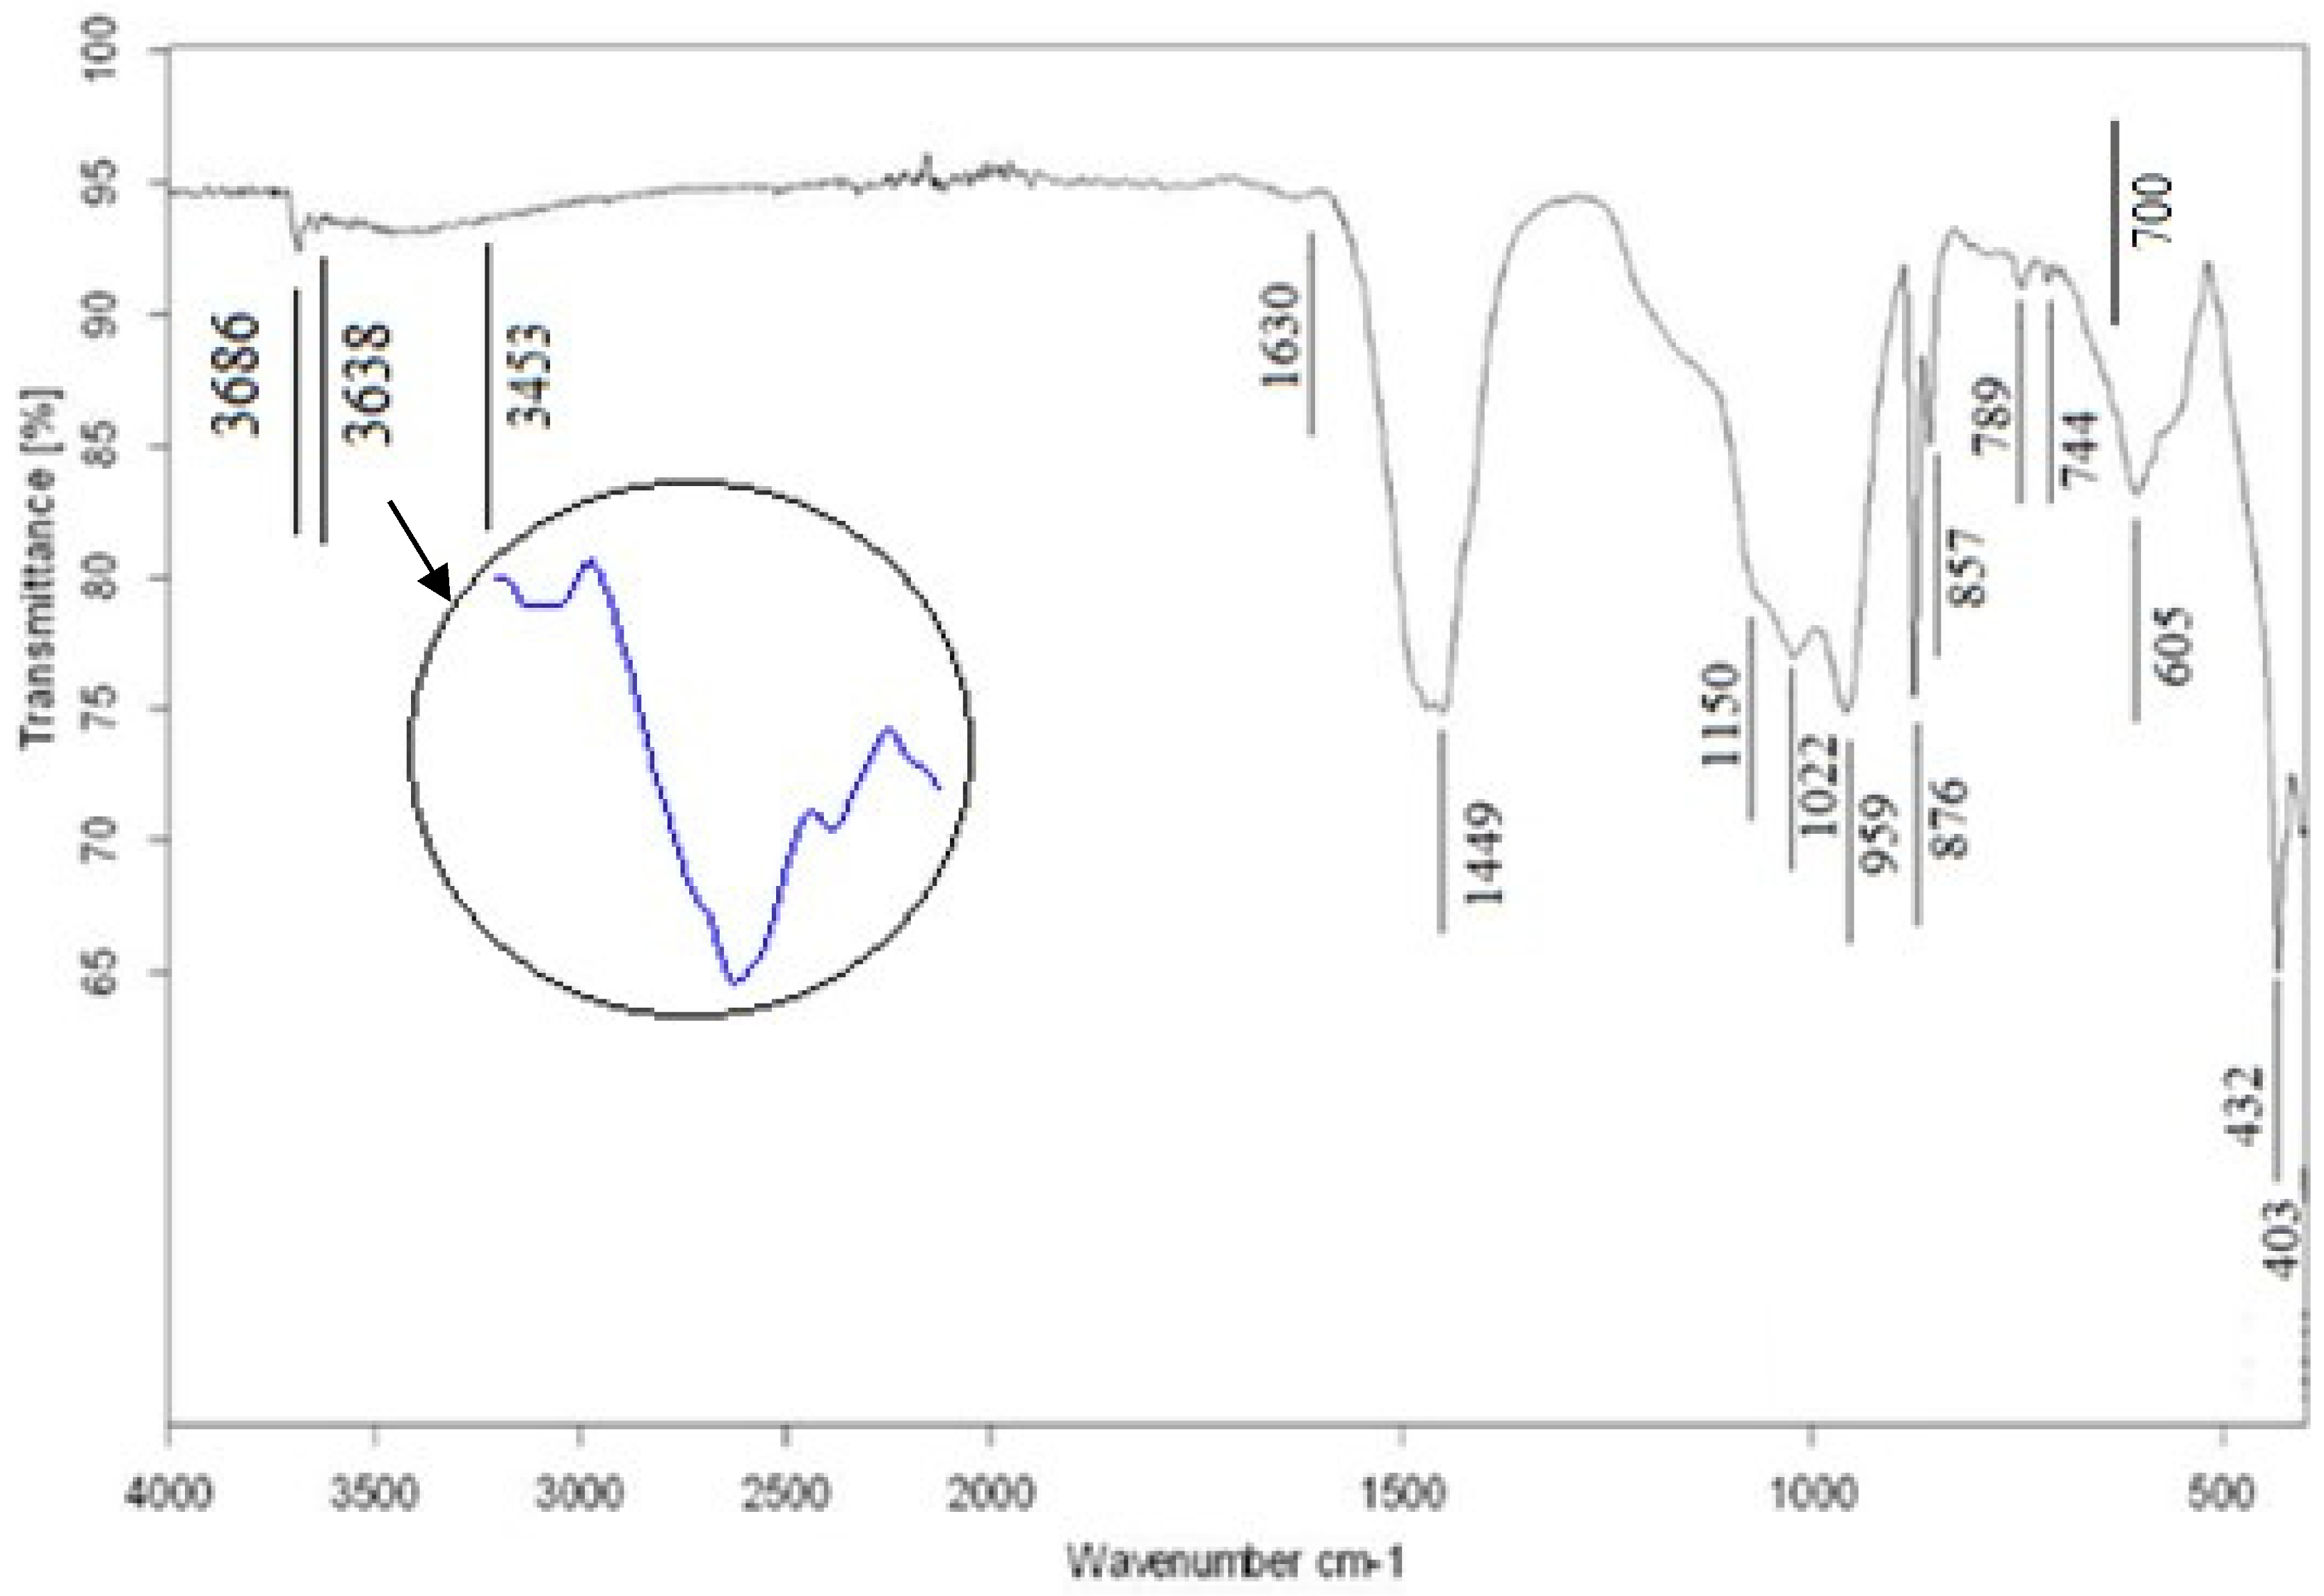
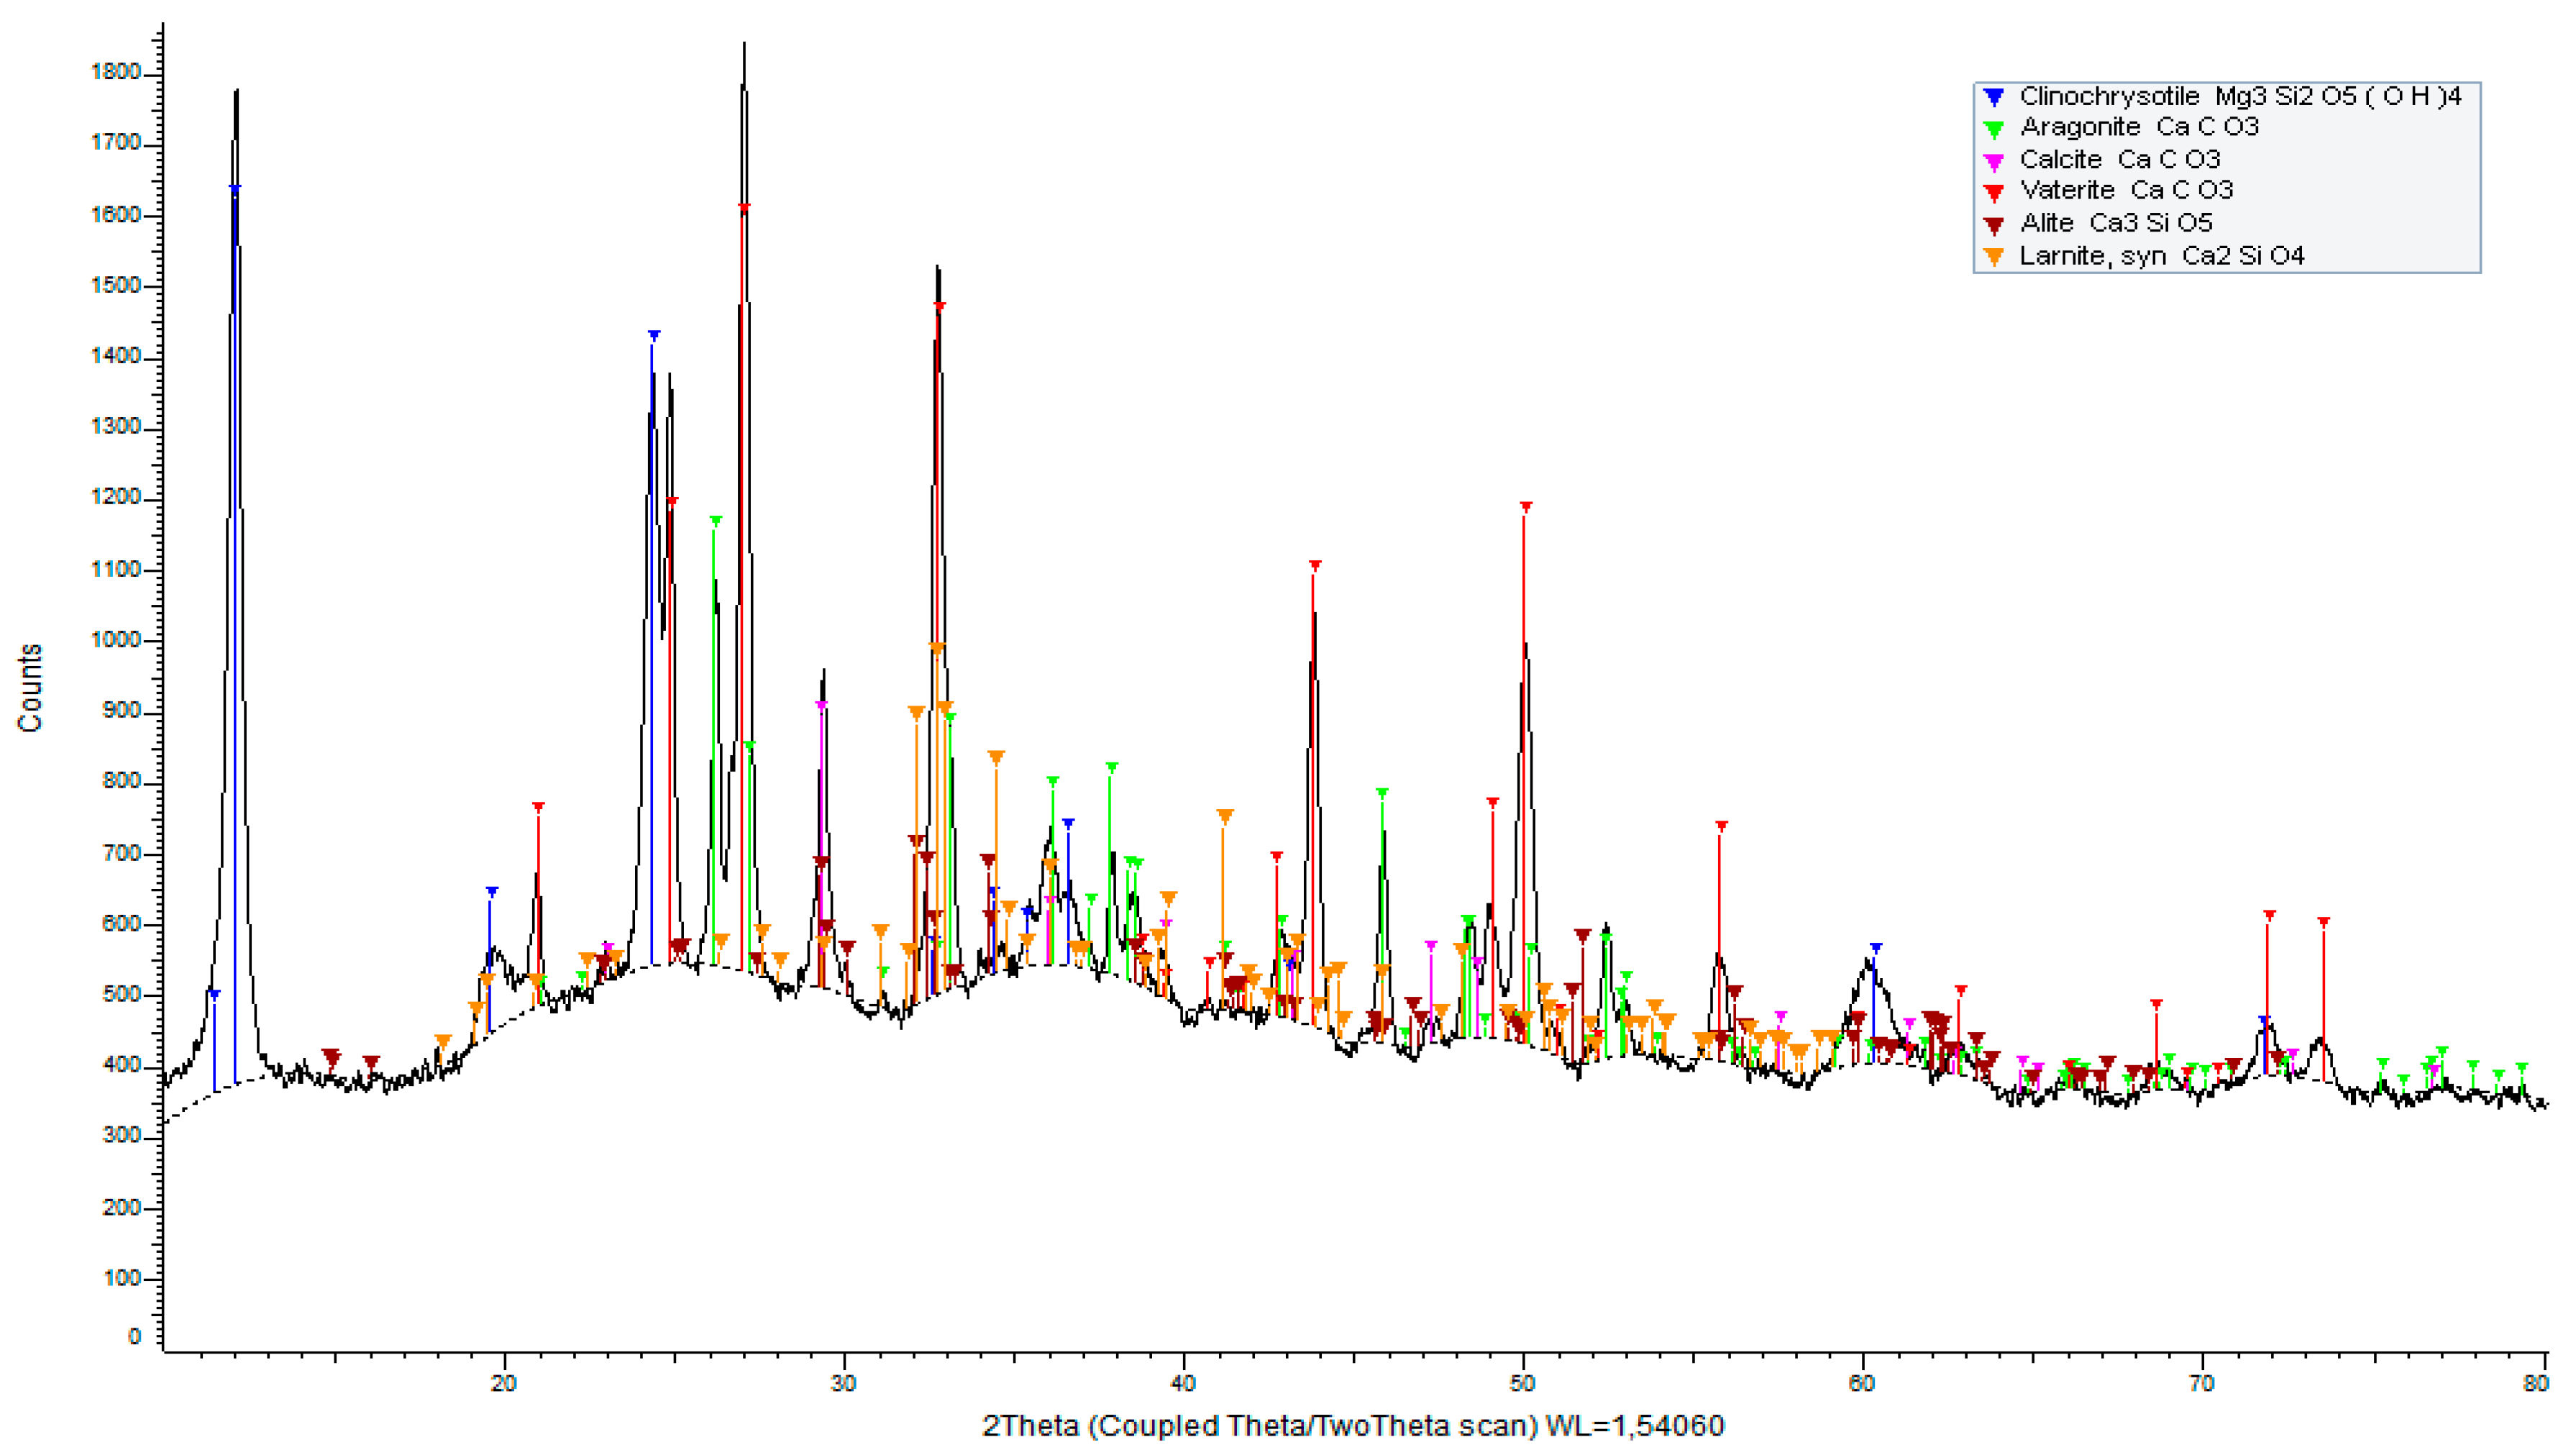
3.1.3. Fourier Transform Infrared (FTIR) Spectroscopy and X-ray Diffraction (XRD) Study of AC Waste

Fourier transform infrared (FTIR) spectroscopy was used for the identification of asbestos fibers in the AC sample. Chrysotile as a hydroxylated magnesium silicate has a structure consisting of brucite octahedral sheets linked to tetrahedral sheets of silica, producing layers of the 1:1 group minerals.
Figure 5 shows FTIR spectra of the asbestos–cement sample. The main characteristic of the spectra of chrysotile is the presence of two bands at 3686 cm−1 (strong) and 3638 cm−1 (very weak) attributed to the stretching vibrations of the surface hydroxyl groups (crystallographically distinct) of the Si–OH and Mg–OH sheets in the chrysotile structure [53,54]. The chrysotile OH stretching mode at around 3690 cm−1 was also identified in the asbestos waste [55]. The peaks at 3452 and 1630 cm−1 correspond to water molecules adsorbed into the chrysotile tubes. As shown in [56], Si–O stretching vibrations in asbestos minerals are reflected by the strong absorption band at the 1200–900 cm−1 and 600–900 cm−1 due to the vibration of the silicate chain, and the Si–O bending vibration. The broad band located between 1100 and 900 cm−1 with a maximum at 1076, 1022 and 959 cm−1 represents the symmetric stretching vibrations of Si–O–Si and Si–O bonds in SiO4−4. In addition, O–H bending vibrations were observed in the 950–600 cm−1 region. A broad O–H bending band is also present at 605 cm−1. The absorption bands centered at about 1449 and 876 cm−1 are due to the modes of the carbonate ions. Peaks centered at 1150 and 700 cm−1 could be attributed to the vibrations of the bonds in SO4−2 [55]. The bands at 605, 432 and 402 cm−1 are assigned to stretching of Mg–O and/or of Mg–OH bending vibrations [54]. The typical band attributed to Mg–OH in brucite at 627 cm−1 probably could be included in the wide band with a maximum intensity at 605 cm−1. These bands observed at given wave numbers are in good accordance with the results in [57,58]. The presence of silicates, carbonates, and sulfates is obviously related to the cement matrix.
Figure 6 shows the XRD pattern of the powder sample of asbestos–cement. The diffraction peaks correspond to the crystalline phases present in the cement matrix, and to the asbestos mineral chrysotile. The most intense two diffraction lines are assigned to presence of clinochrysotile (Mg3Si2O5(OH)4, JCPDS no. 27-1275) at a basal dhkl-spacing of 7.33 A (2θ angle of 12.07) and 3.65 A (2θ = 24.37) (see Table 4). Other crystalline phases (calcium carbonates, and calcium silicates) originating from the cement matrix were found: (i) aragonite (CaCO3, JCPDS no. 41-1475); (ii) calcite (CaCO3, JCPDS no. 01-0837); (iii) vaterite (CaCO3, JCPDS no. 33-0268); (iv) alite (Ca3SiO5, JCPDS no. 49-0442); (v) larnite (Ca2SiO4, JCPDS no. 29-0371). The presence of hydration products such as portlandite, calcium silicate hydrates, calcium aluminate hydrates, ettringite, and calcium monosulfoaluminate formed in a long-term hardened asbestos–cement sample was not identified. By calculating the crystallinity of the asbestos cement sample through Diffrac.EVA v4.2.2 software in the range of 10–80° 2θ, it was found that the sample contained only 30% of the crystalline phase and up to 70% of the amorphous phase. As is known, the main hydration cement products—calcium silicate hydrates (CSH phases)—are amorphous in nature with more complicated composition, therefore they were not observed on XRD pattern as expected. In addition, the presence of crystalline phases of calcium carbonates indicates that the carbonation degree increased during the long-term aging process of the asbestos–cement sample.
The crystalline phases such as calcium carbonates and calcium silicates identified by the XRD measurements correspond to the revealed zones rich in Ca and Si elements forming matrix compounds (see Figure 2b,c,e). Zones that can be related to the magnesium silicate compound forming chrysotile fibers can be seen in Figure 2b,d. The presence of potassium can be attributed to foreign matter present in the cement matrix.

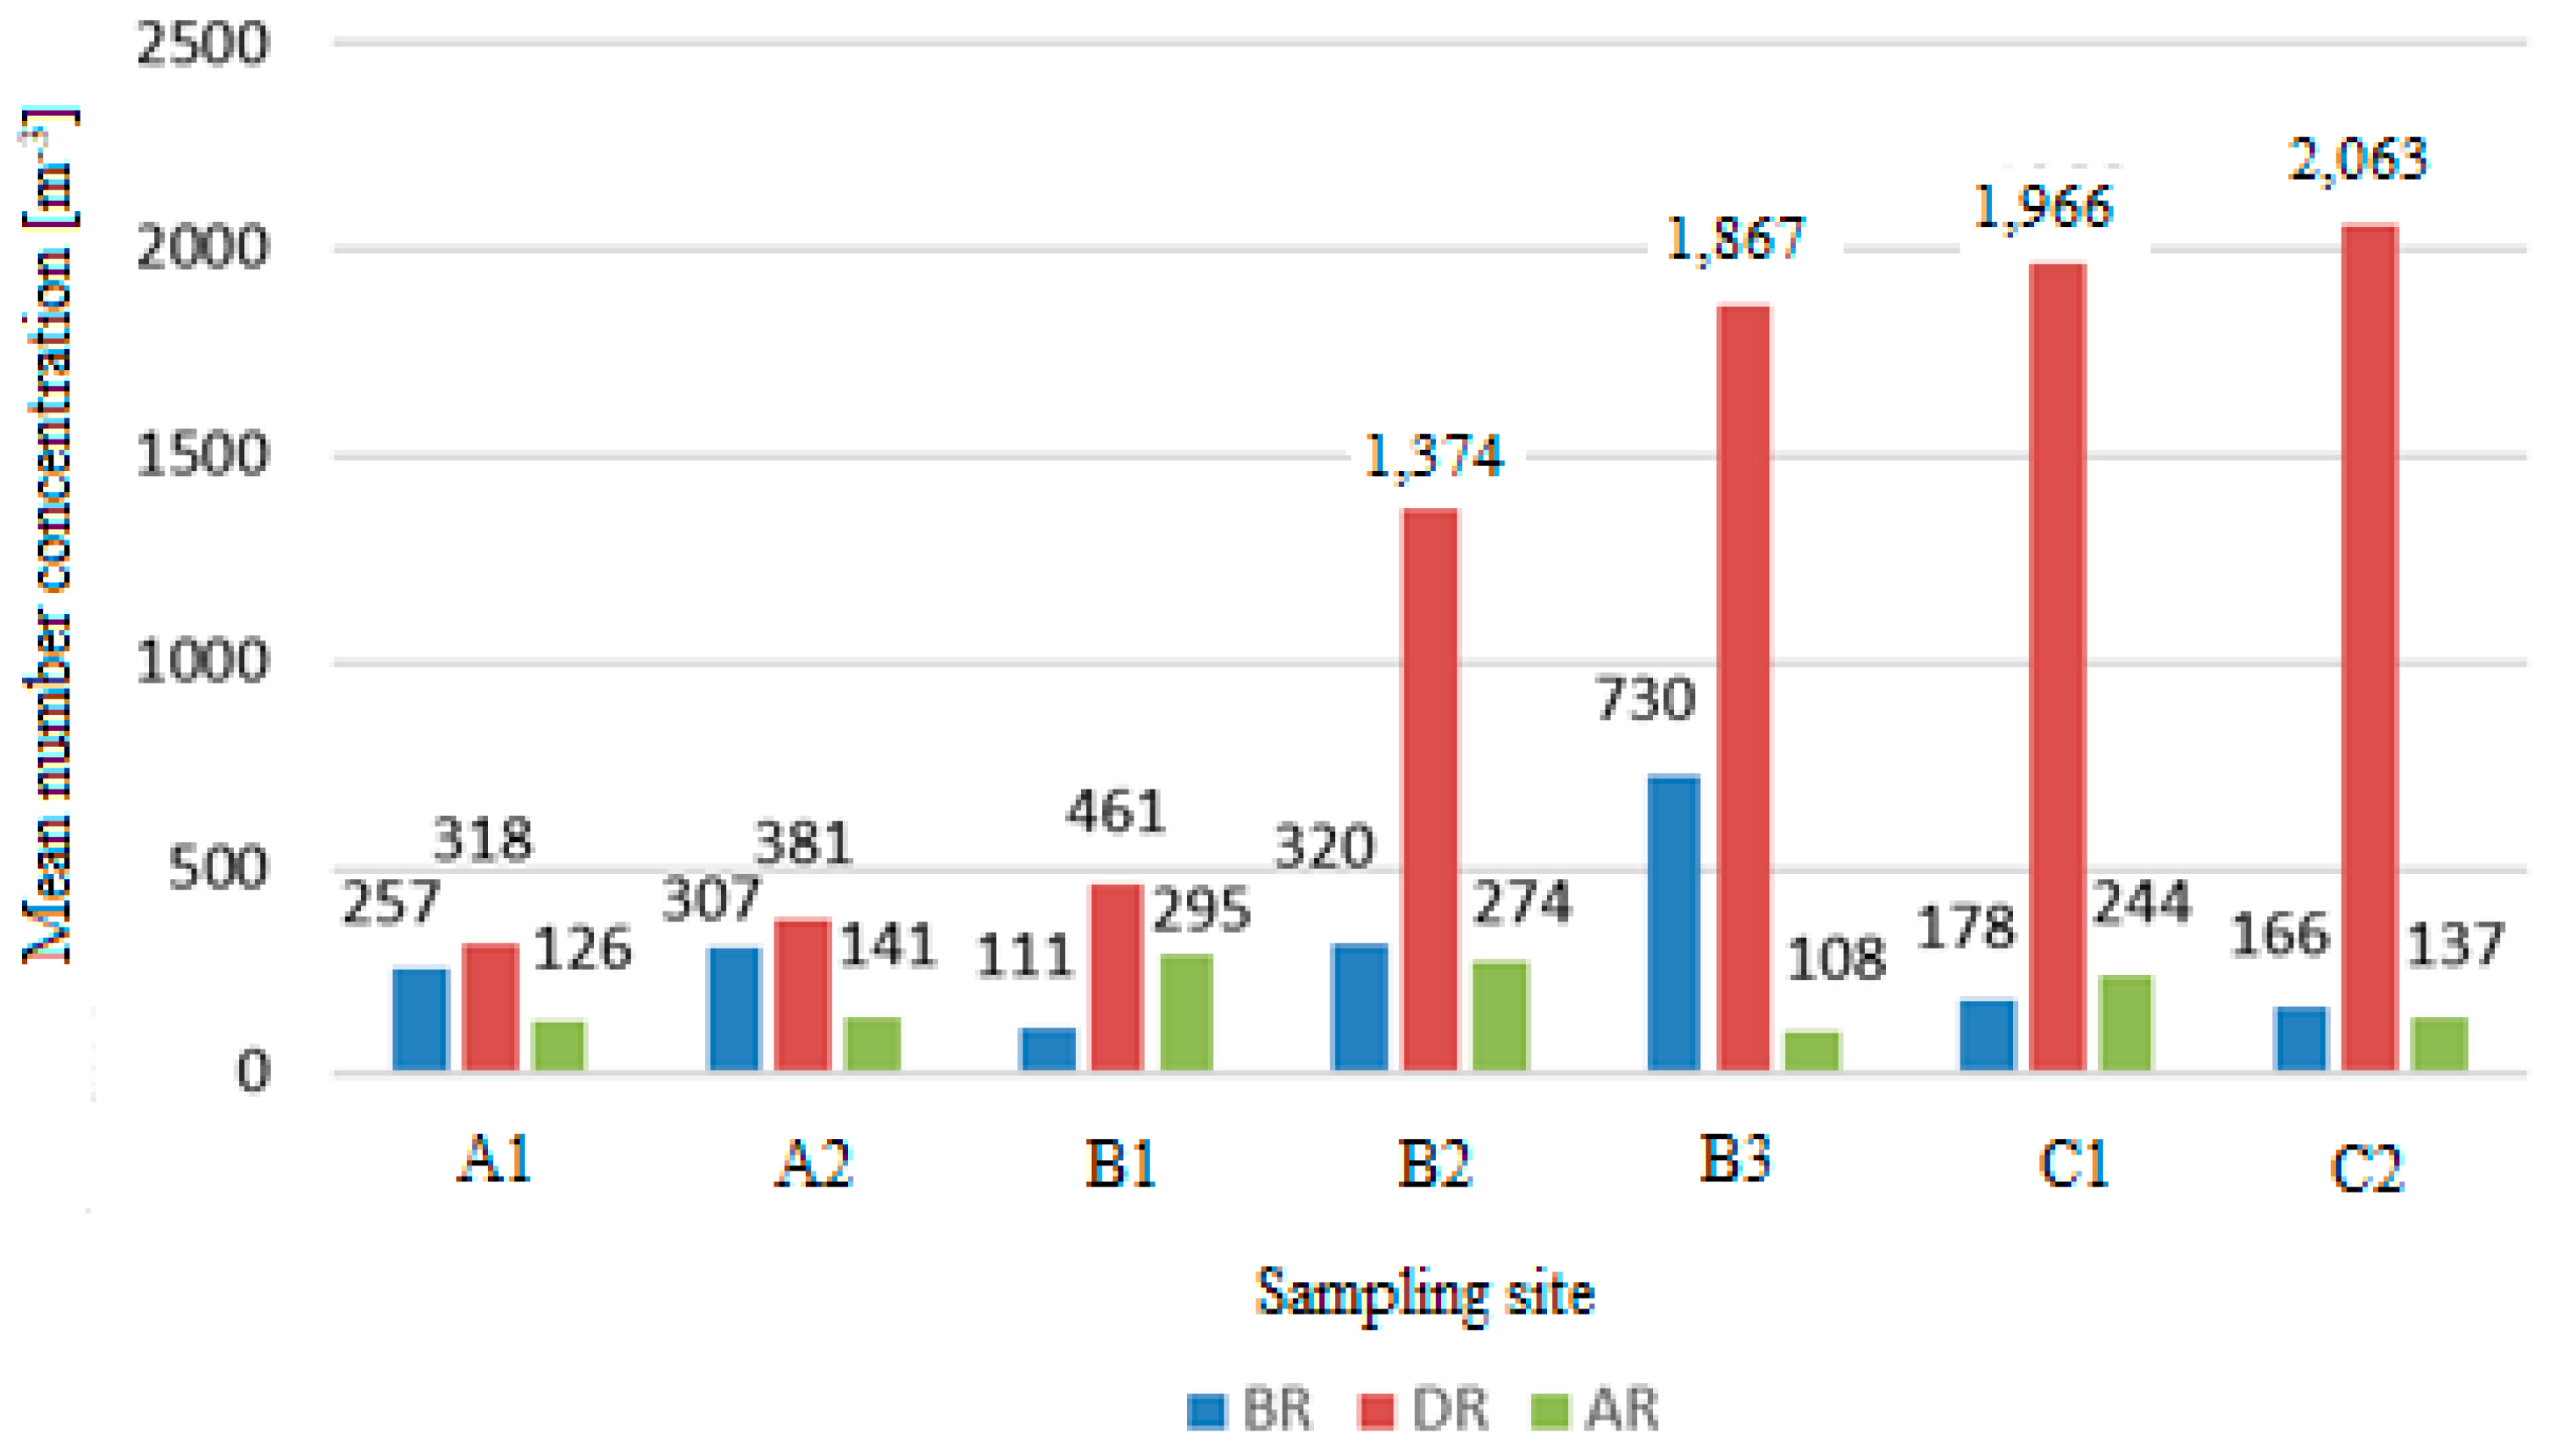
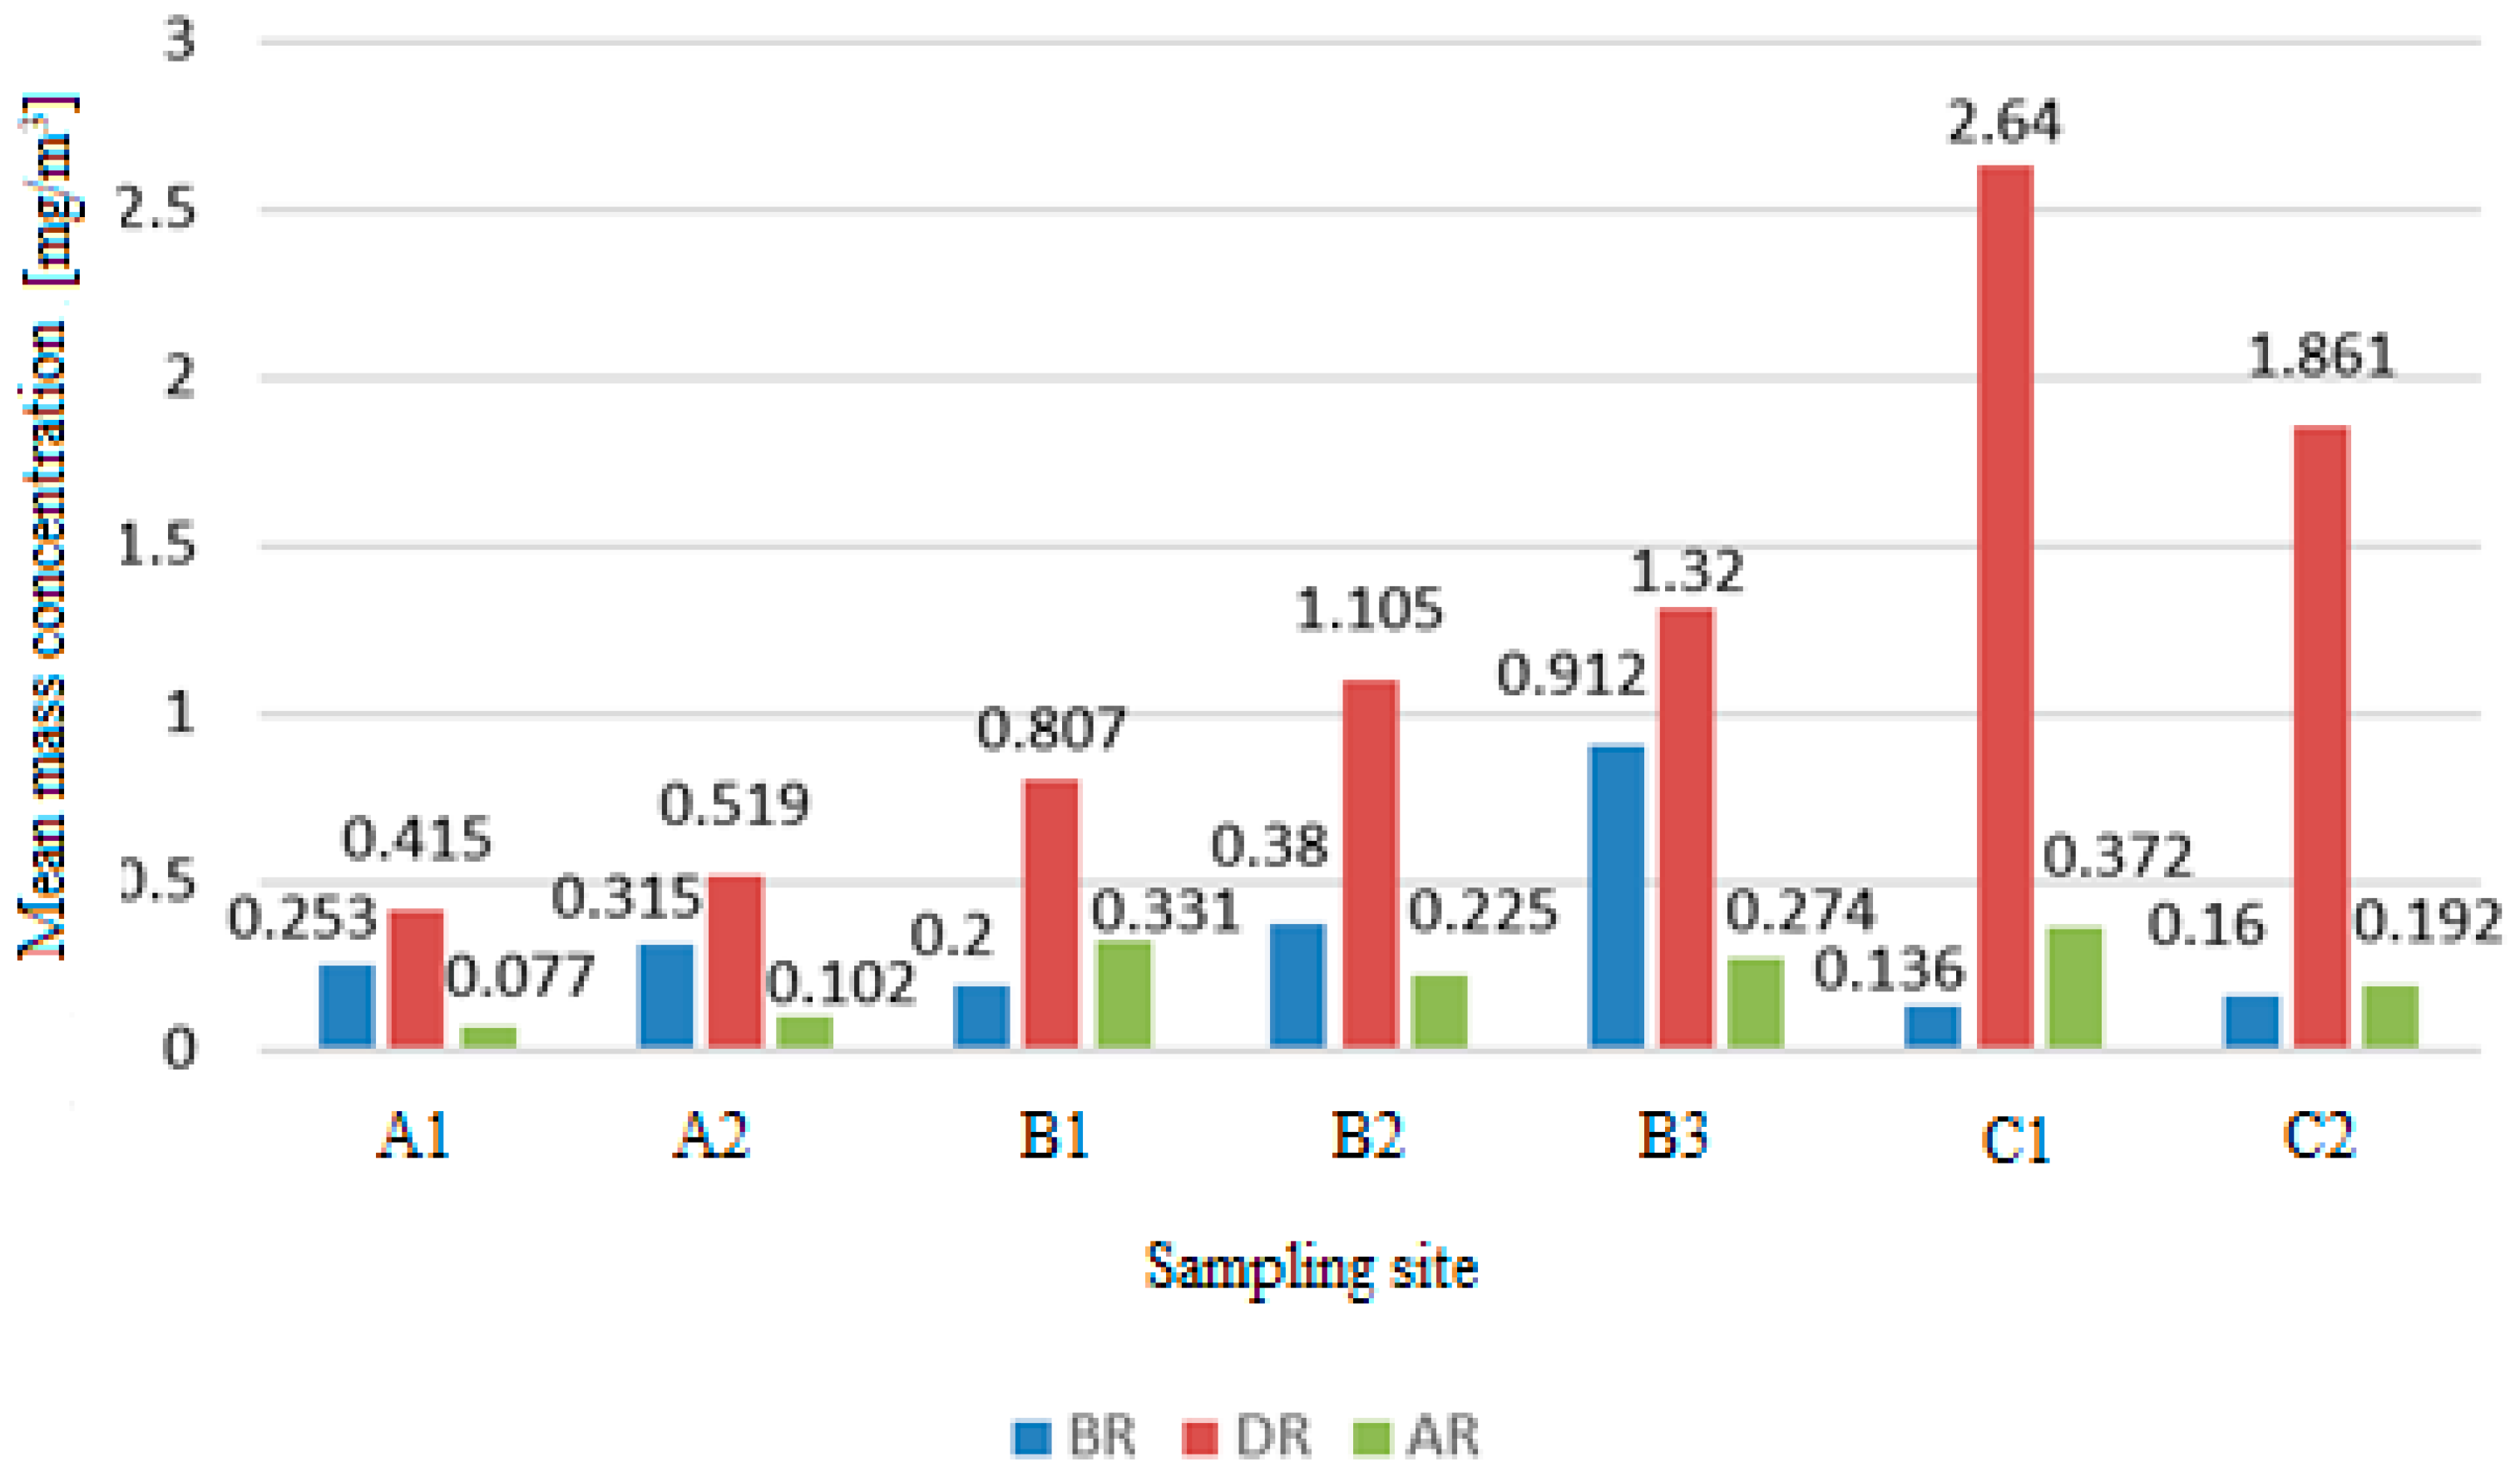
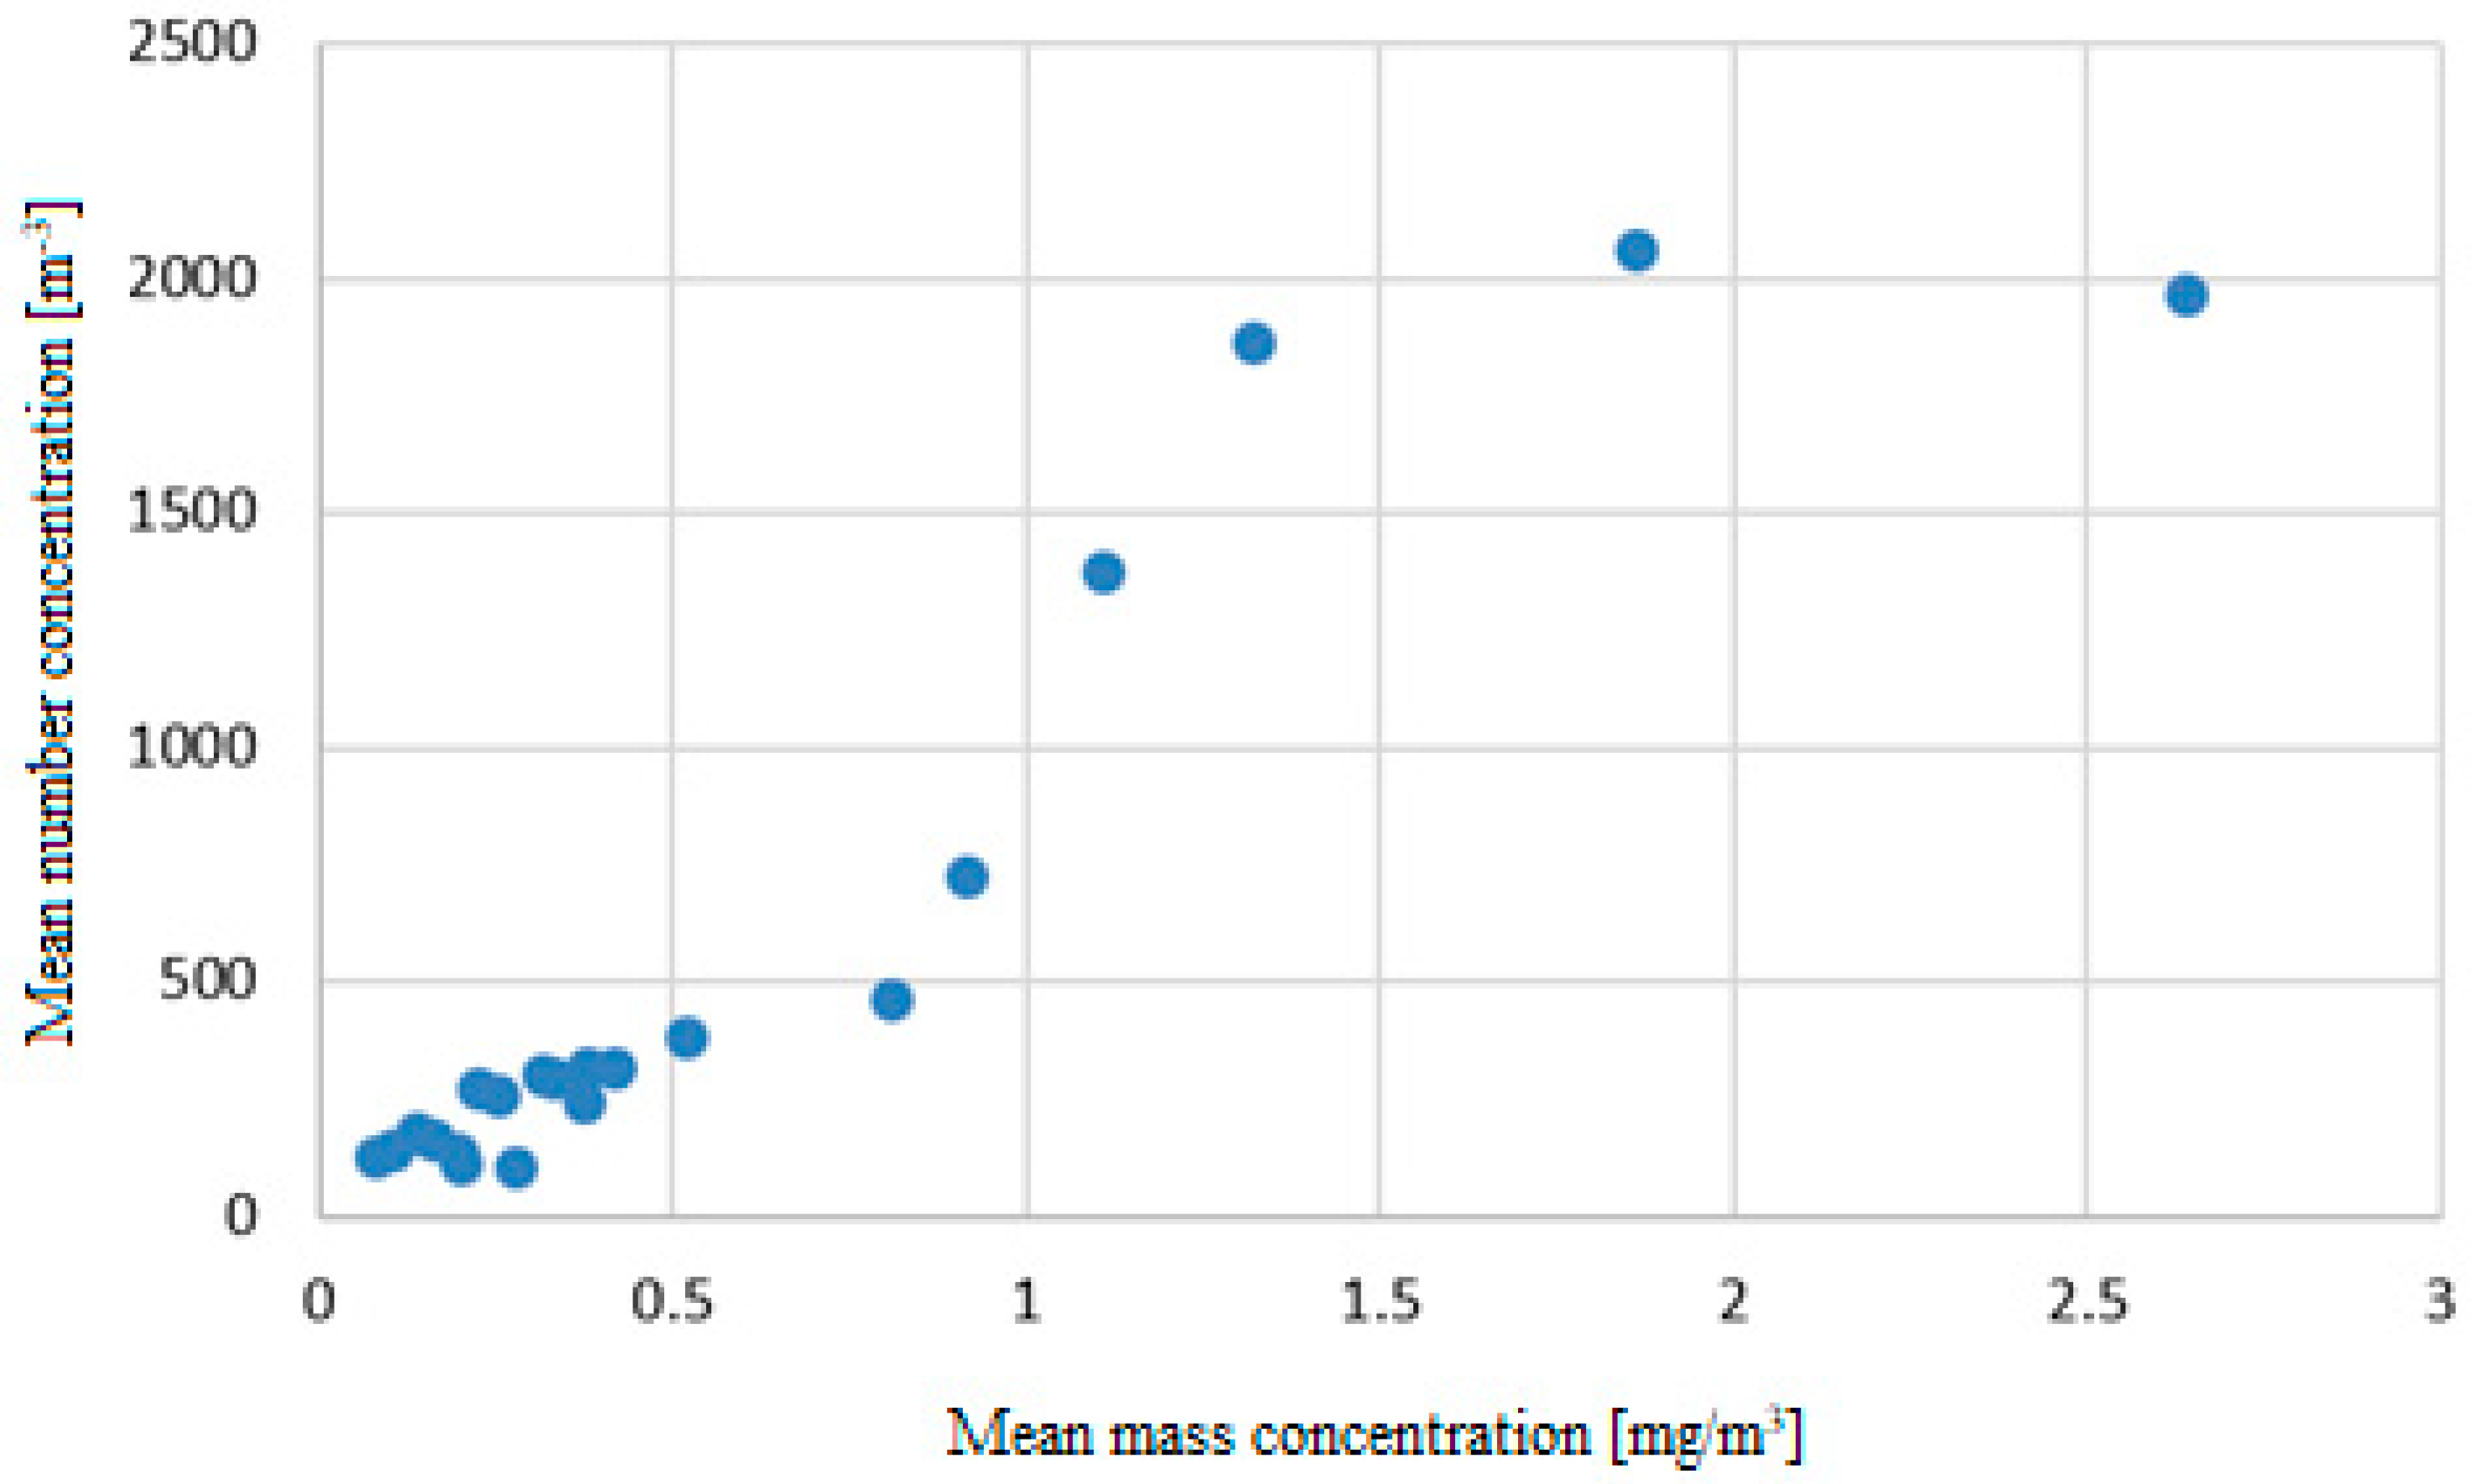
3.2. Monitoring of Airborne Asbestos Fibers

The air concentrations of the released asbestos particles from the AC composite structures into the indoor air during demolition of the construction elements in the selected building at seven work posts corresponding to floor sampling sites were assessed by the mean values of the number concentrations of fibers before (BR), during (DR), and after removal (AR) of the materials containing asbestos.
In Figure 7, the mean number concentrations of asbestos occurring in the working indoor air are given. The low mean values of number concentrations of asbestos fibers in the buildings before ACP removal were observed. They ranged from 111 to 257 m−3 and no sample exceeded the exposure limit of 1000 m−3. The values obtained during the removal of ACM significantly depended on the work site and time of sampling. The measurements carried out at the work posts during the asbestos–cement materials removal showed the mean number concentrations of asbestos fiber ranged from 318 up to 2063 m−3. The differences in these measured values are probably related to the amount of AC materials removed at a given sampling site in the building. The absolute highest mean fibers concentrations were recorded at the sampling site located in the middle part of the building´s floor (sample C2). This is consistent with the statement that the highest asbestos fiber concentration exceeded the hygiene standard at the sampling sites inside buildings [15]. The exposure limit of 1000 m−3 was exceeded only at four sampling posts (B2; B3; C1; C2) during ACM removal. The permissible exposure limit for mineral fibrous solid aerosols like asbestos in a working environment is 0.1 cm−3 (1.105 m−3). On the basis of this limiting value, all the determined number concentrations do not pose any health risk.
The lower concentrations were measured two days after removal in the morning (108–295 m−3). These obtained values of fibers concentrations are similar to the concentrations measured outside the building (i.e., 104–218 m−3). The measured air pollution levels by asbestos fibers are in accordance with the occurrence of fibers published in [18].
The mass concentrations of dust in the studied work posts were also determined. In Figure 8, the mean values of mass concentrations of asbestos dust are presented. Although demolition activities were performed under controlled conditions the fibrous dust was present in the indoor air and its mass concentration values ranged from 0.077 to 2.64 mg/m3. According to [46], the permissible exposure mass limit for the respirable fraction of asbestos dust in the air was not established. For solid aerosols with possible fibrogenic effects, the highest exposure limit in the air of a working environment is in the range of 0.3 to 6 mg/m3 (for amorphous silica, it was set at 0.3 mg/m3 and 4 mg/m3 depending on the process of dust formation).
Although fiber concentrations are considered to be a more relevant parameter than dust mass concentration, the fiber-to-dust concentration ratio is often used as an indicator of occupational exposure to asbestos [59]. The values of the calculated fiber/dust ratio for samples taken at four sampling sites (B2; B3; C1; C2) with the measured highest concentrations during the demolition work ranged from 0.745 × 10⁻³ to 1.41 × 10⁻³. These values are three orders of magnitude lower than those found during processing in chrysotile mines [59]. It should be noted that numerous asbestos concentrations during the ACM demolition activities in our case study were lower in comparison to the measured fiber concentrations in workplaces involving asbestos mining and processing. As illustrated in Figure 9, there is a relationship between mean values of number and mass concentration of asbestos dust. It confirms some dependence of the fiber concentration on the measured dust levels. However, the conclusion stated in [59] was not confirmed, i.e., that the fiber-to-dust ratio increased with a decreasing mass concentration of asbestos dust.

4. Conclusions

This study focused on two important issues regarding the removal of asbestos-containing materials incorporated into the construction of an old three-story industrial building. It also contributed to the knowledge of the nature of asbestos–cement materials after their demolition and provided an assessment of asbestos-fiber emissions during ACM removal, which is needed to protect public health.
This article is devoted to the description of a demolition working plan, the presentation of the results obtained in characterizing the chemical and phase composition of the AC waste material, as well as the surface morphologies in connection with mapping the distribution of the elements in the demolition AC waste, and the interpretation of the measured concentrations of the released asbestos dust during ACM dismantling compared to the concentrations before and after ACMs removal. These measurements were made under controlled conditions in compliance with the Slovak legal regulations, and personal hygiene and engineering controls during asbestos removal.
In view of the experimental investigations of AC waste samples taken from the selected sampling sites, XRF and EDS techniques proved the presence of oxides/elements related to cement and asbestos compounds without significant differences. Calcium silicates, calcium carbonate and chrysotile were identified in the AC waste samples using FTIR and XRD analyses. The morphological observation of the AC waste sample surface showed its relatively high roughness and the inhomogeneous distribution of the bundles of asbestos fibers with clearly visible primary fibers. This inhomogeneity in fiber bundles distribution on the whole studied area of the AC sample was observed through EDS mapping of the magnesium and silicon elements.
More than 200 air samples from seven sampling sites were tested to determine the asbestos dust number and mass concentrations. The relationship between the mean values of number and mass concentrations of asbestos dust was proved. The determined number concentration of airborne asbestos fibers during removal of asbestos containing materials in the building clearly demonstrated the low concentration levels of asbestos respirable fibers, not exceeding the threshold value of 1000 fibers per one m3, except in three spots out of all the sampling sites inside the building. Therefore, the determined concentrations of asbestos dust during the demolition of ACPs do not pose any health risk. These results clearly point to prioritizing the introduction of a demolition management system of asbestos–cement products in buildings in terms of protecting workers from the harmful health impacts of asbestos dust during the execution of such activities.

Author Contributions

N.S.: (1) initiated the overall research conceptualization, supervised the research work and participated in experimental fibers monitoring; (2) analyzed data and interpreted the measured data, prepared the original draft manuscript; (3) revised critically the content of paper. A.E.: (1) carried out experimental fibers monitoring and XRF measurements; (2) contributed to manuscript writing. M.H.: performed and interpreted XRD measurements. E.S.: (performed and interpreted FTIR measurements. K.C.: performed and interpreted EDS and SEM measurements. All authors have read and agreed to the published version of the manuscript.

Funding

The authors are grateful to the Agency of the Ministry of the Education, Science, Research and Sport of the Slovak Republic for the Structural Funds of EU for supporting the project NFP 26220120051 and VEGA project No. 1/0648/17.

Acknowledgments

The authors thank Stefan Demcak for ensuring the EDS and SEM measurements of asbestos–cement waste samples.

Conflicts of Interest

The authors declare no conflict of interest.

References

  1. International Agency of Research on Cancer (IARC) monographs, suppl. 7, 1987, 139–142. In Overall Evaluations of Carcinogenity: An Updating of IARC Monographs Volumes 1 to 42; International Agency of Research on Cancer: Lyon, France, 1987.
  2. World Health Organization (WHO). Elimination of Asbestos-Related Diseases. 2006. Available online: https://apps.who.int/iris/handle/10665/69479 (accessed on 14 May 2020).
  3. Abelmann, A.; Glynn, M.E.; Pierce, J.S.; Scott, P.K.; Serrano, S.; Paustenbach, D.J. Historical ambient airborne asbestos concentrations in the United States—An analysis of published and unpublished literature (1960s–2000s). Inhal. Toxicol. 2015, 27, 754–766. [Google Scholar] [CrossRef] [PubMed]
  4. Świątkowska, B.; Szeszenia-Dąbrowska, N.; Wilczyńska, U. Medical monitoring of asbestos-exposed workers: Experience from Poland. Bull. World. Health Organ. 2016, 94, 599–604. [Google Scholar] [CrossRef] [PubMed]
  5. Baur, X.; Soskolne, C.L.; Lemen, R.A.; Schneider, J.; Woitowitz, H.J.; Budnik, L.T. How conflicted authors undermine the World Health Organization (WHO) campaign to stop all use of asbestos: Spotlight on studies showing that chrysotile is carcinogenic and facilitates other non-cancer asbestos-related diseases. Int. J. Occup. Environ. Health 2015, 21, 176–179. [Google Scholar] [CrossRef] [Green Version]
  6. Commission Directive 1999/77/EC of 26 July 1999. Official Journal of the European Communities, 6 August 1999.
  7. Li, J.; Dong, Q.; Yu, K.; Liu, L. Asbestos and asbestos waste management in the Asian-Pacific region: Trends, challenges and solutions. J. Clean. Prod. 2014, 81, 218–226. [Google Scholar] [CrossRef]
  8. Baur, X.; Frank, A.L.; Budnik, L.T.; Woitowitz, H.J.; Oliver, L.C.; Welch, L.S.; Landrigan, P.; Lemen, R. Collegium Ramazzini: Comments on the 2014 Helsinki consensus report on asbestos. Am. J. Ind. Med. 2016, 59, 591–594. [Google Scholar] [CrossRef] [PubMed]
  9. Marsili, D.; Terracini, B.; Santana, V.S.; Ramos-Bonilla, J.P.; Pasetto, R.; Mazzeo, A.; Loomis, D.; Comba, P.; Algranti, E. Prevention of asbestos-related disease in countries currently using asbestos. Int. J. Environ. Res. Public Health 2016, 13, 494. [Google Scholar] [CrossRef] [PubMed]
  10. Hurbánková, M. Ceramic fibres—Properties, use, effects on respiratory system. Czech Occup. Med. 2006, 4, 203–208. [Google Scholar]
  11. Bobst, S. The history of risk assessment within OSHA and ACGIH: Asbestos case study. In History of Risk Assessment in Toxicology, A Volume in History of Toxicology and Environmental Health; Bobst, S., Ed.; Elsevier: Amsterdam, The Netherlands, 2017; pp. 27–30. [Google Scholar] [CrossRef]
  12. OSHA Fact Sheet. Asbestos. Available online: https://www.osha.gov/Publications/OSHA3507.pdf (accessed on 14 May 2020).
  13. Directive 2003/18/EC of the European Parliament and of the Council of 27 March 2003 Amending Council Directive 83/477/EEC on the Protection of Workers from the Risks Related to Exposure to Asbestos at Work. Official Journal L 97, 15/04/2003, pp. 48–52. Available online: http://data.europa.eu/eli/dir/2003/18/oj (accessed on 14 May 2020).
  14. Directive 2009/148/EC of the European Parliament and of the Council of 30 November 2009 on the Protection of Workers from the Risks Related to Exposure to Asbestos at Work. Official Journal L 330, 16.12.2009, pp. 28–36. Available online: http://data.europa.eu/eli/dir/2009/148/oj (accessed on 14 May 2020).
  15. Bujak-Pietrek, S.; Szadkowska-Stańczyk, I. Exposure to respirable asbestos fibers at various stage of asbestos removal work. Med. Pr. 2012, 63, 191–198. [Google Scholar]
  16. Neitzel, R.L.; Sayler, S.K.; Demond, A.H.; Arcy, H.; Garabant, D.H.; Franzblau, A. Measurement of asbestos emissions associated with demolition of abandoned residential dwellings. Sci. Total Environ. 2020, 722, 137891. [Google Scholar] [CrossRef]
  17. Sakol, G.; Muszyňska-Graca, M. Air pollution during asbestos removal. Pol. J. Environ. Stud. 2019, 28, 1–5. [Google Scholar] [CrossRef]
  18. Szeszenia-Dąbrowska, N.; Sobala, W.; Swiątkowska, B.; Stroszejn-Mrowca, G.; Wilczyńska, U. Environmental asbestos pollution—Situation in Poland. Int. J. Occup. Med. Environ. Health 2012, 25, 3–13. [Google Scholar] [CrossRef] [PubMed]
  19. Lange, J.; Thomulka, K. Airborne exposure concentrations during asbestos abatement of ceiling and wall plaster. Bull. Environ. Contam. Toxicol. 2002, 69, 712–718. [Google Scholar] [CrossRef] [PubMed]
  20. Perkins, R.A.; Hargesheimer, J.; Fourie, W. Asbestos release from whole-building demolition of buildings with asbestos-containing material. J. Occup. Environ. Hyg. 2007, 4, 889–894. [Google Scholar] [CrossRef] [PubMed]
  21. Brown, S.K. Asbestos exposure during renovation and demolition of asbestos cement clad buildings. Am. Ind. Hyg. Assoc. J. 1987, 48, 478–486. [Google Scholar] [CrossRef] [PubMed]
  22. Darcy, D.J.; Feltner, C. Occupational and environmental exposure to asbestos. In Pathology of Asbestos-Associated Diseases, 1st ed.; Oury, D., Sporn, T.A., Roggli, V.L., Eds.; Springer: Berlin/Heidelberg, Germany, 2014; pp. 11–24. [Google Scholar]
  23. Obminski, A.; Janeczek, J. The effectiveness of asbestos stabilizers during abrasion of asbestos-cement sheets. Constr. Build. Mater. 2020, 249, 118767. [Google Scholar] [CrossRef]
  24. Kinney, P.L.; Satterfield, M.H.; Shaikh, R.A. Aiborne fiber levels during asbestos operations and maitance work in a large office building. Appl. Occup. Environ. Hyg. 1994, 9, 825–835. [Google Scholar] [CrossRef]
  25. Boulanger, G.; Andujar, P.; Pairon, J.C.; Billon-Galland, M.A.; Dion, C.; Dumortier, P.; Brochard, P.; Sobaszek, A.; Bartsch, P.; Paris, C.; et al. Quantification of short and long asbestos fibers to assess asbestos exposure: A review of fiber size toxicity. Environ. Health 2014, 13, 59. [Google Scholar] [CrossRef] [Green Version]
  26. Suzuki, Y.; Yuen, S.R.; Ashley, R. Short, thin asbestos fibers contribute to the development of human malignant mesothelioma: Pathological evidence. Int. J. Hyg. Environ. Health 2005, 208, 201–210. [Google Scholar] [CrossRef]
  27. IARC Monograph: Asbestos (Chrysotile, Amosite, Crocidolite, Tremolite, Actinolite, and Anthophyllite). In Metals, Arsenic, Dusts and Fibres; IARC Monographs on the Evaluation of Carcinogenic Risks to Humans Volume 100C; IARC: Lyon, France, 2012; pp. 219–309. Available online: http://monographs.iarc.fr/ENG/Monographs/vol100C/mono100C-11.pdf (accessed on 14 May 2020).
  28. Bernstein, D.M. The health risk of chrysotile asbestos. Curr. Opin. Pulm. Med. 2014, 20, 366–370. [Google Scholar] [CrossRef]
  29. Hashim, D.; Boffetta, P. Occupational and environmental exposures and cancers in developing countries. Ann. Glob. Health 2014, 80, 393–411. [Google Scholar] [CrossRef]
  30. Kratzke, P.; Kratzke, R.A. Asbestos-related disease. J. Radiol. Nurs. 2018, 37, 21–26. [Google Scholar] [CrossRef]
  31. Nynäs, P.; Pukkala, E.; Vainio, H.; Oksa, P. Cancer incidence in asbestos-exposed workers: An update on four Finnish cohorts. Saf. Health Work 2017, 8, 169–174. [Google Scholar] [CrossRef]
  32. Takala, J. Eliminating occupational cancer. Ind. Health 2015, 53, 307–309. [Google Scholar] [CrossRef] [Green Version]
  33. Gilham, C.; Rake, C.; Hodgson, J.; Darnton, A.; Burdett, G.; Wild, J.P.; Newton, N.A.; Davidson, L.; Shires, M.; Treasure, T.; et al. Current asbestos exposure and future mesothelioma risks in Britain: The Inhaled Particles Study (TIPS). Int. J. Epidemiol. 2018, 47, 1745–1756. [Google Scholar] [CrossRef] [Green Version]
  34. Felten, M.; Khatab, K.; Knoll, L.; Schetten, T.; Muller-Berndorff, H.; Kraus, T. Changes of mesothelin and osteopontin levels over time in formerly asbestos-exposed power industry workers. Int. Arch. Occup. Environ. Health 2014, 87, 195–204. [Google Scholar] [CrossRef]
  35. Kim, Y.C.; Hong, W.H. Optimal management program for asbestos containing building materials to be available in the event of a disaster. Waste Manag. 2017, 64, 272–285. [Google Scholar] [CrossRef]
  36. Baek, S.C.; Kim, Y.C.; Hong, W.H. Determination of the essential activity elements of an asbestos management system in the event of a disaster and their prioritization. J. Clean. Prod. 2016, 137, 414–426. [Google Scholar] [CrossRef]
  37. Paglietti, F.; Malinconico, S.; Conestabiledella-Staffa, B.; Bellagamba, S.; De Simone, P. Classification and management of asbestos-containing waste: European legislation and the Italian experience. Waste Manag. 2016, 50, 130–150. [Google Scholar] [CrossRef]
  38. Serranti, S.; Bonifazi, G. Detection and classification of asbestos and other contminnts in C&DW by advenced Technologies. In Advances in Construction and Demolition Waste Recycling. Management, Processing and Environmental Assessment; Pacheco-Torgal, F., Ding, Y., Colangelo, F., Tuladhar, R., Koutamanis, A., Eds.; Woodhead Publishing Series in Civil and Structural Engineering; Elsevier: Amsterdam, The Netherlands, 2020; pp. 407–437. [Google Scholar] [CrossRef]
  39. STN EN ISO 16000-7. Indoor Air—Part 7: Sampling Strategy for Determination of Airborne Asbestos Fibre Concentrations (ISO 16000-7:2007); Slovak Office of Standards, Metrology and Testing: Bratislava, Slovakia, 2008.
  40. Pawełczyk, A.; Božek, F. Health risk associated with airborne asbestos. Environ. Monit. Assess. 2015, 187, 428. [Google Scholar] [CrossRef] [Green Version]
  41. ISO 8672 Air Quality—Determination of the Number Concentration of Airborne Inorganic Fibres by Phase Contrast Optical Microscopy—Membrane Filter Method; American National Standards Institute: Washington, DC, USA, 2014.
  42. ISO 14966 Ambient Air—Determination of Numerical Concentration of Inorganic Fibrous Particles—Scanning Electron Microscopy Method; American National Standards Institute: Washington, DC, USA, 2002.
  43. Technische Regeln für Gefahrstoffe Asbest Abbruch-, Sanierungs- oder Instandhaltungsarbeiten (TRGS 519). Bundesanstalt für Arbeitschutz und Arbeitmedizin, 2014. Available online: www.baua.de/ags (accessed on 14 May 2020).
  44. National Council of the Slovak Republic. Law 335/2007 on the Protection, Promotion and Development of Public Health and on Amendments to Certain Acts. Collection of Laws 103/2015; Resort of Justice of the Slovak Republic: Bratislava, Slovakia, 2015.
  45. Regulation of the Government of the Slovak Republic 356/2006 on the Protection of the Health of Workers from Risks Related to Exposure to Carcinogenic and Mutagenic Factors at Work; Resort of Justice of the Slovak Republic: Bratislava, Slovakia, 2006.
  46. Regulations of the Goverment of the Slovak Republic 355/2006 Coll. on the Protection of Employees from Risk Related to Exposure to Chemical Agents at Work, as Amended; Resort of Justice of the Slovak Republic: Bratislava, Slovakia, 2006.
  47. Regulations of the Goverment of the Slovak Republic 83/2015 Coll. on the Protection of Employees´ Health against Risks Related to Exposure to Carcinogenic and Mutagenic Factors at Work, as Amended; Resort of Justice of the Slovak Republic: Bratislava, Slovakia, 2015.
  48. Witek, J.; Kusiorowski, R. Neutralisation of asbestos-containing waste by melting in an arc-resistance furnace. Waste Manag. 2017, 69, 336–345. [Google Scholar] [CrossRef]
  49. Viani, A.; Gualtieri, A.F.; Secco, M.; Peruzzo, L.; Artioli, G.; Cruciani, G. Crystal chemistry of cement–asbestos. Am. Miner. 2013, 98, 1095–1105. [Google Scholar] [CrossRef]
  50. Kusiorowski, R.; Zaremba, T.; Piotrowski, J. The potential use of cement-asbestos waste in the ceramic masses destined for sintered wall clay brick manufacture. Ceram. Int. 2014, 40, 11995–12002. [Google Scholar] [CrossRef]
  51. Tomasetti, L.; Di Giuseppe, D.; Zoboli, A.; Paolini, V.; Torre, M.; Paris, E.; Guerriero, E.; Petracchini, F.; Gualtieri, A.F. Emission of fibres and atmospheric pollutants from the thermal treatment of asbestos containing waste (ACW). J. Clean. Prod. 2020, 268, 122179. [Google Scholar] [CrossRef]
  52. Anbalagan, G.; Sivakumar, G.; Prabakaran, A.R.; Gunasekaran, S. Spectroscopic characterization of natural chrysotile. Vib. Spectrosc. 2010, 52, 122–127. [Google Scholar] [CrossRef]
  53. Wypych, F.; Schreiner, W.H.; Mattoso, N.; Mosca, D.H.; Marangoni, R.; Bento, C.A.d.S. Covalent grafting of phenylphosphonate groups onto layered silica derived from in situ-leached chrysotile fibers. J. Mater. Chem. 2003, 13, 304–307. [Google Scholar] [CrossRef]
  54. Zaharaki, D.; Komnitsas, K.; Perdikatsis, V. Use of analytical techniques for identification of inorganic polymer gel composition. J. Mater. Sci. 2010, 4, 2715–2724. [Google Scholar] [CrossRef]
  55. Colangelo, F.; Cioffi, R.; Lavorgna, M.; Verdolotti, L.; De Stefano, L. Treatment and recycling of asbestos-cement containing waste. J. Hazard. Mater. 2011, 195, 391–397. [Google Scholar] [CrossRef]
  56. Šontevska, V.; Jovanovski, G.; Makreski, P. Minerals from Macedonia. Part XIX. Vibrational spectroscopy as identification tool for some sheet silicate minerals. J. Mol. Struct. 2007, 318, 834–836. [Google Scholar] [CrossRef]
  57. Nakagaki, S.; Castro, K.D.F.; Machado, G.S.; Halma, M.; Drechsel, S.M.; Wypych, F. Catalytic activity in oxidation reactions of anionic iron (III) porphyrins immobilized on raw and grafted chrysotile. Int. J. Braz. Chem. Soc. 2006, 17, 1672–1678. [Google Scholar] [CrossRef] [Green Version]
  58. Accardo, G.; Cioffi, R.; Colangelo, F.; d’Angelo, R.; De Stefano, L.; Paglietti, F. Diffuse reflectance infrared fourier transform spectroscopy for the determination of asbestos species in bulk building materials. Materials 2014, 7, 457–470. [Google Scholar] [CrossRef] [Green Version]
  59. Felleto, E.; Schonfeld, S.J.; Kovalevskiy, E.V.; Bukhtiyrov, I.V.; Kashanskiy, S.V.; Moissonnier, M.; Straif, K.; Schüz, J. A comparison of paralle dust and fibre measurements of airborne chrysotile asbestos in a large mine and processing factories in the Russian Federation. Int. J. Hyg. Environ. Health 2017, 220, 857–868. [Google Scholar] [CrossRef] [PubMed]
Figure 1. Scanning electron microscope (SEM) micrographs of the surface morphology of the asbestos–cement (AC) sample at various magnifications (a-31; b-115; c-138; d-298; e-505).
Applsci 10 04048 g001aApplsci 10 04048 g001b
Figure 2. Energy-dispersive X-ray (EDS) spectrum of the sample from Figure 1c.
Applsci 10 04048 g002
Figure 3. EDS spectrum of the sample from Figure 1e.
Applsci 10 04048 g003
Figure 4. SEM micrographs of surface morphology of the asbestos–cement sample and map of the areal distribution and relative proportion (intensity) of all and the selected elements (Si, Ca, Mg, Al, K) over the scanned area (magnification 31 times).
Applsci 10 04048 g004aApplsci 10 04048 g004b
Figure 5. Fourier transform infrared (FTIR) spectrum of AC waste sample.
Applsci 10 04048 g005
Figure 6. X-ray diffraction (XRD) pattern of AC waste sample.
Applsci 10 04048 g006
Figure 7. Mean number concentrations of asbestos on the sampling sites in the building before, during, and after removal of ACPs.
Applsci 10 04048 g007
Figure 8. Mean values of mass concentrations of asbestos dust on the work posts in the building before, during, and after removal of ACPs.
Applsci 10 04048 g008
Figure 9. Relationships between mean values of number and mass concentration of asbestos dust.
Applsci 10 04048 g009
Table 1. Characterization of dust sampling sites, number of measurements, and designation of activities of asbestos–cement product (ACPs) removal (before removal—BR; during removal—DR; after removal—AR).
Dust Sampling SiteNumber of SamplesActivity
A1Ground floor10BR
9DR
10AR
A2Ground floor9BR
10DR
9AR
B11st floor9BR
10DR
9AR
B21st floor8BR
10DR
10AR
B31st floor11BR
10DR
9AR
C12nd floor10BR
15DR
11AR
C22nd floor11BR
15DR
10AR
Table 2. Chemical analysis of asbestos–cement (AC) waste samples (* loss on ignition).
ComponentsContent (wt.%)ElementsAverage Content (wt.%)
Sample 1Sample 2Sample 3
SiO220.6719.1420.30Si9.36
CaO40.0238.8240.54Ca28.44
MgO5.855.655.36Mg3.39
Al2O32.983.022.40Al0.74
Fe2O32.162.202.05Fe0.74
SO32.342.532.35S0.96
P2O50.120.110.10P0.02
K2O0.340.310.29K0.13
Cl0.020.020.02Cl0.02
LOI *25.3025.9026.60--
Others0.202.30---
Table 3. Elemental analysis of the whole area of asbestos–cement sample (Area 1—Figure 1c; Area 2—Figure 1e) and at a selected point (Figure 1a).
ElementContent (wt.%)
Area 1Area 2Point
Si4.35 ± 0.329.79 ± 0.3612.39 ± 0.39
Ca54.75 ± 1.4831.70 ± 0.808.20 ± 0.21
Mg2.28 ± 0.261.33 ± 0.0914.43 ± 0.57
Al3.55 ± 0.300.63 ± 0.06-
Fe--1.25 ± 0.07
K-0.52 ± 0.50-
O22.05 ± 5.8634.31 ± 3.7833.47 ± 2.81
C2.05 ± 1.156.48 ± 1.009.12 ± 0.94
Au6.39 ± 0.4715.25 ± 0.5021.14 ± 0.59
Table 4. dhkl-spacing of clinochrysotile.
hkldIntensity
7.7068111.47311
0027.3279512.068100
0204.5263819.59716
0043.6490224.37371
2.7417532.6346
1312.6021734.4389
−2022.5323835.4186
2022.4526236.61016
2042.0966943.1096
0601.5323960.35512
2471.3130571.8396

