1. Introduction
The research purpose of this paper is to shed light on the concept of the reliability of the decision supports that are developed by means of supervised techniques of Machine Learning (ML). In particular, our approach focuses on the reliability of the ground truth that is generated in multi-rater settings and used to train and validate such ML models. In this paper, starting from
Section 2, we will also discuss the relationship between the reliability of the ground truth and the reliability of the resulting decision support.
In the ML literature, the ground truth is usually assumed to be 100% accurate, and as such, the ML predictive support’s reliability is evaluated as its capability to reproduce these annotations with no error (i.e., through their accuracy). Nonetheless, it is well known that medical ground truths are far from perfect: medical experts involved in the annotation task are clearly not infallible (recent estimates of the diagnostic accuracy of model experts may range between 80% and 90% [
1,
2]); a large inter-rater disagreement among the experts involved is usually observed (e.g., an inter-rater disagreement of around 50% was reported in [
3] on an X-ray-based diagnosis task); and in general, medical experts may have varying degrees of confidence in the annotations they produce (although this is seldom checked, if ever). Further, it has recently been highlighted that the data quality issues affecting the ground truth may severely impact the reliability of the ML predictive models that are trained and validated on them [
4,
5,
6], likely making each estimate of their reliability optimistic.
While in the technical literature, the concept of reliability in multi-rater settings has usually been equated to inter-rater agreement [
7], in this paper, we argue that agreement is but one component of reliability: indeed, as highlighted previously, reliability represents a multi-dimensional construct comprised of both confidence, which regards the extent the involved raters are certain of the expressed ratings, and competence, which regards the accuracy of the involved ratings. For these reasons, in this article, we focus on the study of how to assess the reliability of ground truth datasets in multi-rater settings by proposing a novel reliability metric that takes into account three dimensions: agreement (that is, how much a group of raters mutually agree on a single case); confidence (that is, how much a rater is certain of each rating expressed); and competence (that is, how accurate a rater is).
The rest of this article is structured as follows:
In
Section 2, we discuss the concept of reliability in decision support, and we will show, also in visual form, the relationship between this concept and the degree of agreement between raters, the quality of the ground truth in multi-rater settings, and the accuracy of the resulting models. To this aim, we will outline the main approaches proposed in the literature to measure the concept of reliability, and what are their main shortcomings that we aim to overcome with our proposal;
In
Section 3, we introduce and discuss the proposed weighted reliability scores; to this aim, we will present the underlying theoretical framework and its analytical derivations. Further, in
Section 3.2, we discuss the main so-called paradoxes of reliability, which are intuitive properties that a measure of ground truth reliability should satisfy, but are violated by the most common and frequently adopted measures, and we will show that our metric is resistant to these paradoxes. Finally, in
Section 3.3, we describe the design of a user study we performed to provide a proof of concept of our metric and to illustrate the main differences between the proposed solution and commonly adopted reliability metrics;
In
Section 4, we report on the results of the above user study, while in
Section 5, we discuss these results and, more in general, how the proposed reliability metric can be used for, and put in relation to, the assessment of the reliability of an ML decision support;
Finally, in
Section 6, we summarize the main contributions of this paper and describe the motivations for further research.
2. Background and Motivations
Currently, the application of Machine Learning (ML) is recognized as a potential game changer in medicine [
8]. Most of the systems that recently achieved—and even overcame—human performance in discriminative tasks, such as diagnosis and prognosis [
9], are based on the methods and techniques known as supervised ML, in that the resulting models are optimized to discriminate among predefined conditions (i.e., classes). In supervised ML, by definition, human involvement is necessary to build the ground truth [
10,
11,
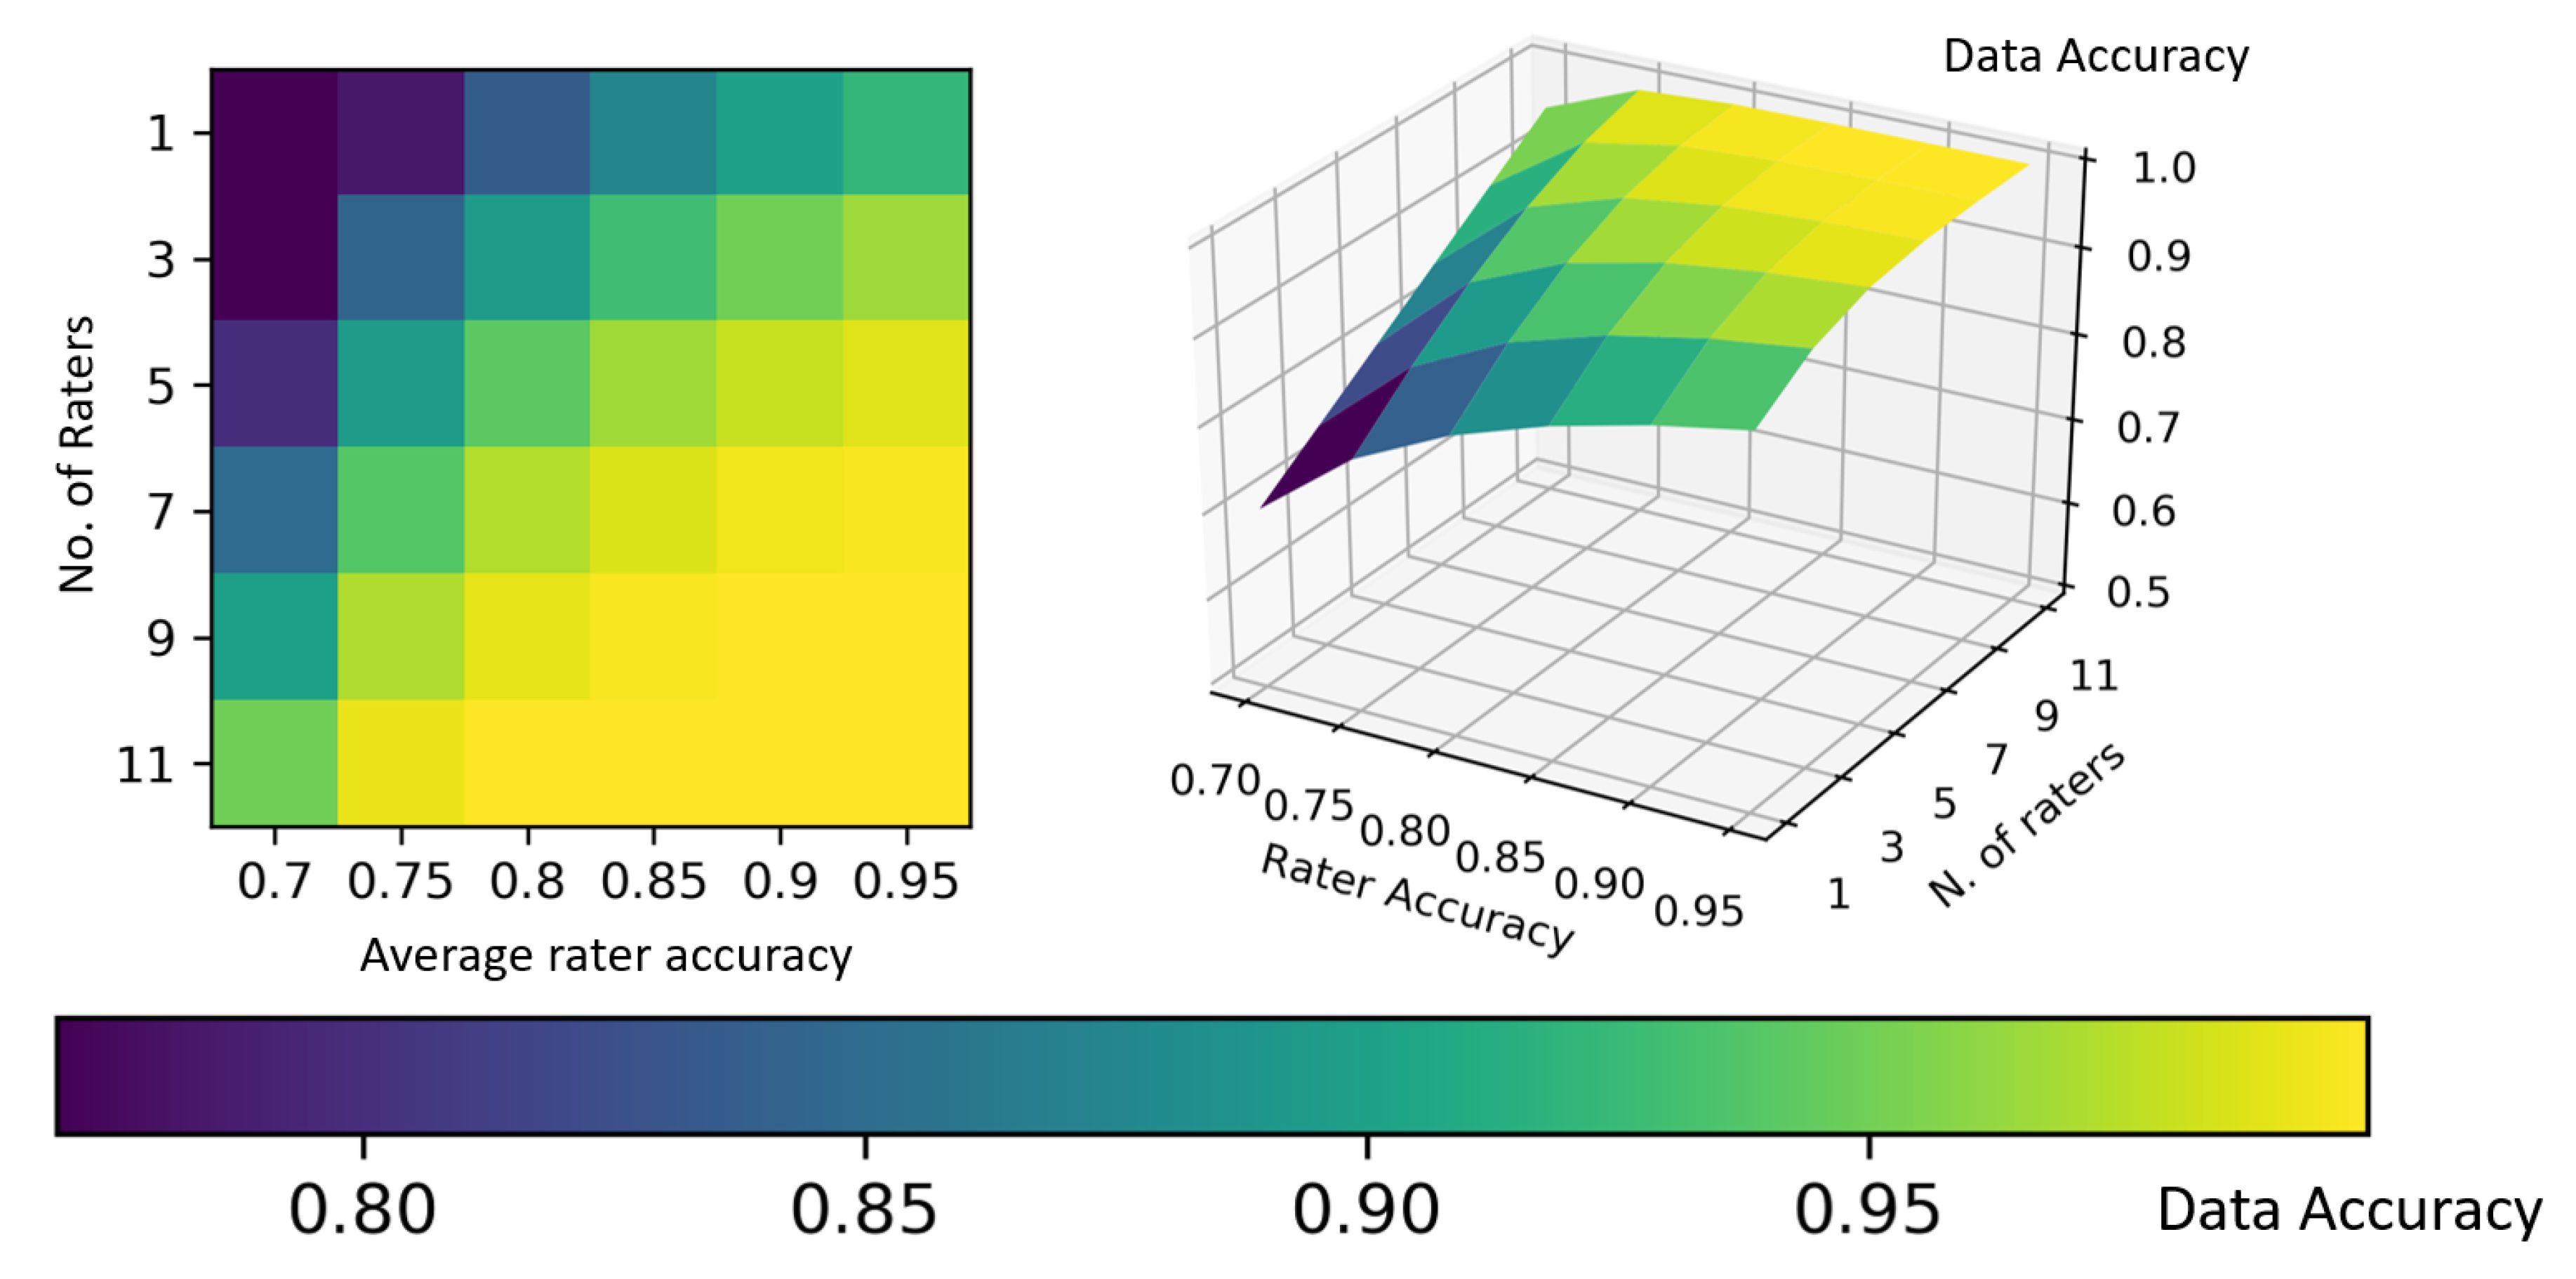
12], that is the reference data on which the above discriminative models are trained. In ML, ground truth data are considered 100% accurate by definition. However, recent research has pointed out that a 100% accurate ground truth is possible only in fictional settings: indeed, the works in [
5,
13] highlighted a theoretical relationship existing between the number of involved experts and the accuracy of the resulting ground truth, whose analytical form is graphically depicted in
Figure 1.
As shown in the figure, a single infallible expert would be sufficient to obtain a 100% accurate ground truth. Unfortunately, human experts are all fallible, to some extent: in diagnostic tasks, the average accuracy of medical experts ranges from 80% to 90% [
1,
2], whereas the “average error rate among radiologists is around 30%” [
14], although these figures can greatly vary, according to the specialty, exam modality, settings, and many other factors [
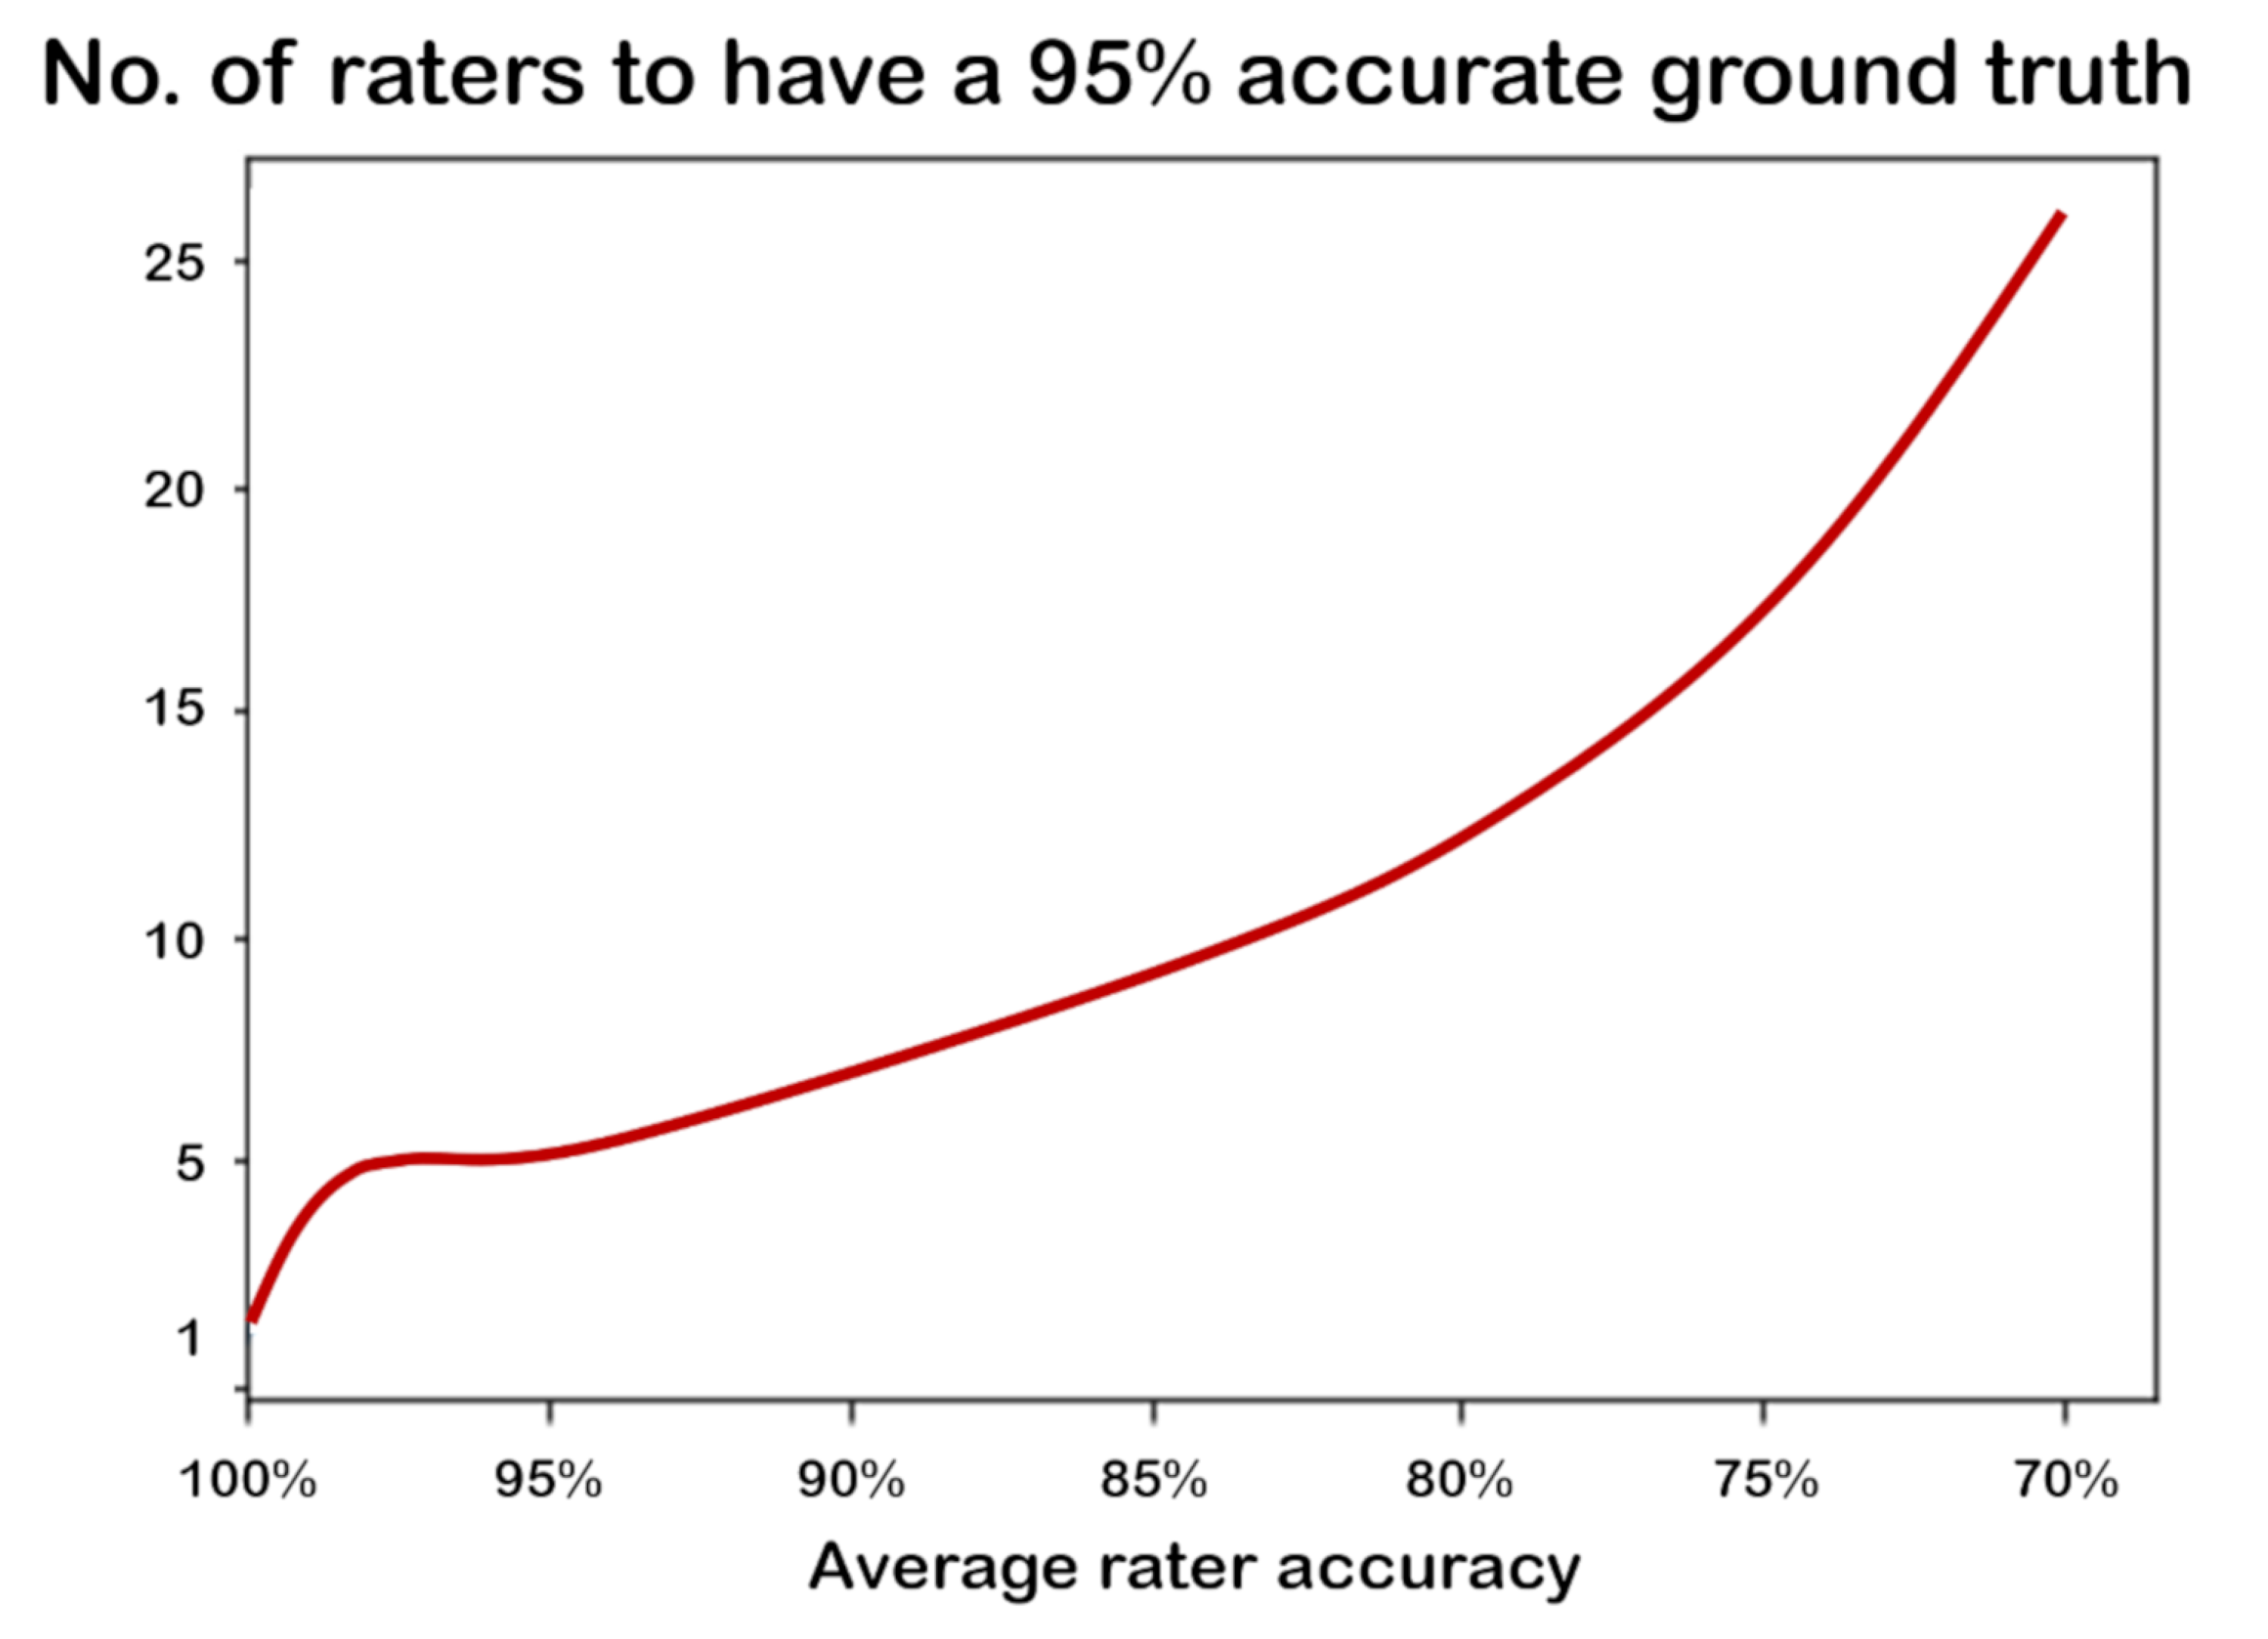
15]. Therefore, if we take these estimates at face value, a simulation based on these estimates (see
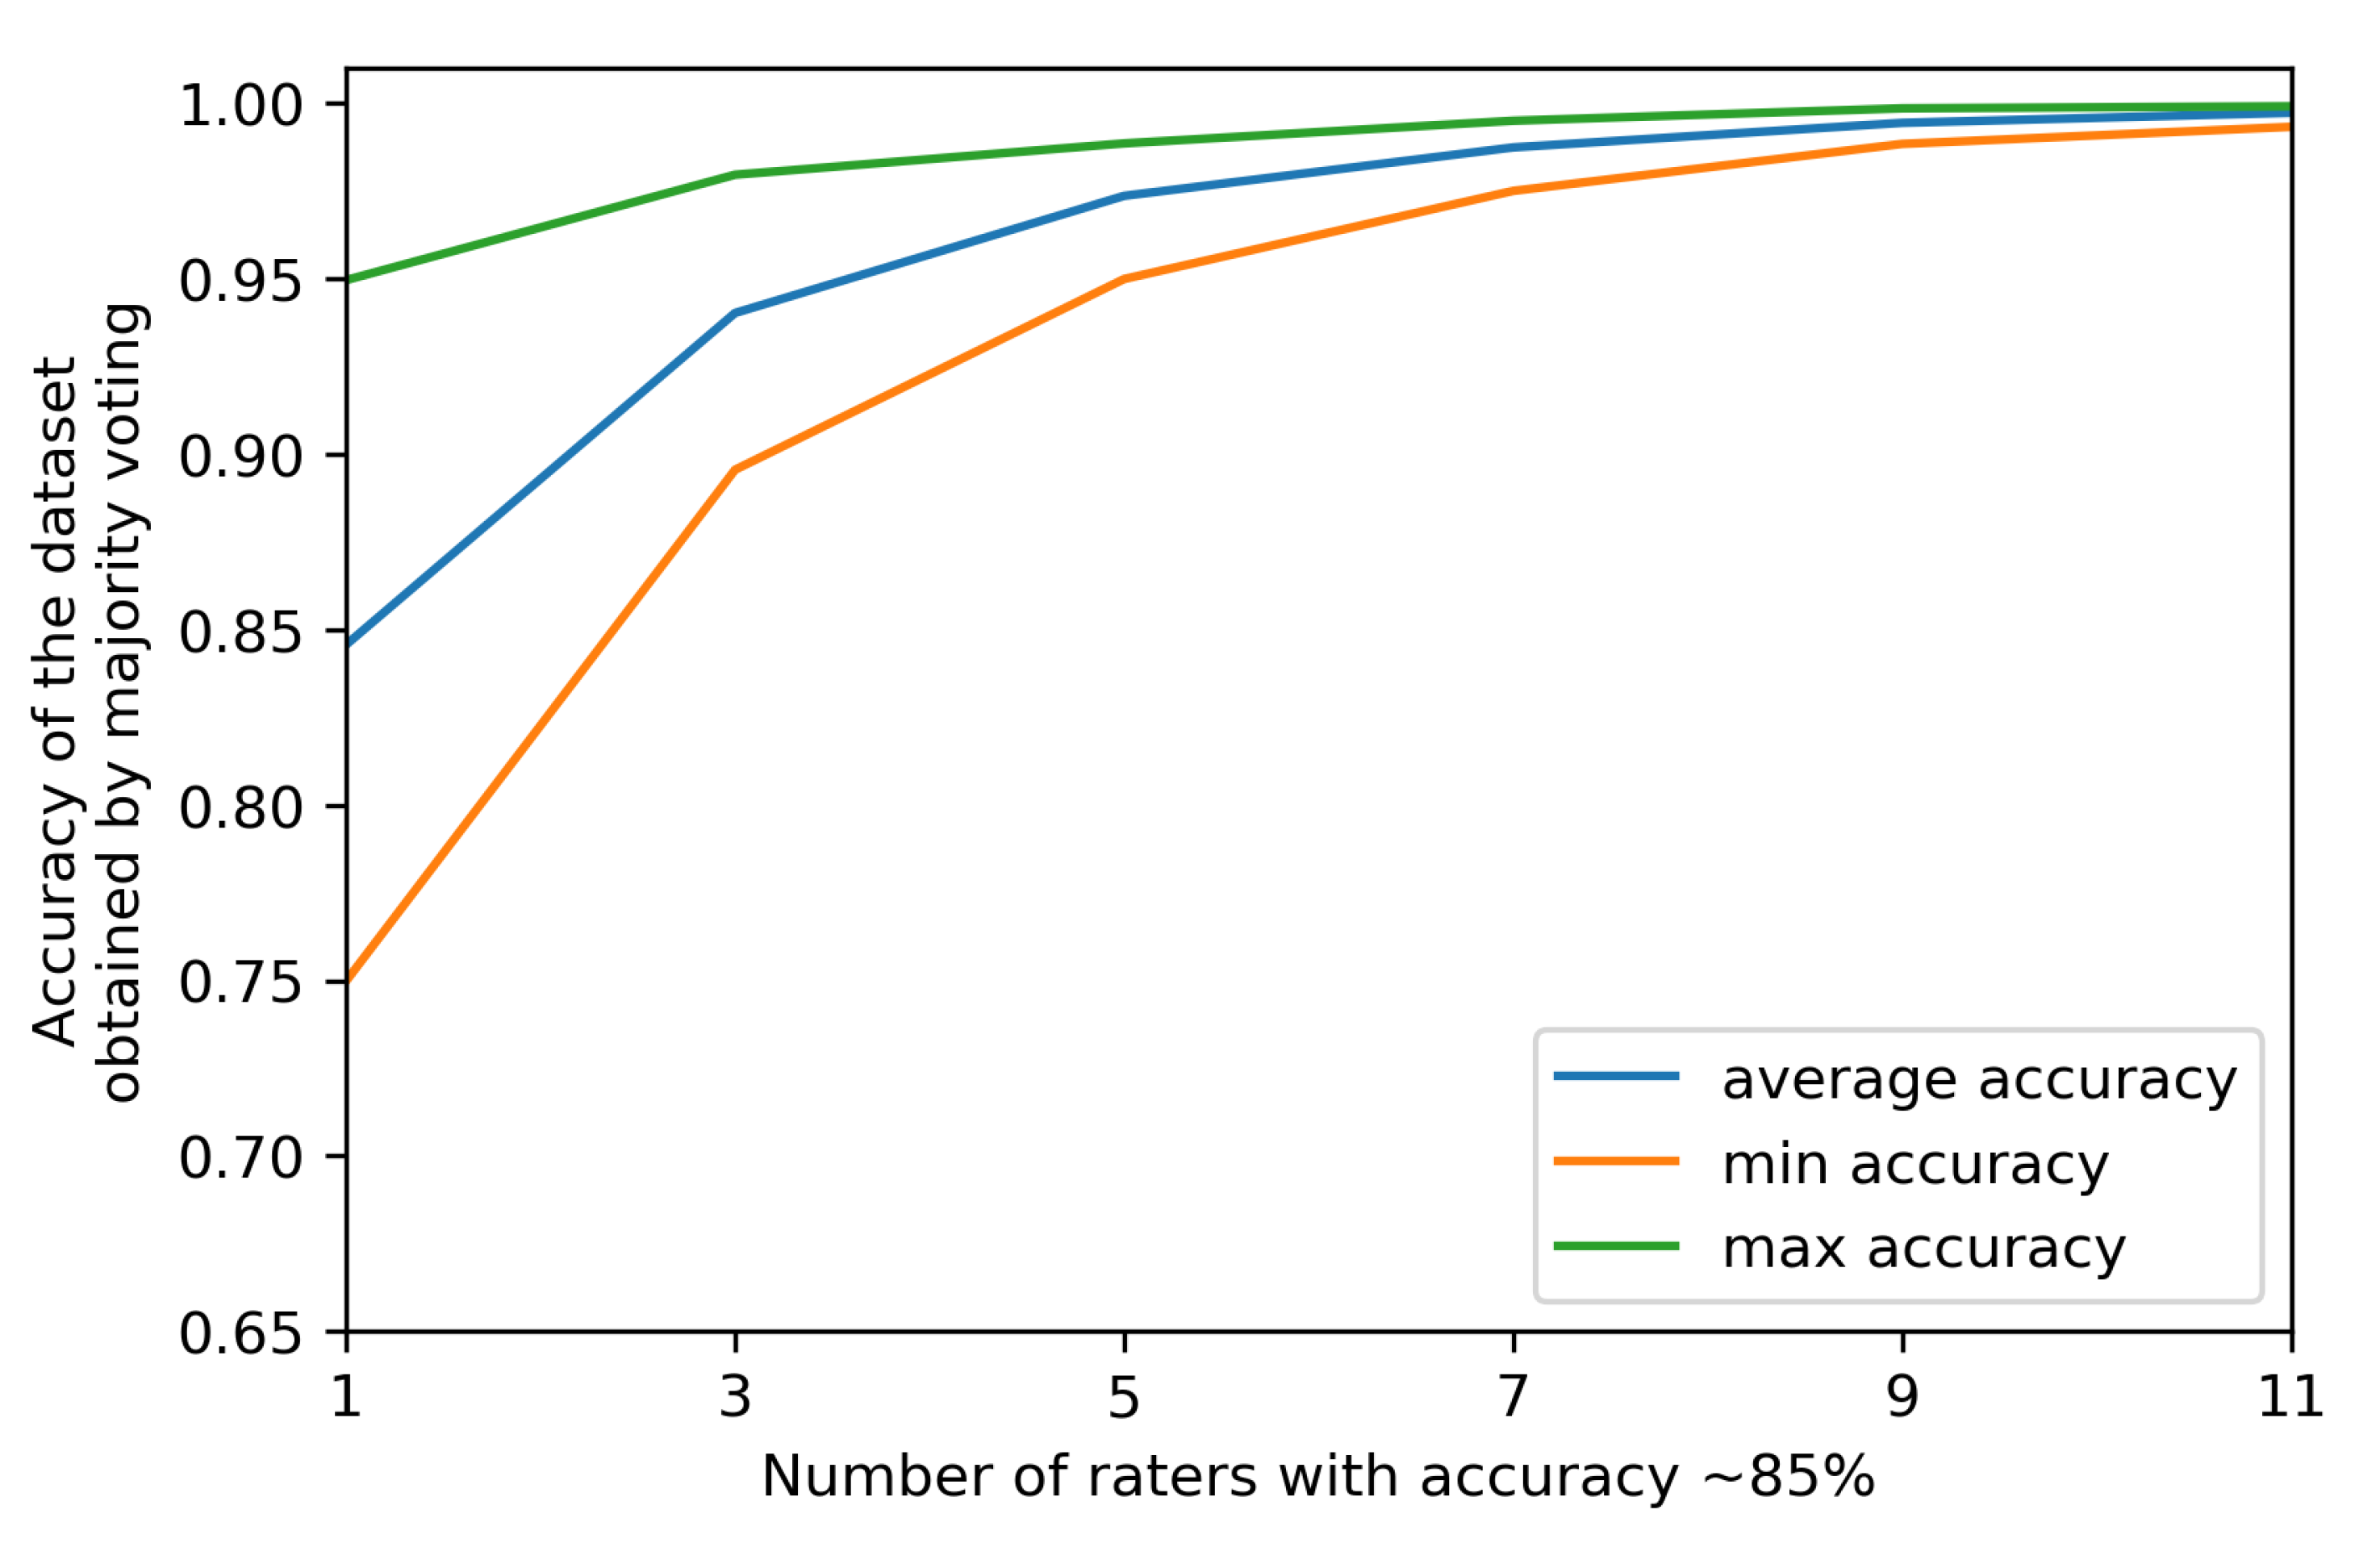
Figure 2) shows the intuitive notion that the more experts are involved in labeling a set of cases, the more accurate the resulting ground truth, when this latter is derived by applying the method of majority (or plurality) voting, that is simply assigning to each case the label that has been selected by the majority of the involved experts.
Looking at
Figure 1 and
Figure 2 stimulates some reflections. First, the bad news is that normal (i.e., averagely accurate) raters will never yield a 100% accurate ground truth, although such a ground truth is assumed in all and every ML project. However, it is true that unity is strength (see also
Figure 3): the smallest team of annotators to let a majority emerge (i.e., three raters) increases its collective accuracy by approximately eight percentage points with respect to the average accuracy of the single members of the team; likewise, a relatively small number of raters (like seven for binary tasks) is sufficient to achieve the high accuracy (although not perfect) of the ground truth. However, any estimation depicted in
Figure 2 assumes to know the accuracy (that is, the competence) of each rater, or at least their average as a collective, and furthermore, that the errors that the raters make are non-correlated. This is seldom the case in general, and obviously impossible for the specific cases to label.
Furthermore, majority voting is not panacea: there will be times in which more raters are wrong than those who are right, thus leading to selecting the wrong label for a specific case. For instance, if the ML developers involve less than 10 raters (as is often the case), the number of times consensus is established on the basis of narrow or slim majorities (i.e., by only one rater) is higher than the opposite case (e.g., 55%, 63%, or 75% of the times, if the raters are 7, 5, or 3, respectively) (furthermore, for this reason, alternative methods to derive the ground truth from multi-rater labeling may be more powerful [
5] than majority voting, although they are very seldom applied).
Thus, it is intuitive to understand that the higher the agreement, whatever it is, the “sounder” the majority and the more reliable the dataset. The easiest way to represent agreement is in terms of the percent of agreement (
), that is the ratio between the number of times the raters agree and the total number of joint ratings (see
Figure 4). However, as is well known [
7,
16,
17], this rate overestimates agreement (and hence reliability) in that (intuitively) raters can agree by chance, and not because they really agree on how to label a specific case. We call this latter case genuine agreement. To take chance into consideration, and discount it from agreement estimation, several metrics have been proposed [
18] to assess the reliability of the data produced when at least one rater involved disagrees with the others in regard to some rating: here, we can mention the Pearson r, the Spearman Rho, the intra-class correlation coefficient, the concordance correlation coefficient, and the most commonly adopted ones, that is Cohen’s kappa (for two raters), the Fleiss kappa (for three or more raters) [
19], and Krippendorff’s
[
20]. Although these metrics adopt a model of chance to account for the effect on agreement, they present some limitations, like restrictions on the data type they can be applied to, their ability to work with missing ratings, or their being undefined for single cases. Moreover, they are not free from known paradoxes, which have been discussed in some specialist works [
7,
21,
22,
23,
24,
25], among which we will discuss the main ones in
Section 3.2 to show how our proposal is less prone to these shortcomings. Traditionally, inter-rater agreement scores are considered good proxy indicators of the reliability of data (e.g., [
26]). However, as we argue in the following section, this may clearly be seen as a simplistic view that does not account for the multi-faceted nature of reliability.
Reliability in Decision Support
In this paper, we focus on the concept of the reliability of decision supports that are developed by means of supervised techniques of Machine Learning (ML). As is widely known, this class of decision supports is not grounded on rules that are extracted from how human experts act and make decisions, or from directly asking them about their reasoning and decision criteria; rather, these systems ground their advice on data patterns and correlations that specific algorithms can detect among the features of large datasets and reproduce when fed with new data points. This characteristic motivates a first intuition, which we will investigate in our study: that the classification reliability of these systems (i.e., whether they are good classifiers or not) is related to the reliability of the data these systems have been trained on, i.e., their ground truth, to approximate and reproduce the patterns found therein (see
Figure 4). A first consequence that follows from this intuition is that the actual accuracy of ML models is different from the “theoretical” accuracy that is evaluated by assuming the ground truth to be 100% accurate (right side of
Figure 4), and that is generally considered the only accuracy we should care about and report in our scientific articles.
For instance, what would it mean that an ML model has been trained on a 85% accurate ground truth? If the model performance was reported to be 98% accurate, that is a very good performance (close to perfection in some respect), its actual accuracy would be 83% instead, which would be a much lower performance: in particular, this means that the ML model, instead of being almost perfect, actually makes mistakes with the same frequency with which a six can come out by rolling a dice.
For the above reasons, in this paper, we will pursue the research goal to assess how “reliable” the ground truth is in ML settings, because this reliability does affect what we are more interested in, that is the reliability of the decision support. This is a challenging task because this assessment must be obviously made in the absence of further reference data acting as a gold standard.
Thus, this work is aimed at filling the gap in the literature to bridge the general notion of reliability to a more technical and specific notion in the decision support domain, a notion that directly combines the (theoretical) accuracy of ML models and the reliability of their training data (or ground truth), to get what we denote as actual accuracy (see
Figure 4 and
Figure 5).
The concepts implied by the term reliability are wide and various enough to lay this latter open to multiple interpretations and, what is worse yet and is our concern, to a less than comprehensive and sound evaluation. As the common sense suggests, reliability regards the extent “something” is good enough to be relied upon. Hence, this term is often assimilated as trustworthiness and accuracy. Keeping aside the former concept, which also includes the users’ attitudes and perceptions, the latter concept can be applied to both machines (including computational decision aids) and measurements (that is, data). In the former case, a reliable predictive system is capable of giving the right answer (it is accurate); in the case of reliable data, these are such if they are an accurate representation of the reality of interest. However, both predictive systems and data present the same shortcoming: we cannot say whether the answer of a predictive system is the right one (otherwise, we would not need it), nor can we be sure our representation is true, unless compared with a true representation (which would be our data if it existed). Thus, while for predictive systems, we usually settle for a probabilistic estimation of their future accuracy, for data, we have to consider the second component of their accuracy (besides trueness), that is the precision of the process that generated them (not to cause confusion to the reader, we make it clear that in the social sciences, the term precision is related to the “resolution” of data [
27]). This concept is usually equated to the replicability of measurement and to the mutual closeness of indications that come from multiple observations of the same object or phenomenon of interest [
28]. Therefore, in any real-world multi-rater setting, the accuracy, and hence the reliability, of data can then be traced back to the agreement among the raters involved in producing them.
However, the main motivation for proposing a new reliability metric based on agreement evaluation lies in the recognition that agreement is but one component of reliability. In this paper, we make the point that reliability represents a multi-dimensional construct comprised of both confidence, which regards the extent the involved raters are certain of the expressed ratings, and competence, which regards the accuracy of the involved ratings.
Our main assumption is that a sound reliability measure should not only value agreement that is purely due to chance less than genuine agreement, which is what reliability measures typically do, but should also value agreement on the wrong labels (also in those cases when the label trueness is not known a priori) less than agreement on the right labels: to make this aspect clear, it suffices to notice that a ground truth built by two raters who are always in mutual agreement, but systematically propose the wrong interpretation of the phenomenon under consideration should not be considered reliable at all. However, none of the proposed measures takes into account this aspect, only considering the agreement component of reliability [
7].
These considerations bring us to consider three aspects of reliability which are seldom considered and will be addressed in
Section 3:
How to assess the extent the raters involved genuinely assert one specific rating instead of another, beyond self-assessment or naive chance models;
How to take into consideration properly, in the definition of a measure of reliability, not only the mutual agreement of the involved raters, but also their competence in the specific task of annotation and the confidence they attach to their ratings;
Lastly, how to combine these two components into a single coherent measure of the reliability of a set of annotated cases.
3. Method
As stated in
Section 1, we consider the raters’ reliability as a composite construct comprising the inter-rater agreement, the raters’ confidence (i.e., the self-perceived ability to make a convincing decision for a specific case, or to avoid guessing), and their competence (i.e., the ability to make the right decision, in general).
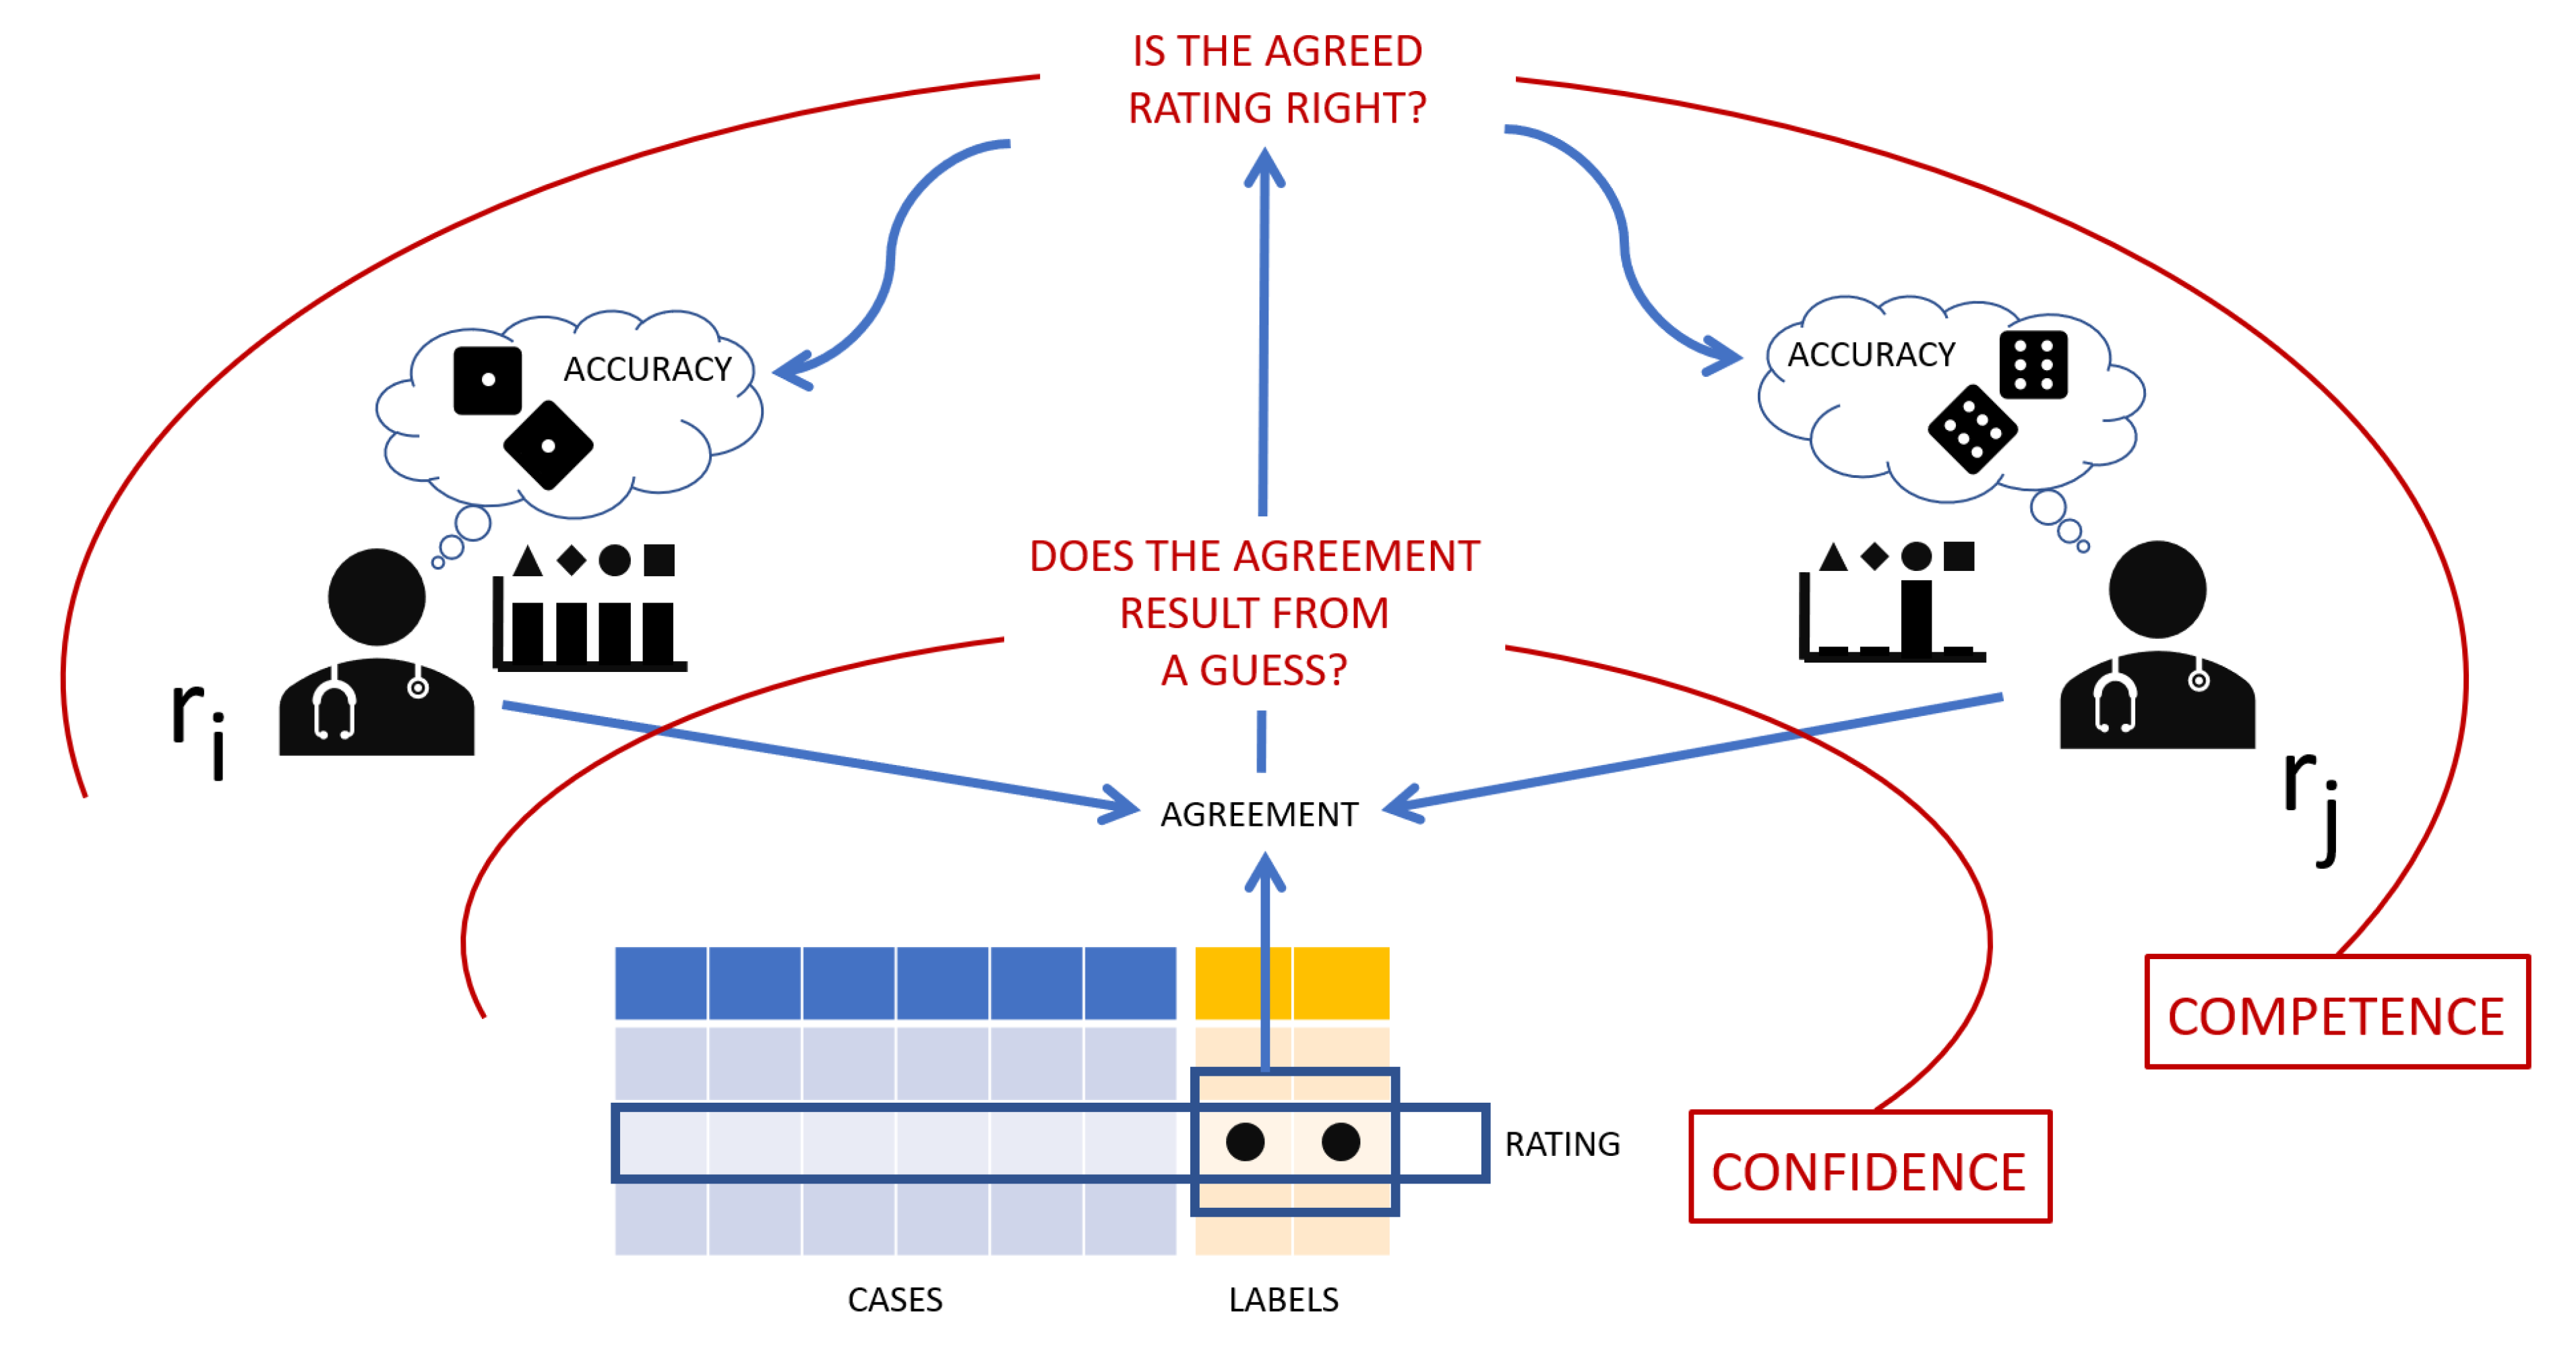
In what follows, we will consider a rating an association between a case and a label (equivalently: the relationship between an instance and its target class): that is, a single labeling. Intuitively (see
Figure 6, an agreement occurs when two raters assign the same label to the same case (or object, instance, phenomenon, etc.). We do not know whether a rating is right (i.e., including the true, but unknown label), but we assume that the more agreements (which, as mentioned above, are detected by the simple identity of responses given by a pair of raters) a rating gets, the stronger the evidence of it being right, and hence its reliability. In the “race” to become “truth” (or better yet, part of the ground truth), if we adopt majority voting (which is a simple, but effective method), the rating with the higher number of agreements wins.
However, we should not consider all agreements equal. In the literature, it is common to consider that some agreements are due to chance. Usually, the effect of chance is discounted on the basis of a model that is derived from the whole distribution of ratings in the dataset [
7]. We consider this approach a limitation of these models, in that metrics that are adjusted in this way cannot be applied to single cases, but only to whole datasets, and the bigger these are, the better. In order to overcome this common limitation, we developed an alternative metric that first defines a single-agreement reliability, then a case reliability (averaging over all of the agreements), and finally, a dataset reliability (averaging over all of the cases included in the dataset).
To define an agreement reliability, our method leverages the confidence of the raters involved, when we ask them to estimate the confidence of their ratings. If this confidence is high, we assume the raters have not guessed. If both raters (who agree with each others) are highly confident, we assume their agreement is genuine, that is not due to chance.
However, we must also take into consideration the competence of the raters, as a way to discern between agreements made on a correct label and agreements that are wrong.
To this aim, we consider the rater’s skill. This can be estimated in many ways, both qualitatively and quantitatively. In this latter case, a proxy dimension of the raters’ competence is their average accuracy. The average accuracy of each single rater can then be estimated on the basis of a specific evaluation test or, more conveniently, on the basis of the majority voting of the other raters involved.
With reference to
Figure 6, our method to quantify the reliability can be described as going backwards from an observed rating about which two raters agree, i.e., an agreement: first, we evaluate whether, based on the raters’ confidence for the given rating, the observed agreement is genuine or only due to chance; second, we consider whether the agreed-upon rating is right or not, based on the raters’ competence with respect to the discriminative task at hand.
3.1. Derivation of the Weighted Reliability Score
We will assume the following setting: each rater in a group of k is asked to provide a label (from a given label set , which we assume to be categorical) to each case x in a dataset S. We denote rater ’s labeling of case x as .
Furthermore, each rater is also asked to report his/her confidence in each label he/she gives. As previously stated, we consider reliability to be a composite construct, defined by the raters’ confidence and competence.
As anticipated above, our method can be seen as going backwards from an observed agreement; thus, we first need to ask whether an observed agreement was genuine or due to chance. To this aim, we assume a two-step decision procedure, which can be seen as an instantiation of the standard decision-theoretic setting for decision under risk [
29]: first, the decision maker flips a biased coin to choose between random choice (i.e., the random selection of a possible alternative according to an a priori probability distribution) with probability
and peaked choice (i.e., the selection of an alternative according to an informed, case-dependent, distribution) with probability
. Here,
is the confidence expressed by the rater in her/his decision
, which we equate to the unconditional probability of the fact that the observed label
has been chosen genuinely and not simply by chance (i.e.,
).
Then:
If rater has “chosen” random choice, then we assume her/his label is selected according to a distribution where (assuming a uniform distribution of the alternatives) or where is an empirical prior estimate of the real prevalence of i (this can be derived from a ground truth labeling, if available, or considering all the labelings given by the multiple raters);
If rater has “chosen” peaked choice, then we assume her/his label is selected according to a distribution where .
The conditional estimate:
can be obtained as:
Thus, given two raters
who have been observed to agree on case
x (i.e.,
), we want to quantify the probability that the observed agreement is not due to chance; this means that both raters selected the peaked distribution, that is a Genuine Agreement (GA) occurred. Assuming that the two ratings were given independently, then the pairwise GA is defined as:
We can now define the degree of concordance
, as a measure of the proportion of genuine agreement (in either a single case or in a whole set of cases): this metric is simply defined as the average of GA both case-wise and sample-wise. First, we define the case-wise degree of concordance:
where the factor
is the number of pairs of raters in
R. We then define the degree of concordance as the average of the case-wise
over the whole sample
S, that is:
Thus far, we only considered the agreement dimension of our definition of reliability; by following our backward reasoning (see
Figure 6), we then discount the obtained degree of concordance with the raters’ competence in the task at hand. To this aim, we need an estimate of the accuracy
of each rater
i on each case
x. If we were to know the correct label
for each case
x, then we would simply set
. However, this is usually not possible, and we would need to resort to a probabilistic estimate of the rater’s accuracy.
This latter can be set either on the basis of the empirical accuracy of the rater estimated on another dataset sample, which would however provide the same value
for each
x, or on the basis of a model-based estimation, such as the Rasch model [
30]. In this latter case, assuming that for each case
x, an assessment of its complexity
is available, the value of
can be estimated as follows:
where
is an estimate of rater
i’s ability or expertise.
Thus, having an estimate of each rater’s accuracy on each case, we can quantify the probability that an observed agreement is right (i.e., equal to the true, unknown label) as:
From the degree of concordance, we can then define a composite reliability measure, the so-called weighted reliability score, or
, which also takes into account the accuracy of the raters and is defined at both the single case and whole dataset level:
3.2. Paradoxes of Reliability Measures
Given the large number of proposed reliability measures, there has been an interest in proving one metric “better” than the others, in some respect. This has typically resulted in focusing on so-called paradoxes, i.e., statements asserting that a given class of reliability measures violates a set of intuitive properties. While we do not necessarily subscribe to viewing each and every violation as a paradox (e.g., see [
25,
31,
32,
33] for an account of this meta-perspective on so-called paradoxes of reliability), in what follows, we will show that the increased flexibility of the
(resp.
) can be used to overcome (or simply shed light on) these properties. In particular, we will focus on two paradoxes that have been widely studied and discussed in the relevant literature [
21,
22,
25,
34] in regard to the most common and frequently adopted reliability measures, that is kappa and
.
Paradox 1. High agreement, but low reliability: Let be the set of possible classes. Suppose that all raters agree on assigning 0 to all cases but one, and on assigning 1 to the remaining case. Then, the observed agreement is perfect, but the value of kappa (or α) is . If all the raters would have agreed on assigning the same class to all labels, then the value of kappa (or α) would be undefined.
Paradox 2. In the case of two raters, when considering the distributions of labels for the raters, unbalanced distributions produce higher values of kappa (or α) than more balanced ones even when the observed agreement is the same.
We argue that both of these paradoxes arise from the interdependence in the definition of kappa and between the model of the chance effects and the distribution of the labels among the raters. Thus, the paradoxical properties mentioned above are an intrinsic feature of any reliability score that does not separately models the self-agreement of the raters and their chance effects. Moreover, in regard to Paradox 2, we doubt this should be considered a negative feature: a sound reliability measure should exhibit this behavior whenever a model of the chance effects of the raters is not available: in the cases described by this paradox, if one of the two classes is much more represented in the dataset (and this mirrors the real population of interest), then the likelihood that the raters agreed just by chance is high, since they could have agreed just by selecting the most probable answer. In the extreme case where all the raters assigned all the cases to the same label, then the reliability of the dataset would be undefined as there is no way to understand if the observed agreement was genuine or due to chance. However, this observation does not apply to the weighted reliability score (nor to ) due to the increasing flexibility of the chance model we adopted in its definition. In particular, the value of depends not only on the distribution of the classes in the dataset (which influences only the weighting factor in the definition of ), but also on the confidence values . Thus, formally:
Theorem 1. Let D be a dataset, and let be the labeling given by rater i on case x, with C the set of class labels. Let . Then, , and further, σ depends only on and .
Proof. From the definition of
in Equation (
4), it is evident that
and
iff
. Obviously, also, the definition of
only depends on the stated factors. □
Definition 1. We say that two probability distributions are marginal symmetric if there exists a permutation π s.t. are both increasing, balanced if they are both the uniform distribution, and marginal asymmetric if there exists a permutation π s.t. are inversely ordered.
Theorem 2. Let be three datasets, with the same observed agreement annotated by two raters . Let (resp. ) be the distribution over the class labels given by rater (resp. ) for dataset . Assume that are marginal symmetric, are balanced, and are marginally asymmetric. Furthermore, let be the same empirical distribution of the classes for each rater. Then, not necessarily, . □
Proof. By Definition
4 and Theorem 1, the value of
only depends on
and
(hence, in this case, on
). Thus, it suffices to set the values accordingly for the three datasets.
3.3. User Study
In order to assess the feasibility and describe the usage of our metric, and more in general, describe the different dimensions that could affect the ground truth quality in a multi-rater setting, we designed a user study involving a team of domain radiology experts in a realistic task of data annotation for ground truthing purposes, namely the annotation of knee Magnetic Resonance Imaging (MRI). Specifically, we asked 13 fellowship-trained musculoskeletal radiologists in Italy to label 417 MRIs randomly extracted from the MRNet dataset [
35] (
https://stanfordmlgroup.github.io/competitions/mrnet/) so that the two classes were almost perfectly balanced, with normal MRIs accounting for 55% of the labeled samples and abnormal MRIs accounting for 45% of the labeled samples.
For each of these images, the doctors were asked to assess: the presence of abnormalities (therefore, it was a binary classification setting with ) and their confidence in such annotations, on a 5-value ordinal scale. These annotations were also used to evaluate the discriminative competence of the raters in terms of accuracy, by comparing their ratings with the MRNet ground truth taken as a reference.
4. Results
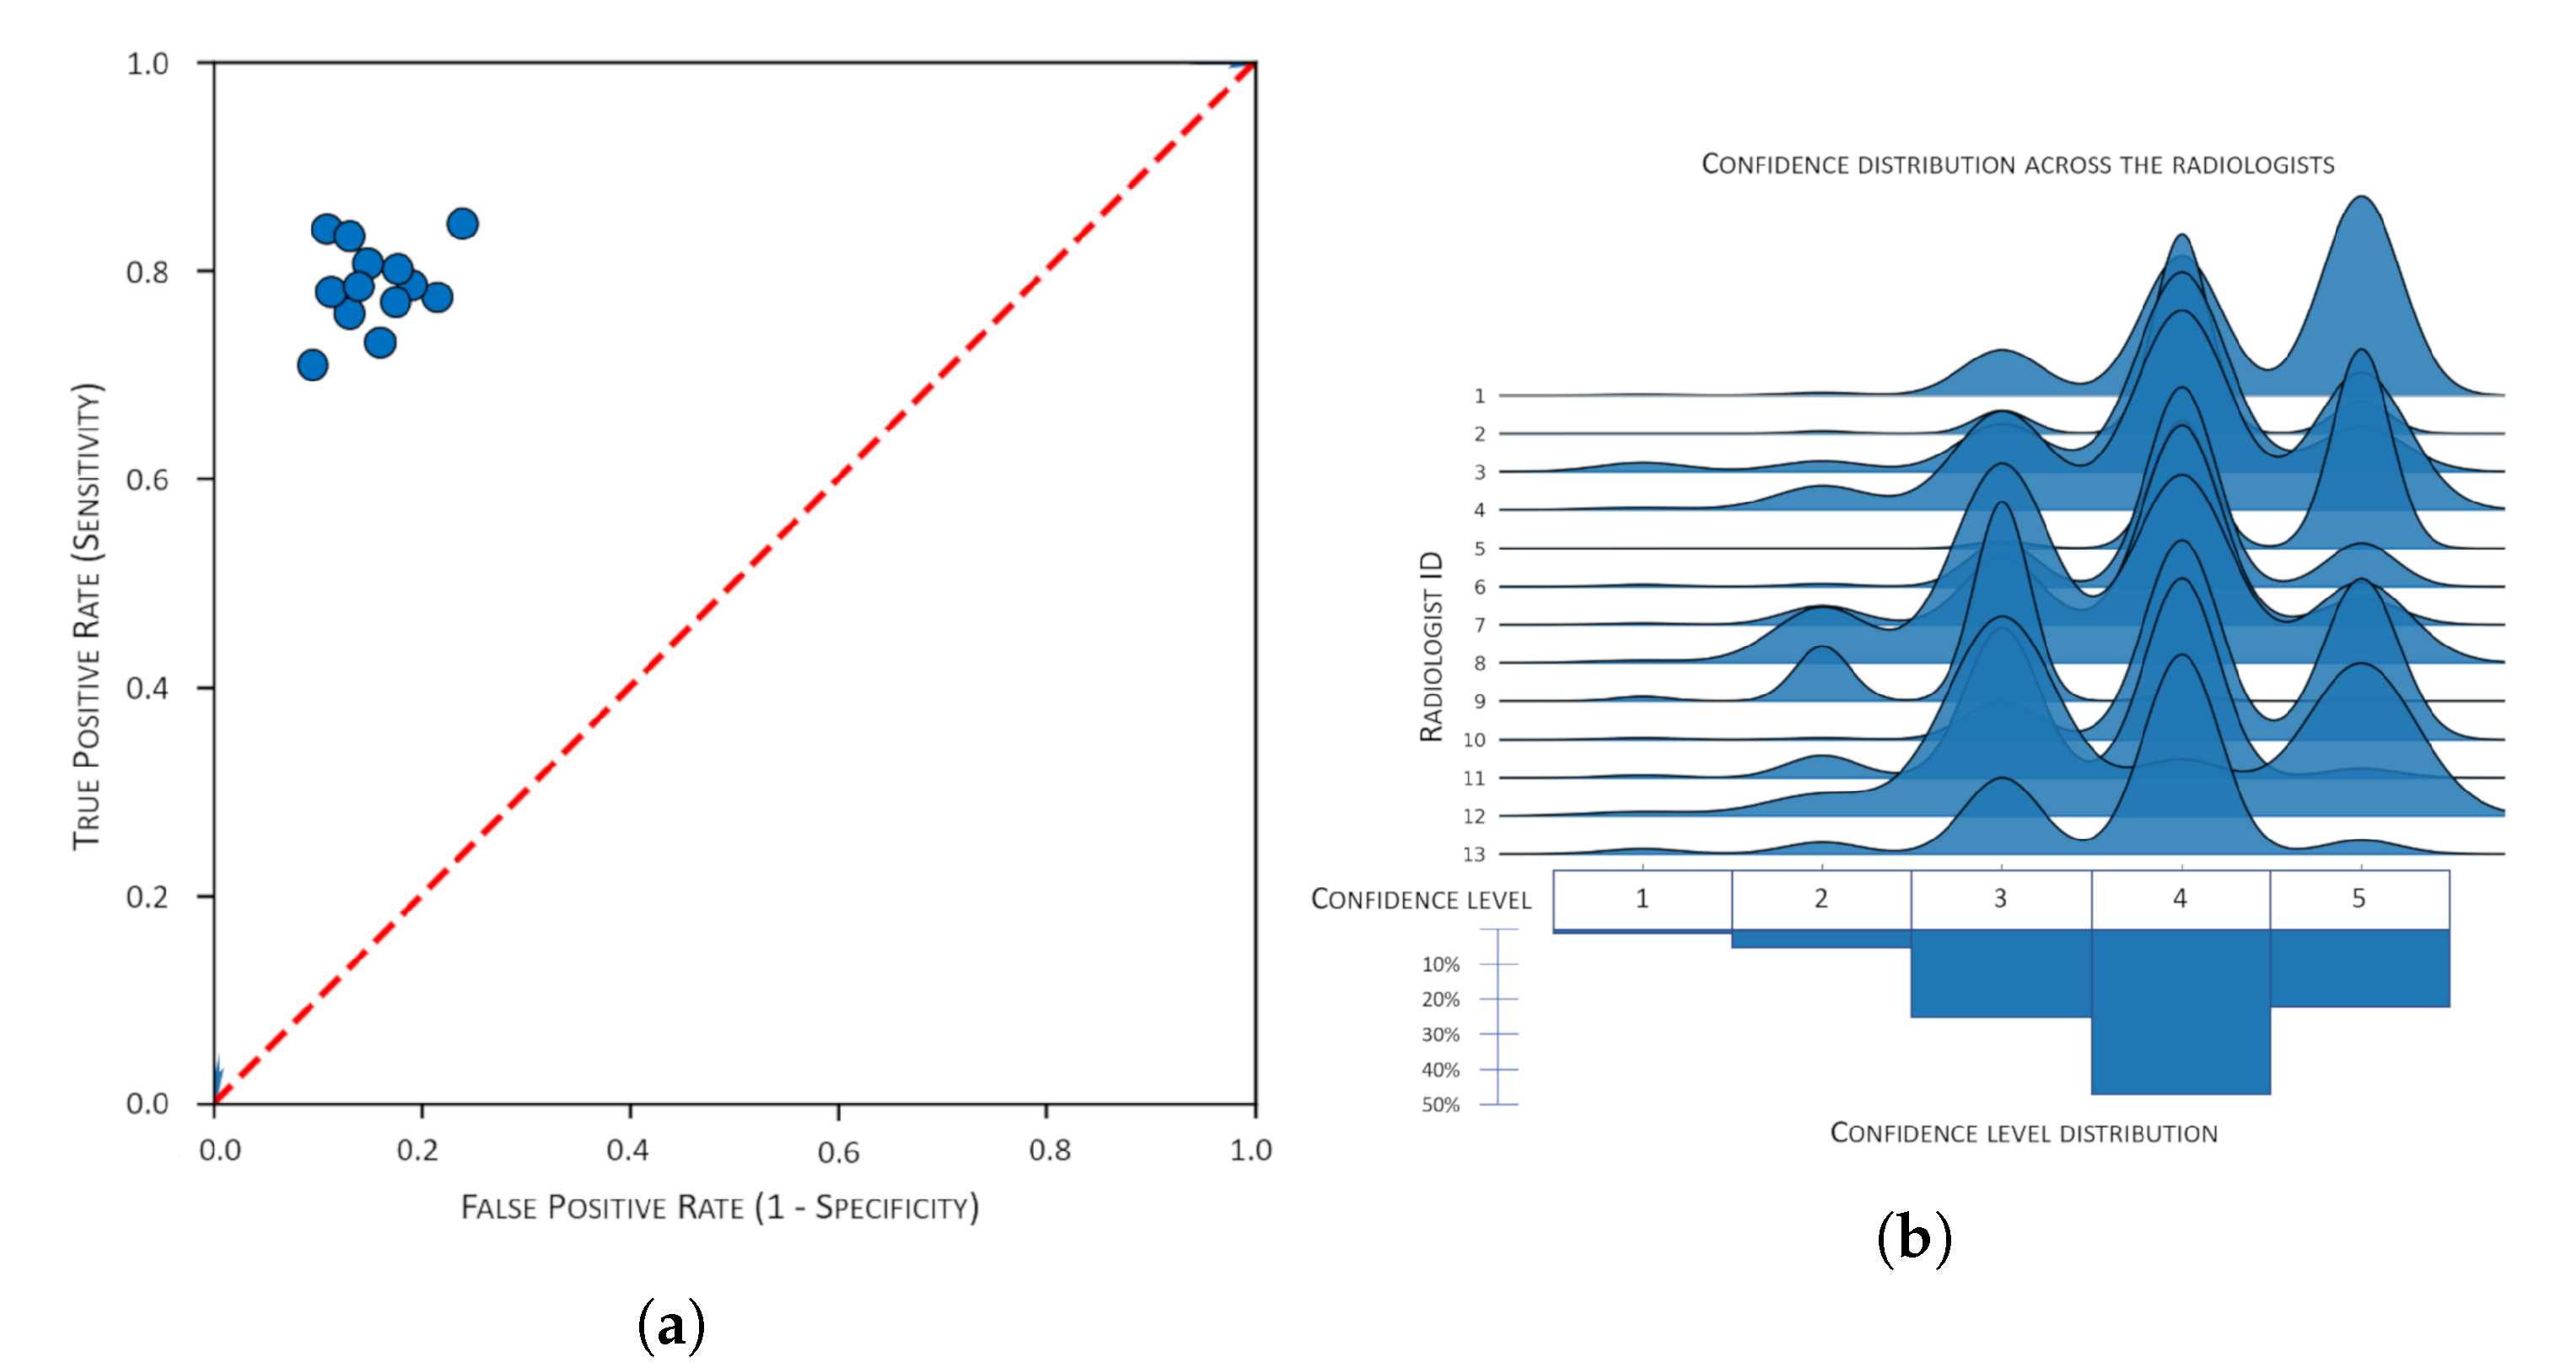
The average accuracy of the 13 radiologists involved was
(95% confidence interval). The radiologists’ performance (in terms of the true positive rate, i.e., sensitivity, and the false positive rate) is shown in
Figure 7a.
The distribution of reported confidence for each of the radiologists is shown in
Figure 7b, while
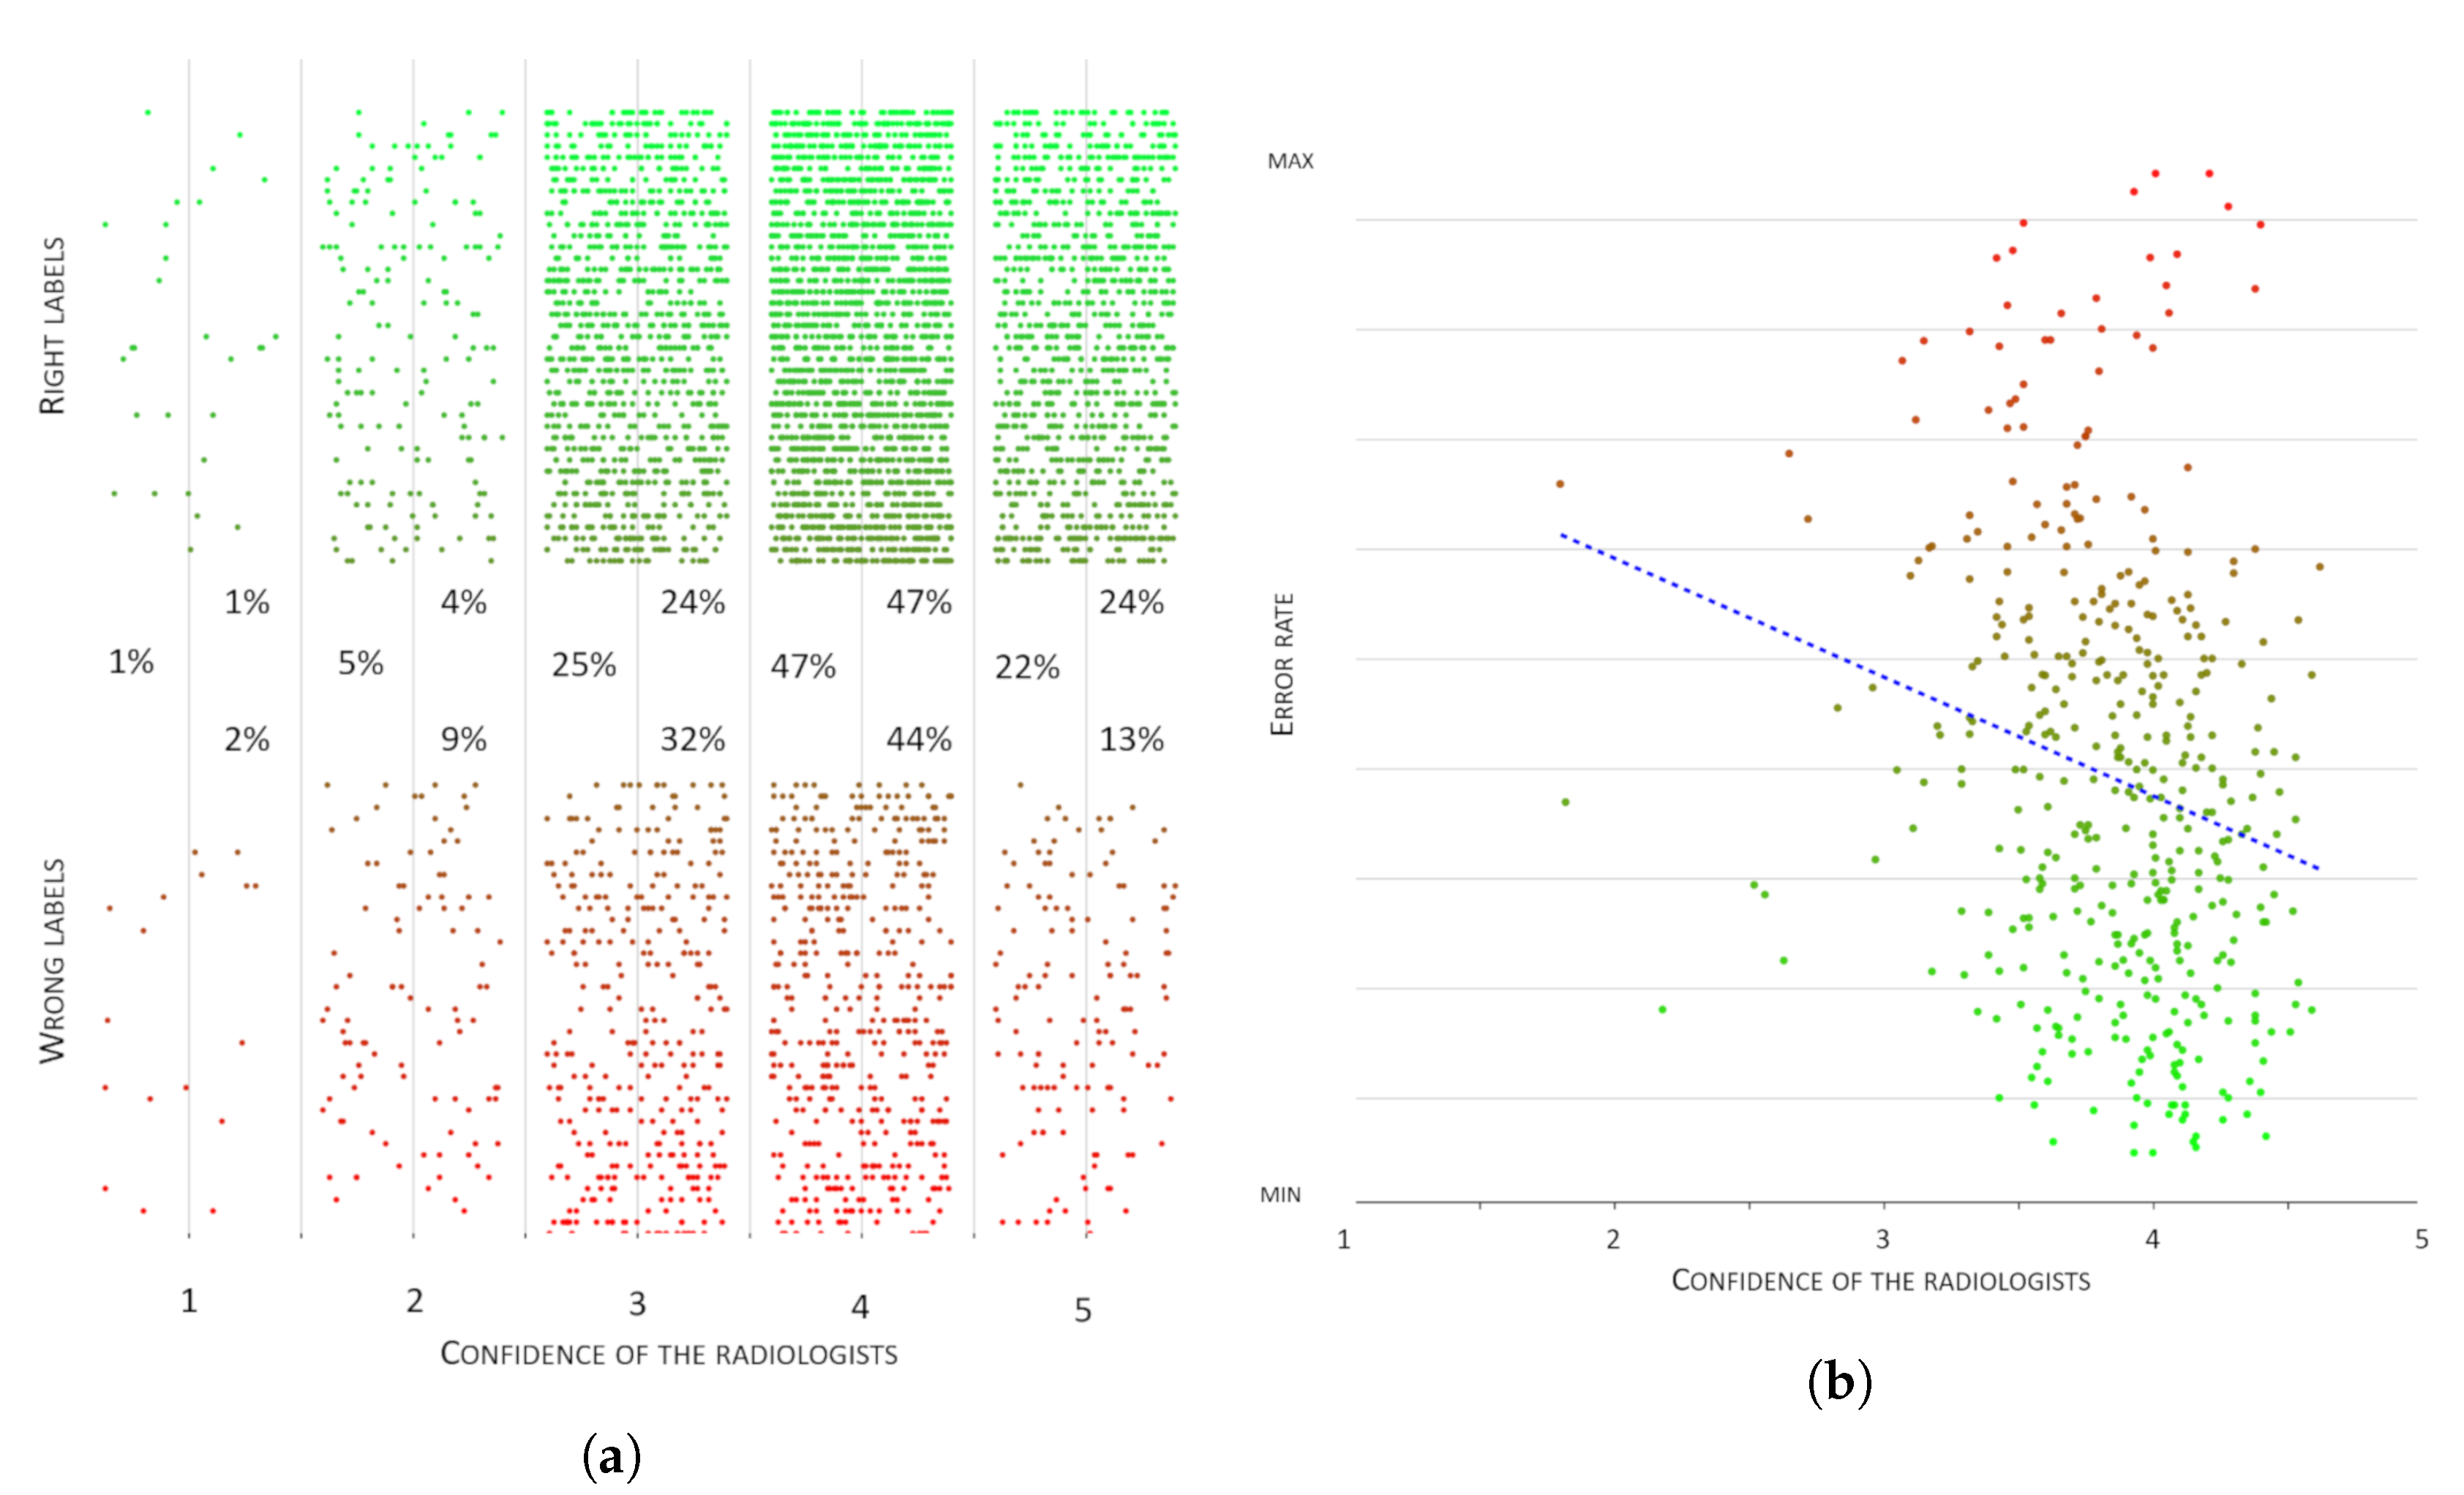
Figure 8a,b depicts the relationship between the confidence expressed by the raters and, respectively, their accuracy and the difficulty of the cases they were supposed to rate.
As regards the confidence expressed by the involved medical experts, we note that the radiologists involved ranged from specialists with a few years of practice to senior practitioners with more than 20 years of experience and image reading; all of them were nevertheless involved in one of the most important orthopedic institutes in Italy. Therefore, it is little wonder that their confidence in the ratings was generally high, with four out of five the level most frequently mentioned (see
Figure 7b). However, as a first observation, we noticed that being confident in a rating did not mean this was necessarily correct:
Figure 8a shows this discrepancy, where 57% of wrong labels were nevertheless associated with the highest levels of confidence. This first reflection highlighted that confidence (intended as a subjective measure of the soundness of the proposed annotation) and accuracy were orthogonal dimensions that both impacted on the reliability of a multi-rater annotation.
As regards agreement, we observed that for 322 cases (75%), the radiologists expressed a statistically significant (or overwhelming) majority (which occurred whenever at least 10 of them agreed on a rating, out of 13). However, in regard to 61 cases (14%), the majority of the raters chose the wrong label (with respect to the MRNet ground truth). In those cases, majority voting would lead to an error in the derived ground truth. Even more surprisingly, in 41% of these latter cases (25, or 6% of the total), the wrong majority was overwhelming from the statistical point of view mentioned above. These observations showed that also agreement and accuracy were orthogonal dimensions providing different information about the reliability of the multi-rater ground truth.
The degree of concordance (
) observed between the 13 radiologists was
. Besides this degree, we computed two different weighted reliability scores, according to the method to assess the competence of the raters: when we considered the accuracy (with respect to the MRNet ground truth) of each rater, the resulting
was
; when we employed the Rasch model estimate (see Equation (
5)), the resulting
was
. The values of Krippendorff’s
and Fleiss’
k were both equal to
, with a percent of agreement
of
.
5. Discussion
The user study reported in the previous sections confirmed the simulations presented in
Section 1: teams of domain experts could mislabel cases, even when they were large enough to reach statistically significant consensus, and this was achieved by an overwhelming majority of raters, as it happened in approximately one case out of 20 in our study. This suggested that any metric, used for assessing the reliability of a given multi-rater ground truth, that did not take into account the accuracy of the involved raters was likely to provide an over-estimated and over-optimistic assessment.
On the other hand, as regards confidence, we could make two observations. First, as can be seen from
Figure 8b, the raters’ confidence had only a very weak correlation with the raters’ error: indeed, as can be seen from
Figure 8a, the two highest confidence levels accounted for over 50% of all the annotation errors. This suggested that confidence and accuracy indeed represented two orthogonal concepts. Second, we could observe that the values of
,
k, and
were relatively close (
,
): the small difference between the
and kappa measures could be explained by the fact that the class proportions in the dataset were almost perfectly evenly balanced, as both metrics considered class balance in order to model chance effects; in contrast, the small difference between the degree of concordance
and the above-mentioned measures could be seen as a confirmation that leveraging the self-reported confidence in the definition of
(through
) was not only meaningful, as the confidence levels were (intuitively) inversely correlated with random guesses by the raters, but it also provided a practical and flexible model of chance effects that did not necessarily depend on the whole dataset distribution (as is the case for other common reliability measures), but yielded equivalent results. Interestingly, making a naive estimate on the value of
, based on the average confidence, we obtained (by multiplication with
) an expected
equal to 0.61, which was almost equivalent to the observed one. This suggested that the proposed
could also be interpreted (provided that the distribution of confidence had small variance around its average) as a chance-corrected modification of the agreement
, in which the chance-correction was given by the average confidence among the raters.
On the other hand, we detected a large difference between the weighted reliability score and the reliability measures based only on an estimate of the chance-adjusted agreement (i.e., and ). This difference, as previously mentioned, could be explained by the fact that our score also took the competence of the raters into account and thus provided a more robust and comprehensive account of ground truth reliability. As we argued previously, this behavior is desirable as it allows assigning more weight to agreements that are likely to be true compared to agreements on possibly wrong labels. Importantly, the estimate we produced on the basis of the Rasch model showed that could provide a sound and conservative estimation of the ground truth quality even when a separate ground truth was not available, which is the most common case when the multi-rater setting is adopted (otherwise, it would be pointless to collect the multi-rater annotations).
Another indication of the robustness and flexibility of the proposed measures derived from the analytical results discussed in
Section 3.2. These results shed light on the fact that the two above paradoxes were, as anticipated therein, intrinsic in any measure of reliability where the model of the chance effect was dependent on the distribution of the labels in the annotated dataset. On the other hand, the increased flexibility and more elaborate model of chance in the definition of the
allowed “circumventing” the above paradoxes and made the proposed metric a sound measure of reliability.
In regard to the application of
in real-world settings, in order to assess if a given ground truth is sufficiently reliable to support further analysis such as the training of predictive models, it would be natural to ask what threshold level should be used for such an assessment. This problem is called setting the so-called smallest acceptable reliability threshold [
20]. Unfortunately, any proposal of such a threshold would be laden with some extent of arbitrariness. Nevertheless, Krippendorff suggested to not accept data with reliability estimates whose confidence interval (computed via bootstrapping or a permutation procedure) reaches below the smallest acceptable reliability set at 0.667 [
20] (p. 242). Any reliability score below 0.667 would mean that only two thirds of the data are labeled to a degree better than chance. This recommendation, while still arbitrary to some degree, challenges a much more popular way to interpret agreement scores in vogue since the 1970s [
36], which is much more indulgent (a score of 0.21 is considered an indicator of fair agreement, 0.41 moderate, and 0.61 substantial), and it offers a more robust and conservative procedure by which to evaluate reliability.
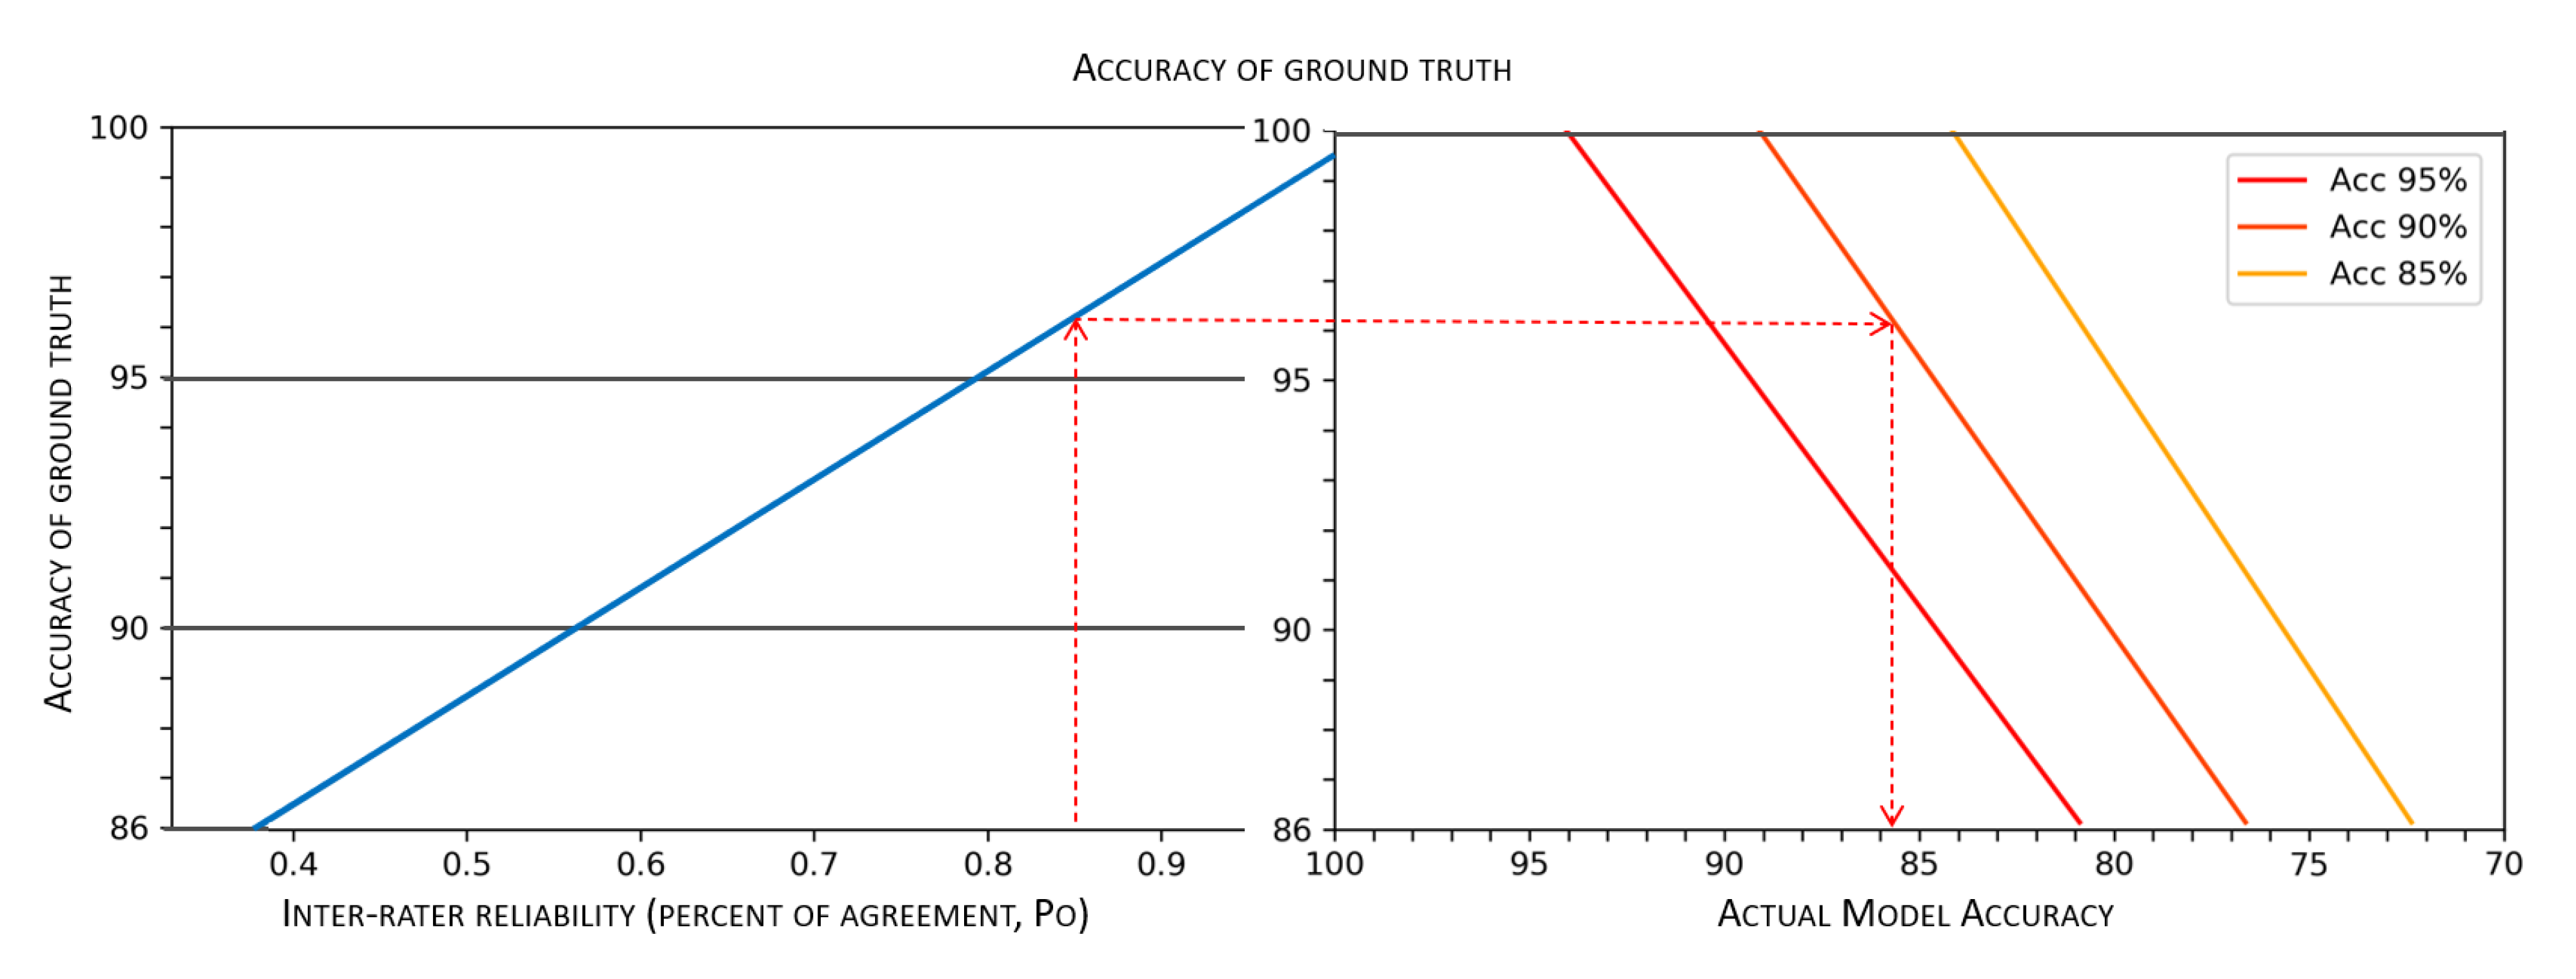
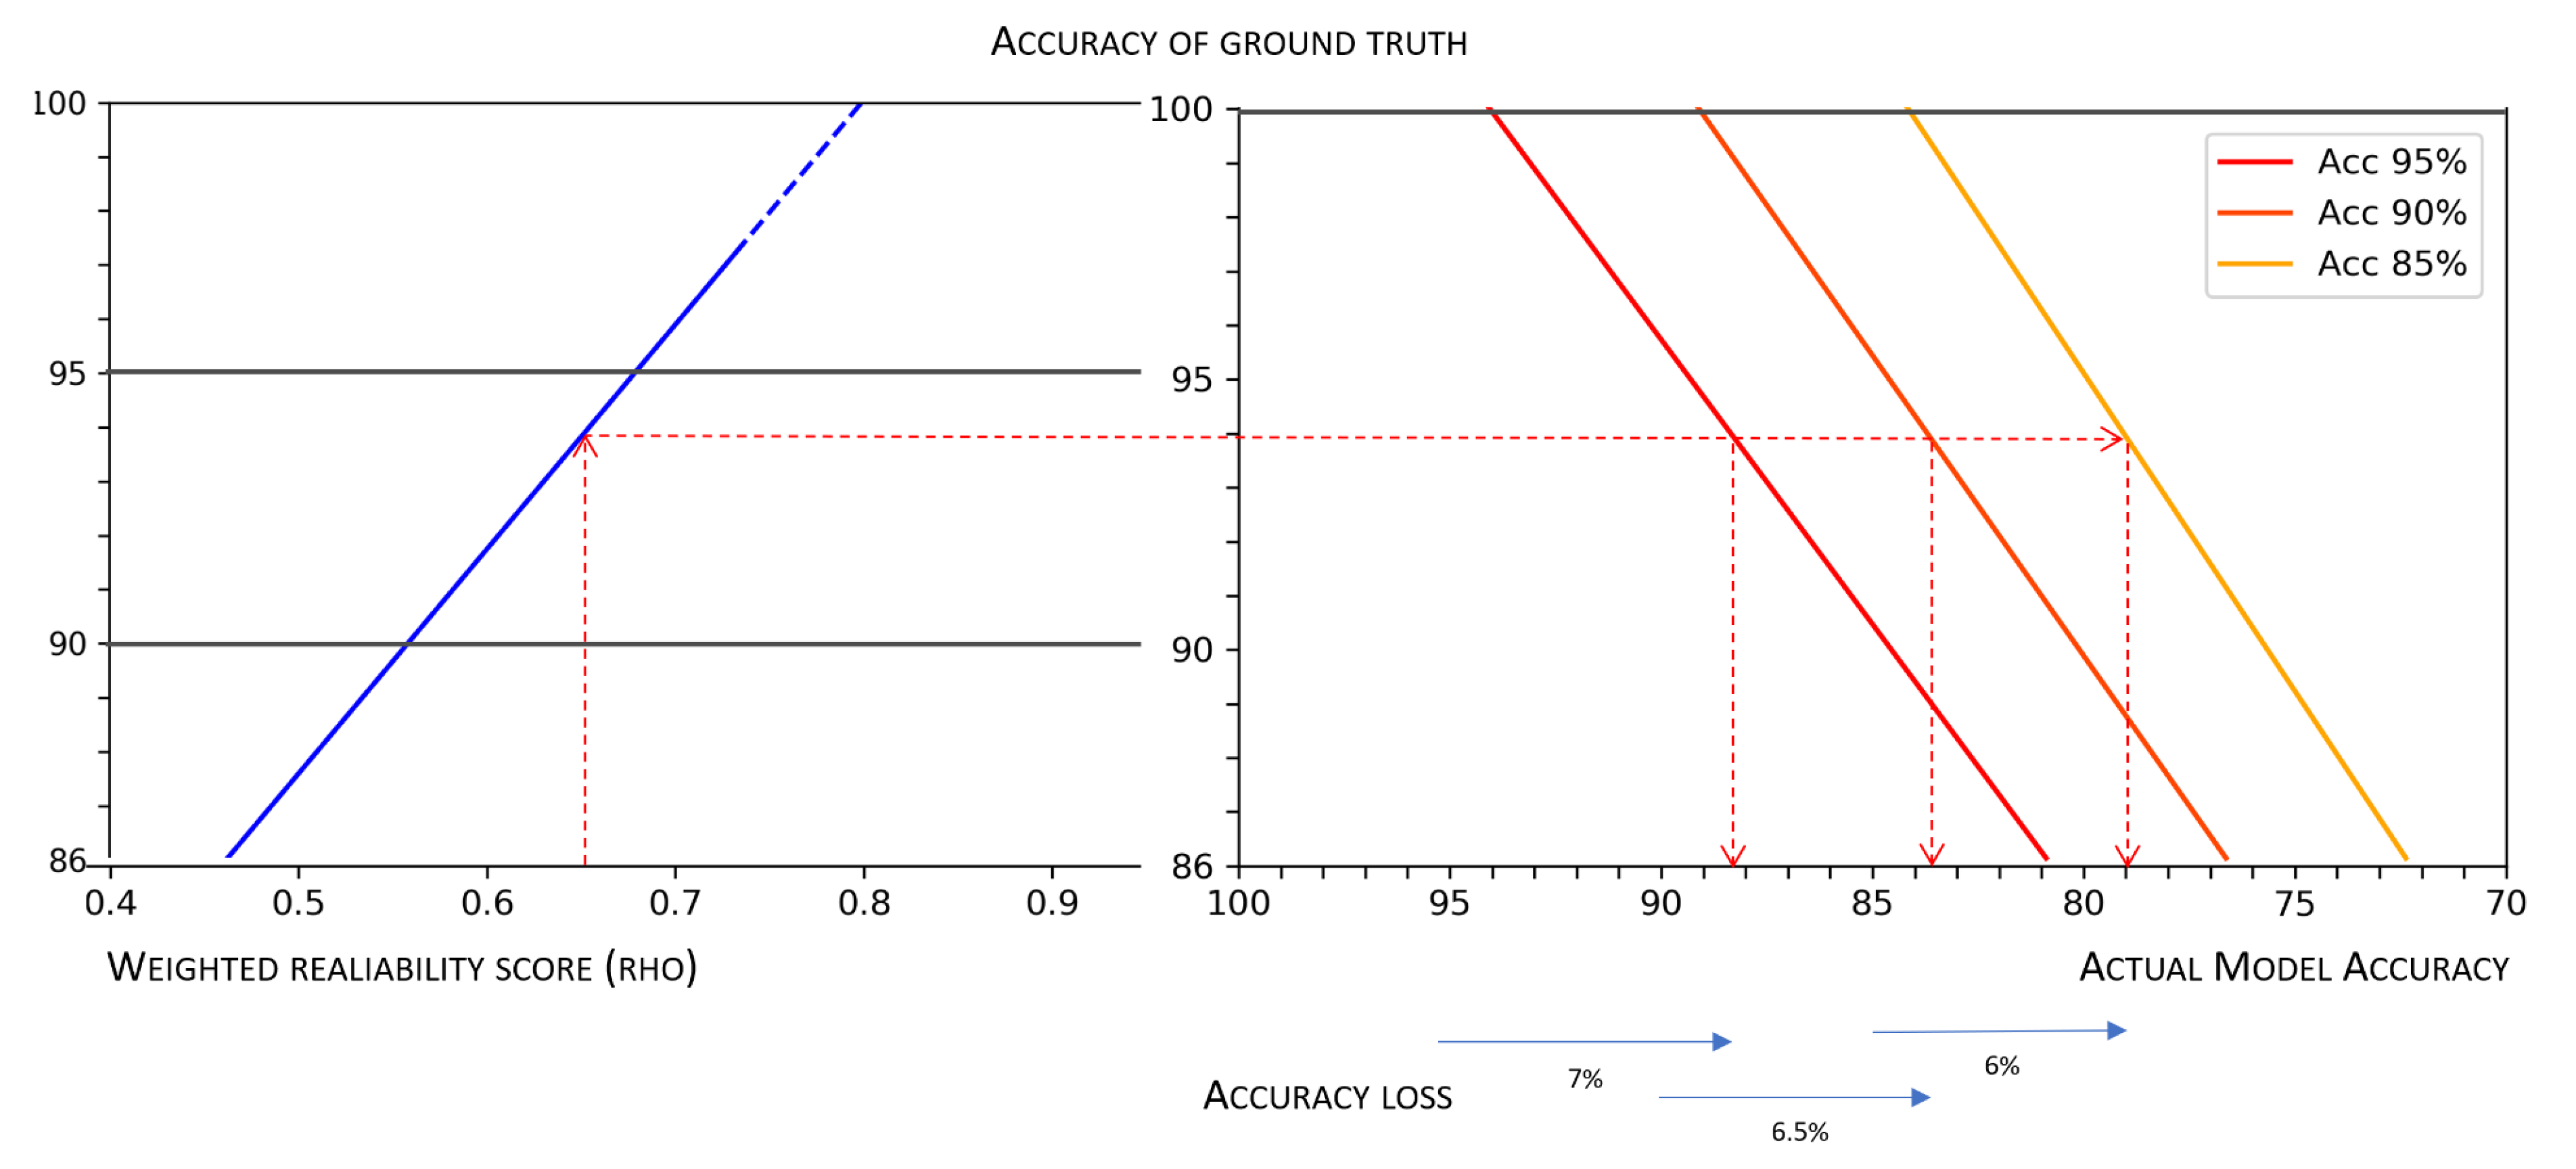
In
Figure 9, we can see a nomogram, similar to that depicted in
Figure 4, which is a two-dimensional diagram designed to show the mathematical association between measures of the weighted reliability of a multi-rater dataset, the accuracy of the related ground truth (obtained by majority voting), and the corresponding actual predictive accuracy of models, which in
Figure 9 are associated with a “theoretical” accuracy of 95%, 90%, and 85%, respectively. This nomogram can be used for any value observed along these three dimensions (namely, data reliability, ground truth accuracy, and model accuracy), but as an example, we show the losses in accuracy associated with the minimum reliability threshold mentioned above (i.e.,
) for those models for which developers boast an accuracy of 95%, 90%, and 85%: the deviation for all these cases is approximately 6%, which is a margin that is much greater than what is usually tolerated to choose the best model after a cross-validation session.
The nomogram depicted in
Figure 9 also allows a further, important, consideration. Estimates of
allow establishing a threshold for adequate reliability, which is based on a minimum acceptable accuracy value: having fixed a minimum acceptable value of actual accuracy
(for a model whose measured level of accuracy is
x), we should require
to be high enough to result in a ground truth quality
g such that
. As an example, let us assume that we need a predictive model exhibiting actual accuracy
, and further assume that, by training the model on a perfect ground truth, we would be able to obtain a model whose measured accuracy is equal to
. By observing the nomogram depicted in
Figure 9, we can easily see that to achieve our requirement, we would need a ground truth at least
accurate. Thus, we set the minimum acceptable reliability at
.
6. Conclusions
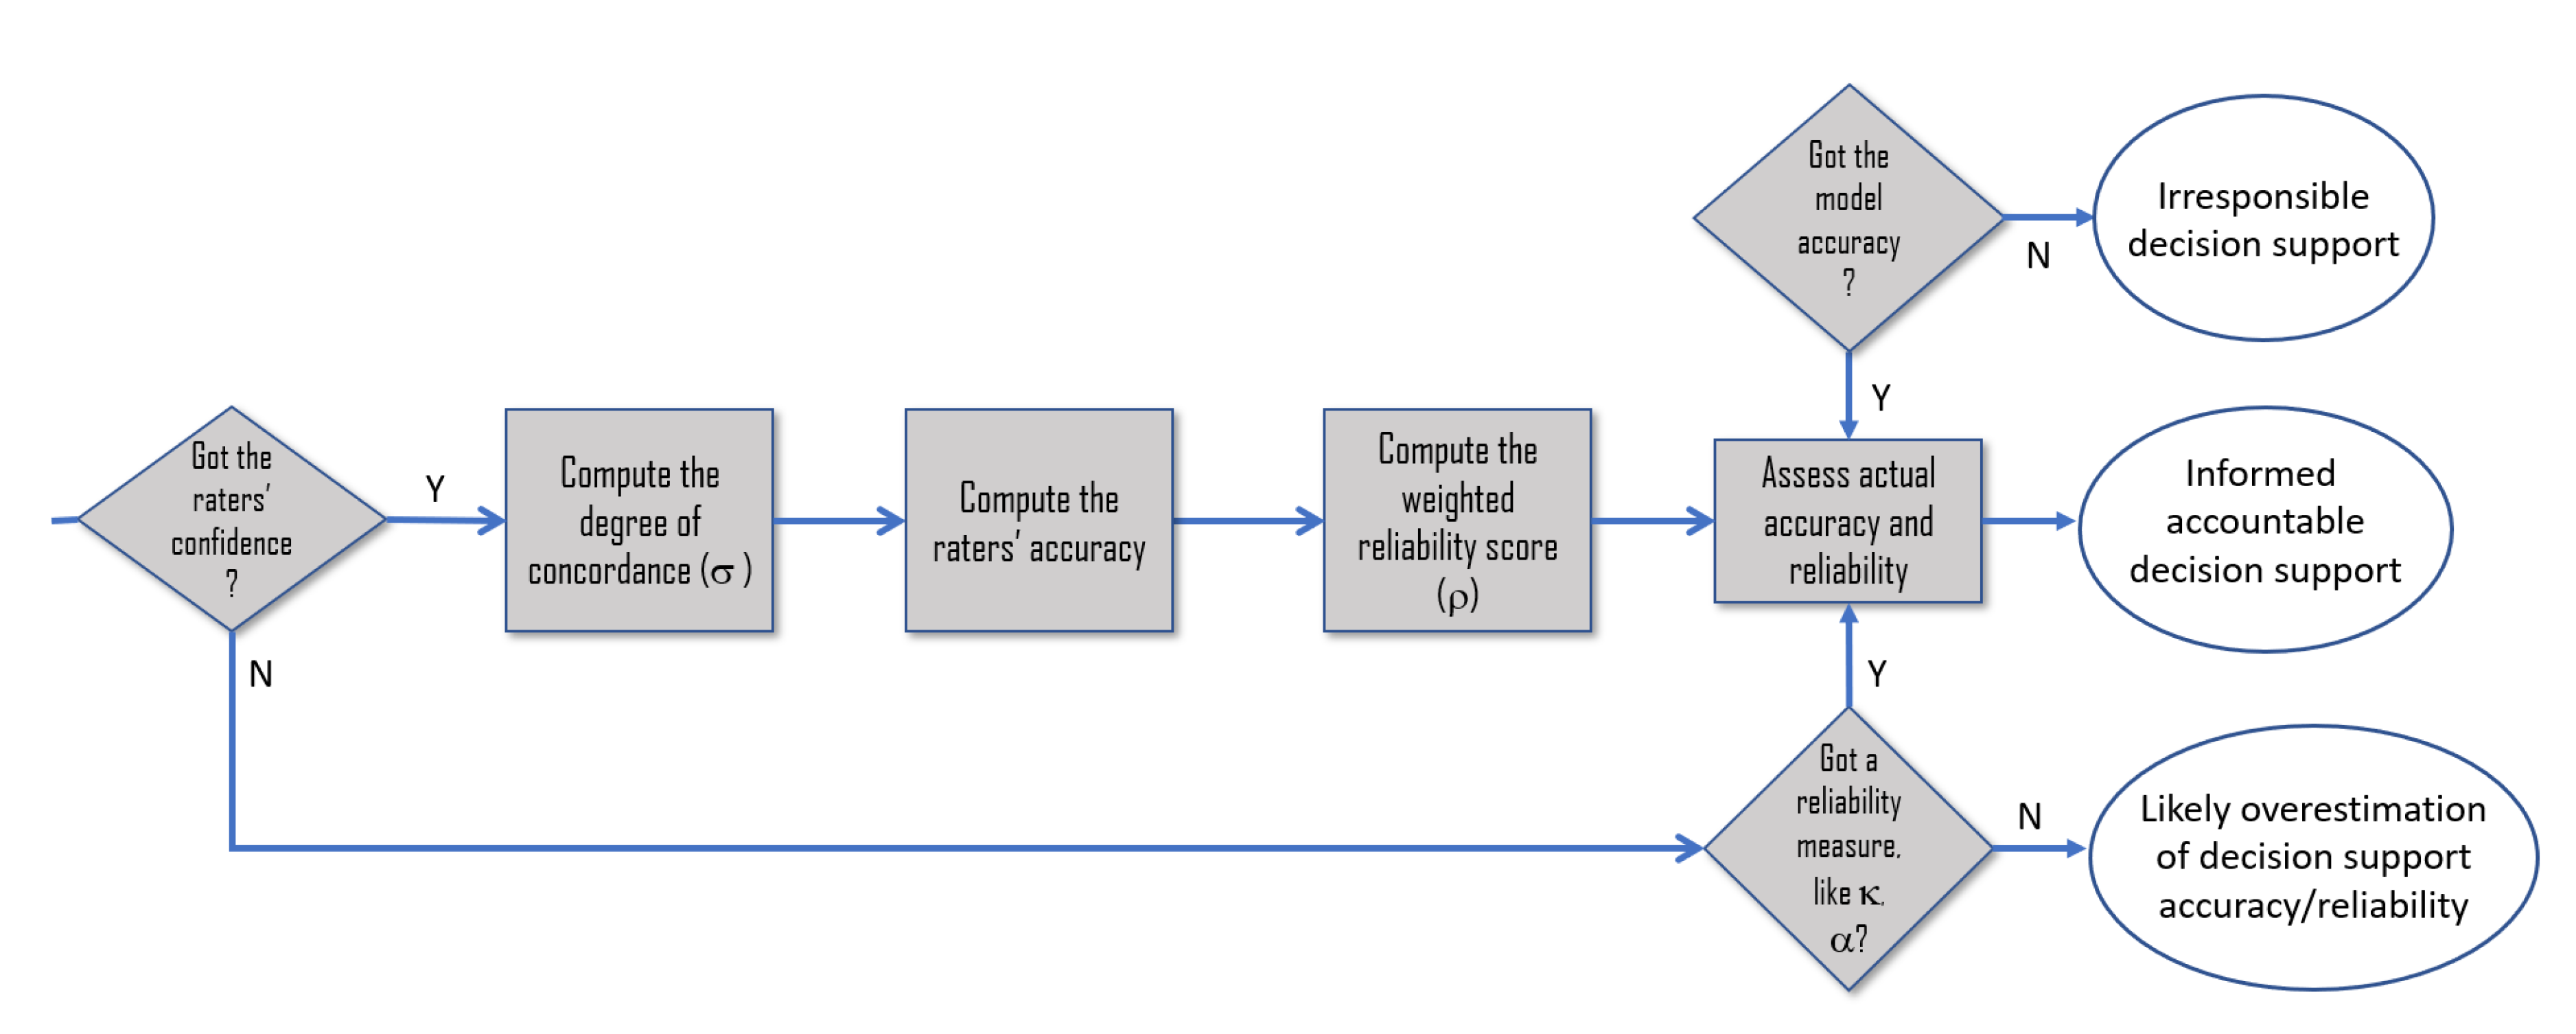
In this article, we introduced a new model to quantify the reliability of ground truth data in multi-rater settings. This model provided a more comprehensive and multi-dimensional definition of reliability, which took into account not only agreement, but also the confidence and competence of the involved raters: in very short terms, in our proposal, we related the reliability of the data to the reliability of those who produced the data. This model allowed us to define a novel reliability metric, which we called the weighted reliability score ; therefore, is this yet another reliability metric?
To motivate this research endeavor, we made some consequent points: in order to have good data, it was necessary to involve more raters, not just one or few (see
Figure 1). The quality of data affected the quality of the predictions of predictive models (see
Figure 4) and of the decision making process itself, that is their reliability. Since this was what we really cared about in computer-based decision support, it was necessary to assess the reliability of the models’ ground truth in a sound manner (see
Figure 5): to this aim, we needed a metric that took into account the reliability of the raters involved and their ratings’ (see
Figure 6), as the weighted reliability
score did, and no other metric did, to our knowledge. Lastly, neglecting the assessment of data reliability in multi-rater settings meant to equate theoretical accuracy and actual accuracy and hence to be content with a harmful overestimation of the models’ capability to truly support decision makers (see
Figure 9).
In this paper, we also provided a formal proof that our metric was a sound measure and was not subject to common paradoxes that affect other common reliability measures. We also showed the robustness and conservative nature of the proposed measure in the context of a realistic annotation task and illustrated how could be used to evaluate the reliability of a real-world ground truth in light of the required performance of a predictive model to be trained on it.
As we believe that reliability is a primary concern in any data analysis task, in what follows, we enumerate some still open issues that we believe should be further addressed and that motivate our future research agenda:
We intend to extend the proposed model of reliability so that it can be applied also in the case of annotation tasks in which the target annotations are either numeric or ordinal values, as well as in the case of missing annotations and incomplete ratings, that is when, for a given case, one or more raters do not provide an annotation;
We intend to further investigate the relationship between the ground truth reliability (as measured by the score) and the actual model accuracy to obtain more robust and precise estimates based on computational learning theory;
As shown in [
37], the accuracy of raters is also heavily affected by the complexity and difficulty of the cases considered (or similarly, by the proportion of really hard cases to interpret in the ground truth): difficulty can be another contextual (i.e., case-specific) factor in reducing the probability that a specific label is correct, both confidence and competence being equal. Thus, also this parameter should be collected from the team of raters involved, even if in a necessarily subjective and qualitative way, and be factored in the derivation of the weighted reliability score
from the the degree of concordance
.
We also intend to further enrich our metric, by considering not just the number of agreements and their reliability, taken individually, for each case, but also whether the number of agreements is in a scarce majority configuration (i.e., in one of those majorities where one rating could change the assigned label), with the assumption that these cases are intrinsically less “reliable” than the cases where disagreements do not affect the majority decision.
To conclude: In recent times and in an increasing number of application domains, classification models have been aimed at bringing (or could bring) a “significant effect” (cf. GDPR) to the life of human beings. Such domains are not limited to healthcare and medical applications, but encompass also other delicate domains like, e.g., employee selection, credit scoring, the assessment of the risk of recidivism, and more in general, any kind of profiling and automated decision making that can impact the health, reputation, or economic situation of the people involved. In all of these domains, reliability should be the most important aspect of those models to guarantee, as this is also the basis for the user trust in their role in decision making [
38]. In this respect, assessing such a quality dimension—along with other common dimensions like accuracy, precision, and the like—and performing this assessment by means of a sound and conservative metric are crucial to improve the quality of the overall decision making process. We believe that such an assessment is also worthy of the collection of additional information from the experts involved in ground truthing (like the confidence in their ratings), in light of the impact that data reliability may have on decision making and on the accuracy (that is reliability) of the predictive models that may automate or support such decision making.
We discussed this impact and showed how it could have detrimental effects on the quality of the decision making if ground truth reliability is not taken into account and factored in, at least qualitatively: for its pervasiveness, and yet the relatively low debate about it, this problem looks like the notorious “elephant in the room” (hence, the title of this contribution) of decision support reliability assessment. For this reason, we assert that any responsible decision maker should always evaluate the reliability of the ground truth, to check the extent that these latter data can be rightly considered “the truth” and, hence, ultimately, improve the quality of the decision making process. The weighted reliability score is a tool to support such a responsible and accountable use of any classification models in settings where the life of human beings is at stake.

 ,
, 
