Article

Electromagnetic Testing of Moisture Separation Reheater Tube based on Multivariate Singular Spectral Analysis

1
Faculty of Electrical and Electronic Engineering, Phenikaa University, Hanoi 12116, Vietnam
2
Phenikaa Research and Technology Institute (PRATI), A&A Green Phoenix Group JSC, No.167 Hoang Ngan, Trung Hoa, Cau Giay, Hanoi 11313, Vietnam
3
Faculty of Marine Engineering, Vietnam Maritime University, Haiphong 180000, Vietnam
4
IT-based Real-Time NDT Center, Chosun University, Gwangju 61452, Korea
*
Authors to whom correspondence should be addressed.
Appl. Sci. 2020, 10(11), 3954; https://doi.org/10.3390/app10113954
Submission received: 22 May 2020 / Revised: 30 May 2020 / Accepted: 4 June 2020 / Published: 6 June 2020
(This article belongs to the Special Issue Nondestructive Testing (NDT): Volume II)

Abstract

:
Moisture separator reheater (MSR) tubing systems are an important part of a pressurized-water power plant to increase the efficiency of the heat transfer rate. The MSR tubes are finned tubes which are made of ferritic stainless steel (SS439) with a high strength and corrosion resistance characteristics. However, corrosion can appear along with the fins after a long period of operation of the MSR tubes that requires nondestructive testing (NDT) of the MSR tubes’ periodically. Electromagnetic testing (ET) is an efficient NDT method for the inspection of far-side corrosion in the MSR tubes. However, the ET sensor signal is affected by signal noise from the fins. Material degradation that make it challenging to inspect and evaluate the corrosion. In this study, we proposed three ET methods, including magnetic flux leakage testing, eddy current testing and partial saturation eddy current testing, and incorporated with a multivariate singular spectral analysis (MSSA) filter to improve the detectability of the corrosion in the MSR tubes. The proposed MSSA filter was compared with the multivariate wavelet transform filter and Gabor transform filter, and the results showed more efficient and stable results of the MSSA filter in the extraction of the corrosion signal.

1. Introduction

Moisture separator reheater (MSR) tubes are used to connect the high-pressure and low-pressure steam turbines in a pressurized-water power plant to increase the efficiency of the heat transfer rate [1]. The MSR tubes have fins on the outer surface to increase the contact surface area with the steam by about three times, thus improving the efficiency. As the steam flows through the MSR tube, the moisture contained in the steam is removed, and the steam is reheated; therefore, the MSR is not only improving the thermodynamic efficiency, but also helping to prevent the erosion and corrosion of the turbines’ blades [1]. However, the fins are sensitive areas where corrosion could appear after a long period of operation. Thus, nondestructive testing (NDT) is usually applied for early inspection of the corrosion in the MSR tubes to prevent the failure of the MSR tubes and the stop the operation of the nuclear power plant [1,2].
Ultrasonic testing (UT) has been developed for the inspection of the corrosion in the MSR tubes [3,4]. The UT system used a guided wave for efficient detection of the corrosion. However, it requires coupling material between the UT probe and the surface of the MSR tubes. Moreover, it is difficult to maintain the coupling material during the inspection, and it could bring side effects because of the possibility of coupling material remaining in the MSR tubing system. Electromagnetic testing (ET) is a preferred method for inspection of the corrosion in the MSR tubes because of non-contact inspection. Various ET methods, including magnetic flux leakage testing (MFLT) and eddy current testing (ECT), have been researched and developed [5,6,7]. The MSR tubes are usually made of ferritic stainless steel (SS439), which is an alternative material for 90–10 CuNi material because of higher strength and high capability of corrosion resistance [8]. MFLT is a simple method that supplies DC magnetic field (e.g., produced from a magnet) to the MSR tubes, and the magnetic sensors will measure the magnetic leakage at the corrosion; thus, the corrosion could be inspected [5]. However, the fins in the outer surface of the MSR tubes also produce magnetic leakages into the magnetic sensor that makes noise to the corrosion signal. ECT operates by supplying an AC magnetic field into the inner tube surface, and an eddy current will be induced in the tube thickness [6,7]. The eddy current is followed by the skin effect that confined in the near-surface that could minimize the MSR fins’ effects. However, the high permeability of the MSR tube limits the penetration of the eddy current; thus, the detection of the outer surface corrosion is limited. Full saturation eddy current testing (FSECT) is an improvement of the ECT for inspection of high permeability material [9,10]. FSECT has an additional strong DC magnetic source (e.g., a magnet) to fully saturate the MSR tube’s material that makes the relative permeability of the tube become 1. Then, the eddy current could deeper penetrate the tube thickness that improves the detectability of the outer surface corrosion. However, the strong DC magnetic field could saturate the magnetic sensor, and it is also challenging to produce in a real-life application. Thus, partial saturation eddy current testing (PSECT) was an alternative solution [11,12,13]. The PSECT has the same configuration with the FSECT, but the DC magnetic field has a lower intensity that only partially saturates the MSR tube’s material. Unfortunately, all the developments could improve the detectability of the outer surface corrosion, but still get affected by the noise produced from the fins because the fins could be considered as multiple corrosion [11,12,13].
Therefore, this study proposed the incorporation of a multivariate singular spectral analysis (MSSA) with the ET systems for improvement of signal in the inspection of the outer surface corrosion in the MSR tube. The MSSA will be used to analyze the multivariate sensor signals of the abovementioned ET methods, including MFLT, ECT and PSECT. There is some amount of 15 Hall InSb sensor elements in the three ET methods that were used in the inspection of far-side corrosion on an MSR finned tube. The MSR finned tube has an inner diameter of 14.1 mm, a thickness of 1.2 mm, a fin height of 1.3 mm and a fin-step of 1.1 fins/mm. Several artificial corrosions were fabricated on the outer surface of the tube as flat-bottom holes with depths from 10% to 100% wall thickness and diameters of 1.3 mm and 2.5 mm. The multivariate input signals of the Hall sensors were analyzed by the MSSA for efficient denoise, detrend and extraction of corrosion signal. The results were then compared with the multivariate wavelet transform (WT) and Gabor transform filters.

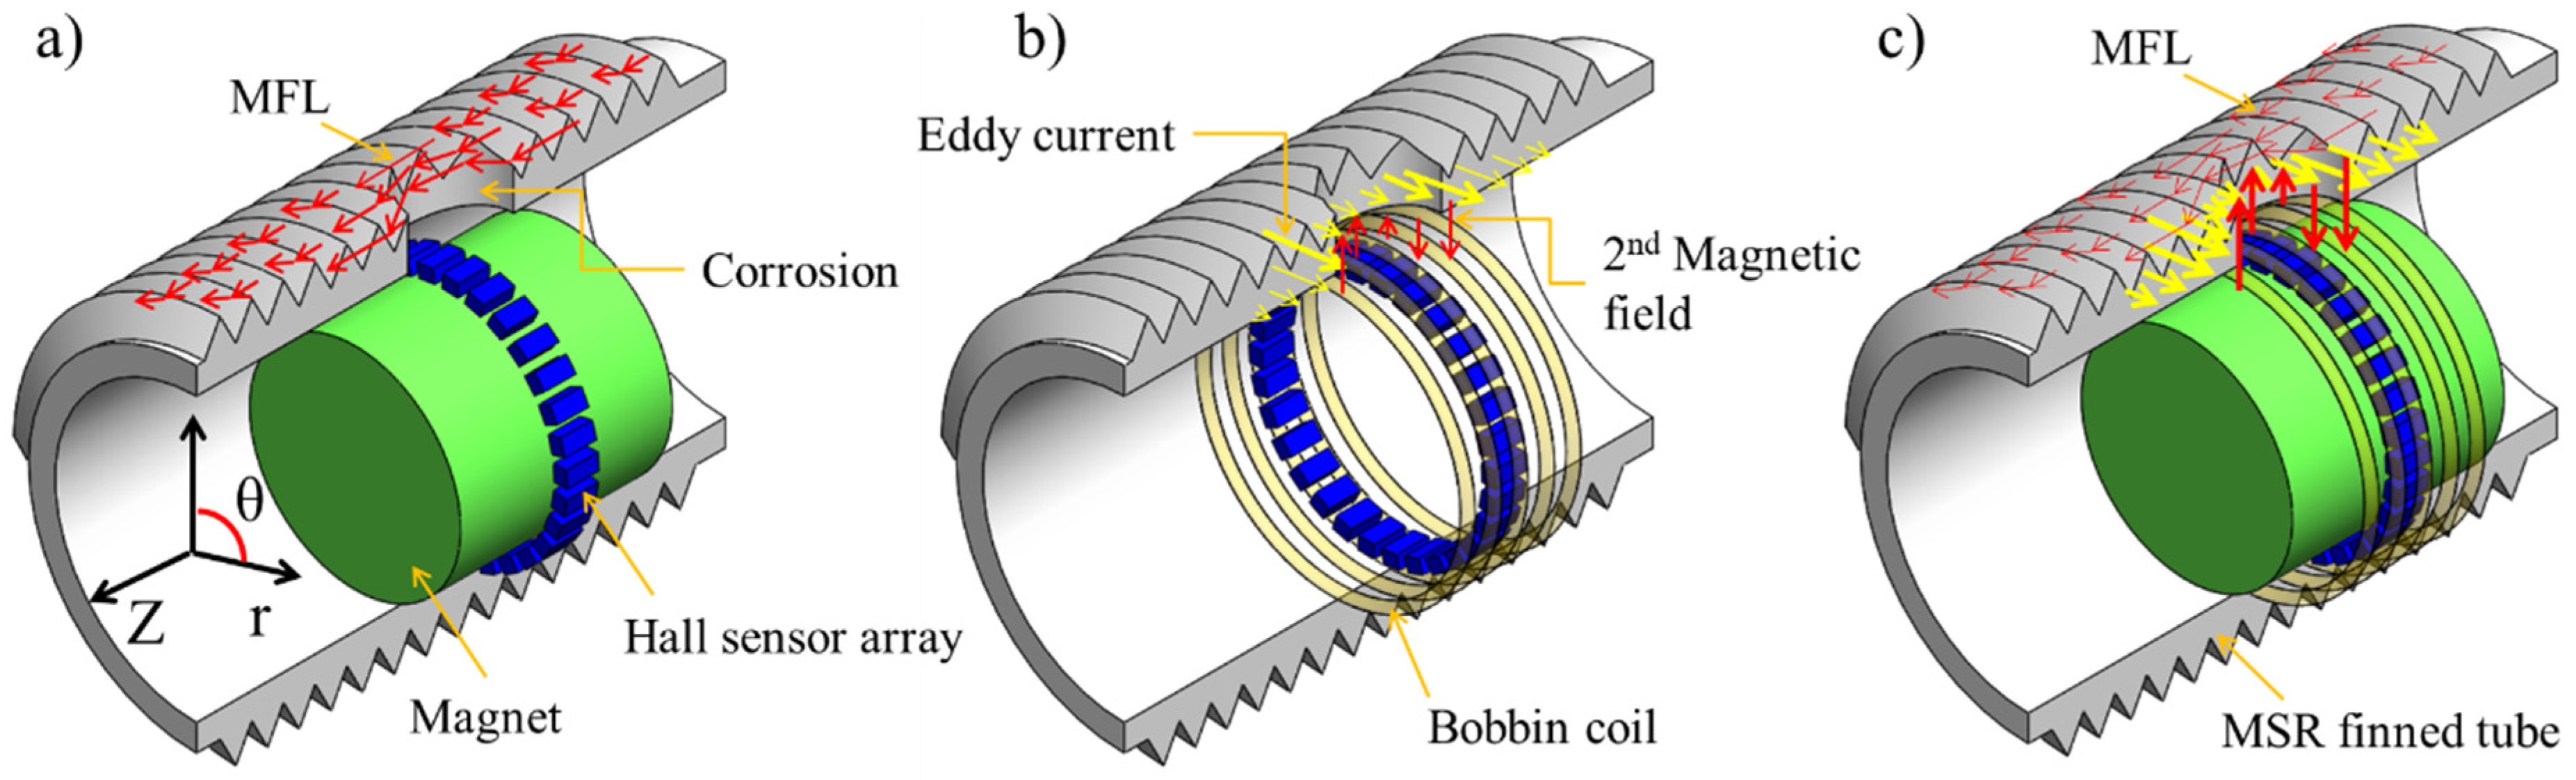
2. Principles of the Sensor Probes

This section summarizes our previous works on the development of the three ET methods, including MFLT, ECT and PSECT, for inspection of corrosion in the MSR tubes. The sensor probes were constructed by multiple Hall sensor elements (15 InSb Hall sensors) for efficient detection of the corrosion [11,12,13]. The use of multiple Hall sensors has two main benefits over the sensing coils using in the conventional methods (i.e., ECT and PSECT method): (1) Hall sensor directly measures the magnetic field distributed around corrosion rather than the indirect measurement via total magnetic flux rate using the sensing coils; thus, the sensitivity could be improved and not strongly depend on the exciting frequency; (2) spatial resolution of the sensor array could be improved by decrease the size of magnetic sensors while the sensing size has a limited size (e.g., diameter over 1.0 mm). The sketch of the three sensor probes is shown in Figure 1. The MFLT probe includes a permanent magnet to produces a DC magnetic field into the tube and a Hall sensor array measures the magnetic flux leakage (MFL) around the corrosion for the detection of the corrosion.
The bobbin coil in the ECT probe is supplied an AC to produce an eddy current in the tube according to the Faraday’s law. According to Lenz’s law, the eddy current flow is distorted by the presence of corrosion and produces the secondary magnetic field. The Hall sensor array could measure the secondary magnetic field, and the corrosion could be detected. On the other hand, the eddy current penetrates into the thickness of the tube according to the skin effect, in which the intensity of eddy current at a depth d exponentially decreases with the depth, permeability (μ) and conductivity (σ) of the tube and exciting frequency (f), as described in Equation (1). The skin depth (δ) is expressed as Equation (2), which is used to estimate the exciting frequency. For instance, the estimated exciting frequency should be used for ferritic stainless steel (SS439) MSR tube with a thickness of 1.2 mm ranges from 300 Hz to 2000 Hz [9,12,14].
J t = J 0 e d π f μ σ
δ = 1 π f μ σ
Because of the high permeability of the SS439 material, the skin depth will be low; thus, the eddy current is concentrated near to the inner surface of the MSR tube that limits the detection of the corrosion on the outer surface. Therefore, a magnet is additionally used in the PSECT method to saturate the MSR tube partially (i.e., decrease the permeability). Then, the skin depth could deeper penetrate up to the outer surface and allows better detection of the corrosion. It is noted that the MSR tube has fins that are used to increase the contact surface, and the fins are considered as multiple corrosion on the outer surface that produces noise to the real corrosion signal. On the other hand, the interaction between the magnet and the fins could produce Lorentz’s force on the MFLT/PSECT probes that changes according to the profile of the fins and produces vibration of the MFLT/PSECT probes during the scan. Moreover, the degradation of MSR tube material after the long period operation could result in the changes in the homogeneous magnetic permeability of the tube. Thus, it could produce another noise to the corrosion signal.
The total magnetic field at a Hall sensor (B(t)) is the superposition of the magnetic field from the magnet (BM), probe variation (BV), material degradation (BD), exciting bobbin coil (BB), eddy current at corrosion (BC) and eddy current at fins (BF), as expressed in Equation (3); where, BB0, BC0i and BF0j are amplitudes and zero, Δ α i and Δ β j are phase-shifts of the time-varying magnetic fields. The output voltages of a Hall sensor (VH(t)) is proportional to the z-component of the total magnetic field which is perpendicular to the sensor surface, as expressed in Equation (4); where, k is the Hall constant and IH is the current supply to the Hall sensor. In the signal processing system circuits, we use a root-mean-square (RMS) circuit for each Hall sensor to convert the time-varying signal to a DC signal before the analog-to-digital converter (ADC). Thus, the final obtained signal is the RMS of the Hall voltage output, as expressed in Equation (5).
B ( t ) = B M + B V + B D + B B 0 sin ( 2 π f t ) + B C 0 i S i n ( 2 π f t + Δ α i ) + B F 0 j S i n ( 2 π f t + Δ β j )
V H ( t ) = k × I H × B r ( t )
V R M S = 1 T 0 T [ V H ( t ) ] 2 d t

3. Signal Processing Methods

3.1. Gabor Filter

In our previous works [13], we have developed an efficient filter for filtering the noise signals based on Gabor transform (Gabor filter). The Gabor transform uses a Gaussian sliding window ( e π ( z τ ) 2 ) as a weight for the Fourier transform, as expressed in Equation (6); where ω and τ are the angular frequency and scan distance, respectively. The noise signal and corrosion signal were separated by selecting frequencies for each signal in the coefficients of the Gabor transform. Then, the coefficients of respect to the noise signal were set to zero values, as expressed in Equation (7). The remained coefficients of respect to the corrosion signal were then reconstructed, and the corrosion signal is obtained, as expressed in Equation (8). For applying the Gabor filter, predefined low and high cutoff frequencies (ωL and ωH) to separate the noise and corrosion signal are required. However, the cutoff frequencies are generally unknown in prior.
G T ( τ , ω ) = + V R M S ( x ) e π ( z τ ) 2 e j ω z d z
G T ( τ , ω L < ω < ω L   &   ω < ω H   &   ω > ω H ) : = 0
V R M S ( z ) = + + G ( τ , ω ) e j ω z d τ d ω

3.2. Wavelet Filter

Wavelet transform has been used in many applications as an efficient filter method [15,16]. In wavelet transform, a mother wavelet (ψ(x)) with scale (a > 0) and shift (b) parameters were used instead of the Gaussian window in the Gabor transform, as expressed in Equation (9); where the * denotes the complex conjugate. By changing the scale a, the multi-resolution of the signal could be obtained. The noise signal could be efficiently removed by thresholding the scale coefficients, W.
W ( a , b ; V R M S ( z ) , ψ ( z ) ) = + V R M S ( z ) 1 a ψ * ( z b a ) d z
In the multivariate signal filtering, the threshold values could be automatically determined by incorporating with principal component analysis (PCA). The basic idea is to decompose each univariate input signal into detail and approximate components at different resolution (level); then, perform PCA on the concatenated detail and approximate components of the same level to remove noise. The denoised signal is obtained by inverting the wavelet transform using the processed detail and approximate components. The wavelet filter for multivariate signals based on PCA scheme is as follows [15,16]:
  • Input setting: mother wavelet, WT max level L, remained a number of principal components for each level Pi (1 ≤ iL) and reconstructed signal (step 5);
  • Step 1: Perform WT at L levels for each input signal (VRMS(z)) to obtain detail components Di (1 ≤ iL) and approximation component AL at the max level L;
  • Step 2: Concatenate each detail component Di in the same level of all the input signal to build a 2D detail matrix D. Then, perform PCA on the detail matrix D to remove the noise signal by retaining only a few numbers of principal components Pi;
  • Step 3: Similar to step 2, concatenate the approximation component AL of all the input signals to build the 2D approximation matrix A. Then, perform PCA on the matrix A to remove the noise signal;
  • Step 4: Reconstruct the signal V ^ R M S from the processed approximation and detail components by inverting the wavelet transform;
  • Step 5: Perform PCA again on the reconstructed signal V ^ R M S to remove the noise if remained.
The key in the wavelet filter is choosing a suitable number of remained principal components for each scaled signal according to the retained variance of the signal. For instance, the principal components are kept if the eigenvalues were exceeding the mean of all the eigenvalues (Kaiser’s rule) or exceeding 0.05 times of the sum of all the eigenvalues (heuristic rule) as using in the MATLAB Wavelet Toolbox 5.2. However, the principal components could be dominated by a strong signal that leads to discarding low-intensity signals, which may be the corrosion signal.

3.3. Proposed Multivariate Singular Spectral Analysis (MSSA) Filter

The scan signals of the Hall sensor array are considered as multivariate signals. Let V(p, L) having a size of P × L denotes for the 2D scanned magnetic matrix of the Hall sensor array; where P is the number of Hall sensors, L is the scan length indexes. The MSSA process has four steps, as shown in the block diagram of Figure 2.
Step 1—Embedding: Each signal of a Hall sensor Vd is constructed into a trajectory matrix Ep (embedding matrix) by sliding and stacking, as expressed in Equation (10); where the sliding window has a length of N and the stacking has a length of M that satisfied a condition: M = L − M + 1 [17]. The length of sliding window N should be chosen, such that it contains as much information of multiple corrosion as possible, but sufficient resolution (number of eigenvalues) for separation of noise and corrosion signal. The embedding matrixes of all the Hall sensor signals are stacked to build a full embedding matrix E, as expressed in Equation (11).
E p = [ V p ( 1 ) V p ( 2 ) V p ( N ) V p ( 2 ) V p ( 3 ) V p ( N + 1 ) V p ( M ) V p ( M + 1 ) V p ( L ) ]
E = [ E 1 , E 2 , E P ]
Step 2—Decomposition: The embedding matrix E could be decomposed into subspace matrixes by the singular vector decomposition (SVD) method. The idea is to project the embedding matrix E into the orthogonal eigenvectors. The eigenvectors could be found by the SVD method on the covariance matrix C of the embedding matrix E. The covariance matrix C is computed as Equation (12) and the SVD decomposition is expressed in Equation (13); where columns in U and V are called left and right eigenvector; the diagonal of matrix S is the eigenvalues (λi, 1 ≤ iM), which are sorted in descending order. The higher eigenvalue represents a higher intensity of the Hall sensor array signal. The embedding matrix E is then decomposed into subspace matrixes, as expressed in Equation (14).
C = 1 P N E E T
C = U S V T
E = E 1 + E 2 + + E M = λ 1 U 1 V 1 T + λ 2 U 2 V 2 T + + λ M U M V M T
Step 3—Reconstruction: The subspace matrix E i (1 ≤ iM) in Equation (14) could be used to reconstruct the input signal by diagonal averaging the elements. Assume M* = min (M, N), N* = max (M, N) and H p i (1 ≤ pP) is a submatrix of E i corresponding to the signal Vp (i.e., E i = [ H 1 i , H 2 i , H p i ] = λ i U i V i T ). Then, the reconstructed signal ( V ^ p ) of Vp corresponding to the subspace matrix Ei is defined as Equation (15).
V ^ p ( l ) = { 1 l i = 1 l H p i ( i , l i + 1 )   for   1 l < M * 1 M * i = 1 M * H p i ( i , l i + 1 )   for   M * l < N * 1 L l + 1 i = l M * + 1 M * H p i ( i , l i + 1 )   for   N * l L
Step 4—Group selection: The scanned magnetic signal of the Hall sensor array mainly contains three components: (1) trend signal corresponding to the offset voltages, DC magnetic field of the magnet, AC magnetic field of the bobbin coil, sensor lift-off variation and variation of magnetic permeability (material degradation); (2) corrosion signal; (3) noise signal corresponding to the electrical noises and magnetic signal from the fins. The trend signal usually has a high intensity, which is corresponding to a few first eigenvalues. The noise signal and corrosion signal could be separated by a weighted correlation matrix (w-correlation) among the reconstructed signal from each subspace matrix, as expressed in Equation (16) [17]; where ( X , Y ) w = i = 1 L p = 1 P w i X ( p , i ) Y ( p , i ) , X w = ( X , X ) w and w i = m i n { i , M , L i + 1 } . The lower value of w-correlation means the two series are easier to be separated because they have low correlation.
W = ( X , Y ) w X w Y w

4. Experimental Results

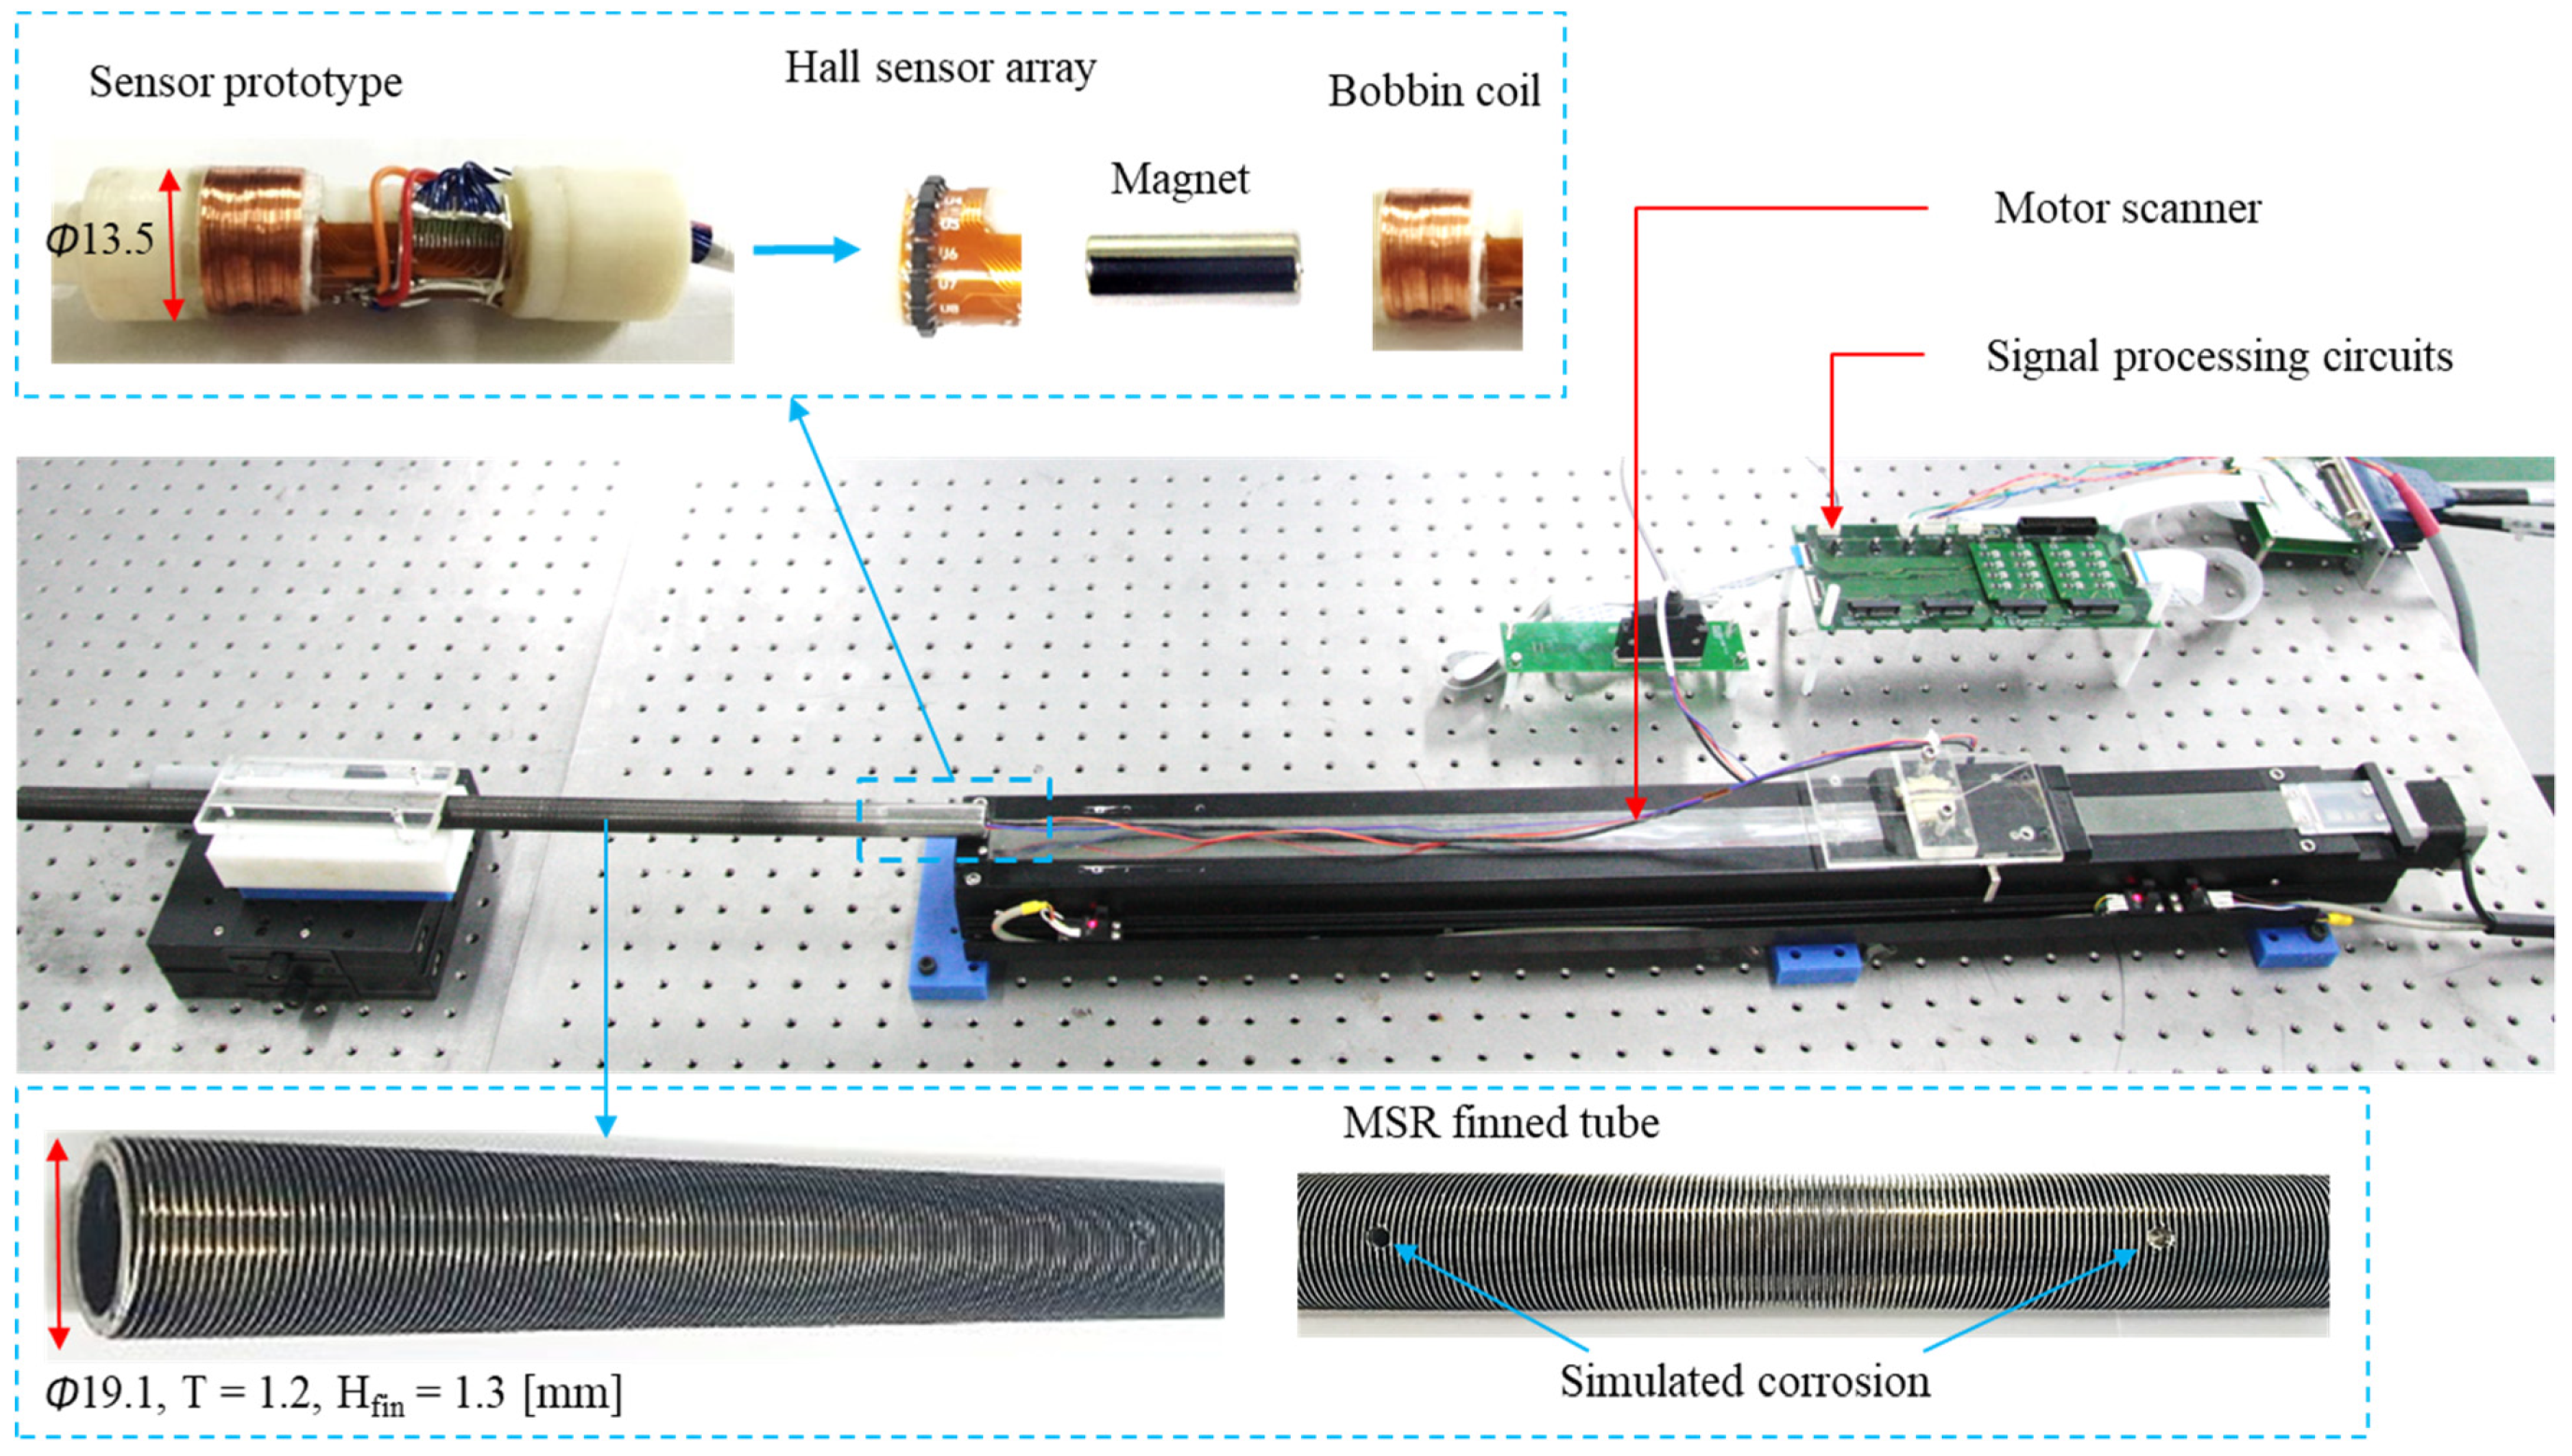
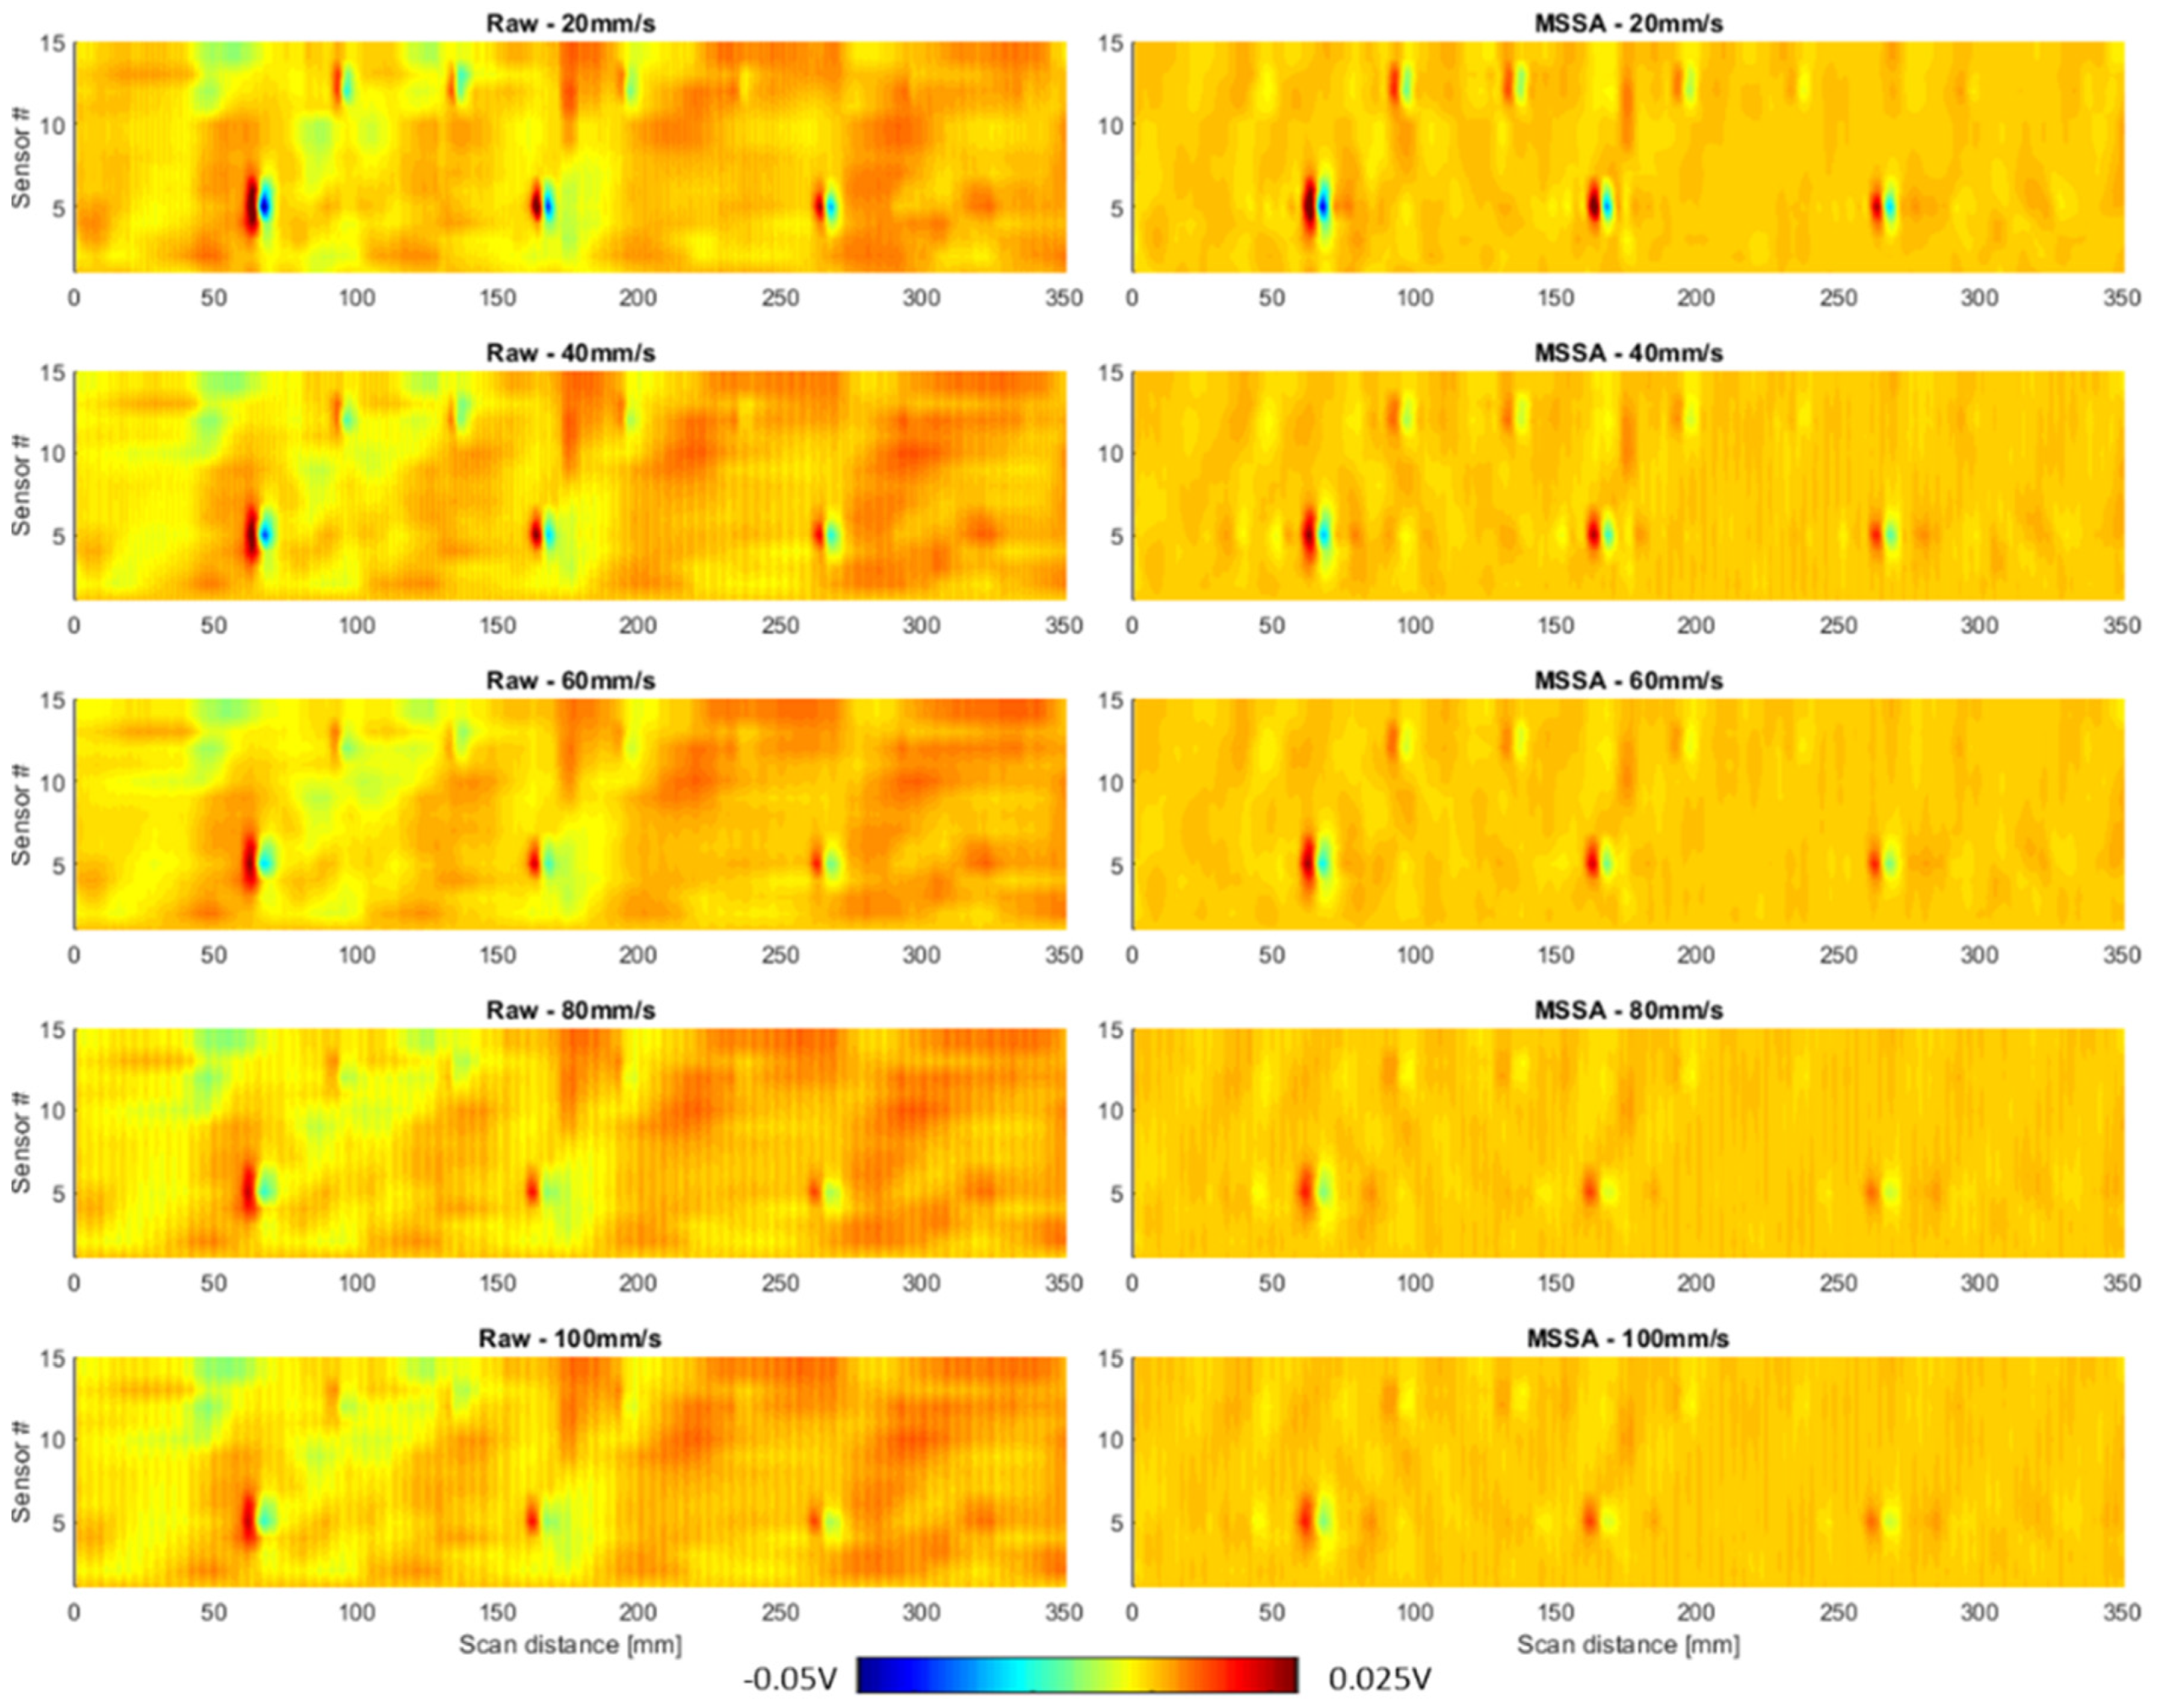
4.1. Experimental Setup

Figure 3 shows the experimental setup of the prototype MFLT, ECT and PSECT systems [11,12,13]. The sensor probes are placed inside the MSR finned tube and scanned over the tube by the support of the motor scanner. The signal processing units, including amplifiers, high/low pass filters and RMS circuits, are integrated into a single board while the ADC is the multifunctional device from National Instrument (NI-USB 6255, National Instruments, Austin, TX, USA). The MFLT probe has the Hall sensor array and a magnet; the ECT probe has Hall sensor array and a bobbin coil; and the PSECT probe has Hall sensor array, a magnet and a bobbin coil. The PSECT probe could be the MFLT probe if the bobbin coil is disconnected (open circuit). The bobbin coil has 130 turns in 10 mm length and using 0.2 mm diameter copper wire. The diameter of the sensor probes is 13.5 mm, and the inner/outer diameters of the MSR finned tube are 14.1/19.1 mm. The height and step of the fin are 1.3 mm and 1.1 fins/mm (28 fins/inch), respectively. The flat-bottom holes were produced on the outer surface of the MSR tube as a simulation for outer surface corrosion. The simulated corrosion has depths of 10–100% wall thickness and diameters of 1.3 mm and 2.5 mm. More detailed information could be found in our previous works [11,12,13].

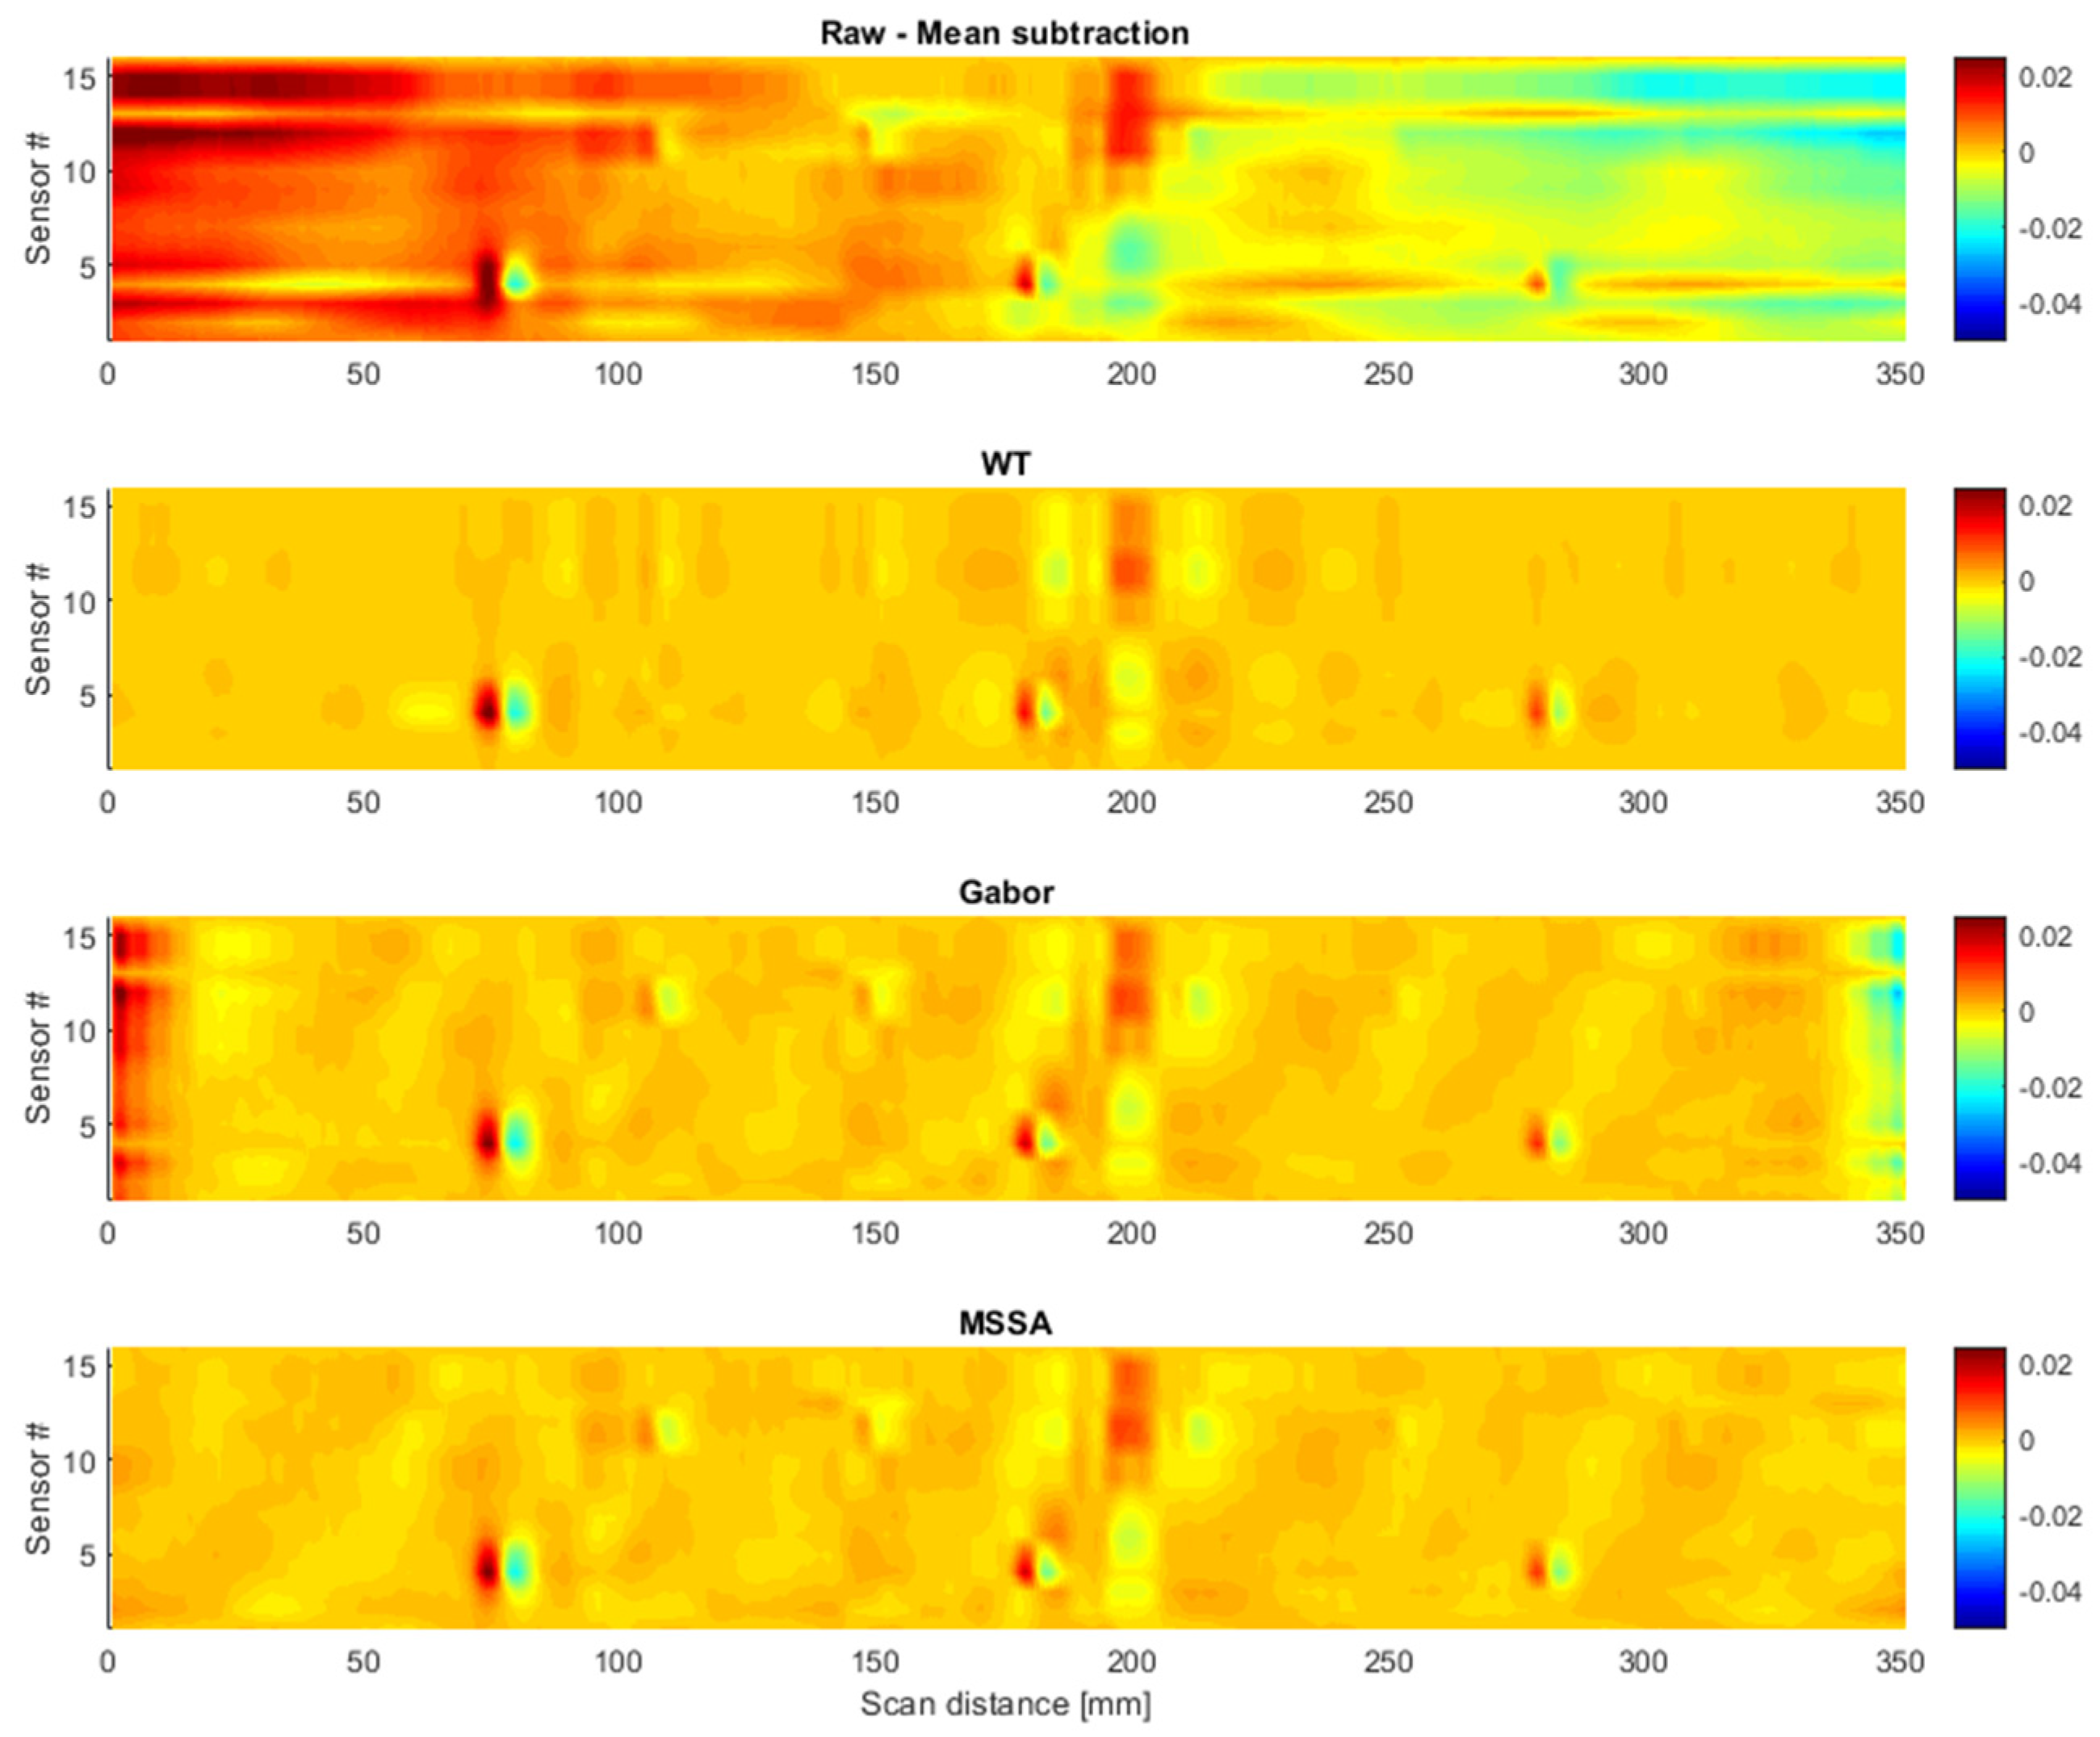
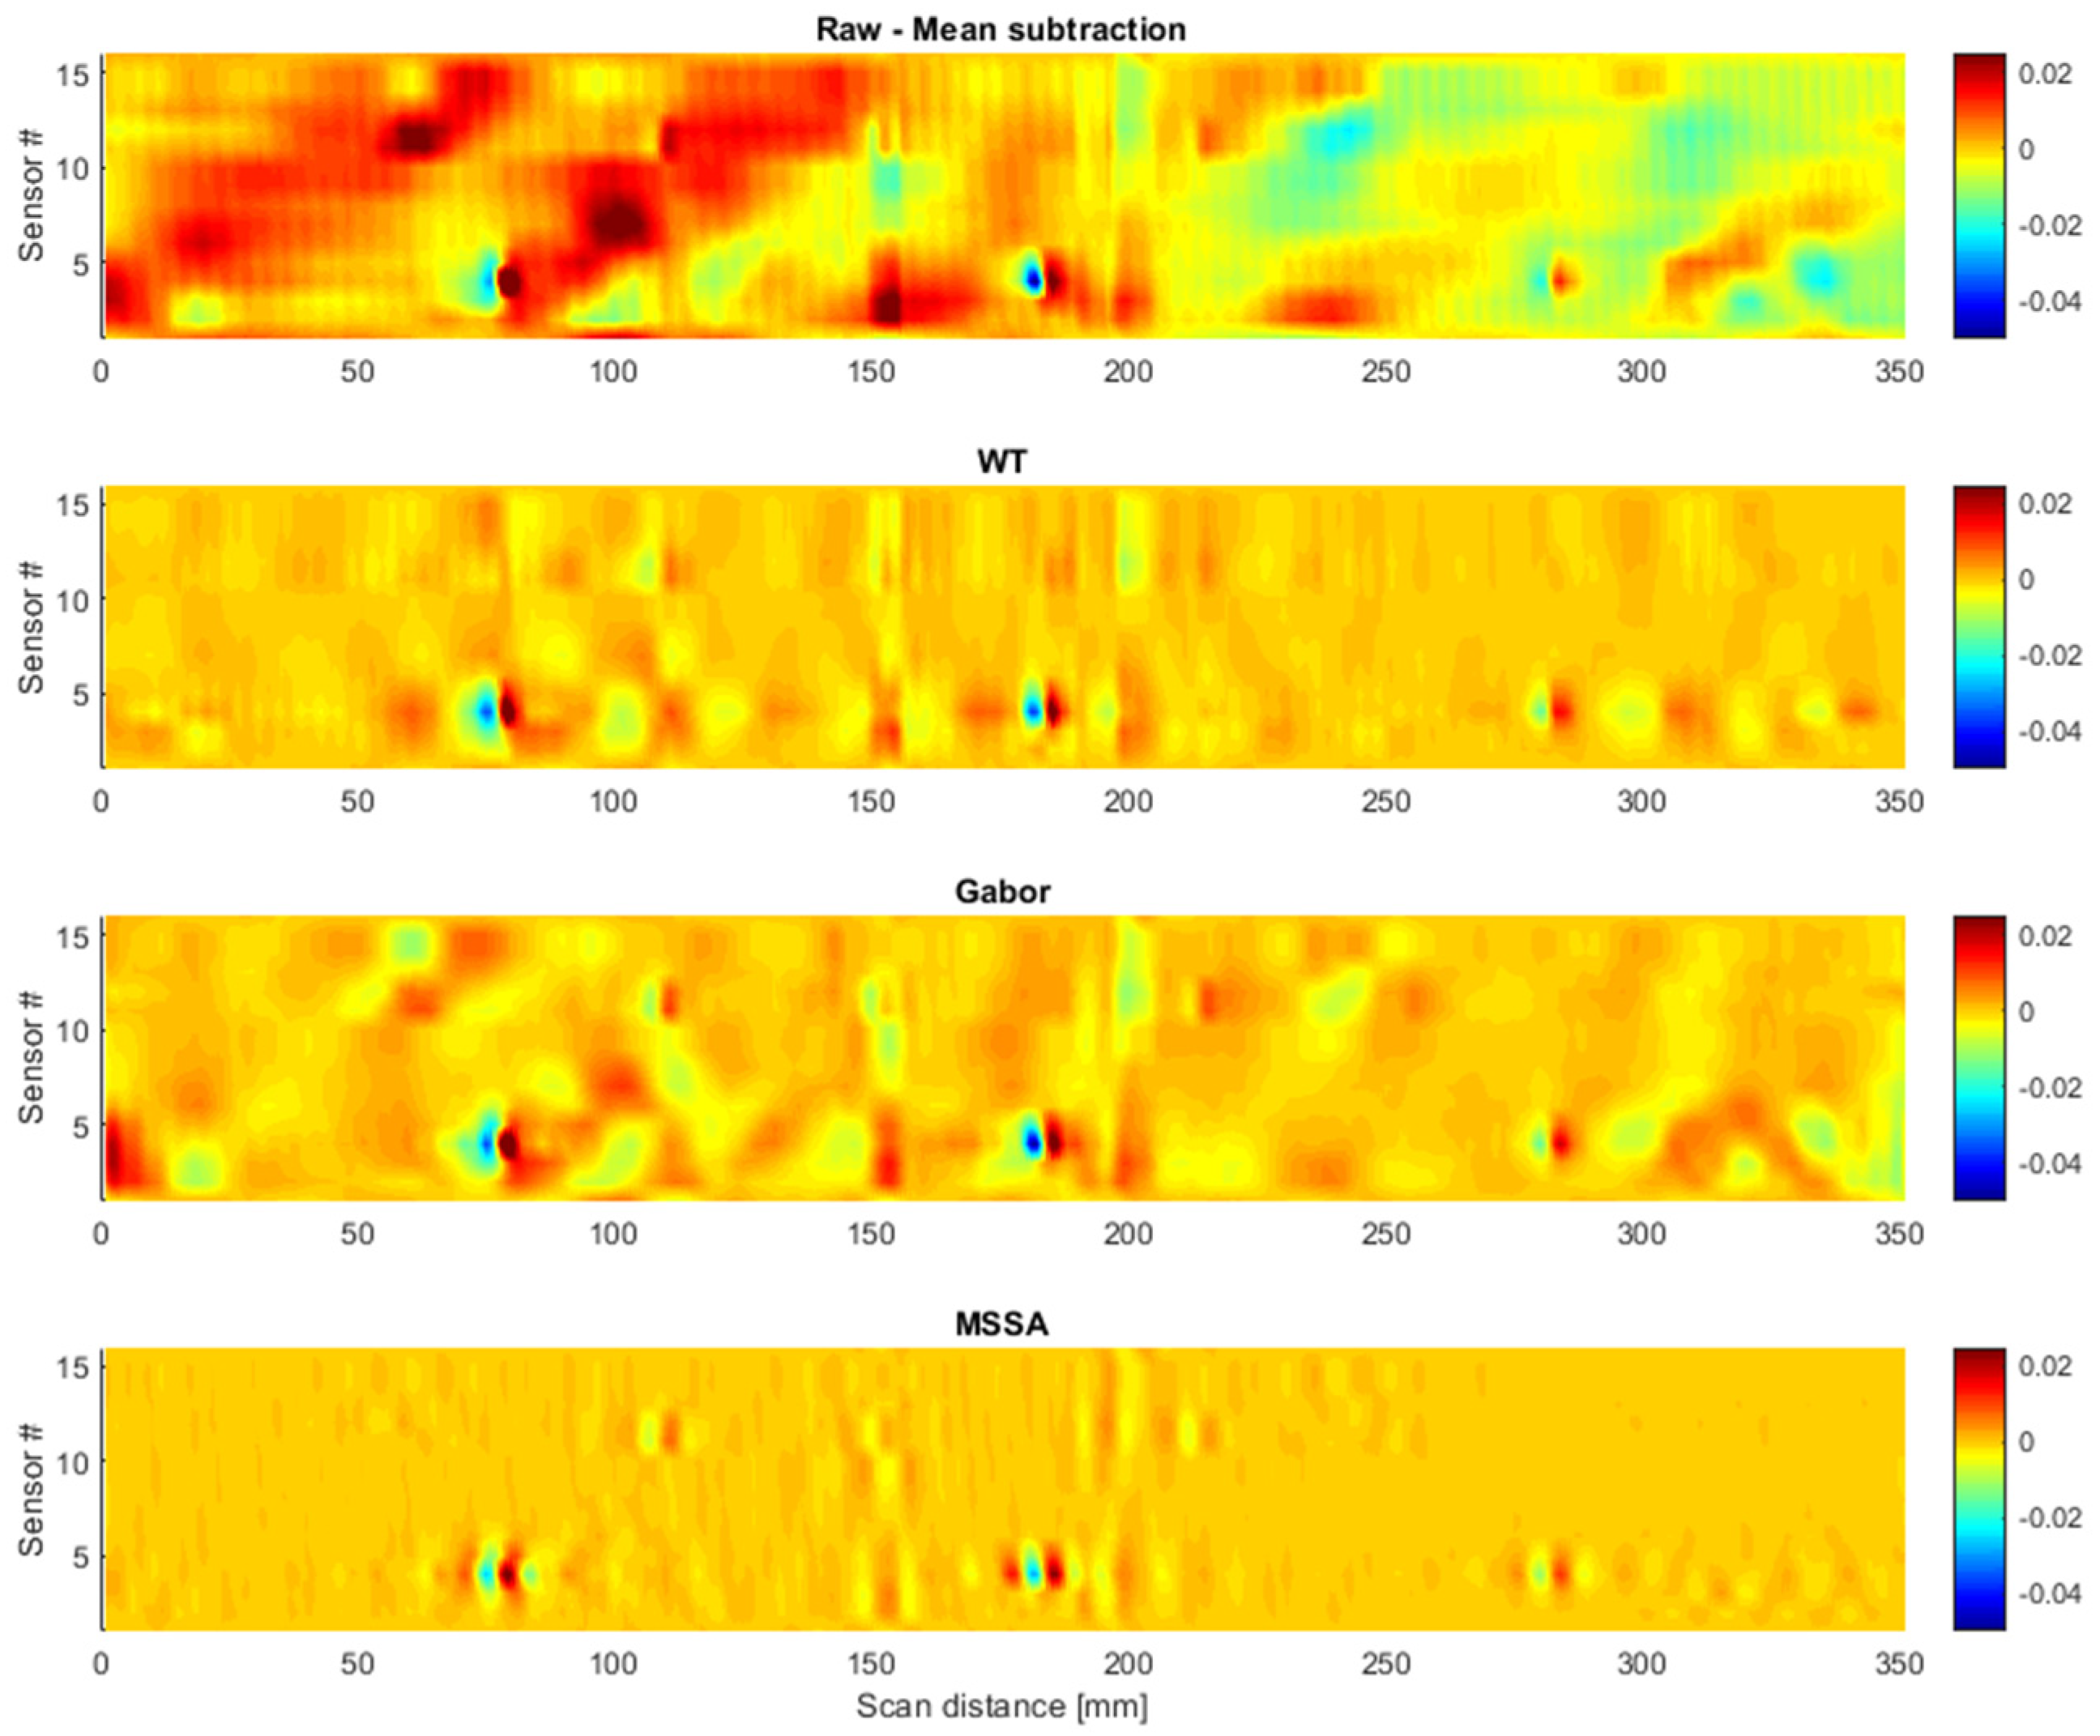
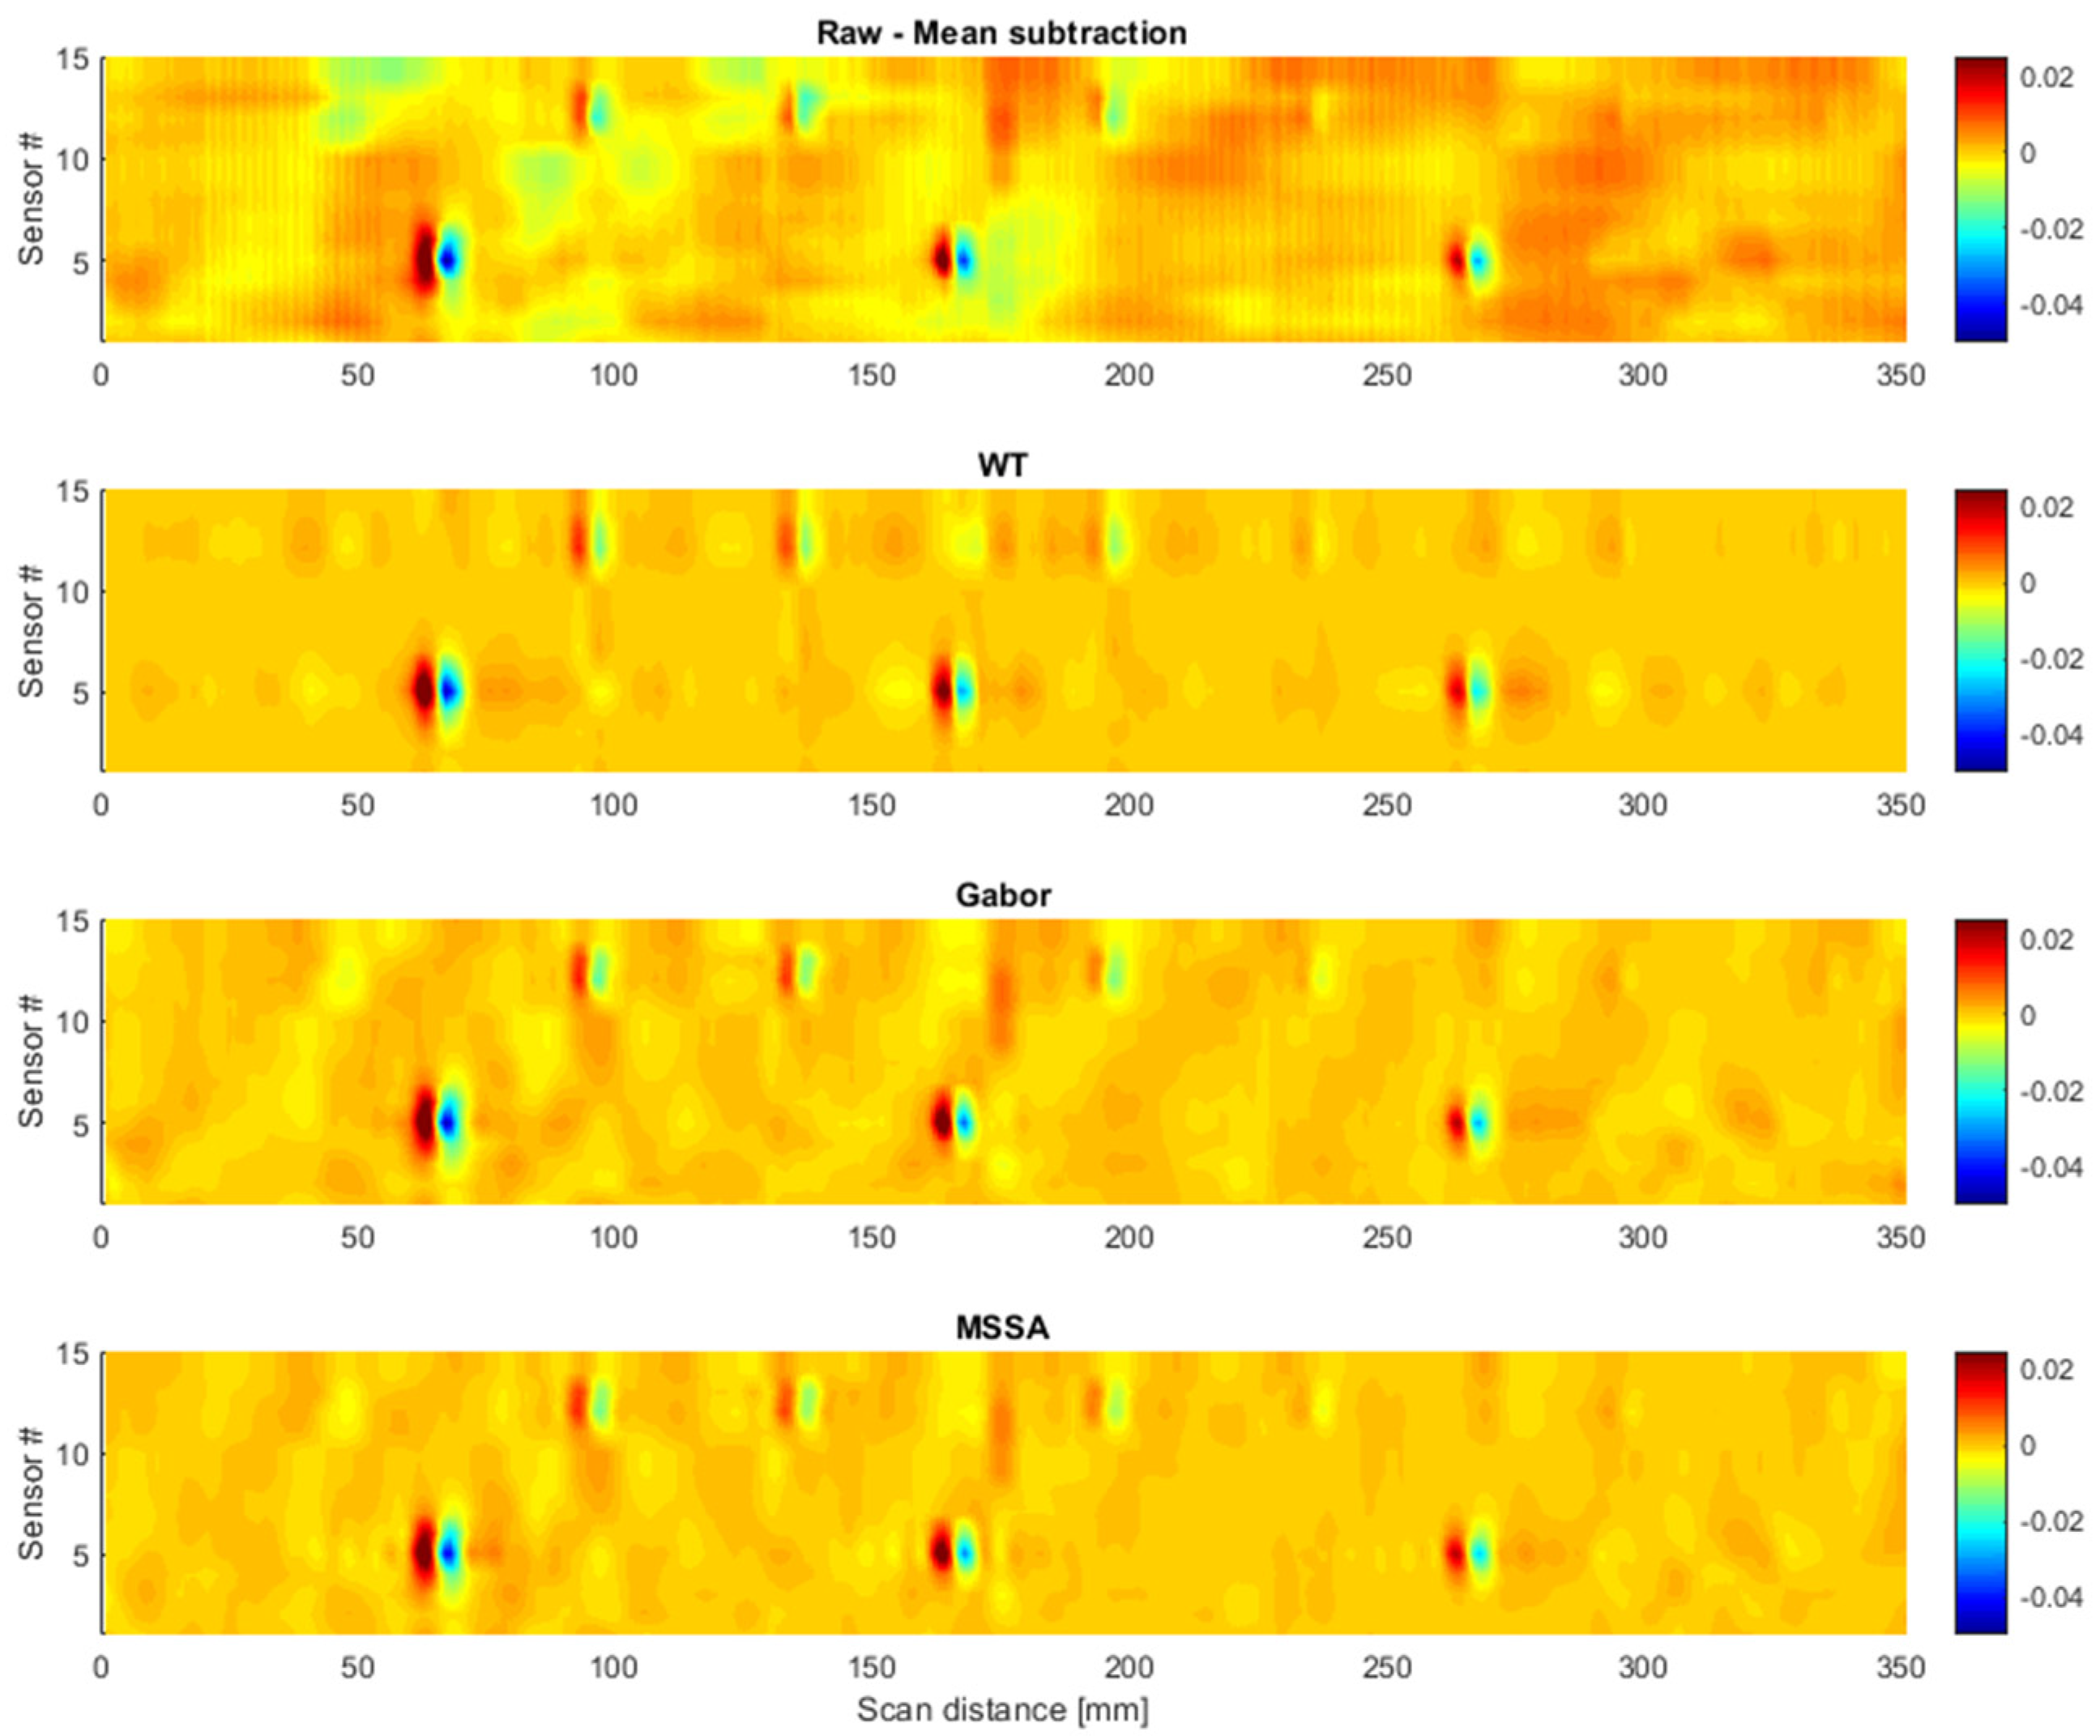
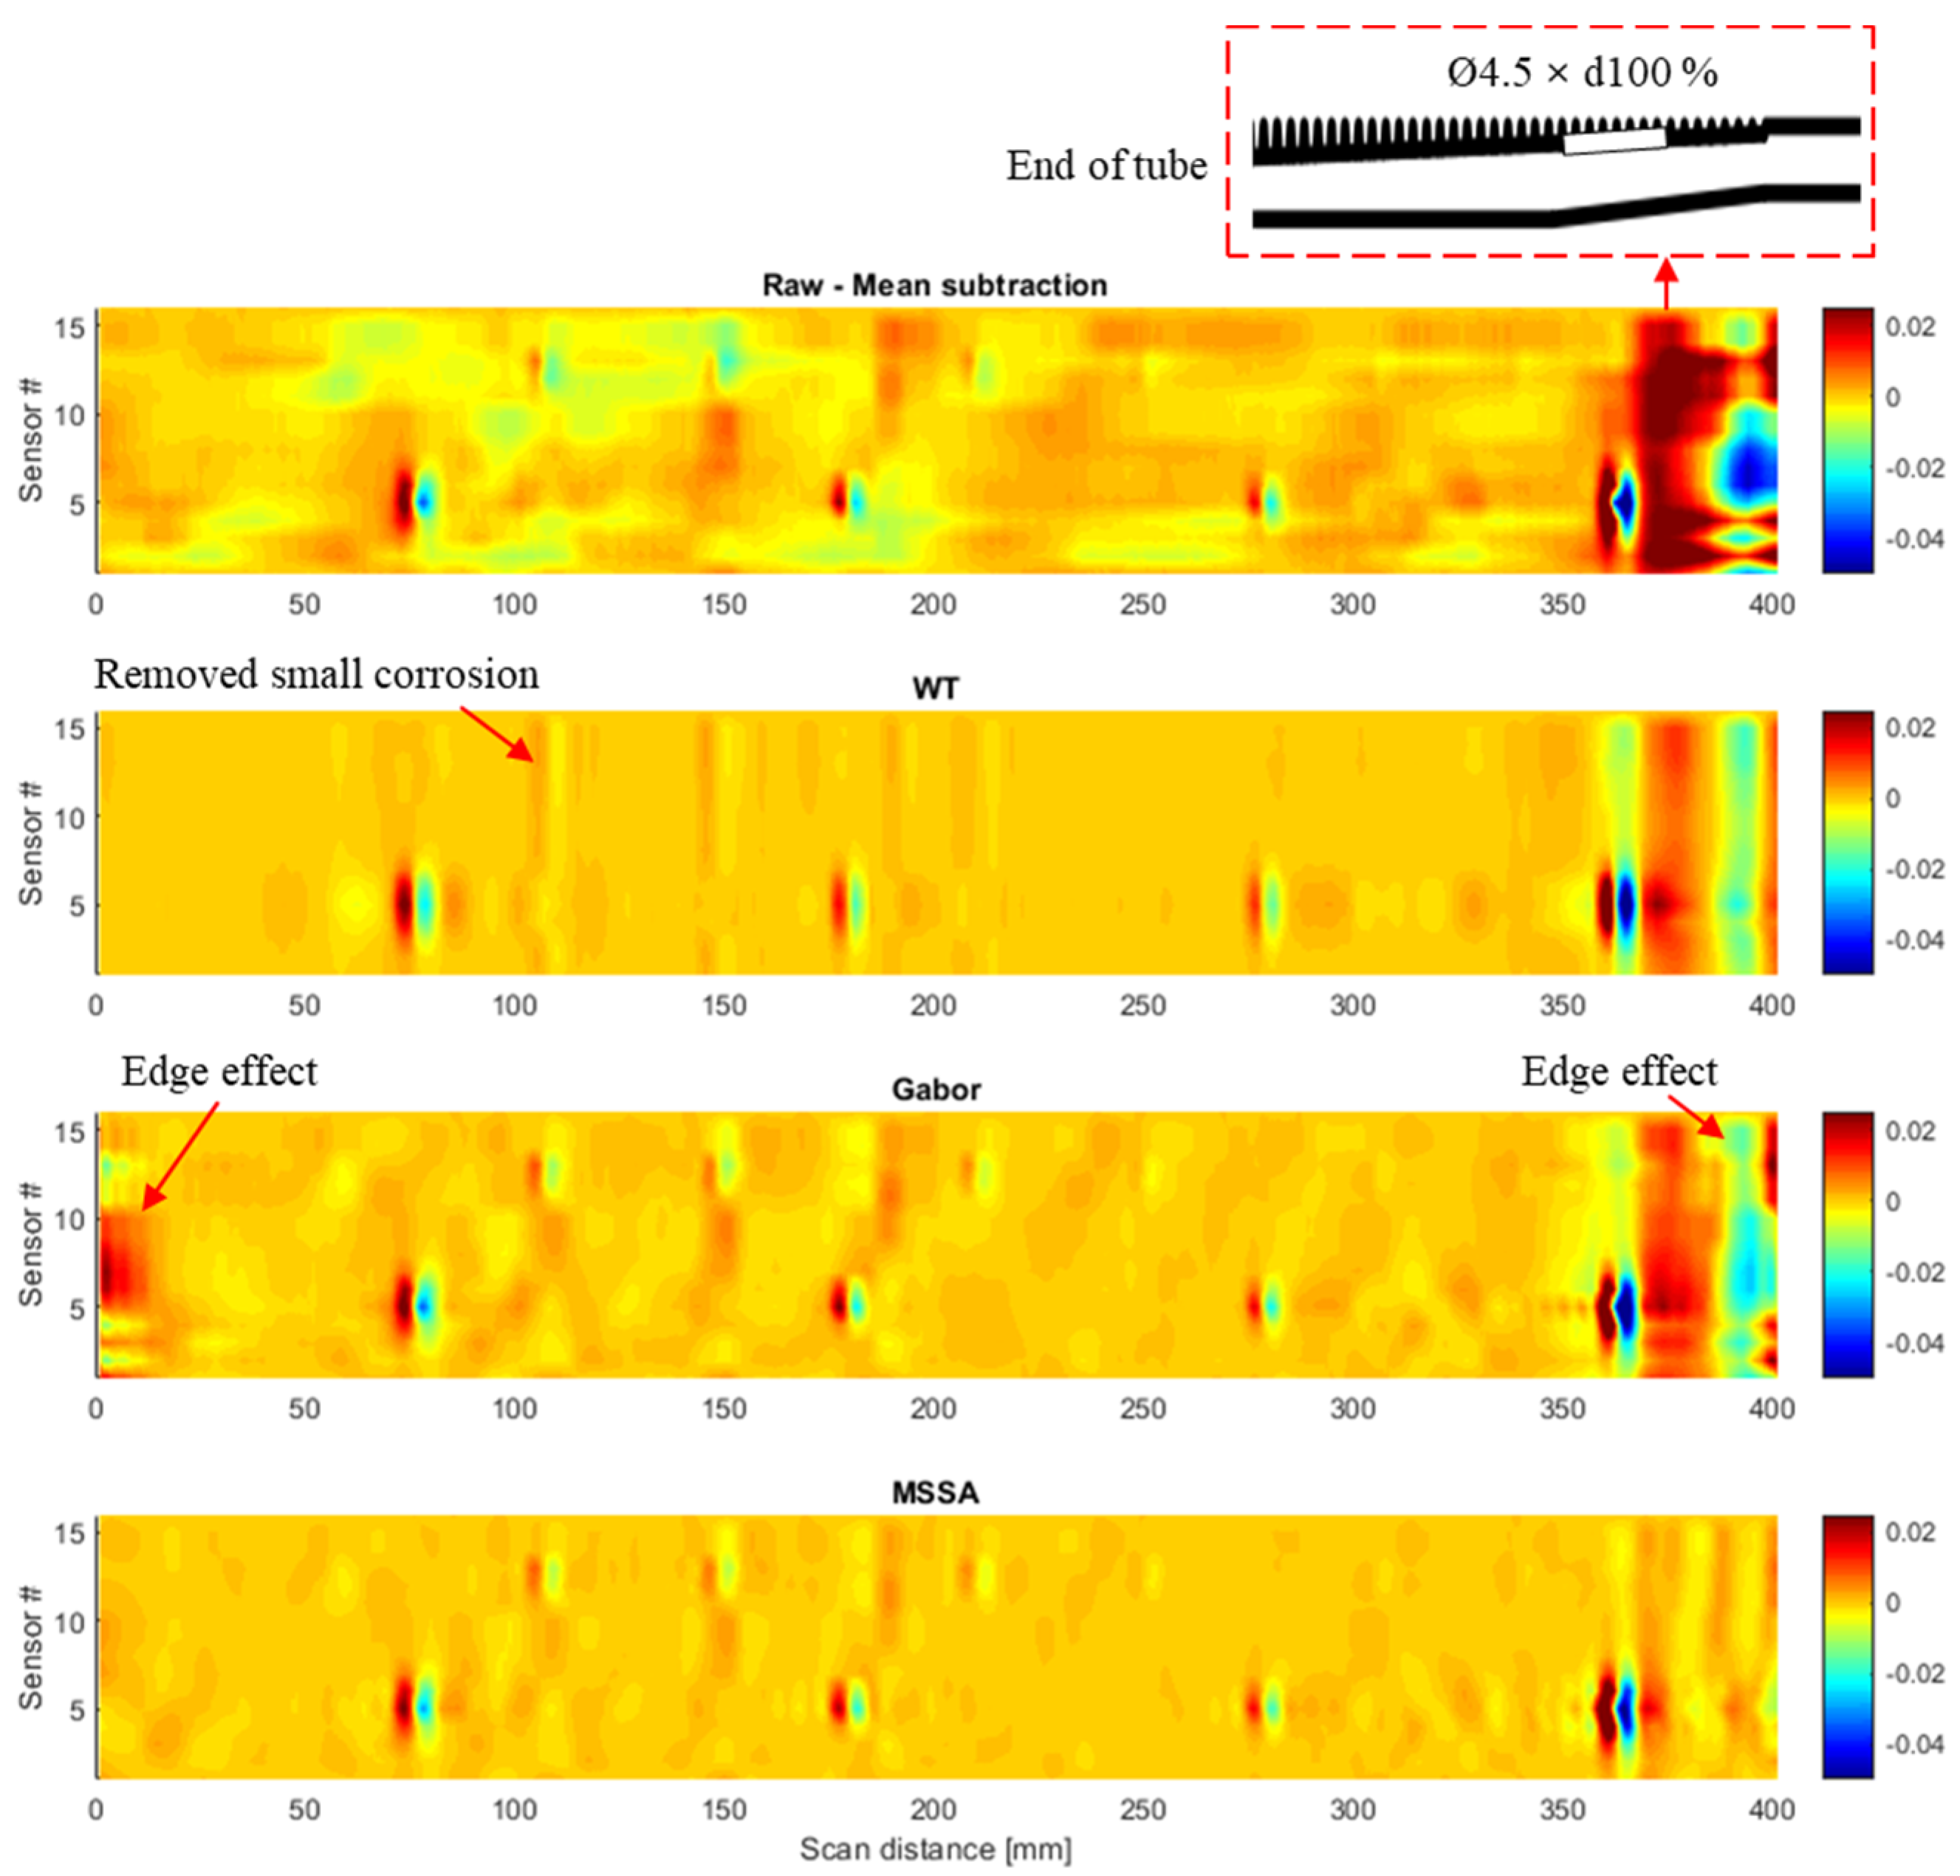
4.2. Magnetic Scanned Image before Filtering
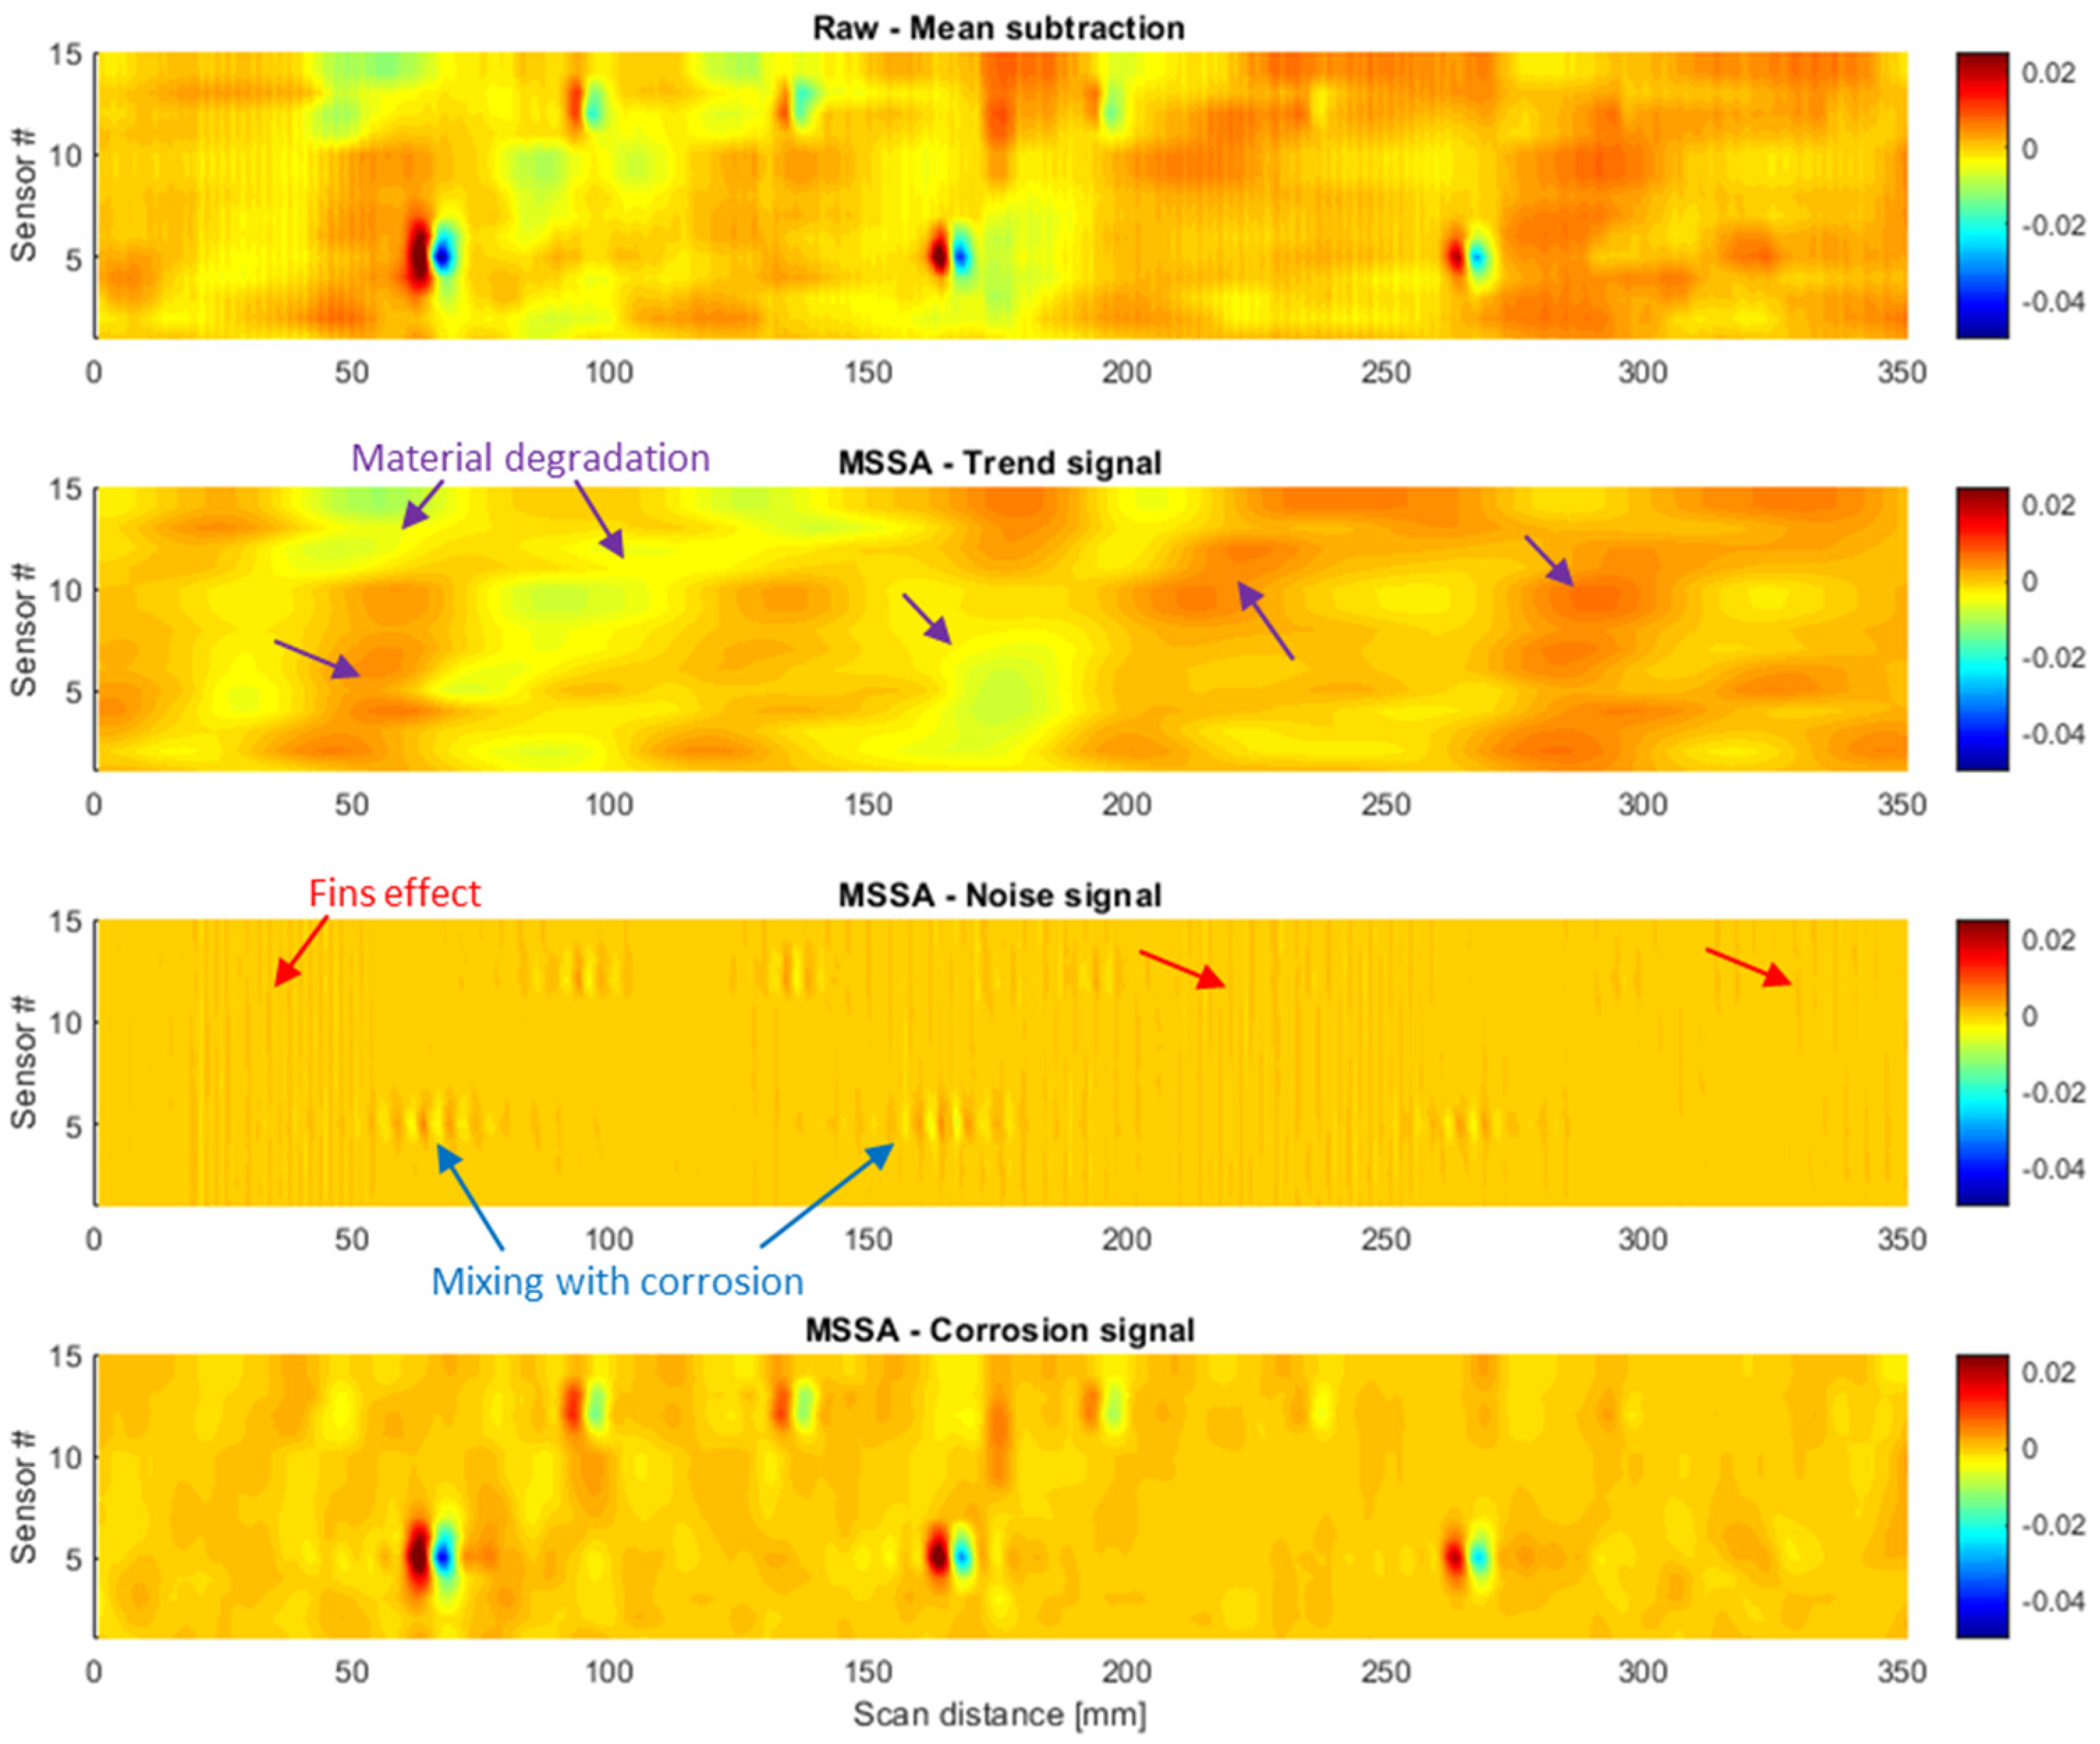
Figure 4 shows the magnetic scanned image with the mean subtraction of the MFLT, ECT and PSECT methods. The results were obtained with 100-mA and 2000-Hz current supply of the bobbin coil current and 120 mT of the magnet. The mean subtraction is aimed to remove the bias among the methods, as expressed in Equation (17). The results show challenging to observe the corrosion signal because of the high variation of the background signal. Only a few large corrosions having a diameter of 2.5 mm could be observed. In the MFLT result, the deformation and material degradation of the MSR tube could be observed, which have strong intensity in large areas. For better observation of corrosion, differential data in the scan direction is usually carried out [18,19,20], as expressed in Equation (18). The differential data of the three methods are shown in Figure 5. The first row of corrosion has the same diameter of 1.3 mm with decreasing depth from 100% to 10% of the wall thickness (1.2 mm), and the second row of corrosion have the same diameter of 2.5 mm and depth of 100%, 87% and 58% of the wall thickness (indicated in the ECT result). The fins effect could be observed in the MFLT result with the slight vertical lines along to the fins’ profile. The fins’ effect was less in the ECT method because the eddy current was mainly concentrated on the inner surface of the MSR tube. However, the fins effect was a little clearer in the PSECT method because the eddy current could deeper penetrate the outer surface of the tube. The corrosions were better detected in the ECT and PSECT method, and the PSECT method provides a higher intensity of corrosion than the ECT method.
V ˜ R M S ( i , j ) = V R M S ( i , j ) 1 L j = 1 L V R M S ( i , j )
Δ V R M S ( i , j ) = V R M S ( i , j + 1 ) V R M S ( i , j )

4.3. MSSA Results

The signal from the Hall sensors is a multivariate input (i.e., 15 inputs) of the MSSA filter. The sensor probes scanned over 350 mm length of the MSR finned tube with a distance resolution of 1.0 mm. The input signal of the MSSA filter has a size of P × L = 15 × 351. The stacking length M is chosen lower than half of the L; for example, M = 50 was used in this study. Figure 6 shows an example of the distribution of the eigenvalues according to the sorting order. The eigenvalue was normalized to the sum to show the variance retained of the scanned magnetic signals in each eigenvalue. It shows three first eigenvalues having high values, which are corresponding to the trend signal. The middle eigenvalues are corresponding to the corrosion signal. In addition. the remained small eigenvalues are corresponding to the noise signal. The eigenvalues for the trend signal could be easily distinguished because of their high values; however, it is difficult to separate the eigenvalues of the corrosion and noise signals. Therefore, w-correlation was additionally used to separate the corrosion and noise signals. Figure 7 shows an example of the w-correlation matrix. The low w-correlation values area among the eigenvalues corresponds to the corrosion signal because the noise signal is random, thus has a low correlation with the corrosion signal.
Figure 8 shows the decomposition of the magnetic scanned signal into the trend, noise and corrosion signals. The experiment was done with a 200-mA and 2000-Hz supplied current to the bobbin coil. The results show that the trend signal, which is the superposition of the magnetic field from the magnet (BM), probe variation (BV), material degradation (BD) and exciting bobbin coil (BB) could be extracted with the three first eigenvalues. The noise signal associated with the fins effect was also extracted even though a slight corrosion signal is still mixed. Finally, the corrosion signal could be successfully extracted with the eigenvalues from 4th to 18th.
Figure 9, Figure 10 and Figure 11 show the comparison results of the proposed MSSA filter with the Gabor and WT filters in the magnetic scanned signal of the MFLT and ECT methods, respectively. The MFLT signal was get much influenced by the noises from the fins effect, lift-off variation, and material degradation effect that the small corrosions were difficult to be detected; for instance, corrosion with a diameter of 1.3 mm and depth lower than 60% of the wall thickness. The strong variation of the background signal is mainly due to the variation of the lift-off and material degradation. Because the MSR tube has a high permeability, it will interact with the magnet during the scan that made the variation of the sensor lift-off. The material degradation, such as non-uniform changes of the magnetic permeability due to the stress concentration, has made a significant change in the MFLT signal intensity. However, the MSSA filter provides a good result with a clear indication of the corrosion signals than the wavelet and Gabor filters. The strong variation of the background signal was efficiently removed, but difficult in the wavelet and Gabor filters. The fins effect was smaller in the ECT method because of the skin effect, but the variation of the background signal was still clearly observed, as shown in Figure 10. The small corrosion with a diameter of 1.3 mm and depth lower than 80% of the wall thickness were not observed by the wavelet filter. In the Gabor filter result, the 60% depth corrosion could be observed, but appearing edges effect in the first and last part of the scanned signal. However, the MSSA filter is still working well and provides a clear signal of the corrosion. The PSECT method provides the best results, as shown in Figure 11. The Gabor filter and MSSA filter have similar performance over the WT filter on the extraction of the corrosion signal. However, the Gabor filter required to choose a specific cutoff frequency, while the MSSA filter is a nonparametric method.
Further advantages of the MSSA filter over the wavelet and Gabor filters could be observed in Figure 12. The magnetic scanned signal, including the end of the MSR tube, where the fins height is decreasing to zero, and the tube profile is changed. There is large corrosion with a diameter of 4.5 mm and a depth of 100% of the wall thickness. The signals from the large corrosion and end of the tube effect were much higher than the other corrosions. Thus, the retained principal components in the wavelet filter contain much information of these large signals, but less information of the small corrosions; then, all the small corrosion signals were eliminated from the wavelet filter. This phenomenon has not appeared in the Gabor filter because the Gabor filter analyzes the signal in the frequency domain. However, the significant signals have appeared at the start and end of the signals. This could be the result of the leakage frequencies in the Gabor filter. However, the effects have not happened in the MSSA filter. Thus, the MSSA filter is more stable than the other two filters.
Figure 13 shows the magnetic scanned signal at different speeds of 20, 40, 60, 80 and 100 mm/s. The raw signals are on the left column, and the processed MSSA filter signals are on the right column. The intensity of the corrosion signal decreased as the speed increases. This could be the result of the noise signal increasing. The MSSA filter shows good filtering of the noise signal and the trend signal in all the experimented speeds that help to detect the corrosion more clearly.

5. Conclusions

This study proposed an efficient filter based on the multivariate singular spectral analysis (MSSA) for electromagnetic testing (ET) of the corrosion on the moisture separator reheater (MSR) finned tube. The three ET methods, including magnetic flux leakage testing (MFLT), eddy current testing (ECT) and partial saturation eddy current testing (PSECT) were tested through the inspection of the outer-surface simulated corrosion on the MSR finned tube. The results showed that the PSECT provides the best results but containing high intensity of noise signal due to the fins effect and material degradation. The MSSA filter used the measured signals of the Hall sensor array as the multivariate inputs for efficiently removing the noise and trend signals. The Hall sensor array scanned signals were decomposed into three main subspace signals—trend signal, corrosion signal and noise signal—based on the selection of eigenvalues in the eigenvalue distribution and the w-correlation matrix. The trend signal is usually represented in the few high eigenvalues; the noise signal is represented in the small eigenvalues. The remaining eigenvalues represent the corrosion signal. The proposed MSSA filter was compared to the multivariate wavelet filter based on principle component analysis (WT) and Gabor filter and showed the efficiency of the proposed method. Moreover, the proposed MSSA filter is a nonparametric method that provides more stable results compared to the parametric methods of the WT and Gabor filters.

Author Contributions

Conceptualization, M.L. and J.L.; methodology, M.L.; software, M.L. and D.-K.L.; validation, J.L., M.L. and V.S.L.; formal analysis, V.S.L. and K.D.N.; investigation, J.L. and M.L.; resources, J.L. and M.L.; data curation, V.S.L., M.L. and D.-K.L.; writing—original draft preparation, V.S.L.; writing—review and editing, M.L.; visualization, D.-K.L., K.D.N. and V.S.L; supervision, J.L.; project administration, V.S.L. and J.L.; funding acquisition, V.S.L. and J.L. All authors have read and agreed to the published version of the manuscript.

Funding

This work was supported by the project of the Vietnam Ministry of Education and Training under Grant No. B2018-BKA-09-CtrVL and the Korea Institute of Energy Technology Evaluation and Planning, Grant Number KETEP 20171520101610.

Conflicts of Interest

The authors declare no conflict of interest.

References

  1. EPRI. Moisture Separator Reheater Source Book. Available online: https://www.epri.com/research/products/TR-106345 (accessed on 5 June 2020).
  2. ASM Handbooks. Electromagnetic Inspection Techniques. In Nondestructive Evaluation of Materials; ASM International: Novelty, OH, USA, 2018; Available online: https://dl.asminternational.org/handbooks/book/55/chapter-abstract/648015/Electromagnetic-Inspection-Techniques?redirectedFrom=fulltext (accessed on 5 June 2020).
  3. EPRI. Balance-of Plant Heat Exchanger Condition Assessment and Inspection Guide. Available online: https://www.epri.com/research/products/TR-108009 (accessed on 5 June 2020).
  4. EPRI. Evaluation of the Guided Wave Inspection Technique Using 439 Stainless Steel Finned Tubing. Available online: https://www.epri.com/research/products/GC-109349 (accessed on 5 June 2020).
  5. Kikuchi, H.; Kurisawa, Y.; Ara, K.; Kamada, Y.; Kobayashi, S. Feasibility study of magnetic flux leakage method for condition monitoring of wall thinning on tube. Int. J. Appl. Electromagn. Mech. 2010, 33, 1087–1094. [Google Scholar] [CrossRef]
  6. Yusa, N.; Chen, Z.; Miya, K. Quantitative profile evaluation of natural defects in a steam generator tube from eddy current signals. Int. J. Appl. Electromagn Mech. 2000, 12, 139–150. [Google Scholar] [CrossRef]
  7. Oaten, S.S.; Blitz, J. Impedance analysis for air-cored cylindrical eddy current coils scanning the surfaces of defect-free conductors. Nondestr. Test Eval. 1992, 6, 323–335. [Google Scholar] [CrossRef]
  8. Gibson, J.N. Use of type 439L stainless steel tubing in moisture separator/reheaters. J. Mater. Energy Syst. 1982, 4, 136–141. [Google Scholar] [CrossRef]
  9. Lee, H.J.; Cho, C.H.; Nam, M.W. Eddy current testing of type-439 stainless steel tubing using magnetic saturation technique. J. Mech. Sci. Technol. 2012, 26, 2081–2085. [Google Scholar] [CrossRef]
  10. Xie, S.; Chen, Z.; Zhou, H.; Takagi, T.; Uchimoto, T. Evaluation of Wall Thinning in Carbon Steel Piping Based on Magnetic Saturation Pulsed Eddy Current Testing Method. Stud. Appl. Electromagn. Mech. 2013, 39, 296–303. [Google Scholar]
  11. Le, M.; Kim, J.; Kim, J.; Do, H.S.; Lee, J. Electromagnetic testing of moisture separator reheater tubes using a bobbin-type integrated Hall sensor array. Int. J. Appl. Electromagn. Mech. 2017, 55, S203–S209. [Google Scholar] [CrossRef]
  12. Le, M.; Kim, J.; Kim, J.; Do, H.S.; Lee, J. Nondestructive testing of moisture separator reheater tubing system using Hall sensor array. Nondestruct. Test. Eval. 2018, 33, 35–44. [Google Scholar] [CrossRef]
  13. Le, M.; Kim, J.; Kim, J.; Lee, H.; Lee, J. Signal analysis of a bobbin-type integrated hall sensor array in electromagnetic testing for moisture separator reheater tubes. Int. J. Appl. Electromagn. Mech. 2019, 59, 1535–1542. [Google Scholar] [CrossRef]
  14. Ramos, H.; Postolache, O.; Alegria, F. Using the skin effect to estimate cracks depths in metallic structures. In Proceedings of the Instrumentation and Measurement Technology Conference, Singapore, 5–7 May 2009; pp. 1361–1366. [Google Scholar]
  15. Aminghafari, M.; Cheze, N.; Poggi, J.-M. Multivariate de-noising using wavelets and principal component analysis. Comput. Stat. Data Anal. 2006, 50, 2381–2398. [Google Scholar] [CrossRef]
  16. Bakshi, B. Multiscale PCA with application to MSPC monitoring. AIChE J. 1998, 44, 1596–1610. [Google Scholar] [CrossRef]
  17. Lv, H.; Teng, J.; Zhang, Y.; An, Q.; Liu, M.; Liang, F.L.; Jing, X.J.; Wang, J.Q. An adaptive-MSSA-based algorithm for detection of trapped victims using UWB radar. IEEE Geosci. Remote. Sens. Lett. 2015, 12, 1808–1812. [Google Scholar] [CrossRef]
  18. Lee, J.; Jun, J.; Kim, J.; Choi, H.; Le, M. Bobbin-Type Solid-State Hall Sensor Array with High Spatial Resolution for Defects Inspection in Small-Bore Piping Systems. IEEE Trans. Mag. 2012, 48, 3704–3707. [Google Scholar] [CrossRef]
  19. Le, M.; Lee, J.; Jun, J.; Kim, J. Estimation of sizes of defects on pipes in nuclear power plants using dipole moment and finite element methods. NDT E Int. 2013, 58, 56–63. [Google Scholar] [CrossRef]
  20. Kim, J.; Le, M.; Lee, J. Eddy current testing and evaluation of far-side corrosion around rivet in jet-engine intake of aging supersonic aircraft. J Nondestr. Eval. 2014, 33, 471–480. [Google Scholar] [CrossRef]
Figure 1. Electromagnetic testing of the moisture separator reheater (MSR)-finned tube. (a) Magnetic flux leakage testing (MFLT); (b) eddy current testing (ECT) and (c) partial saturation eddy current testing (PSECT).
Applsci 10 03954 g001
Figure 2. Block diagram of the multivariate singular spectral analysis (MSSA) algorithm.
Applsci 10 03954 g002
Figure 3. The prototype of the electromagnetic testing (ET) systems: the MFLT probe has the Hall sensor array and a magnet; the ECT probe has a Hall sensor array and a bobbin coil; the PSECT probe has a Hall sensor array, magnet and a bobbin coil. The PSECT probe could be the MFLT probe if the bobbin coil is disconnected (open circuit).
Applsci 10 03954 g003
Figure 4. Mean subtraction of magnetic scanned image of the MFLT, ECT and PSECT methods on the MSR finned tube and the section view at the holes of 2.5 mm diameter (sensor #5).
Applsci 10 03954 g004
Figure 5. Differential magnetic scanned signal of the MFLT, ECT and PSECT methods on the MSR finned tube and the section view at the holes of 2.5 mm diameter (sensor #5).
Applsci 10 03954 g005
Figure 6. Eigenvalues distribution.
Applsci 10 03954 g006
Figure 7. W–correlation that could separate noise signal and corrosion signal.
Applsci 10 03954 g007
Figure 8. Decomposition of the multivariate magnetic scanned signal into trend signal, noise signal and corrosion signal by the MSSA.
Applsci 10 03954 g008
Figure 9. Magnetic scanned signal by the MFLT method with the wavelet, Gabor and proposed MSSA filters.
Applsci 10 03954 g009
Figure 10. Magnetic scanned signal by the ECT method with the wavelet, Gabor and proposed MSSA filters.
Applsci 10 03954 g010
Figure 11. Magnetic scanned signal by the PSECT method with the wavelet, Gabor and proposed MSSA filters.
Applsci 10 03954 g011
Figure 12. Magnetic scanned signal by the PSECT method with the end of the tube effect.
Applsci 10 03954 g012
Figure 13. Raw magnetic scanned signal with mean subtraction and the proposed MSSA filter at different speed of 20, 40, 60, 80 and 100 mm/s.
Applsci 10 03954 g013

