Article

Economic Feasibility of Underground Pumped Storage Hydropower Plants Providing Ancillary Services

by
Javier Menéndez
1,*,
Jesús Manuel Fernández-Oro
2 and
Jorge Loredo
3
1
Hunaser Energy, Avda. Galicia 44, 33005 Oviedo, Spain
2
Energy Department, University of Oviedo, 33271 Gijón, Spain
3
Mining Exploitation Department, University of Oviedo, 33004 Oviedo, Spain
*
Author to whom correspondence should be addressed.
Appl. Sci. 2020, 10(11), 3947; https://doi.org/10.3390/app10113947
Submission received: 14 May 2020 / Revised: 4 June 2020 / Accepted: 5 June 2020 / Published: 6 June 2020
(This article belongs to the Special Issue Advances in Underground Energy Storage for Renewable Energy Sources)

Abstract

:
The electricity generated by some renewable energy sources (RESs) is difficult to forecast; therefore, large-scale energy storage systems (ESSs) are required for balancing supply and demand. Unlike conventional pumped storage hydropower (PSH) systems, underground pumped storage hydropower (UPSH) plants are not limited by topography and produce low environmental impacts. In this paper, a deterministic model has been conducted for three UPSH plants in order to evaluate the economic feasibility when considering daily turbine cycle times at full load (DTCs) between 4 and 10 h. In the model, the day-ahead and the ancillary services markets have been compared to maximize the price spread between the electricity generated and consumed. Secondary regulation, deviation management and tertiary regulation services have been analyzed to maximize the income and minimize the cost for purchasing energy. The capital costs of an open-loop UPSH plant have been estimated for the case of using the existing infrastructure and for the case of excavating new tunnels as lower reservoirs. The net present value (NPV), internal rate of return (IRR) and payback period (PB) have been obtained in all scenarios. The results obtained show that the energy generation and the annual generation cycles decrease when the DTC increases from 4 to 10 h, while the NPV and the IRR increase due to investment costs. The investment cost of a 219 MW UPSH plant using the existing infrastructure reaches 366.96 M€, while the NPV, IRR and PB reached 185 M€, 7.10% and 15 years, respectively, participating in the ancillary services markets and considering a DTC of 8 h.

1. Introduction

The rapid growth of intermittent renewable energy sources (RESs) for electricity generation requires flexible large-scale energy storage systems (ESSs). Electricity generated by some forms of RESs, such as wind or solar photovoltaic (PV), is difficult to forecast; therefore, ESSs are required for balancing electricity supply and demand [1]. Pumped storage hydroelectricity (PSH) is the most mature and efficient storage technology and accounts for 98% of storage capacity worldwide [2]. However, the development of new PSH projects is limited by topographic and environmental restrictions. Thus, disused underground space may be used as reservoir for large-scale storage systems such as underground pumped storage hydropower (UPSH) or adiabatic compressed air energy storage (A-CAES) [3,4] where the typical round trip energy efficiencies exceed 0.7–0.8 [5,6]. Unlike conventional PSH plants, which consist of two water reservoirs located at the surface, both upper and lower reservoirs may be underground in the case of UPSH plants. For that purpose, two different options may be considered: (1) to make use of existing infrastructure; or (2) to dig new tunnels. Winde et al. [7,8] explored the use of deep-level gold mines in South Africa for UPSH schemes. Pujades et al. [9,10] carried out a study considering the use of a closed slate mine located at Belgium with a capacity of 550,000 m3 as a lower reservoir for UPSH. Bodeux et al. [11] analyzed the interactions between groundwater and the slate chambers used as a subsurface water reservoir. Closed coal mines in Spain and Germany have also been proposed as underground reservoirs for UPSH [12,13,14,15]. Wong [16] proposed digging new tunnels or shafts as a lower reservoir for UPSH in the Bukit Timah granite of Singapore. The economic feasibility of UPSH plants depends on the capital costs and the price spread between the electricity generated and consumed in turbine and pumping modes, respectively. In the Iberian electricity system, RES generation is granted priority during the dispatch and receives a fixed feed-in tariff. The day-ahead prices (spot prices), are set around noon on the day preceding the delivery. The day-ahead markets are complemented by intraday markets and ancillary services in the case of unforeseen events and changing weather conditions, which mainly could affect wind and solar PV generation. Finally, the balance of the electricity demand and supply is achieved through the ancillary services, which are managed by the system operator, taking the form of auctions in the Iberian electricity system.
Traditionally, a PSH plant has been operated by the price-arbitrage strategy. PSH plants have participated in the day-ahead market, selling the electricity generated at peak periods (peak price hours) and purchasing the electricity at off-peak periods [17,18]. However, the electricity price spread between the on-peak periods and off-peak periods has been reduced significantly, and the economic feasibility of a PSH might not be guaranteed participating just in the day-ahead electricity market. Lobato et al. [19] carried out an overview of ancillary services in Spain, including a technical description and the management of the ancillary services markets. The study highlights the paramount importance of the ancillary services in a power system. Pérez-Díaz et al. [20] reviewed the trends and challenges of PSH plants with the aim of optimizing their operation in the balancing markets. The study showed that ancillary services markets, particularly those related to balancing supply and demand, emerge as a valuable source of income for PSH plants.
Krishnan and Das [21] studied the feasibility of CAES plants participating in the day-ahead and balancing markets of PJM and Midcontinent Independent System Operator (MISO), concluding that the profit may be increased 10-fold by providing ancillary services. Berrada et al. [22] estimated the income of different ESSs (PSH, CAES and gravity energy storage) that participate in the day-ahead market, the real-time energy market and the regulation market of the New York Independent System Operator (NYISO). The results obtained showed that PSH and CAES may be economically feasible when operating in the regulation market. Chazarra et al. [23] studied the economic viability of twelve PSH plants participating in the secondary regulation of the Iberian electricity system. The PSH plants were equipped with different fixed-speed and variable-speed units and with and without considering hydraulic short-circuit operation. They concluded that PSH plants equipped with variable speed technology, along with full converters with and without the possibility to operate in hydraulic short-circuit mode, and the PSH plants with ternary units obtain the lowest payback periods.
Recently, Maciejowska et al. [24] developed a model that is able to predict the price spread between the day-ahead prices and the corresponding volume-weighted average intraday markets in the German electricity system. The research concluded that the sign of the price spread can be successfully predicted with econometric models, such as ARX and probit. Ekman and Jensen [25] conducted a study of a generic ESS with a global energy efficiency of 0.7 participating in the day-ahead market and some balancing markets in Denmark. They concluded that only UPSH might be profitable as long as it participates both in the day-ahead and ancillary services markets. The contribution of a variable speed PSH to increasing the revenue has been assessed for participation in the day-ahead and secondary regulation reserve markets in the Iberian electricity system [26]. Chazarra et al. [27] developed a stochastic model for the weekly scheduling of a hydropower system to optimize the revenue in the Spanish electricity system. The obtained solution protects a multireservoir system against risk of water and storage unavailability. The effect of the complementarity between the variable renewable energy sources and the load on the flexibility of the power system was examined in the Korean electricity system [28]. They examined an optimal mix ratio between the wind and solar PV and concluded that the ratios of the wind and solar PV to the total variable generation resource were 1.3% and 93.4%, respectively. Lago et al. [29] proposed a deep neural network by using Bayesian optimization and functional analysis of variance to improve the predictive accuracy in a day-ahead energy market. Chazarra et al. [30] estimated the maximum theoretical income of a PSH plant participating as a price-taker in the day-ahead and the secondary regulation reserve markets while considering different configurations of power plants in the Iberian electricity system. The results obtained demonstrate that the operation with the variable speed technology could be of considerable help in enlarging the income of the hydropower plant.
In this work, the economic feasibility of three UPSH plants is analyzed considering DTCs between 4 and 10 h. The generation and consumption of electricity and the number of annual generation cycles have been estimated assuming a round trip energy efficiency of 0.77. The day-ahead and ancillary services markets in the Iberian electricity system are analyzed for optimizing the profitability of investment. Secondary regulation, deviation management and tertiary regulation services have been considered to maximize the income from selling energy and minimize the cost for purchasing energy. The capital costs of UPSH plants have also been calculated for the first time, considering the case of using the existing infrastructure and the case of excavating new tunnels or caverns as a lower water reservoir. Finally, a profitability analysis has been carried out using the net present value (NPV), internal rate of return (IRR) and payback period (PB).

2. Methodology

A three-step scheme of the methodology proposed to study the economic feasibility and profitability of UPSH plants is shown in Figure 1.
The model considers the electricity prices in the day-ahead and ancillary services markets hour by hour for a time period of three years (2016–2018). In step 1, the maximum and minimum prices are analyzed for the energy generated and consumed in the Iberian electricity system, considering DTCs between 4 and 10 h. The number of annual generation cycles and the amount of energy generated are obtained for all scenarios. In step 2, the investment costs of a UPSH plant are estimated for the case of using the existing infrastructure and the case of excavating new tunnels or caverns as a lower reservoir. Amortization costs are calculated considering a typical operation period of 35 years. Finally, in step 3, the operating margin, which is defined as the income from selling energy minus the costs for purchasing energy and the operation costs (O&M, start-up costs, hydraulic cannon and grid access tariffs), is estimated for the three hydropower stations (HPSs) considered in this study.
The earnings before interest and taxes (EBIT) and the cash flows have been calculated to analyze the economic feasibility and the profitability. The NPV, i.e., the difference between the present value of cash inflows and the present value of cash outflows over a period of time; IRR, i.e., a discount rate that makes the NPV of all cash flows from a project equal to zero; and PB, i.e., the time in which the initial outlay of an investment is expected to be recovered, have been calculated in all scenarios.

2.1. Technical Data of UPSH Plants

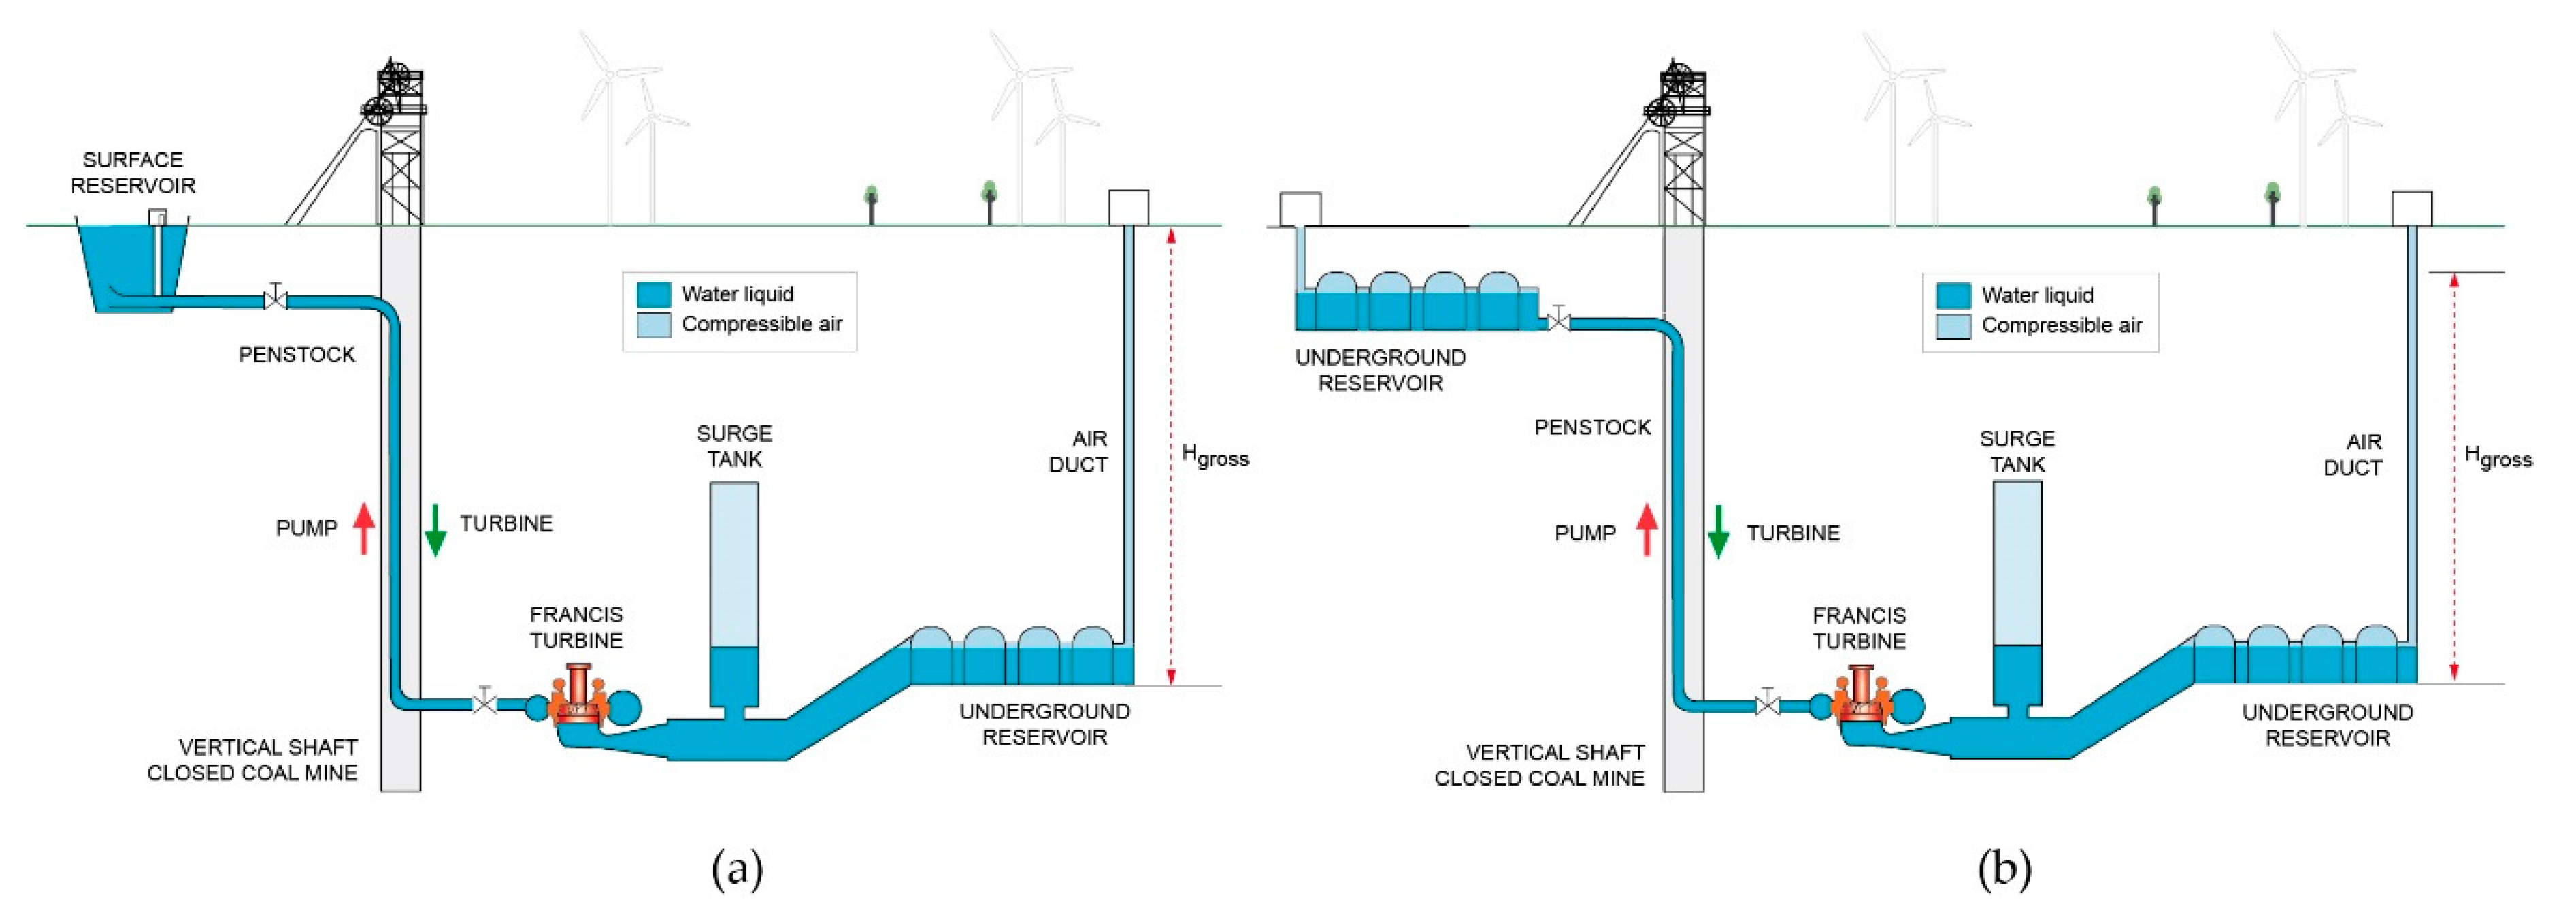
Figure 2 shows two different schemes of UPSH plants in a closed mine. Figure 2a shows a UPSH scheme with an upper surface reservoir and an underground lower reservoir. Conversely, Figure 2b depicts a shallow upper reservoir and an underground lower reservoir. Note that the gross head is reduced when a shallow upper reservoir is considered. This reduction in gross head implies a decrease in storable amount of energy.
The technical data of the three hydropower stations (HPSs) are shown in Figure 3, considering DTCs between 4–10 h day−1. The water flow rate is lower in pumping mode and therefore the pumping cycle time at full load increases to 5.40 and 13.30 h day−1. The storage capacities are 0.46, 0.8 and 1.6 Mm3 for HPS 1, HPS 2 and HPS 3, respectively, and remain constant in each DTC (4–10 h). Although the amount of storable energy does not vary, the output powers decrease from 125, 219 and 440 MW to 50, 87 and 176 MW for HPS 1, HPS 2 and HPS 3, respectively, when the turbine cycle time increases from 4 to 10 h day−1. A maximum gross pressure of 4.41 MPa has been considered. The water flow rates in turbine mode are 12.78, 22.23 and 44.45 m3 s−1 for HPS 1, HPS 2 and HPS 3, respectively, considering a DTC of 10 h, while the efficiency values are 0.91 and 0.90 in turbine and pump mode, respectively. The water flow rates in pumping mode are 9.61, 16.71 and 33.42 m3 s−1 for HPS 1, HPS 2 and HPS 3, respectively, when the pumping cycle time at full load is 13.30 h day−1. In addition, the round trip energy efficiency is assumed to be 0.77 [6].

2.2. Electric Power System Data

The economic feasibility of UPSH plants is obtained considering the historical hourly values of the prices in the day-ahead and ancillary services markets in the Iberian electricity system during a period of three years (2016–2018). The main objective of this work is to estimate the maximum income from selling energy (turbine mode) and the minimum cost for purchasing energy (pumping mode) while participating in the day-ahead and balancing markets. The following markets and services for the mentioned years have been studied: (i) the day-ahead market; (ii) the upward secondary regulation; (iii) the upward deviation management; and (iv) the tertiary regulation (upward and downward).
The overall amounts of energy managed in secondary regulation, deviation management and tertiary regulation in 2018 were 2592, 2358 and 3301 GWh, respectively. The purpose of the secondary regulation service is to maintain the generation-demand balance, automatically correcting deviations with respect to the anticipated power exchange schedule and the system frequency deviations. The objective of the deviation management service is to resolve the deviations between generation and demand which could appear in the period between the end of one intraday market and the beginning of the next intraday market horizon. Finally, the purpose of the tertiary regulation service is to resolve the deviations between generation and consumption and the restoration of the secondary control band reserve used. These ancillary services are managed and remunerated by market mechanisms in the Iberian electricity system.

3. Results and Discussion

3.1. Investment Cost of UPSH Plants

In this section, the investment costs of UPSH plants are estimated for the case of using existing underground infrastructure and the case of digging new tunnels or caverns as a lower reservoir. Currently, there are no research works where the investment costs of UPSH plants are analyzed. However, several authors have studied the investment cost of conventional PSH plants. Connolly et al. [18] proposed a range between 0.47 and 2.17 M€ MW−1 from projects in some countries in the European Union. Steffen [31] proposes a range between 0.77 and 1.28 M€ MW−1 from projects of PSH in Germany and Luxembourg. An increase between 7 and 15% is produced when the PSH plant is equipped with variable speed units. The investment cost of a UPSH plant depends strongly on the facility’s location and type of underground infrastructure.
The investment costs of a UPSH plant in a closed mine considering the case of excavation of new tunnels and the case of using existing infrastructure are shown in Table 1. A Francis pump-turbine (FT) with a maximum output power of 219 MW and a maximum input power of 208 MW, a water flow rate in turbine mode of 55.56 m3 s−1 (turbine cycle of 8 h at full load) and a water reservoir capacity of 1.6 Mm3 have been considered. In addition, in both scenarios, due to the dimensions and weight of the hydropower equipment (FT and motor-alternator), the excavation of a new access tunnel from the surface to the powerhouse is required. This tunnel would be used during the construction and operation phases. The investment cost reaches 687.34 M€, which represents a unit cost per MW of installed power of 3138 € kW−1. The main cost corresponds to civil works, reaching 525.69 M€ and representing 76.48% of the total investment cost. The cost of excavating the new tunnels as a lower reservoir reaches 453.33 M€, which is 86.23% of the total civil works cost. Conversely, the construction and waterproofing of the upper reservoir reach 30.73 M€. More details can be found in Appendix A, where the capital cost of a UPSH plant are detailed.
When the existing infrastructure is used as a lower reservoir, the investment costs are reduced to 366.96 M€, representing 46.66% less than the previous investment cost. The existing underground infrastructure would be secured with a reinforced shotcrete layer and waterproofed. Consequently, the unit cost per MW of installed capacity is also reduced to 1675 € kW−1. The cost of civil works decreases down to 218.08 M€, which is 59.40% of the total cost. The cost of conditioning the lower reservoir reaches 145.73 M€, representing 66.82% of the total civil works cost. Electrical grid connection cost includes the electric substation located in the UPSH plant and the electric power line. The excavation materials of the upper and lower reservoirs could be used for restoring the open pit mines existing in the study area. As indicated in Figure 2b, both upper and lower reservoirs could be underground. In this scenario, where the environmental impact is reduced, the investment cost reaches 1076 M€.

3.2. Estimation of Income and Expenses

The storable amount of energy in UPSH plants depends on the net head and the water mass moved. The maximum income from selling energy has been studied considering the amount of electricity generated in turbine mode considering the maximum prices in the day-ahead and ancillary services markets. Likewise, the downward tertiary regulation service and the day-ahead market have been analyzed to obtain the minimum price for purchasing energy. Figure 4a shows the maximum prices in the day-ahead and ancillary services and the minimum prices in the downward tertiary regulation service, considering DTCs between 4 and 10 h. The price spread between the day-ahead and the ancillary services markets for generation and consumption modes is shown in Figure 4b.
Concerning Figure 4a, the number of annual generation cycles is calculated to obtain the amount of electricity generated in turbine mode. The electricity consumed in pumping mode is estimated assuming a round trip energy efficiency of about 0.77. The annual generation cycles decrease from 360 to 323 when the DTC increases from 4 to 10 h. The maximum price of electricity is 78.74 € MWh−1 and is reached when participating in the ancillary services markets. That value, which corresponds to a DTC of 4 h, is progressively reduced by 7% when the DTC increases to 10 h. The minimum price in consumption mode is 22.13 € MWh−1. This cost for purchasing energy is increased by 22.81%, reaching 27.18 € MWh−1 when the DTC increases to 10 h. In Figure 4b, it is shown that the maximum price spread between the day-ahead and the ancillary service markets in generation mode is 24.92 € MWh−1. In consumption mode, the maximum price spread reaches −16.88 € MWh−1. The price spread decreases by 2.36 € MWh−1 in generation mode and 1.42 € MWh−1 in consumption mode when the DCT increases to 10 h.
For the purpose of analyzing the economic feasibility of the three HPSs considered in this study, the amount of energy generated and consumed and the maximum income from selling energy in generation mode (turbine) and minimum costs for purchasing energy in consumption mode (pumping) are shown in Figure 5 for the three HPSs. The maximum income decreases while the minimum expenses increase as the DTC increases from 4 to 10 h (see Figure 5d).
The design of the DTC influences the annual number of production cycles and therefore the amount of electricity generated. The electricity generated is reduced from 226.46 to 203.00 GWh year−1 in HPS 1, from 391.19 to 350.16 GWh year−1 in HPS 2 and from 789.73 to 701.32 GWh year−1 in HPS 3 when the DTC increases from 4 to 10 h. The maximum theoretical income reaches 49.06 M€ year−1 and is obtained in HPS 3 when the DTC is 4 h. The maximum income is reduced by 16.70% and the minimum costs are increased by 8.56% in HPS 3 when the DTC is increased to 10 h. Consequently, the spread between the income from selling electricity and the cost for purchasing electricity is also reduced from 31.59 to 21.91 M€ year−1 in HPS 3 when the DTC increases to 10 h. The maximum incomes reach 13.91 and 24.41 M€ year−1 in HPS 1 and HPS 2 when the DTC is 4 h. In addition, the spreads between the income and expenses are reduced by 45.86% and 31.12% in HPS 1 and HPS 2, respectively, when the DTC increases from 4 to 10 h day−1.
As a presumable guideline, Table 2 shows the maximum theoretical income and the expenses of the three HPSs when considering a DTC of 8 h. In this scenario, the maximum output powers (turbine mode) for HPS 1, HPS 2 and HPS 3 are 62, 109 and 219 MW, respectively, while the maximum input powers (pumping mode) are 53, 92 and 185 MW for HPS 1, HPS 2 and HPS 3, respectively. The maximum income and the minimum cost for purchasing energy are obtained participating in the day-ahead and the ancillary services markets. The costs for purchasing energy represent 84%, 85% and 87% of the total costs in HPS 1, HPS 2 and HPS 3, respectively. In addition, O&M costs, start-up costs, grid access tariff and hydraulic cannon have been considered. As established in Spanish electrical regulation, a cost of 0.5 € MWh−1 has been considered as grid access tariff. O&M costs include personnel, insurance, spare parts and external service costs. Finally, the operating margins (income from selling electricity minus the cost for purchasing electricity and operation costs) have been estimated, reaching 6.07, 10.99 and 22.71 M€ year−1 in HPS 1, HPS 2 and HPS 3, respectively. Repeating all these considerations when a DTC of 4 h is designed, the operating margins increase to 7.83, 14.11 and 28.81 M€ year−1 in HPS 1, HPS 2 and HPS 3, respectively.

3.3. Feasibility Analysis

The previous section has revealed that the maximum spreads between the income from selling electricity and the cost for purchasing electricity when participating in the ancillary services markets as well as the operating margins of UPSH plants are significantly reduced when the designed DTC increases from 4 to 10 h. However, when the DTC increases, the output power of the FT decreases and the investment costs of UPSH are reduced. This means that the economic feasibility of UPSH plants strongly depends on the investment costs. To introduce this variable in the analysis, the EBIT, PB, NPV and IRR are shown in Figure 6 for HPS 3, considering an investment cost between 1000 and 3000 € kW−1 for DTCs between 4 and 10 h. In this scenario, a UPSH plant with surface upper reservoir is considered (Figure 2a). Although the lifetime of UPSH plants could be between 60 and 100 years, a typical operation time of 35 years has been considered here in order to calculate the amortization costs [32,33]. Due to amortization costs, the EBIT decrease in all DTCs when the investment costs increase from 1000 to 3000 € kW−1 (see Figure 6a). The red line represents the limits where the EBIT turn into negative numbers. Precisely, the minimum EBIT are −8.32 M€ year−1 when the investment cost is 3000 € kW−1 and the DTC is 4 h.
In Figure 6b, a minimum PB of 9 years is obtained when the investment cost is 1000 € kW−1 and the DTC is 10 h. The PB increases to 34 years when the investment cost is 3000 € kW−1 and the DTC is 4 h. PBs lower than or equal to 20 years are reached when the investment costs are lower than 2000 € kW−1 and the DTC is greater than 6 h. In Figure 6b, the NPV decreases sharply when the investment cost increases. Again, a red line represents the border between positive and negative values. An NPV of –581 M€ is reached when the investment cost is 3000 € kW−1. The NPV increases to 294 M€ when the investment cost is reduced to 1000 € kW−1 and the designed DTC is 10 h. Finally, a maximum IRR of 12.92% is obtained when the investment costs are 1000 € kW−1 and the DTC is 10 h. IRRs greater than or equal to 6% are reached when the investment costs are lower than 2000 € kW−1 and the DTC is greater than 5 h.
According to the calculated investment costs, the profitability of each HPS is finally presented in Table 3, considering a DTC of 8 h as well as the digging of new caverns or tunnels as a lower reservoir for UPSH plants, where an investment cost of 3138 € kW−1 was estimated in Section 3.1. A pumping cycle time of 10.64 h has been assumed. As indicated previously, maximum output powers of 62, 109 and 219 MW have been considered for HPS 1, HPS 2 and HPS 3, respectively. The EBIT increase from 554.85 k€ year−1 in HPS 1 to 3335.28 k€ year−1 in HPS 3. The NPVs are negative in all HPSs, while the IRRs obtained are lower than 2.75%. Finally, high PBs (greater than 24 years) have been reached. Therefore, the construction of new underground infrastructure as the lower reservoir of a UPSH plant is not economically feasible.
The profitability analysis of HPS 1, HPS 2 and HPS 3 is shown in Table 4, considering an investment cost of 1675 € kW−1 (estimated in Section 3.1) and a DTC of 8 h. The results obtained when the existing underground infrastructure is used are much better than those of the previous scenario. The maximum NPV is 185.70 M€ and has been obtained in HPS 3, while the IRR increases to 7.10%. The minimum IRR is reached in HPS 1 (6.6%). Finally, the minimum PBs decrease to 15 years in all HPSs. This demonstrates that a UPSH plant could become economically feasible using the existing infrastructure and participating in the ancillary services markets.

3.4. Design Considerations of UPSH Plants

The proper dimensioning of a UPSH plant is highly important for optimizing its economic feasibility. The net head and the amount of water moved must be maximized for increasing the storable amount of energy and the economic feasibility. Although the amount of energy remains constant, different dimensioning of UPSH could be carried out depending on the DTC. When the DTC increases, the output power of the FT decreases, consequently reducing the investment costs. DTCs greater than 7 h would be suitable for UPSH plants. The profitability also depends on the lifetime considered. Therefore, the profitability analysis was carried out considering lifetimes of 50 and 75 years. In addition, when the lifetime is increased, the amortization costs decrease and the EBIT increase.
Table 5 shows the NPVs, IRRs and PBs for HPS 1, HPS 2 and HPS 3 when considering the construction of new tunnels or caverns as a lower reservoir. The NPVs and IRRs of HPS 1, HPS 2 and HPS 3 increase with respect to the scenario that considers a lifetime of 35 years. However, IRRs lower than 5% and NPVs lower than 167.88 M€ are reached for 75 years, and therefore the projects are not economically feasible.
Table 6 shows the profitability analysis for lifetimes of 50 and 75 years in UPSH plants where the existing infrastructure is used as a lower reservoir. The NPV and the IRR reach 471.89 M€ and 8.13% when the lifetime of the UPSH increases to 75 years. The NPVs of HPS 3 for a lifetime of 75 years are increased by 284% and 108% in comparison with the values obtained for HPS 1 and HPS 2, respectively. Finally, the PB remains constant in each HPS.

3.5. Comparison with Other Storage Technologies

The installation cost of energy storage technologies (€ kWh−1) has been compared with UPSH plants. Figure 7 shows the planned installation cost of a number of energy storage types for 2030 and highlights the low cost of conventional PSH (19 € kWh−1), followed by CAES systems (38.26 € kWh−1) [2,34]. Electrochemical storage like lithium-ion is still more expensive to install, but it is more efficient at storing and releasing energy, opening it up to a wider range of potential applications [34]. The installation cost of UPSH plants using the existing infrastructure reaches 20.90 € kWh−1, while the cost of UPSH considering the excavation of new tunnels increases to 38 € kWh−1.

4. Conclusions

The economic feasibility of UPSH plants participating in the day-ahead and ancillary services markets in the Iberian electricity system is presented for three HPSs. A deterministic model has been applied in order to maximize the income and minimize the costs for purchasing electricity. Different DTCs between 4 and 10 h have been considered in order to evaluate the economic feasibility of UPSH plants. In addition, the investment costs when making use of existing underground infrastructure and when excavating new tunnels or caverns as a lower reservoir have been estimated in order to evaluate the profitability of the investment.
The results obtained show that the number of annual production cycles and the amount of electricity generated decrease when the DTC increases. The maximum number of annual production cycles is 360 when the DTC is 4 h and decreases to 323 when the DTC increases to 10 h. Although the spread between the income from selling electricity and the costs for purchasing energy decreases when the DTC increases, the operating margin increases due to investment costs. In the profitability model, IRRs greater than or equal to 6% are reached when the investment costs are lower than 2000 € kW−1 and the DTC is greater than 5 h. In general, it can be concluded that the IRR increases when the investment costs decrease and the DTC increases.
A UPSH plant is not economically feasible when new infrastructure has to be built. Maximum IRRs of 2.43%, 2.61% and 2.75% have been obtained for HPS 1, HPS 2 and HPS 3, respectively, with a minimum PB of around 24 years. On the contrary, the investment cost of a UPSH plant is reduced by 46.6% (1675 € kW−1) when the existing underground infrastructure is used as a lower reservoir. Under these conditions, a UPSH plant could be economically feasible (IRRs greater than 6% and PBs lower than 15 years) when participating in the ancillary services markets, dimensioning DTCs greater than 6 h and using the existing underground infrastructure as a lower reservoir.

Author Contributions

Conceptualization, J.M.; investigation, J.M., J.M.F.-O. and J.L.; methodology, J.M.; software, J.M. and J.M.F.-O.; validation, J.M. and J.M.F.-O.; writing—original draft, J.M.; writing—review and editing, J.M. and J.M.F.-O.; supervision, J.L. All authors have read and agreed to the published version of the manuscript.

Funding

This research received no external funding.

Conflicts of Interest

The authors declare no conflict of interest.

Nomenclature

A-CAESAdiabatic compressed air energy storage
CAESCompressed air energy storage
DTCDaily turbine cycle time at full load
EBITEarnings before interest and taxes
ESSEnergy storage system
FTFrancis pump-turbine
HPSHydropower station
IRRInternal rate of return
LALead-acid
Li-ionLithium ion
LMOLithium manganese oxide
MISOMid-continent Independent System Operator
NPVNet present value
NCANickel cobalt aluminum
NMCNickel manganese cobalt
NYISONew York Independent System Operator
O&MOperation and maintenance
PBPayback period
PSHPumped storage hydropower
PVPhotovoltaic
RESRenewable energy sources
UPSHUnderground pumped storage hydropower
VRLAValve-regulated lead-acid

Appendix A

Table A1. Assessment of the investment costs of a UPSH plant, considering an FT with 219 MW of output power and a DTC of 8 h. Civil works, hydromechanical equipment and penstock, hydropower equipment, electric substation and grid connection.
UPSH—Investment Cost (k€)
Civil works525,692.80
Surface works31,110.40
  Upper reservoir30,730.00
   Excavation and support23,680.00
   Waterproofing7050.00
  Electric substation380.40
Underground works494,582.40
  Tunnel of access24,923.30
   Excavation and support system24,800.00
   Lighting system48.50
   Ventilation system74.80
  Powerhouse cavern12,555.63
   Excavation and support system8950.00
   Cavern equipment2485.00
   Vent shaft and electric cables975.30
   Drainage drift145.33
  Lower reservoir453,333.33
  Submergence tunnel2550.00
  Vent shaft652.40
  Surge tank567.74
Hydromechanical equipment and penstock16,986.52
 Intake3280.00
 Penstock4056.00
 Auxiliary systems9650.52
Hydropower equipment99,709.12
 Francis pump-turbine37,640,85
 Motor-generator35,321.85
 Electrical and control systems25,895.53
 Fire protection system850.90
Electrical grid connection4510.50
 Electric substation3250.30
 Powerline1260.20
Total Cost (k€)639,209.18
Table A2. Assessment of the investment costs of a UPSH plant, considering an FT with 219 MW of output power and a DTC of 8 h. Commissioning and project management.
UPSH—Investment Cost (k€)
Commissioning4140.85
 Spare parts and staff training895.30
 Civil and structure works and penstock450.20
 Mechanical review790.25
 Electrical review675.80
 Control system review560.40
 Commissioning testing768.90
Project management36,301.30
 Building permits and others16,950.00
 Engineering3250.00
 Construction management4230.90
 Security and health2420.40
 Waste management9450.00
Total Cost (k€)40,442.15
Figure A1. Capital cost breakdown for a UPSH plant with surface upper reservoir and underground lower reservoir.
Applsci 10 03947 g0a1

References

  1. Weron, R. Electricity price forecasting: A review of the state-of-the-art with a look into the future. Int. J. Forecast 2014, 30, 1030–1081. [Google Scholar] [CrossRef] [Green Version]
  2. Mongird, K.; Fotedar, V.; Viswanathan, V.; Koritarov, V.; Balducci, P.; Hadjerioua, B.; Alam, J. Energy Storage Technology and Cost Characterization Report; U.S. Department of Energy’s Water Power Technologies Office by Pacific Northwest National Laboratory: Washington, DC, USA, 2019.
  3. Matos, C.R.; Carneiro, J.F.; Silva, P.P. Overview of large-scale underground energy storage technologies for integration of renewable energies and criteria for reservoir identification. J. Energy Storage 2019, 21, 241–258. [Google Scholar] [CrossRef]
  4. Pummer, E.; Schüttrumpf, H. Reflection phenomena in underground pumped storage reservoirs. Water 2018, 10, 504. [Google Scholar] [CrossRef] [Green Version]
  5. Tola, V.; Meloni, V.; Spadaccini, F.; Cau, G. Performance assessment of Adiabatic Compressed Air Energy Storage (A-CAES) power plants integrated with packed-bed thermocline storage systems. Energy Convers. Manag. 2017, 151, 343–356. [Google Scholar] [CrossRef]
  6. Menendez, J.; Fernández-Oro, J.M.; Galdo, M.; Loredo, J. Efficiency analysis of underground pumped storage hydropower plants. J. Energy Storage 2020, 28, 101234. [Google Scholar] [CrossRef]
  7. Winde, F.; Kaiser, F.; Erasmus, E. Exploring the use of deep level gold mines in South Africa for underground pumped hydroelectric energy storage schemes. Renew. Sustain. Energy Rev. 2016, 78, 668–682. [Google Scholar] [CrossRef]
  8. Winde, F.; Stoch, E.J. Threats and opportunities for post-closure development in dolomitic gold mining areas of the West Rand and Far West Rand (South Africa)—A hydraulic view part 1: Mining legacy and future threats. Water SA 2010, 36, 69–74. [Google Scholar] [CrossRef] [Green Version]
  9. Pujades, E.; Orban, P.; Archambeau, P.; Erpicum, S.; Dassargues, A. Numerical study of the Martelange mine to be used as underground reservoir for constructing an Underground Pumped Storage Hydropower plant. Adv. Geosci. 2018, 45, 51–56. [Google Scholar] [CrossRef] [Green Version]
  10. Pujades, E.; Orban, P.; Archambeau, P.; Kitsikoudis, V.; Erpicum, S.; Dassargues, A. Underground Pumped-Storage Hydropower (UPSH) at the Martelange Mine (Belgium): Interactions with Groundwater Flow. Energies 2020, 13, 2353. [Google Scholar] [CrossRef]
  11. Bodeux, S.; Pujades, E.; Orban, P.; Brouyère, S.; Dassargues, A. Interactions between groundwater and the cavity of an old slate mine used as lower reservoir of an UPSH (Underground Pumped Storage Hydroelectricity): A modelling approach. Eng. Geol. 2016, 217, 71–80. [Google Scholar] [CrossRef] [Green Version]
  12. Menendez, J.; Loredo, J.; Galdo, M.; Fernandez-Oro, J.M. Energy storage in underground coal mines in NW Spain: Assessment of an underground lower water reservoir and preliminary energy balance. Renew. Energy. 2019, 134, 1381–1391. [Google Scholar] [CrossRef]
  13. Menéndez, J.; Ordóñez, A.; Álvarez, R.; Loredo, J. Energy from closed mines: Underground energy storage and geothermal applications. Renew. Sustain. Energy Rev. 2019, 108, 498–512. [Google Scholar] [CrossRef]
  14. Madlener, R.; Specht, J.M. An Exploratory Economic Analysis of Underground Pumped-Storage Hydro Power Plants in Abandoned Coal Mines; FCN Working Paper No. 2/2013; FCN: Aachen, Germany, 2013. [Google Scholar]
  15. Menéndez, J.; Fernández-Oro, J.M.; Galdo, M.; Loredo, J. Transient Simulation of Underground Pumped Storage Hydropower Plants Operating in Pumping Mode. Energies 2020, 13, 1781. [Google Scholar] [CrossRef] [Green Version]
  16. Wong, I.H. An underground pumped storage scheme in the Bukit Timah granite of Singapore. Tunn. Undergr. Space Technol. 1996, 11, 485–489. [Google Scholar] [CrossRef]
  17. Graves, F.; Jenkin, T.; Murphy, D. Opportunities for electricity storage in deregulating markets. Electr. J. 1999, 12, 46–56. [Google Scholar] [CrossRef]
  18. Connolly, D.; Lund, H.; Finn, P.; Mathiesen, B.V.; Leahy, M. Practical operation strategies for pumped hydroelectric energy storage (PHES) utilising electricity price arbitrage. Energy Policy 2011, 39, 4189–4196. [Google Scholar] [CrossRef] [Green Version]
  19. Lobato, E.; Egido, I.; Rouco, L.; López, G. An overview of ancillary services in Spain. Electr. Power Syst. Res. 2008, 78, 515–523. [Google Scholar] [CrossRef]
  20. Pérez-Díaz, J.I.; Chazarra, M.; García-González, J.; Cavazzini, G.; Stoppato, A. Trends and challenges in the operation of pumped-storage hydropower plants. Renew. Sustain. Energy Rev. 2015, 44, 767–784. [Google Scholar] [CrossRef]
  21. Krishnan, V.; Das, T. Optimal allocation of energy storage in a co-optimized electricity market: Benefits assessment and deriving indicators for economic storage ventures. Energy 2015, 81, 175–188. [Google Scholar] [CrossRef]
  22. Berrada, A.; Loudiyi, K.; Zorkani, I. Valuation of energy storage in energy and regulation markets. Energy 2016, 115, 1109–1118. [Google Scholar] [CrossRef]
  23. Chazarra, M.; Pérez-Díaz, J.I.; García-González, J.; Praus, R. Economic viability of pumped-storage power plants participating in the secondary regulation service. Appl. Energy 2018, 216, 224–233. [Google Scholar] [CrossRef]
  24. Maciejowska, K.; Nitka, W.; Weron, T. Day-Ahead vs. Intraday—Forecasting the Price Spread to Maximize Economic Benefits. Energies 2019, 12, 631. [Google Scholar] [CrossRef] [Green Version]
  25. Ekman, C.K.; Jensen, S.H. Prospects for large scale electricity storage in Denmark. Energy Convers. Manag. 2010, 51, 1140–1147. [Google Scholar] [CrossRef]
  26. Chazarra, M.; Pérez-Díaz, J.; García-González, J. Optimal Operation of Variable Speed Pumped Storage Hydropower Plants Participating in Secondary Regulation Reserve Markets. In Proceedings of the 2014 11th International Conference on the European Energy Market (EEM), Krakow, Poland, 28–30 May 2014. [Google Scholar]
  27. Chazarra, M.; García-González, J.; Pérez-Díaz, J.I.; Arteseros, M. Stochastic optimization model for the weekly scheduling of a hydropower system in day-ahead and secondary regulation reserve markets. Electr. Power Syst. Res. 2016, 130, 67–77. [Google Scholar] [CrossRef]
  28. Min, C.-G.; Kim, M.-K. Impact of the Complementarity between Variable Generation Resources and Load on the Flexibility of the Korean Power System. Energies 2017, 10, 1719. [Google Scholar] [CrossRef] [Green Version]
  29. Lago, J.; Ridder, F.D.; Vrancx, P.; Schutter, B.D. Forecasting day-ahead electricity prices in Europe: The importance of considering market integration. Appl. Energy 2018, 211, 890–903. [Google Scholar] [CrossRef]
  30. Chazarra, M.; Pérez-Díaz, J.; García-González, J. Optimal Joint Energy and Secondary Regulation Reserve Hourly Scheduling of Variable Speed Pumped Storage Hydropower Plants. IEEE Trans. Power Syst. 2018, 33, 103–115. [Google Scholar] [CrossRef]
  31. Steffen, B. Prospects for pumped-hydro storage in Germany. Energy Policy 2012, 45, 420–429. [Google Scholar] [CrossRef] [Green Version]
  32. Pearre Nathaniel, S.; Swan Lukas, G. Technoeconomic feasibility of grid storage: Mapping electrical services and energy storage technologies. Appl. Energy 2015, 137, 501–510. [Google Scholar] [CrossRef]
  33. Ardizzon, G.; Cavazzini, G.; Pavesi, G. A new generation of small hydro and pumped hydro power plants: Advances and future challenges. Renew. Sustain. Energy Rev. 2014, 31, 746–761. [Google Scholar] [CrossRef]
  34. IRENA. Electricity Storage and Renewables: Costs and Markets to 2030; International Renewable Energy Agency: Abu Dhabi, UAE, 2017. [Google Scholar]
Figure 1. Methodology scheme to analyze the economic feasibility of underground pumped storage hydropower (UPSH) plants.
Applsci 10 03947 g001
Figure 2. UPSH scheme in a closed mine. (a) Surface upper reservoir and underground lower reservoir; (b) Shallow upper reservoir and underground lower reservoir.
Applsci 10 03947 g002
Figure 3. Technical data of HPS 1, HPS 2 and HPS 3, considering daily turbine cycle times at full load (DTCs) between 4–10 h day−1. (a) Power in turbine and pump modes; (b) water flow rate in turbine and pump modes.
Applsci 10 03947 g003
Figure 4. Analysis of electricity markets. (a) Maximum electricity prices in the day-ahead and ancillary services markets; minimum costs in the downward tertiary regulation service and annual generation cycles. (b) Price spread between the day-ahead and the ancillary services markets.
Applsci 10 03947 g004
Figure 5. Maximum income from selling energy and minimum cost for purchasing energy, considering DTCs between 4 and 10 h: (a) HPS 1; (b) HPS 2; (c) HPS 3. (d) Amount of energy generated and consumed for HPS 1, HPS 2 and HPS 3.
Applsci 10 03947 g005
Figure 6. Feasibility analysis of HPS 3 with surface upper reservoir, considering DTCs between 4 and 10 h and investment costs between 1000 and 3000 € kW−1. (a) Earnings before interest and taxes (EBIT), where the red line represents zero EBIT; (b) payback period; (c) net present value (NPV), where the red line represents zero NPV; (d) internal rate of return.
Applsci 10 03947 g006
Figure 7. Energy installation cost of battery storage technologies vs. UPSH plants.
Applsci 10 03947 g007
Table 1. UPSH investment costs analysis for construction of new tunnels or caverns and for making use of existing infrastructure.
UPSH Investment Costs (k€)New TunnelsExisting Infrastructure
Civil works525,692.80218,083.58
Hydromechanical equipment and penstock16,986.5216,986.52
Hydropower equipment99,709.1299,709.12
Electrical grid connection4510.504510.50
Commissioning4140.853767.38
Project management36,301.3023,907.56
Total (k€)687,341.10366,964.67
Table 2. Income and operation costs of HPS 1, HPS 2 and HPS 3, considering a DTC of 8 h.
UPSH OperationHPS 1HPS 2HPS 3
Electricity generation income (k€ year−1)11,602.5522,222.6744,655.73
Electricity consumption costs (k€ year−1)5582.049642.4519,284.89
O&M (k€ year−1)464.10651.75961.79
Start-up costs (k€ year−1)202.88296.79417.47
Grid access tariff (k€ year−1)84.47148.27297.95
Hydraulic cannon (k€ year−1)278.51488.90982.43
Operating margin (k€ year−1)6047.6010,994.5222,711.22
Table 3. Profitability analysis of HPS 1, HPS 2 and HPS 3, considering the construction of new tunnels or caverns, DTCs of 8 h and a lifetime of 35 years.
EBIT and ProfitabilityHPS 1HPS 2HPS 3
EBIT (k€ year−1)554.851352.203335.28
NPV (k€)−41,570.22−65,194.66−118,307.90
IRR (%)2.43%2.61%2.75%
PB (years)252524
Table 4. Profitability analysis of HPS 1, HPS 2 and HPS 3, making use of existing infrastructure and considering DTCs of 8 h and a lifetime of 35 years.
EBIT and ProfitabilityHPS 1HPS 2HPS 3
EBIT (k€ year−1)3115.575847.6512,368.74
NPV (k€)44,614.7786,094.49185,702.73
IRR (%)6.66%6.90%7.10%
PB (years)151515
Table 5. Profitability analysis of HPS 1, HPS 2 and HPS 3, considering the construction of new tunnels, DTCs of 8 h and lifetimes of 50 and 75 years.
Lifetime50 Years75 Years
HPSHPS 1HPS 2HPS 3HPS 1HPS 2HPS 3
NPV (k€)−3017.074110.4023,617.8036,419.8174,753.03167,882.32
IRR (%)3.92%4.06%4.17%4.68%4.79%4.88%
PB (years)252525252525
Table 6. Profitability analysis of HPS 1, HPS 2 and HPS 3, making use of existing infrastructure and considering DTCs of 8 h and lifetimes of 50 and 75 years.
Lifetime50 Years75 Years
HPSHPS 1HPS 2HPS 3HPS 1HPS 2HPS 3
NPV (k€)83,167.91155,399.55327,628.43122,604.79226,042.18471,892.95
IRR (%)7.47%7.68%7.86%7.78%7.97%8.13%
PB (years)151515151515

