Article

Assessment of the Design for Manufacturability Using Fuzzy Logic

Faculty of Mechanical Engineering and Computer Science, University of Bielsko-Biala, Willowa 2, 43-309 Bielsko-Biała, Poland
*
Author to whom correspondence should be addressed.
Appl. Sci. 2020, 10(11), 3935; https://doi.org/10.3390/app10113935
Submission received: 19 April 2020 / Revised: 30 May 2020 / Accepted: 31 May 2020 / Published: 5 June 2020
(This article belongs to the Special Issue Design and Management of Manufacturing Systems)

Abstract

:

Featured Application

New method to assess design for manufacturability based on fuzzy variables.

Abstract

The study proposes a procedure for assessing the designed manufacturing process for a new products. The purpose of the developed procedure is to evaluate the production process from the point of view of product design manufacturability of a unit and the small-lot production process. Evaluation of the design for the production process of a new product is based on criteria like process performance efficiency. Fuzzy logic-based methods were used to assess the designed process at different stages of its implementation—processing, assembly and organization of production. The developed method was illustrated by an example. The method presented in the study may be used by designers of production processes and employees of companies involved in the rationalization of already implemented production processes. The proposed method applies specifically to small-lot and unit production.

1. Introduction

It can be assumed that the first practical examples of designing the structural form of the product components like the “design for assembly at that time were associated with the concept (PDM—product design merit)” activities can be seen in the early days of H. Ford around 1920. The plants began to produce at high-volumes, different products in several variants without any significant difficulties in the sales markets. In this period, the focus was mainly on the external appearance and functionality of the products rather than on the properties of their features in the technological and production processes. Development departments did not feel much pressure to apply appropriate activities related to the concept of “design for assembly—PDM” [1]. In the 1960s, a growing discrepancy between the obtained product quality parameters and growing customer requirements was noted in the United States [1]. An attempt was made to solve the problem by introducing additional design solutions. A temporary effect was obtained, the quality improved, but a significant increase in the production costs of the products resulted [2]. In the 1970s, global competition between enterprises grew significantly and increasing emphasis was placed on improving the competitiveness of production. High costs of designing and making the product were no longer acceptable. Much emphasis was put on the effectiveness of project management for the implementation of new products due to the significant impact of the designed manufacturing processes on the production costs [3].

2. Literature Review

Various methods of assembly support called DFX—design for X—has been developed and spread across industry methods such as QFD (quality function deployment) [4,5,6] used in the processes of implementing product customer requirements, FMEA (failure mode and effect analysis) [7]—related to the prediction and prevention of problems at the product design stage, DFA (design for assembly) [8,9,10]—e.g., design for manufacturing (DFM) regarding the shaping of the design process of components and the product itself [9,11,12,13,14,15]. Decisions made at the product design stage have a significant impact on production costs, efficiency and quality of production.
In the process of implementing the product, the impact of design on the cost of its implementation is very significant. The share of design costs varies around 5% of the costs of starting production of a new product but affects about 70% of the cost of the product after its implementation into production. While the rationalization activities of the production process at the production stage of the product (direct labor costs and indirect production costs often account for around 40% of the cost of the final product) affect only about 10% on the cost of production of the product [1,14,16]. This information is based on the US market cost structure. This means that the actions related to the changes in the production project (with relatively low costs incurred) in the right time have the greatest real impact on the production costs of the final product [1,15,17]. Swift [15] and others [1,7,18] analyzed the percentage of problems that occur in companies that have not performed and DFA activity during the product design development. For example, 35.9% had problems with the assembly of individual parts of the evaluated design. DFA methods have been selected to evaluate how their effects provide the greatest impact on manufacturing cost [1,14,15,19,20]. The DFA methods described in the literature and used in manufacturing practice were aimed at serial and mass product production [8,9,10,12,15,17,21]. There has been described in the latest scientific studies some of new DFA methods connected with CAD/CAM systems or Life Cycle assessment, some attempts to use fuzzy logic were also done however complete fuzzy DFA method for different kinds of production hasn’t been recognized in literature [18,21,22,23,24,25] thus the proposed method also opens to small-lot and unit production.
Considering the methods described in the literature, we chose to focus on the analysis of unit and small-series production. We also point out that a method is needed to evaluate the production process in a comprehensive way that takes care of machining, assembly and production organizations. The use of fuzzy logic is justified by the need to estimate data due to the lower availability of complex analytical tools in small businesses, development budgets and product testing are limited there and there may be no accurate data for the reasons listed above. The method developed is open and other or additional criteria may be considered according to the production conditions of the company concerned. It may also have been interesting to develop DFA methods in medical procedures and the medical industry [26,27,28,29,30]. Another area of interest is the processes of electrical and electronic components that have been rapidly developing in recent years [28,31,32].

3. Design Manufacturability Assessment in Terms of Unit and Low-Volume Production

3.1. Assumptions for the New Method Design for Manufacturability

The justification for the emergence of a new fuzzy method to assess the technology of the structure resulted from the observed lack of flexibility of the described methods of Boothroyd-Dewhurst and Lucas. These methods were created in the 1980s where there was demand in the economy and was focused on serial and mass production. The current development of the economy and technology means that the modern economic system is characterized by a much greater need for flexibility in terms of production methods: high volume, low volume and in units. The need to create a more flexible method which is adaptable to the type of production was noticeable [33].
The design process should be determined from the point of view of various usability criteria—Figure 1. The assessment should consider many other various factors, sales, service, spare parts availability, production series, types of equipment, available assembly techniques, level of automation, cooperative services, possibilities of application commercial components, crew technical culture, etc. In small-lot and serial production conditions, the design process for new product production was based on simplified production documentation. Due to the low production series, production data results from the project were rarely verified at the production stage, while the experience gained from this stage was used in the production projects of new products. Concerning mass production, particular attention from the point of view of cost criterion was paid to the possibility of using unified and standardized elements included in the final product, the use of work stations and workshop aids for processing and assembly of various elements included in the products making up the program production and introduction of group machining processes, process phases, group operations for various elements [34,35,36]. The newly proposed method using fuzzy inference was characterized by such flexibility. In the literature cited in the study [15,19,37,38,39,40] there has been lack of studies enabling in the absence or uncertain data to estimate the times of assembly operations. The developed method has the features of novelty and meets the needs of production practice.

3.2. The Course of the New Method Design for Manufacturability

In this study, there was a proposed new model of the product design analysis process which was carried out by experts representing: product design, machining process design, assembly process design, quality assurance, product cost analysis, OHS and environmental protection. Their inputs were assessed with the help of fuzzy sets methods following Figure 2. The assessment of the design manufacturability from the point of view of the assembly process was the first step followed by the machining process and production organization. According to experts, the order of assessment results from the size of the impact of the assessed design manufacturability on production efficiency. The feedback in the assessment activities results from the impact of decisions made in one stage on the other stage assessments.
Due to the costs of accurate analyses, there was less possibility to determine the performance parameters of the designed process in a unit, small-lot production due to unique, unstable and non-rhythmic production in the form of values, in the form of deterministic assessments. Therefore, fuzzy logic may be useful in such production conditions. Experts determine the fuzzy marks based on their own experience in the order given in Figure 2. The assessment was made on a scale of 0 to 100. Triangular symmetrical distributions were used for the assessments. The assessment method was presented below: when assessing, experts can be guided by their own production experience, they can also use data tables in the Boothroyd & Dewhurst and Lucas methods.
The assessment was related to the set of linguistic variables Vi = {V1, …, Vn} and ∊N—{0}, defining the input and output criteria of technology. The linguistic variable Vi was described by a quadruple:
[Li, Ti(L), Ωi, Mi]
where: Li = {L1, …, Ln}, i ∊N—{0}—set of linguistic variable names, Ti(Li) = {T1(L1), …, Tn(Ln)}, i ∊N—{0}—set of countable determinations of linguistic variables, tij = {t11, t12, …, tnm}, i, j ∊ N—{0}, tij ⸦ Ti (Li)—set of linguistic values of linguistic variables, Ωi = {Ω1, …, Ωn}, i∊N—{0}—set of linguistic ranges of variables Vi, Mi = {Mi, …, Mn}, i∊N—{0}—set of semantic rules, mij = {m11, m12, …, mmn}, and, j ∊ N—{0}, mij ⸦ Mi—range of variation in linguistic value tij with an assessment of belonging from 0 to 1 [41].
The assessment of the assembly process capability followed by the assessment of assembly technology and production organization corresponds to the stage of developing the project documentation of the product design. The applied variables V1, V2, V3, V4, V5, V6 in the scope of machining technologies, assembly, production organization are shown in Figure 2. The assessment, depending on the scope of information obtained, can be carried out for individual components of the product, groups of elements, its assemblies or also in a holistic way [41]. Sets of Vi variables can be modified and changed depending on the nature of the target process for which we design the product. This gives the fuzzy method a significant advantage in terms of flexibility. In the example presented, the set of variables Vi was prepared for medium-sized plant and small-lot production. It is illustrated by an example of one stage of the developed method to better illustrate the course of proceedings.
Variables that, in addition to deterministic values, can assume imprecise values—fuzzy. The triangular membership function can be defined using the following formula.
μ A ( x ) = {     0       d l a      x a   l u b   x c x a b a    d l a         a x b   c x c b    d l a         b x c  
where a, b and c are parameters meeting the condition a < b < c.
Figure 3: presents a graph of the membership function of a given Formula (1).
It was assumed that two input variables (×1 and ×2) and a single output variable (y) are related, respectively: {small, medium, large}, {short, medium, long} and {bad, medium, good}. What can be presented in the form of language rules:
  • R1W IF X1 is small and X2 is short, THEN Y is bad; also
  • R2W IF X1 is small and X2 is medium, then Y is bad, too
  • R3W IF X1 is medium and X2 is short, THEN Y is medium; also
  • R4W IF X1 is large and X2 is medium, THEN Y is medium; also
  • R5W IF X1 is large and X2 is long and Y is good
The rules can be presented in the decision table (Table 1) whereas, an example of a fuzzy partition is shown in Figure 4.
We perform calculations for the values of V1, Vi + 1 by reading the values from the graphs in Figure 3 and Figure 4, according to the inference rule “min” specific rules were activated on the basis of which we set conclusions for the selected component that we evaluate. The next stage was the aggregation of conclusions, we should activate the selected rules for the selected component. In Mamdani’s inference, which we use, there was a maximum operation as an operator of the aggregation of inference results obtained based on individual rules. For low average technology (range <0; 60>), the conclusion assumes a min value (0.67; medium technology)—lower value 0.67 or the value of the function, medium low technology. Fuzzy logic means that in the process of fuzzification, each rule was given a certain fuzzy value and must then be converted back to the real value, for this purpose we have defuzzification. In the work for defuzzification, a center of gravity method was proposed, which serves to sharpen the resulting fuzzy set and consists in determining the value of y *, which was the center of gravity of the area under the curve μwyn (y).
The Mamdani processing structure of fuzzy set inference methods consist of the following five elements:
  • Input scaling, which transforms parameter values, enter variables from its domain to the one in which the input fuzzy partitions were defined;
  • A fuzzy interface that converts explicit input into fuzzy values that serve as input to the fuzzy inference process;
  • An inference engine that extracts data from blurred input data into several resulting fuzzy sets according to the information stored in the knowledge base;
  • Defuzzification interface that converts fuzzy sets received from the inference process into a clear value;
  • Output scaling that converts the defragmented value from the output domain of the fuzzy areas to the output variables, creating a global result of the fuzzy set inference method.
The reference model of the project was of the type: multiple inputs—multiple outputs MIMO. To compile results according to the above MATLAB software was used for the model.
The proposed DFA model of conduct based on fuzzy logic and the use of multiple entries—fuzzy rules (Figure 5) and multiple outputs enables efficient operation also in small-lot production conditions when there was no data from design verification by building many versions of prototypes and testing subsequent assumptions and design effects.

4. Implementation

4.1. Input Assumptions

Based on the analysis of the above methods of assessing the product’s producibility, an improved proprietary approach was proposed in the process to shape the product’s productiveness. The illustration of the presented proposals is presented on the example of a single-stage gear in Figure 6. General purpose gearboxes are designed in the form of a series of types from the point of view of market demand, production costs and delivery time to the customer. The gearbox is shown in Figure 6 was designed in a traditional way (welded body, many bolted joints, etc.).
A manufacturability analysis of the design was carried out for the adopted criteria presented in Figure 7. To illustrate the progress of the procedure in the method, the method of assessing the technological efficiency of the structure is more widely presented, on the example of the assembly of two elements—the gear housing and cover.

4.2. Assembly Manufacturability Fuzzy Assessment

The assessment was carried out in three substages—substage 1 (access, number of workshop aids), substage 2 (orientation, maneuverability), substage 3 (assemblability, processes).

4.2.1. Assembly Manufacturability Assessment—Substage 1

It was assumed that the assembly technology of the considered elements depends on two factors, which were: accessibility, number of workshop aids. The experts determined the ocean for the parameter “Access” = 20, “number of workshop aids” = 55. The functions of belonging linguistic variables for the given factors are given in Table 2 and Table 3, the bases of rules for them are presented in Table 4 and Table 5.
The “Access” factor is described by formulas:
μ V E R Y   H A R D ( x ) = {   30 x 30 0   d l a   0 < x < 30        x = 0    d l a   30   x   100
μ R E S T R I C T E D ( x ) = { x 30 0   d l a   0 < x < 30      60 x 60 30   d l a   30 < x < 60        x = 0     d l a   60   x   100
μ   M E D I U M   R E S T R I C T E D ( x ) = {     x = 0    d l a   x   30       x 30 60 30   d l a   30 < x < 60 100 x 100 60   d l a   60 < x < 100  
  μ E A S Y ( x ) = {   x = 0    d l a     x   60   x 60 100 60   d l a   60 < x < 100  
The fuzzy rules for assembly technology are presented in Table 6.
In order to make the method compared with traditional methods transparent, the evaluations and results were scaled. The best theoretical value for the design feasibility of the structure maybe 100. After scaling, this rating may have a maximum value of 1.00. The assessments of the efficiency according to the new method will be equal to x/100 where x was the given assessment of the structure’s efficiency. For the body, for the values “access” = 20 and “number of workshop aids” = 55 based on Figure 8, according to the above-mentioned inference rule “min”, the following rules were active:
-
Rule 14 Access “very difficult” and number of workshop aids “heavy or equipment” in the degree of min (0.33, 0.17) = 0.17 (low technology);
-
Rule 15 Access “very difficult” and number of workshop aids “require orientation” in the degree of min (0.33, 0.833) = 0.33 (medium low technology);
-
Rule 10 “limited” access and number of workshop aids “heavy or equipment” in the degree of min (0.67, 0.17) = 0.17 (medium low technology);
-
Rule 11 ‘limited’ access and number of workshop aids ‘require orientation’ in the degree of min (0.67, 0.833) = 0.67 (medium technology).
The practical approach of aggregation of rules was that for example for Rule 11 for values 20 and 55 calculated value 0.67 defines surface area under function “medium on Figure 9. After taking into account rules 10, 11, 14 and 15, in Mamdani’s inference there was a maximum operation as an operator of the aggregation of inference results obtained on the basis of individual rules, therefore rules 10 and 15 which have the same “medium low” rating, we choose MAX so we activate rule 15. Hence, activated were rules 11,14,15. Complete aggregated values for assembly technology in substep 1 are given in Figure 8.
The next step was defuzzification (sharpening) of the parameter value to provide the predicted factor value. The basis of this step was the resulting membership function represented in a fuzzy form, while the inference should end with providing a specific numerical value, hence the need to sharpen. Various methods can be used to carry out this process: center of gravity, average maximum, first maximum, last maximum. The center of gravity method was selected:
{ y = x 20   y = 0.17   ;   0.17 = x 20 ;   x = 20 · 0.17 = 3.4
{ y = x 20   y = 0.33   ;   0.33 = x 20 ;   x = 20 · 0.33 = 6.6
{     y = 80 x 80 60   y = 0.67   ;   0.67 = 80 x 20 ;   x = 80 13.4 = 66.6
{   y = x 20 40 20   y = 0.33 ;   0.33 = x 20 20 ;   x = 20 · 0.33 + 20 = 26.6
{   y = x 20 40 20   y = 0.67 ;   0.67 = x 20 20 ;   x = 20 · 0.67 + 20 = 33.4
Defuzzied center of gravity value:
r = r 1 r 2 = 0 80 y · µ B ( y ) d y 0 80 µ B ( y ) d y
r = + 3.4 6.6 y · y 20   d y + 26.6 33.4 y · y 20 20   d y + 6.6 26.6 y · 0.33   d y + 33.4 66.6 y · 0.67   d y + 66.6 80 y · 80 y 20   d y 0 80 µ B ( y ) d y
where:
r 1 = [ y 2 12 ]   0 3.4 + [ y 3 60 ]   3.4 6.6 + [ y 2 6 ]   6.6 26.6 + [ 1 20 · ( y 2 3 10 y 2 ) ]   26.6 33.4 + [ y 2 3 ]   33.4 66.6 + [ 1 20 · ( 40 y 2 y 2 3 ) ]   66.6 80
r 1 = 0.96 + 4.14 + 110.67 + 103.31 + 1106.67 + 319.02 = 1644.76 r 2 = 0 80 µ B ( y ) d y = P 1 + P 2 + P 3
P 1 = ( 6.6 0 ) · 0.17 = 1.1 ;   P 2 = ( 20 0 ) · 0.33 = 6.6 ;   P 3 = [ 60 + 33.2 ] · 0.67 2 = 31.22 r 2 = 0 80 µ B ( y ) d y = 1.1 + 6.6 + 31.22 = 38.9
r = 1644.76 38.9 = 42.2
The assessment of technology for the 1st stage assumes for the adopted access assessment-20 and the number of workshop aids-55. The value of ~42.20 was determined.

4.2.2. Assembly Manufacturability Assessment—Substage 2

The component’s technology is determined, assuming that it depends on two factors, which were: orientation, maneuverability. The functions of belonging linguistic variables for the given factors are given in Table 7 and Table 8, the bases of rules for them are presented in Table 9 and Table 10. The expert group made the following assessment: orientation—10, maneuverability—35.
Aggregation of rules for assembly technology 2 is shown in Figure 9.
The technological assessment for the 2nd stage assumes for the adopted assessment of orientation—10 and maneuverability—35. The value equal to −31.0 was determined.

4.2.3. Assembly Manufacturability Assessment—Substage 3

The technology of the 3rd component was determined, assuming that it depends on two factors, which were: assembly, processes. The functions of belonging linguistic variables for the given factors are given in Table 11 and Table 12. The expert group made the following assessment: assemblability = 20, joining processes = 35.
Aggregation of rules for assembly technology 3 is shown in Figure 10.
The technological assessment for the 3rd stage was assumed for the accepted assessment of assemblability—70 and joining processes—10. The value equal to −36.0 was determined.

4.3. Fuzzy Assessment of Design for Machinability—for Example

To decrease the number of components of a product may increase its complexity and increase its manufacturing costs. The final product can be easy to assemble and expensive to process its components.
The condition for the correct determination of the cost-related factors involved in the production process of a given element was information about the characteristics that this element has from the point of view of construction, production and organization of production. The main task that must be performed was to determine the value of the costs of implementing individual operations. The cost of product processing and organization of production includes material costs, costs of cooperation and processing of a given operation. Classification of elements should include its type, e.g., shaft, sleeve, specify dimensions, the accuracy of workmanship, etc. Based on technological similarity, the costs of individual operations can be determined in accordance with the data in the database of costs of operation of technologically closest components [36,39,42].
The assessment was based on a multi-level classification of elements, assemblies made in the enterprise, etc. (Figure 11). The new element was assigned to a given shape representative based on the designer’s decision—Figure 12 and Figure 13. Based on the shape and design parameters from the manufacturing processes database, the process of the element with the same shape code and parameters most like the parameters of the new element was searched. Having the process of manufacturing the nearest element at your disposal and data on the value of cost factors in connection with the time and then cost calculation system, you can specify the production costs of the designed element [34,36,42].
Result of aggregation of rules for design for machining manufacturability 1 calculated as center of gravity of the surface under the curve presented in Figure 14—design for machining manufacturability 1 assessment for Substep 1 was 29.9.
The design for machining processing 2 assessment was determined in a similar procedure: tool machining capability V3 = 10, compliance requirements V4 = 35. Results of aggregation of rules for design for machining manufacturability 2 calculated as center of gravity of the surface under the curve are presented in Figure 15—the design for machining technology—machining processing assessment for substep 2 was 30.6.
The design for machining processing 3 assessment was determined in the same procedure: Energy consumption V5 = 70, waste, environmental aspects V6 = 10. Aggregation of rules for design for machining manufacturability 3 calculated as center of gravity of the surface under the curve presented in Figure 16—design for machining technology—machining processing assessment for substep 3 was 36.

4.4. Fuzzy Assessment of the Design for a Manufacturing Organization

In the next step called assessment of design for manufacturing organization 1 we perform calculations for the values of V1 and V2 by reading the values from the relevant graphs as Figure 14 and Figure 15, according to the inference rule “min” specific rules were activated on the basis of which we set conclusions for the selected component that we evaluate. It depends on two factors, which were: number of components and the possibility of group processing, experts have determined the rating as Number of components V1 = 20, the possibility of group processing V2 = 20. The result of aggregation of rules for design for manufacturing organization 1 calculated as center of gravity of the surface under the curve design for manufacturing organization 1 was 40 (Figure 17).
The design for manufacturing organization 2 assessment was determined in similar procedure. It depends on two factors, which were: component normalization V3 = 20, target cost V4 = 55.
Aggregation of rules for design for manufacturing organization 2 calculated as center of gravity of the surface under curve presented in Figure 18—design for manufacturing organization 2 was 31. design for manufacturing organization 3 assessment was determined in a similar procedure. It depends on two factors: quality of assembly V5 = 70, reuse components V6 = 10.
Aggregation of rules for design for manufacturing organization 3 calculated as center of gravity of the surface under curve presented in Figure 19—design for manufacturing organization 3 was 36.

4.5. A Fuzzy Assessment of Design for Technology

A complete fuzzy analysis of the technology was carried out in the same stages as for the sample “body” component presented in previous chapters using MATLAB software. Each component of the analyzed transmission was assessed by a group of experts according to their best knowledge in the field of technology, organizational and cost options. Expert assessments were entered in Table 13 and were used in subsequent stages as input to fuzzy analyses. The stages of the analysis were identical to those presented in Figure 3. Calculations of the fuzzy technology assessment method were made using the fuzzy logic toolbox package, which is an addition to the MATLAB program. In the MATLAB FIS editor window, the number of entries and exits is defined and given a name. In this case, two inputs were specified in each step, for example, technological capabilities V1, software capability V2 and one output—The design for machining manufacturability 1. The logical method I (And), logical OR (Or), type of implication, type of aggregation (Aggregation), sharpening method (Defuzzification) were also defined. The analysis selected a uniform representation of the membership function. It can be obtained by using a membership function with a uniform shape and parametric definition of the function. In the case of the assessment of technology, triangular and trapezoidal functions were used.
It should be added that the parametric description of the triangular membership function is the most economical, it only requires three parameters, which are important in practical applications of the method in small lot production industry. After determining the membership sets, one should proceed to the next step of fuzzy analysis of manufacturability. It is creating a set of linguistic rules representing the relationships between system variables. The rules are the heart of the entire regulator. In MATLAB, the next part of the FIS editor is used—Rule Editor. Entered rules can be edited in several different ways. Rule Editor uses the words if, and, or, then, which are the closest to natural language. The final step is to read sharp results using “Rule viewer” or graphical explanation using “Surface viewer”.
“Surface viewer” and its graphs—surface charts are additional tools useful in the assessment of construction. With the help of such charts, we can quickly obtain the result of the Technology component without the need for complex calculations. In the chart below “Assembly technology 1” if, for example, the “Access” and the “number of workshop aids” rating would change from (0.55, 0.2)—point A to (0.75, 0.8)—point B, then from the surface chart in Figure 20 we can read the value of Assembly technology 1 at the level of 0.6. In the process of selecting variants to improve the technology, this is a very useful tool that allows you to quickly assess how potential product changes can affect the result of the technology.
For each of the components, calculations were made using the above scheme MATLAB R2017b—the “fuzzy logic designer” module. The development of an approximate representation of knowledge and fuzzy inference methods enables the construction of models for assessing technology to support decision making in conditions of uncertainty and lack of complete information about the problems being solved. Premises and conclusions in these systems were developed using fuzzy logic elements. The knowledge contained in the system should come mainly from a field expert and the effectiveness and efficiency of the system operation depend mainly on the ability to model this knowledge by the system designer. The elements of fuzzy logic presented in the article were used in solving tasks in the field of technological preparation of production. An important problem was the correct definition of fuzzy sets by determining for them the course of belonging functions. [source-fuzzy logic toolbox—user’s guide]
Table 14 presents a summary of the results of individual components obtained in the fuzzy transmission analysis. An acceptability criterion of 0.55 was adopted for each component (modeled on the recommendations of the Lucas method and other DFA methods as well as the opinions of experts from industrial practice), elements of lower value should be redesigned. The following transmission components need to be redesigned as a result of the above assessment: body, cover, breather, oil level indicator, covers, additional processes, nameplate, shaft assembly and inlets. Elements rated as not requiring redesign were gears, bearings, washers, screws.
Expert assessments mentioned above are shown in Table 13—those values were used as input to fuzzy analyze conducted in MATLAB—“fuzzy logic designer” module. The results are shown in Table 14.

5. Results and Discussion

In the study, the indicators of the assessment of the manufacturability of the structure were determined for the sample product presented in Figure 6. As a result of the analysis after the proposed changes, the new form of the gear structure change is illustrated in Figure 21.
The study cites a comparison of new and currently used in mass production methods of construction technology in Table 15 and Figure 22 which presents the values of the indicators according to the traditional methods and the newly proposed method.
The comparison should read that the lower the score, the more you need to redesign/reduce the product design. From the comparison of the assessment, it can be concluded that the Boothroyd-Dewhurst method is the most stringent and focused on reducing/simplifying the details of the project components. At the same time, in the case of production which is not qualified for high-volume production, the result of such an assessment may be a product with a small number of components, but in a very complicated form and therefore will have a high cost of processing, quality and others in the field of production organization. However, the new fuzzy method, because it takes into account the treatment and its limitations and the index of production organization in which it directs the result towards small-lot production gives the least result which improves the technological efficiency of this sub-assembly for the assumptions of the model of fuzzy small-lot production.
The result of a single method does not give a picture of effectiveness nor a new fuzzy method. For this purpose, a comparison of a selected transmission fragment of the new method and existing methods was carried out. The selected fragment in the form of a drive shaft assembly and was compared in Table 3 from the overall assessment of the transmission. Comparisons show that for small lot production assessment B&D with 0.3 results, Lucas with 0.24 results, versus fuzzy defined for a small lot with 0.53 results, was a less restrictive approach of Fuzzy method. This was very important as small lot production usually has much less capital available.
The comparison should be read as follows, the lower the score, the more you need to redesign/reduce the product design. From the comparison of the assessment, it can be concluded that the Boothroyd & Dewhurst method was the most stringent and focused on reduce/simplify the components of the project. At the same time, in the case of production not qualified for high-volume production, the result of such assessment may be a product with a small number of components, but a very complicated form and therefore a high cost of processing and quality and other in the field of production organization. The Lucas method in a more balanced way assesses the above project, but the difference from Boothroyd-Dewhurst is not large, which means that it will also work best in mass production.

6. Conclusions and Comments

In this study, we have focused on the assessment of gearbox using a new developed fuzzy method and compared it to the most known Boothroyd and Lucas DFA methods. The purpose was to assess gearbox development for small lot production, propose design changes and evaluate its design. This was very important as small lot production usually has much less capital available. The method developed is open and other or additional criteria may be considered according to the production conditions of the company concerned.
The fuzzy method was more tuned to this volume level of process and it was an advantage of this method in comparison to other methods that were more suitable for only mass production. The flexibility of this method was one of the aims of creating it.
In standard technology analysis, according to B&D and Lucas DFA, this was associated with a reduction in the number of components that have no significant effect on the product functions which results in an improvement in terms of assembly time and costs. In the traditional arrangement, of the above mentioned the methods, they were oriented towards mass production.
The proposed proprietary method based on the analysis of the obtained values of the parameters of the assessment of the efficiency of the entire process enables:
-
Considering—in addition to assembly—many other various factors, for example, availability of spare parts, production seriality, production conditions in the form of equipment types, available assembly techniques, level of automation, the scope of external cooperation orders
-
The method can be used for smaller series of manufactured products;
-
Assessment of technology in the form of given indicators and coefficients should be carried out by experts with extensive production experience;
-
Arousing designers’ creativity when designing new products, rationalizing work at the stage of improving and expanding the range of implemented production.
The presented method is universal. The use of fuzzy logic allows expressing incomplete and uncertain information in natural language, in a simple way for humans based on expert knowledge and empirical data. The method considers the analysis of the production process in a holistic way.

Author Contributions

Conceptualization, J.M., T.S. and A.M.; data curation, T.S.; formal analysis, J.M., T.S. and A.M.; funding acquisition, J.M.; methodology, J.M.; resources, J.M., T.S. and A.M.; software, T.S.; validation, A.M.; visualization, A.M.; writing—original draft, J.M., T.S. and A.M.; writing—review and editing, J.M., T.S. and A.M. All authors have read and agreed to the published version of the manuscript.
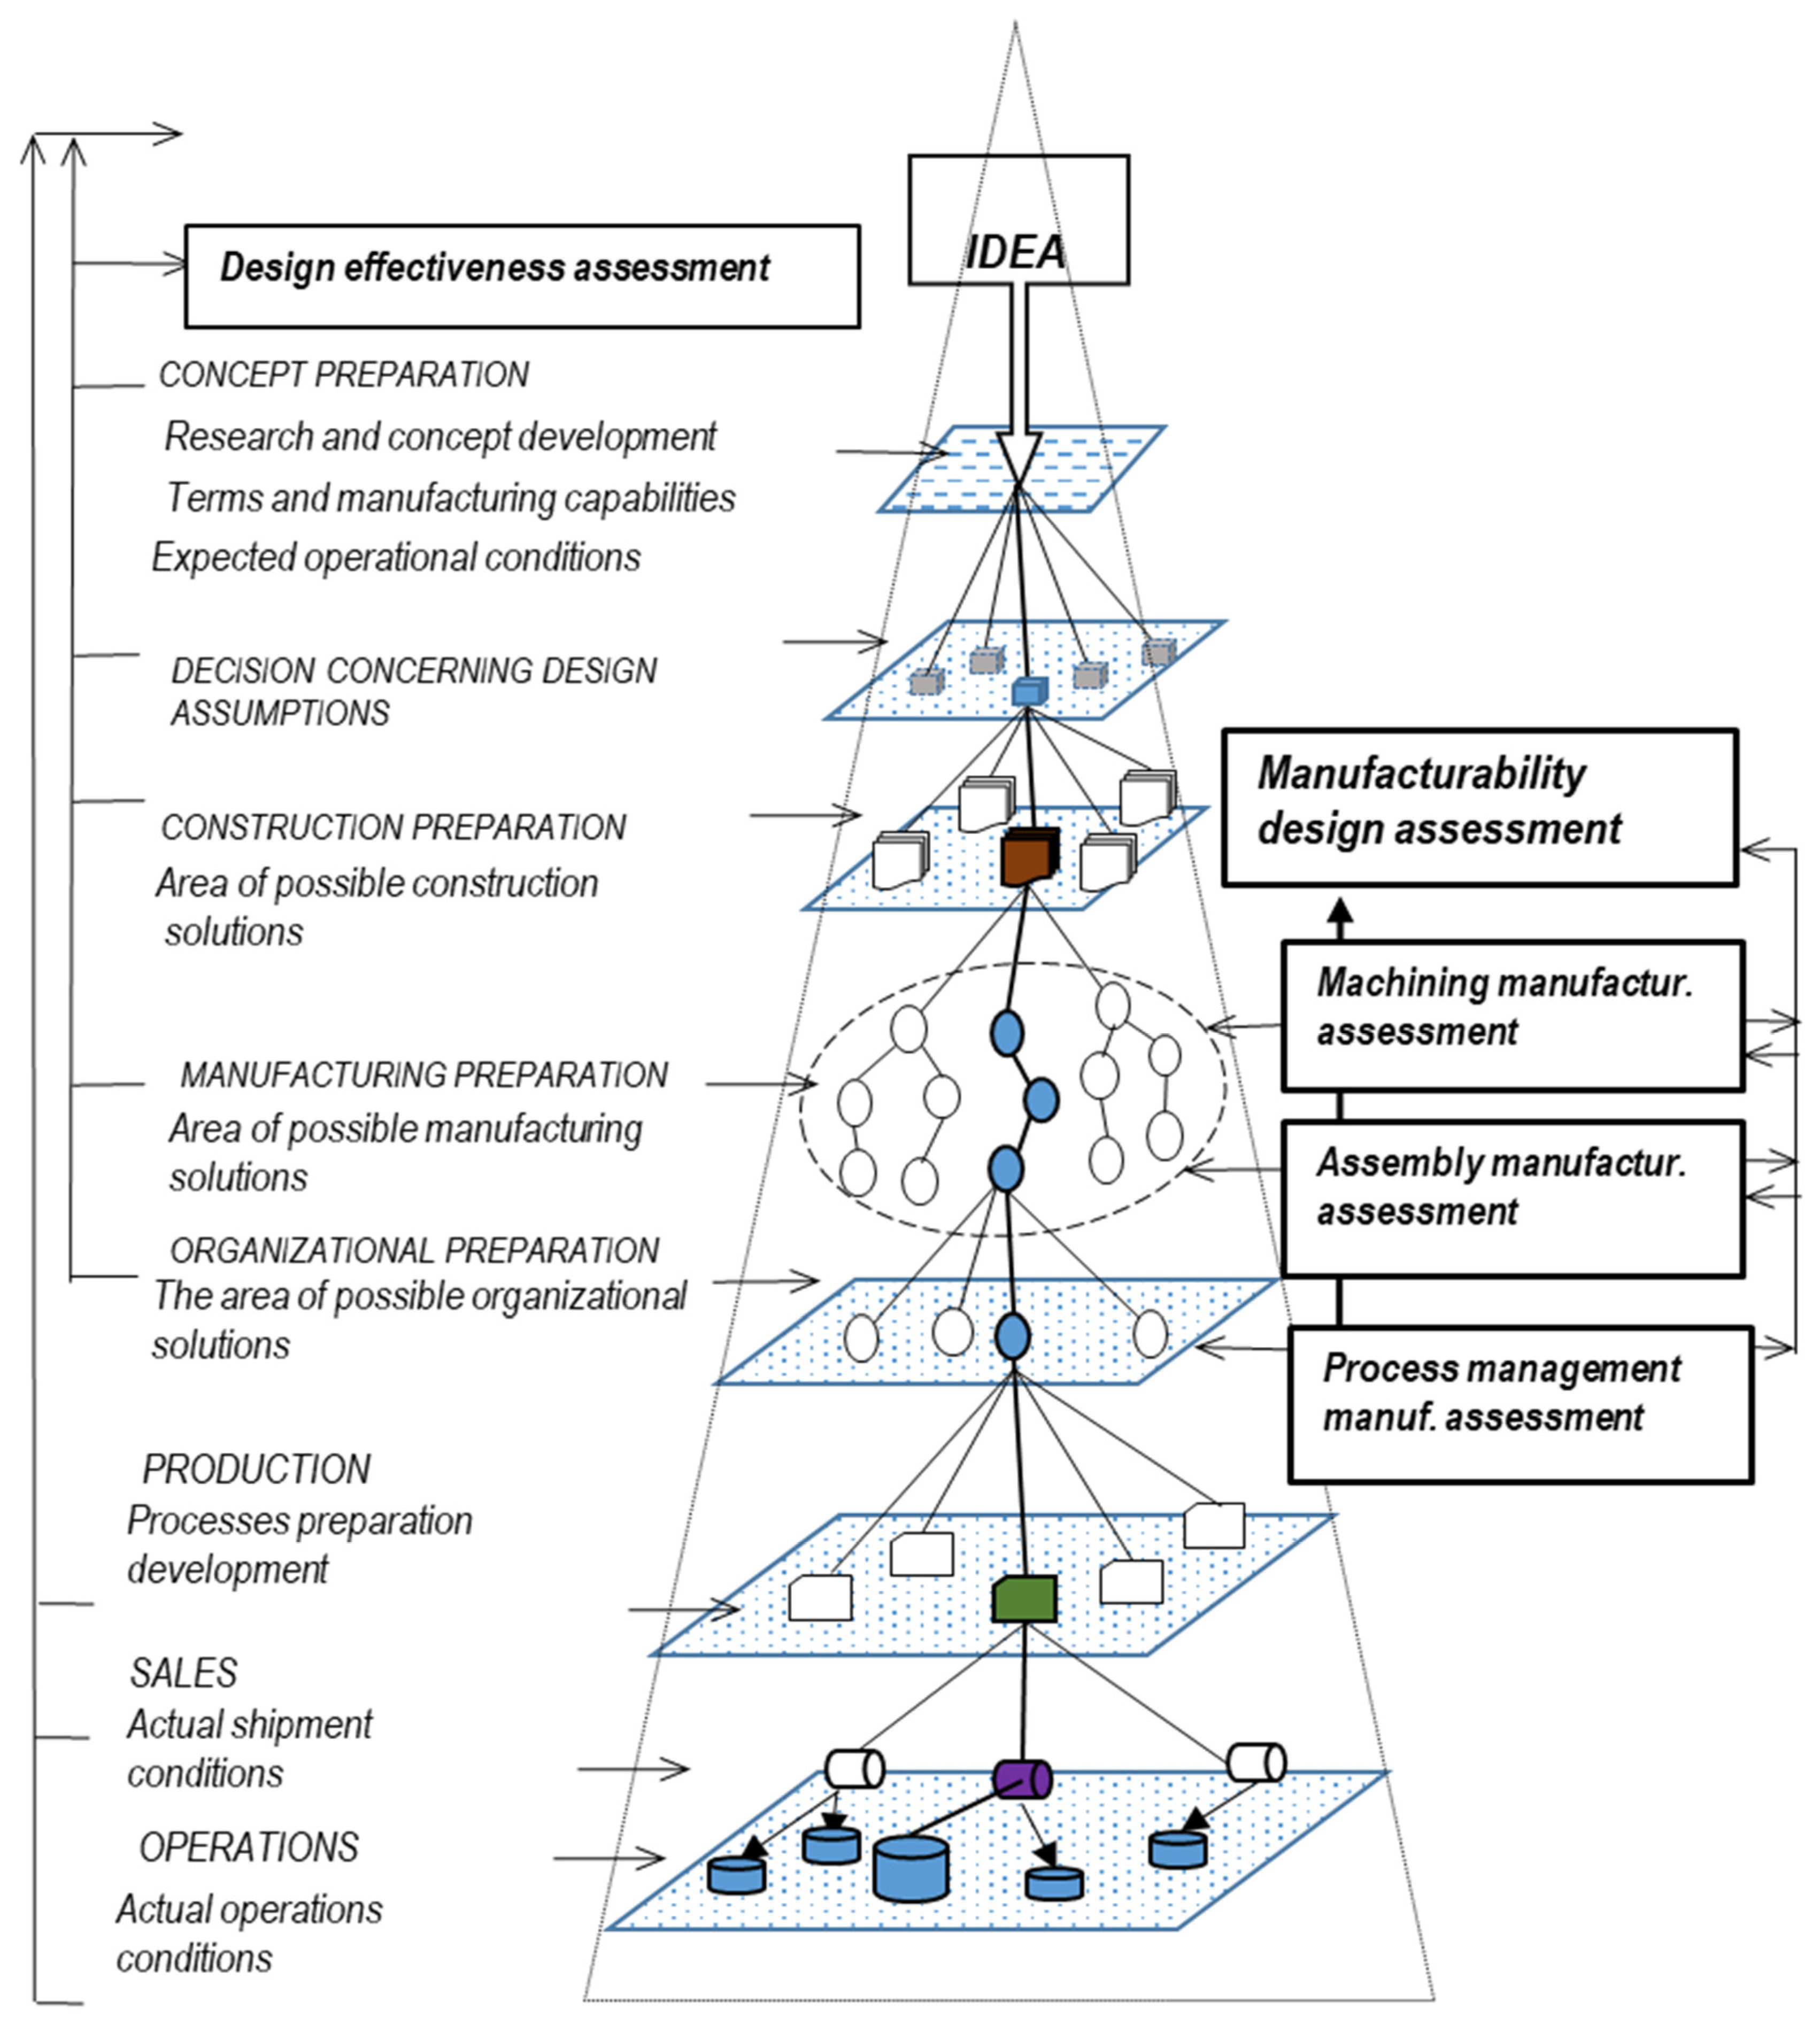
Funding

This research has received no external funding.

Conflicts of Interest

The authors declare no conflict of interest.

References

  1. Zorowski, C.F. PDM—A product assemblability merit analysis tool. In Proceedings of the Design Engineering Technical Conference, Columbus, OH, USA, 5–8 October 1986; pp. 5–8. [Google Scholar]
  2. Barnes, C.J. A Methodology for the Concurrent Design of Products and Their Assembly Sequence; Cranfield University: Cranfield, UK, 1999; p. 27. [Google Scholar]
  3. Gupta, P.; Trusko, B.E. Global Innovation Science Handbook; McGraw Hill Professional: New York, NY, USA, 2014; ISBN 0071834745. [Google Scholar]
  4. Akao, Y. Quality Function Deployment (QFD). Integrating Customer Requirements into Product Design; Productivity Press: Cambridge, UK, 1990; Volume 369. [Google Scholar]
  5. Evans, J.R.; Lindsay, W. The Management and Control of Quality; South-Western College: Chula Vista, CA, USA, 1999. [Google Scholar]
  6. Kehoe, D. Acceptance Sampling. //The Fundamentals of Quality Management; Springer: Dordrecht, The Netherlands, 1996; pp. 226–227. [Google Scholar]
  7. Palady, P.; Olyai, I. The status quo’s failure in problem-solving. Qual. Prog. 2002, 35, 34–39. [Google Scholar]
  8. Fayaz, M.; Ullah, I.; Kim, D.H. Underground risk index assessment and prediction using a simplified hierarchical fuzzy logic model and Kalman filter. Processes 2018, 6, 103. [Google Scholar] [CrossRef] [Green Version]
  9. Miles, B.L. Design for Assembly—A key element within Design for Manufacture. Proc. Inst. Mech. Eng. 1989, 1, 29–38, ISSN 0954-4070. [Google Scholar] [CrossRef]
  10. Yang, K.I.; El-Haik, B.S. Design for Six Sigma; Mcgraw-Hill: New York, NY, USA, 2003; pp. 184–186. [Google Scholar]
  11. Andreasen, M.M.; Kähler, S. Lund Design for Assembly; Ifs: Lund, Sweden, 1988. [Google Scholar]
  12. Boothroyd, G. Product Design for Manufacture and Assembly. Computer-Aided Design; Elsevier: Amsterdam, The Netherlands, 1994; Volume 26, pp. 505–520. [Google Scholar]
  13. Lock Project Management, 9th ed.; Gower Publishing Ltd.: Hampshire, UK, 2009.
  14. Sarwar, B.; Bajwa, I.S.; Ramzan, S.; Ramzan, B.; Kausar, M. Design and application of fuzzy logic based fire monitoring and warning systems for smart buildings. Symmetry 2018, 10, 615. [Google Scholar] [CrossRef] [Green Version]
  15. Swift, K.G.; Booker, J.D. Process Selection, from Design to Manufacture; Butterworth-Heinemann: Oxford, UK, 2003; ISBN 978–0–7506–5437-1. [Google Scholar]
  16. More, N.K.; Buktar, R.B.; Ali, S.M.; Samant, S. Design for Manufacture and Assembly (DFMA) Analysis of Burring Tool Assembly. Int. Res. J. Eng. Technol. 2015, 2, 2395-56. [Google Scholar]
  17. Chu, W.S.; Kim, M.S.; Jang, K.H.; Song, J.H.; Rodrigue, H.; Chun, D.M.; Min, S. From design for manufacturing (DFM) to manufacturing for design (MFD) via hybrid manufacturing and smart factory: A review and perspective of paradigm shift. Int. J. Precis. Eng. Manuf. Green Technol. 2016, 3, 209–222. [Google Scholar] [CrossRef]
  18. Bouissiere, F.; Cuiller, C.; Dereux, P.E.; Malchair, C.; Favi, C.; Formentini, G. Conceptual Design for Assembly in the aerospace industry: A method to assess manufacturing and assembly aspects of product architectures. In Proceedings of the Design Society: International Conference on Engineering Design, Delft, The Netherlands, 5–8 August 2019; Cambridge University Press: Cambridge, UK, 2019; Volume 1, pp. 2961–2970. [Google Scholar]
  19. Matuszek, J.; Seneta, T. Algorithmization of new product process implementation in terms of mass production. Mechanik 2016, 7, 755–757. [Google Scholar] [CrossRef] [Green Version]
  20. Matuszek, J. Process Engineering; Publisher Technical University of Lodz Branch Bielsko-Biala: Bielsko-Biala, Poland, 2000. [Google Scholar]
  21. Zhang, H.; Han, X.; Li, R.; Qin, S.; Ding, G.; Yan, K. A new conceptual design method to support rapid and effective mapping from product design specification to concept design. Int. J. Adv. Manuf. Technol. 2016, 87, 2375–2389. [Google Scholar] [CrossRef] [Green Version]
  22. El Wakil, S.D. Processes and Design for Manufacturing; CRC Press: Boca Raton, FL, USA, 2019; ISBN 978-1-138-58108-1. [Google Scholar]
  23. Favi, C.; Germani, M.; Mandolini, M. Development of complex products and production strategies using a multi-objective conceptual design approach. Int. J. Adv. Manuf. Technol. 2017, 95, 1281–1291. [Google Scholar] [CrossRef]
  24. Konnikov, E.A.; Konnikova, O.A.; Rodionov, D.G. Impact of 3D-Printing Technologies on the Transformation of Industrial Production in the Arctic Zone. Resources 2019, 8, 20. [Google Scholar] [CrossRef] [Green Version]
  25. Suhariyanto, T.T.; Wahab, D.A.; Rahman, M.N.A. Product design evaluation using life cycle assessment and design for Assembly: A case study of a water leakage alarm. Sustainability 2018, 10, 2821. [Google Scholar] [CrossRef] [Green Version]
  26. Chung, P.-H.; Ma, D.-M.; Shiau, J.-K. Design, Manufacturing, and Flight Testing of an Experimental Flying Wing UAV. Appl. Sci. 2019, 9, 3043. [Google Scholar] [CrossRef] [Green Version]
  27. Francia, D.; Ponti, S.; Frizziero, L.; Liverani, A. Virtual Mechanical Product Disassembly Sequences Based on Disassembly Order Graphs and Time Measurement Units. Appl. Sci. 2019, 9, 3638. [Google Scholar] [CrossRef] [Green Version]
  28. Gielisch, C.; Fritz, K.-P.; Noack, A.; Zimmermann, A. A Product Development Approach in the Field of Micro-Assembly with Emphasis on Conceptual Design. Appl. Sci. 2019, 9, 1920. [Google Scholar] [CrossRef] [Green Version]
  29. Han, C.; Sin, I.; Kwon, H.; Park, S. The Role of the Process and Design Variables in Improving the Performance of Heat Exchanger Tube Expansion. Appl. Sci. 2018, 8, 756. [Google Scholar] [CrossRef] [Green Version]
  30. Kim, Y.-J.; Heo, J.-Y.; Hong, K.-H.; Hoseok, I.; Lim, B.-Y.; Lee, C.-S. Computer-Aided Design and Manufacturing Technology for Identification of Optimal Nuss Procedure and Fabrication of Patient-Specific Nuss Bar for Minimally Invasive Surgery of Pectus Excavatum. Appl. Sci. 2019, 9, 42. [Google Scholar] [CrossRef] [Green Version]
  31. Ding, K.; Avrutin, V.; Izyumskaya, N.; Özgür, Ü.; Morkoç, H. Micro-LEDs, a Manufacturability Perspective. Appl. Sci. 2019, 9, 1206. [Google Scholar] [CrossRef] [Green Version]
  32. Rivera, C.A.; Poza, J.; Ugalde, G.; Almandoz, G. A Requirement Engineering Framework for Electric Motors Development. Appl. Sci. 2018, 8, 2391. [Google Scholar] [CrossRef] [Green Version]
  33. Boothroyd, G.; Dewhurst, P. Design for Assembly: A Designers Handbook; University of Massachusetts: Amherst, MA, USA, 1983. [Google Scholar]
  34. Herrmann, J.W.; Cooper, J.; Gupta, S.K.; Hayes, C.C.; Ishii, K.; Kazmer, D.; Wood, W.H. New directions in design for manufacturing. In Proceedings of the ASME 2004 International Design Engineering Technical Conferences and Computers and Information in Engineering Conference, American Society of Mechanical Engineers Digital Collection, Salt Lake City, UT, USA, 28 September–2 October 2004; pp. 853–861. [Google Scholar] [CrossRef]
  35. Relich, M.; Świc, A.; Gola, A.A. Knowledge-Based Approach to Product Concept Screening. In Proceedings of the Distributed Computing and Artificial Intelligence, 12th International Conference, Advances in Intelligent Systems and Computing, Salamanca, Spain, 3–5 June 2015; Omatu, S., Malluhi, Q.M., González, S.R., Bocewicz, G., Bucciarelli, E., Giulioni, G., Iqba, F., Eds.; Springer: Cham, Switzerland, 2015; Volume 373. [Google Scholar]
  36. Thekinen, J.; Panchal, J.H. Resource allocation in cloud-based design and manufacturing: A mechanism design approach. J. Manuf. Syst. 2017, 43, 327–338. [Google Scholar] [CrossRef]
  37. Gebisa, A.W.; Lemu, H.G. Design for manufacturing to design for Additive Manufacturing: Analysis of implications for design optimality and product sustainability. Procedia Manuf. 2017, 13, 724–731. [Google Scholar] [CrossRef]
  38. Mehta, M. Holistic Consideration of Best Practices in Product Design, Quality, and Manufacturing Process Improvement through Design for Value; American Society for Engineering Education: Atlanta, GA, USA, 2013. [Google Scholar]
  39. Shetty, D.; Ali, A. A new design tool for DFA/DFD based on rating factors. Assem. Autom. 2015, 35, 348–357. [Google Scholar] [CrossRef]
  40. Whitney, D.E. Mechanical Assemblies—Their Design Manufacture and Role in Product Development; Oxford University Press: Oxford, UK, 2004. [Google Scholar]
  41. Kacprzyk, J.; Pedrycz, W. (Eds.) Springer Handbook of Computational Intelligence; Springer: Dordrecht, The Netherlands; Heidelberg, Germany; London, UK; New York, NY, USA, 2015. [Google Scholar]
  42. Corsini, L.; Moultrie, J. An exploratory study into the impact of new digital design and manufacturing tools on the design process. In DS 87-2 Proceedings of the 21st International Conference on Engineering Design (ICED 17) Vol 2: Design Processes, Design Organization and Management, Vancouver, BC, Canada, 21–25 August 2017; pp. 21–30, ISBN 978-1-904670-90-2. [Google Scholar]
Figure 1. Modified design and development process to produce a new product.
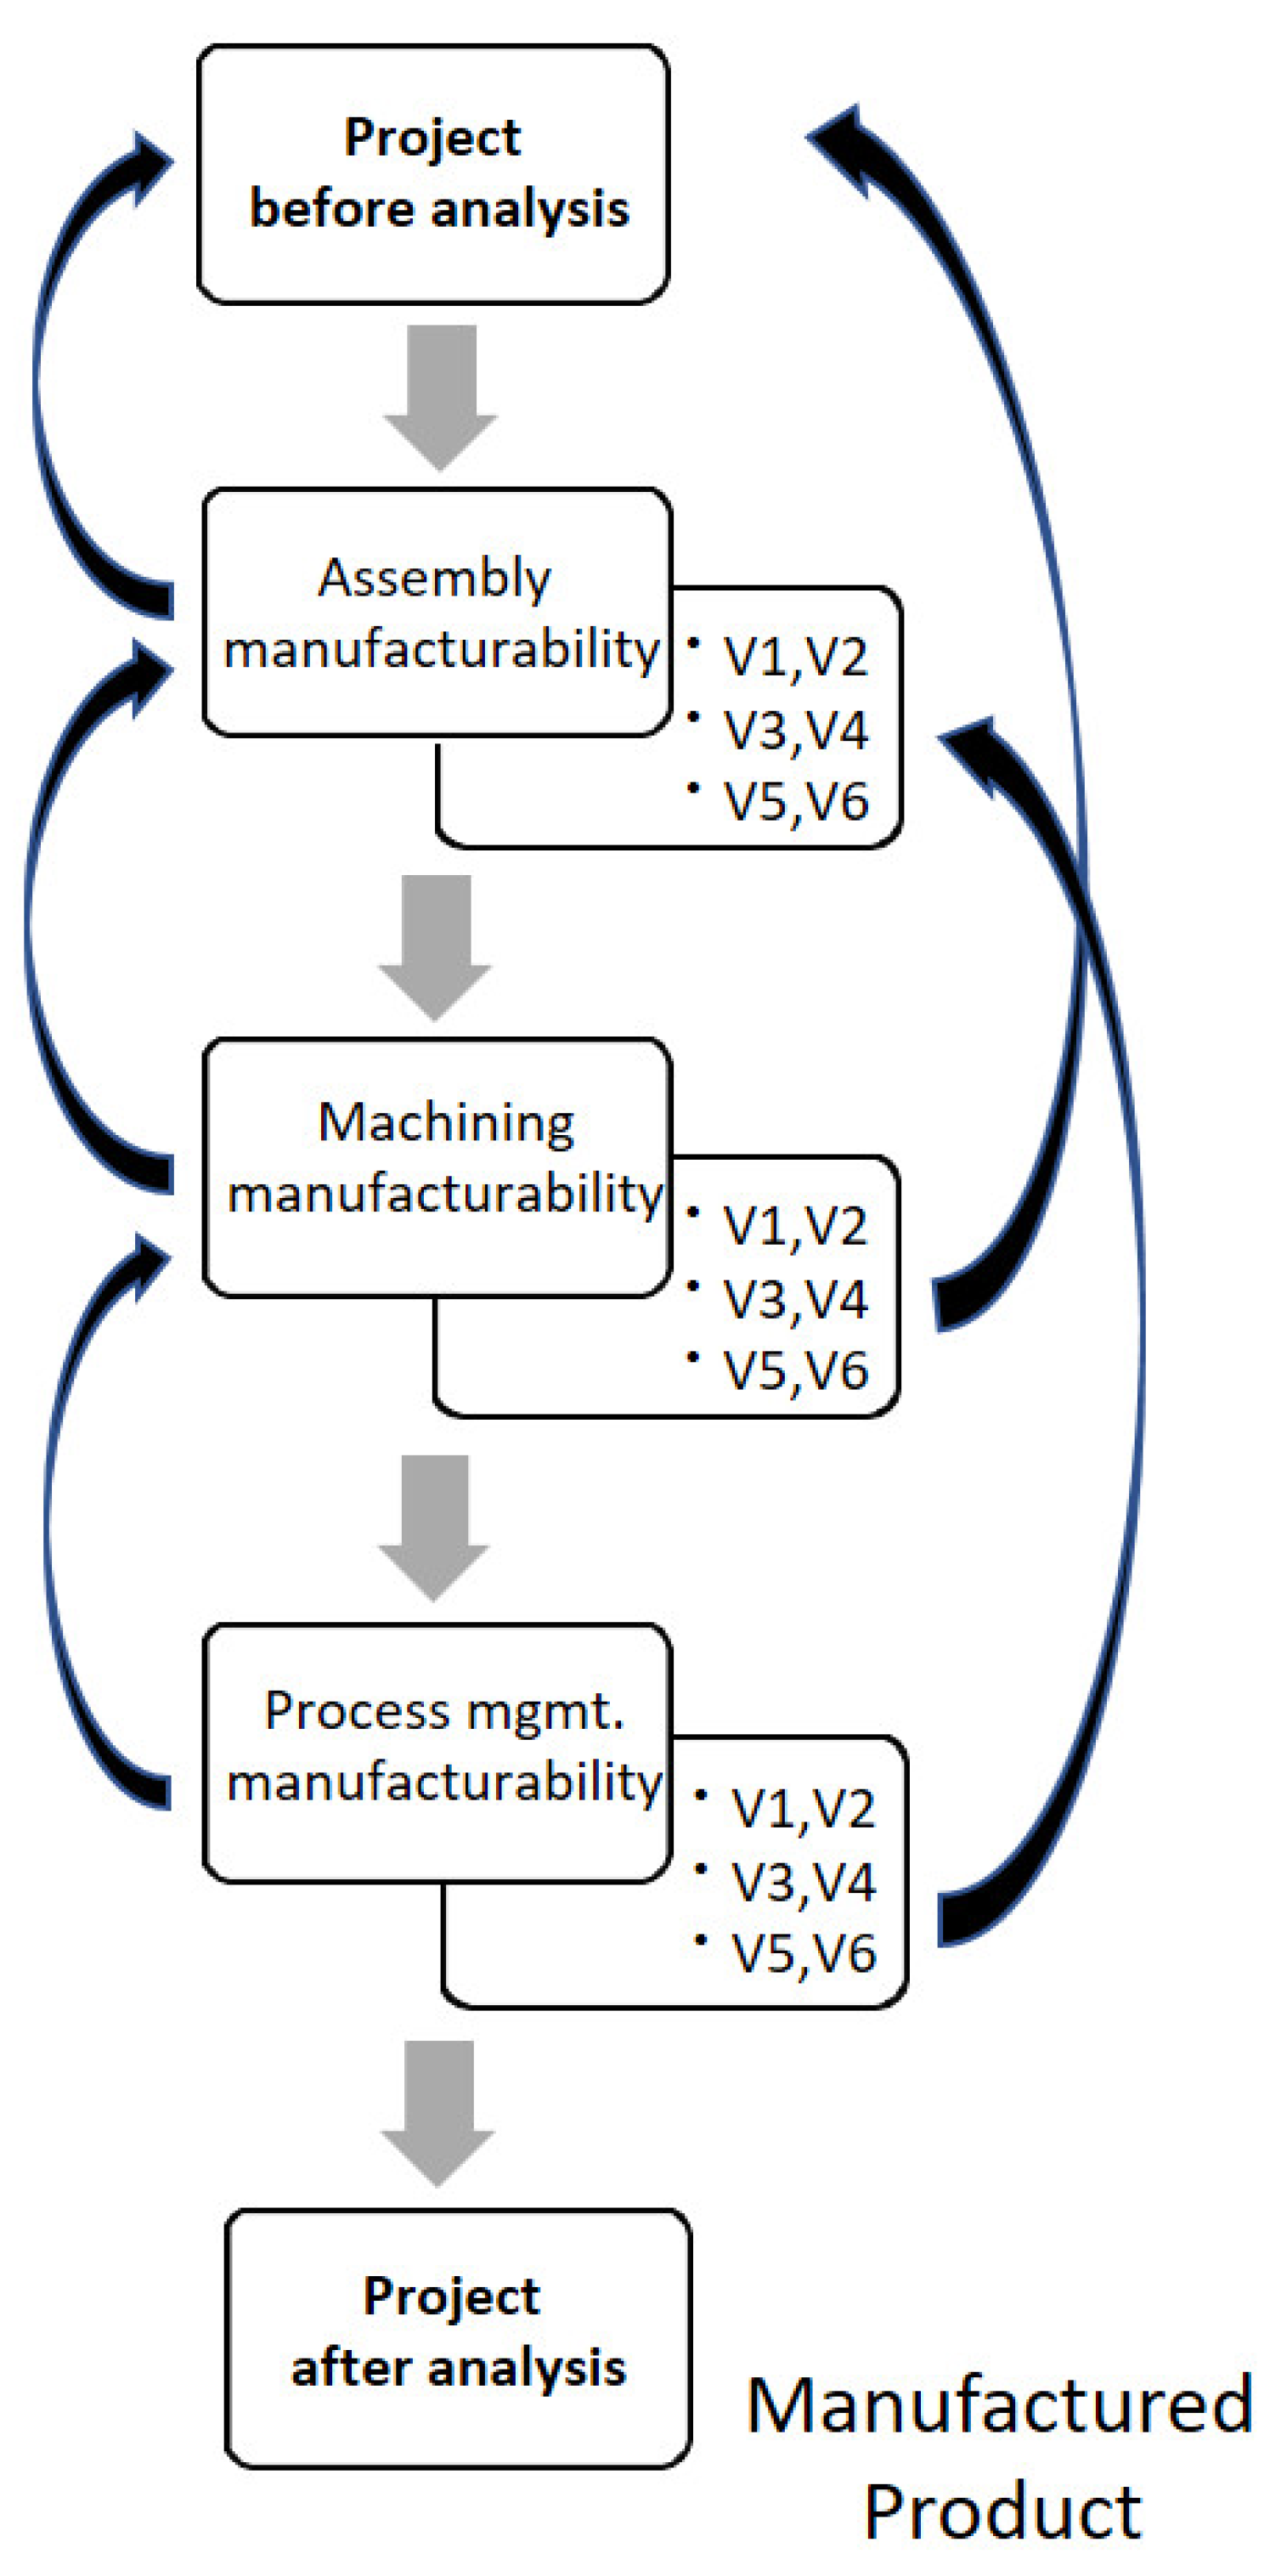
Applsci 10 03935 g001
Figure 2. Structural analysis of the structure’s technology in the proposed method.
Applsci 10 03935 g002
Figure 3. Graph of the triangular membership function described by the Formula (1).
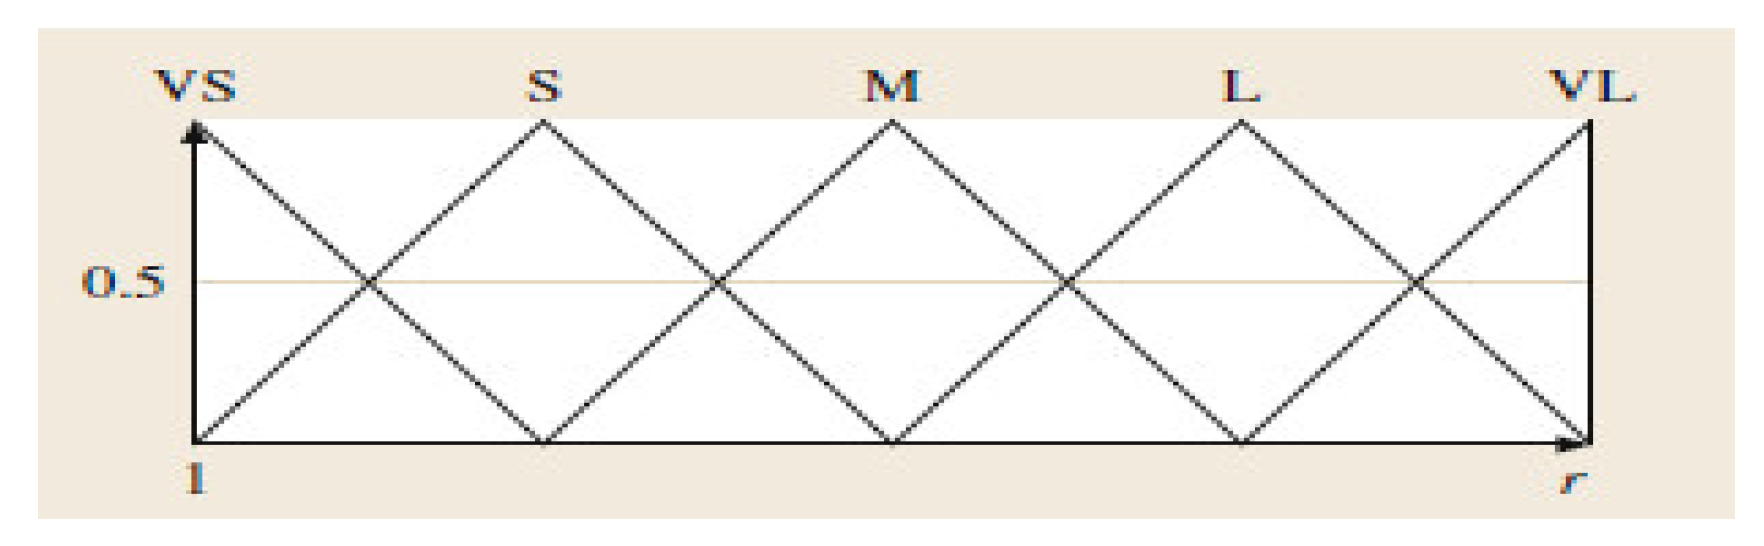
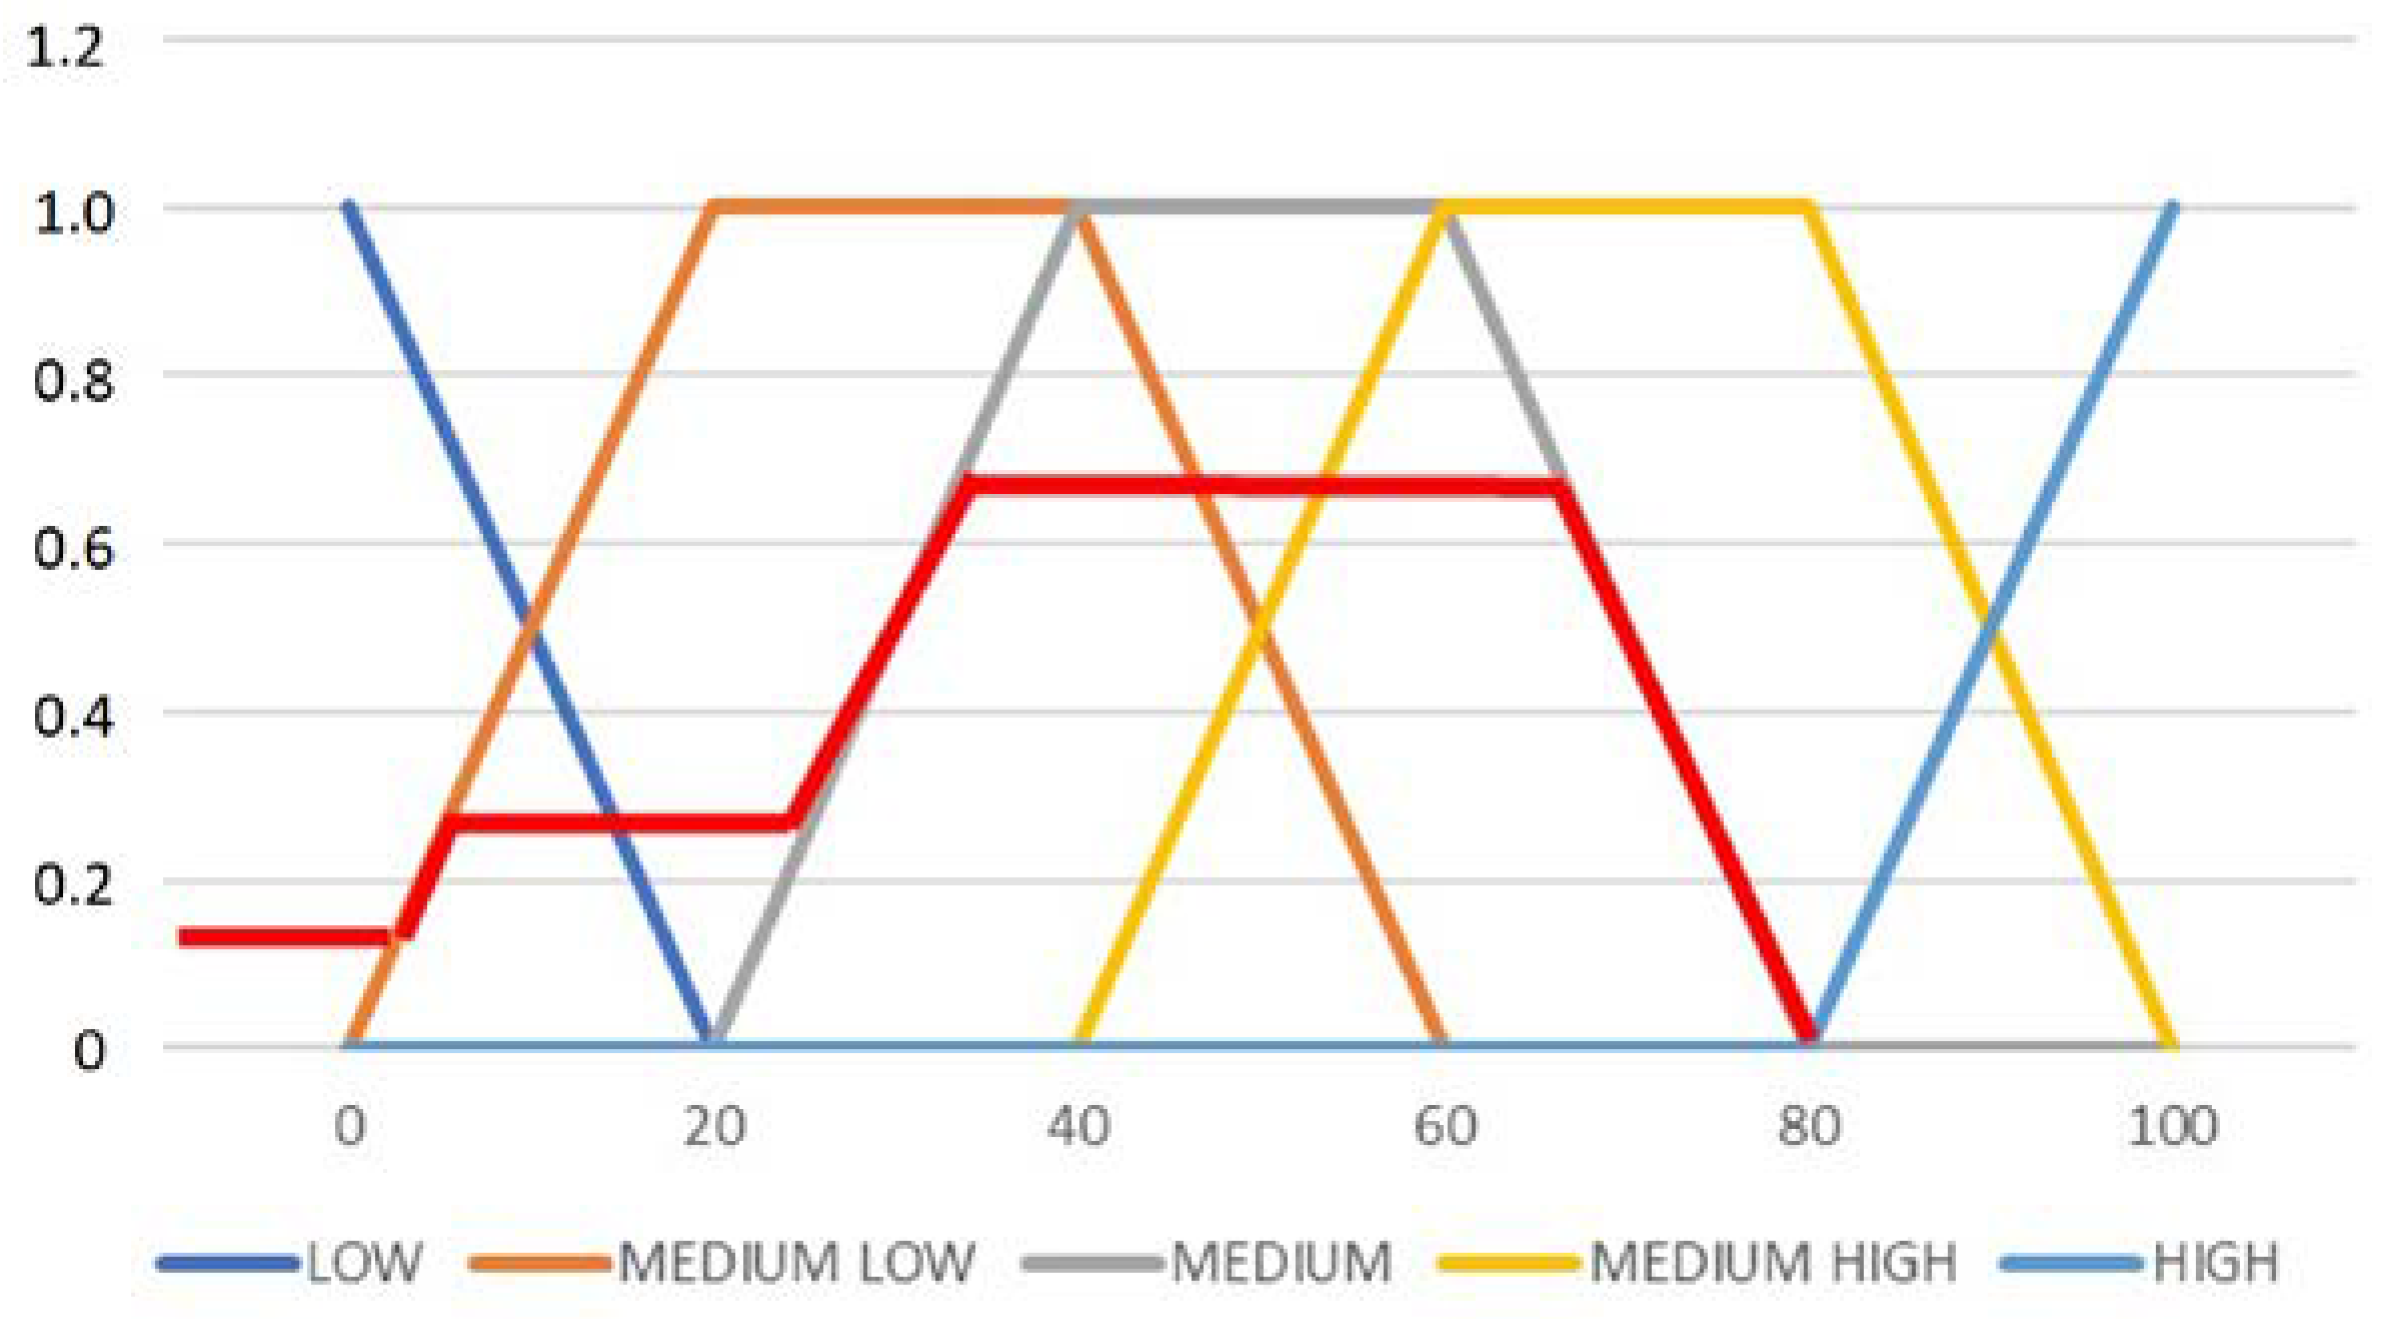
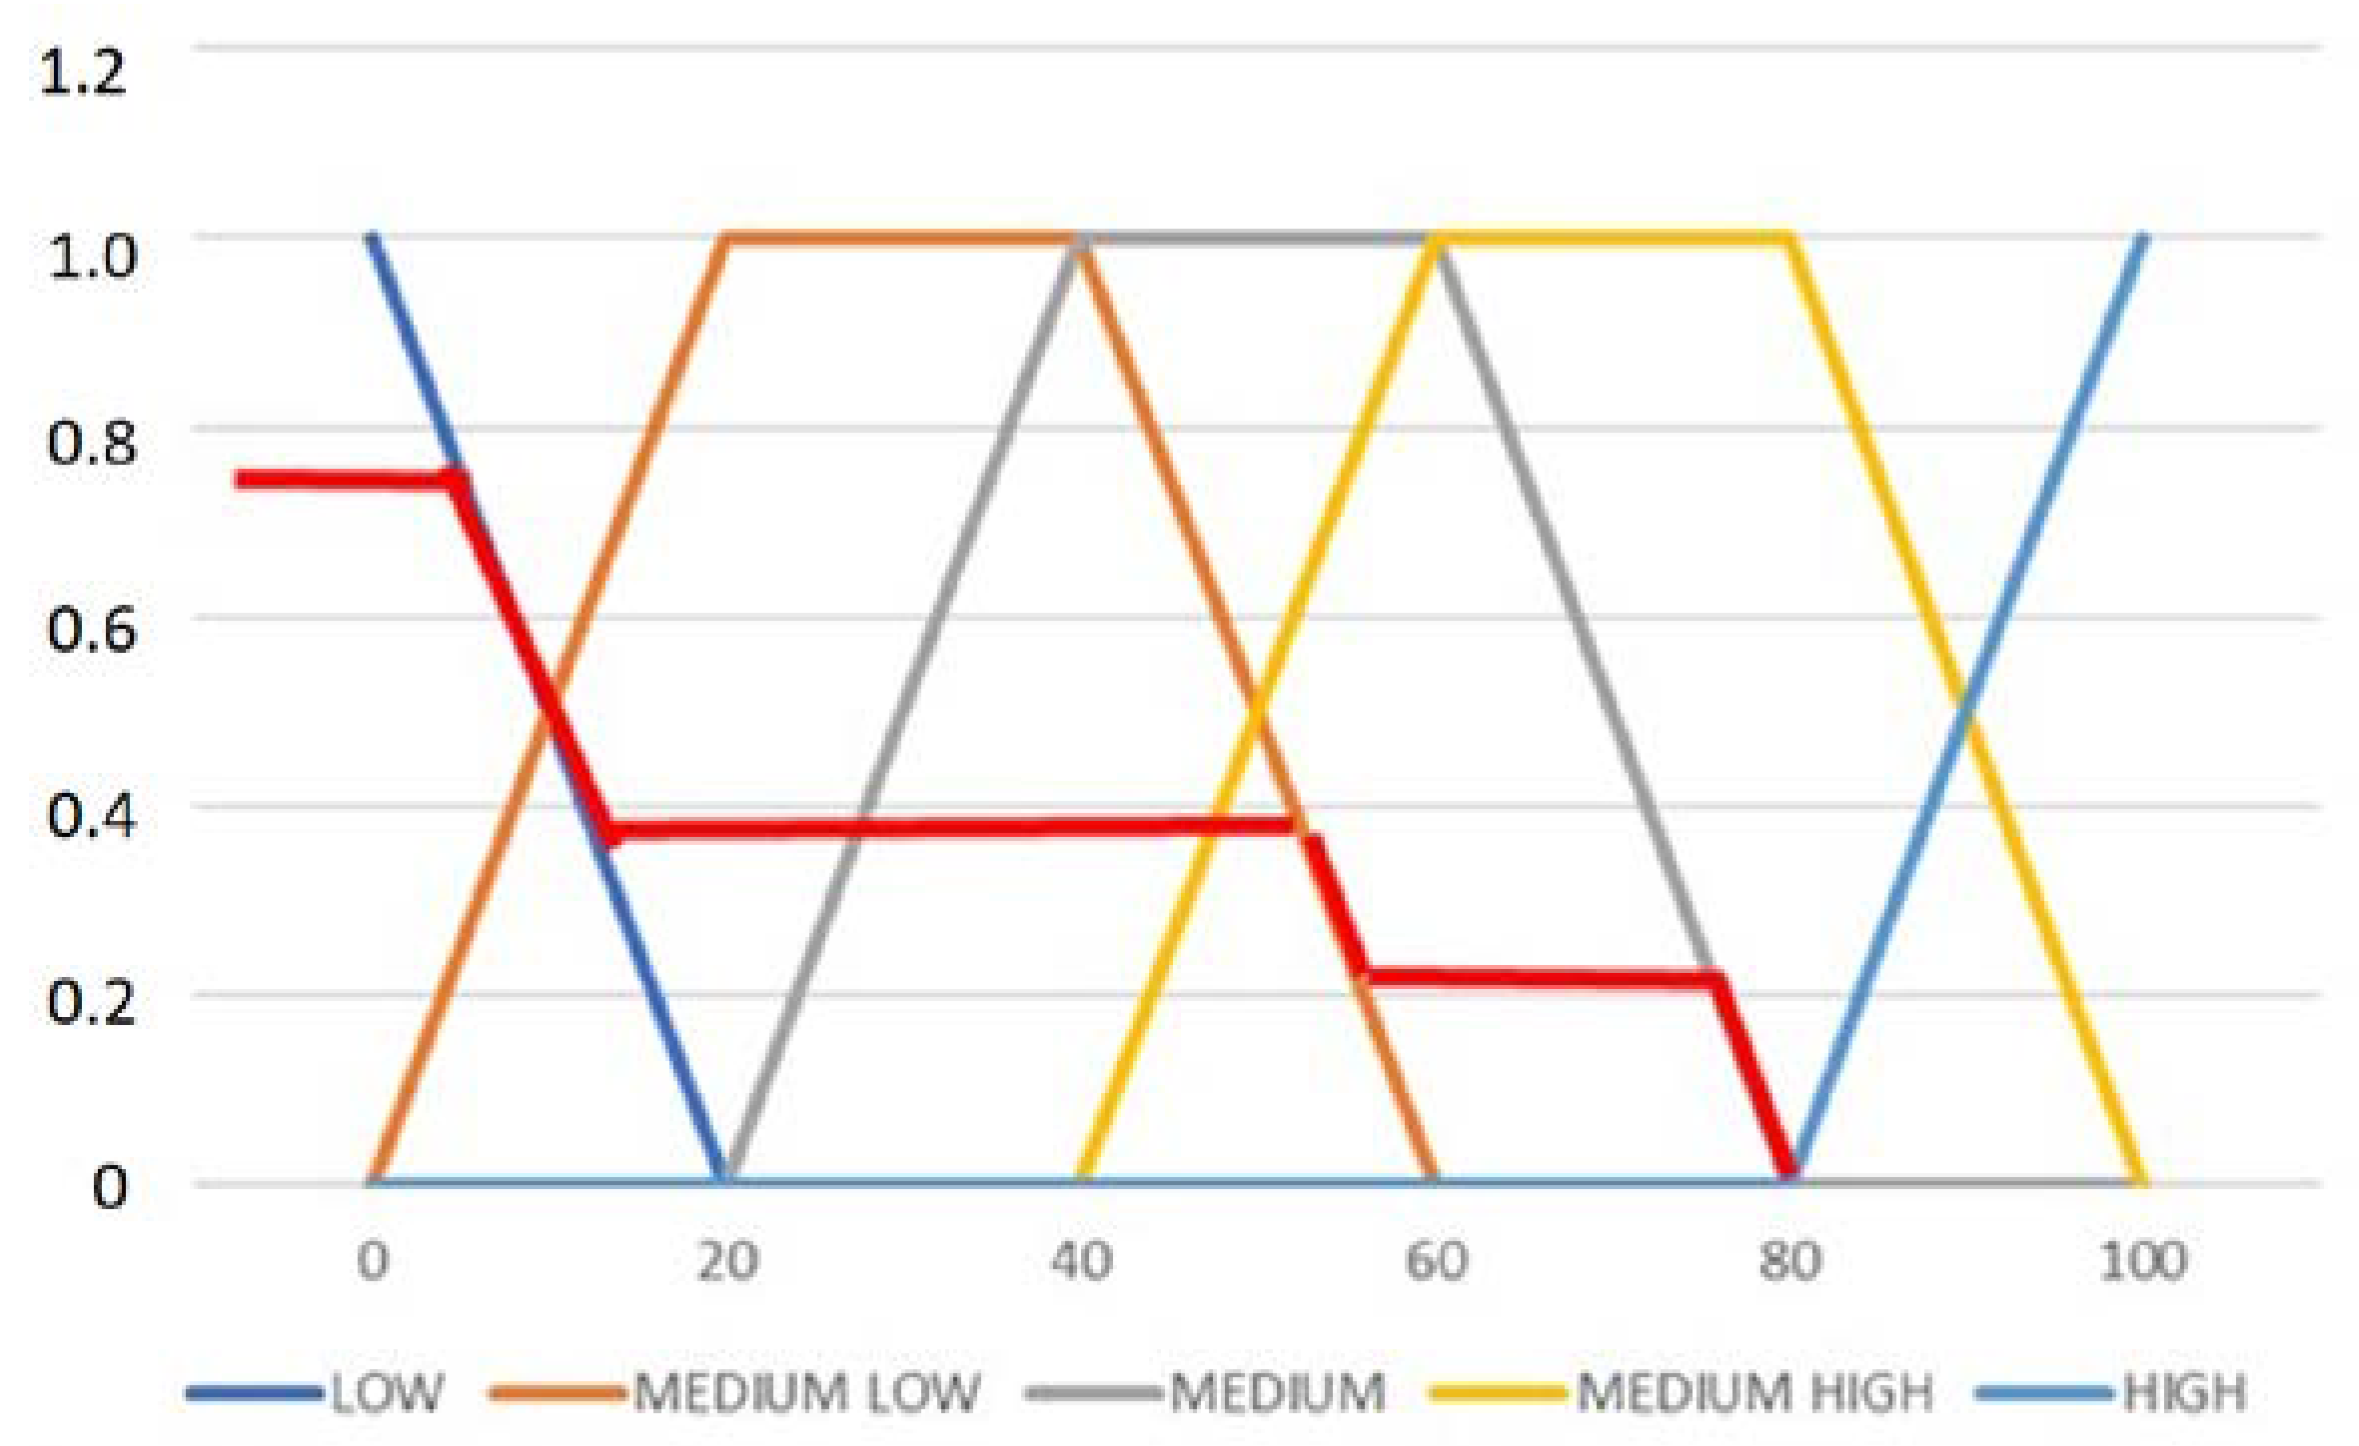
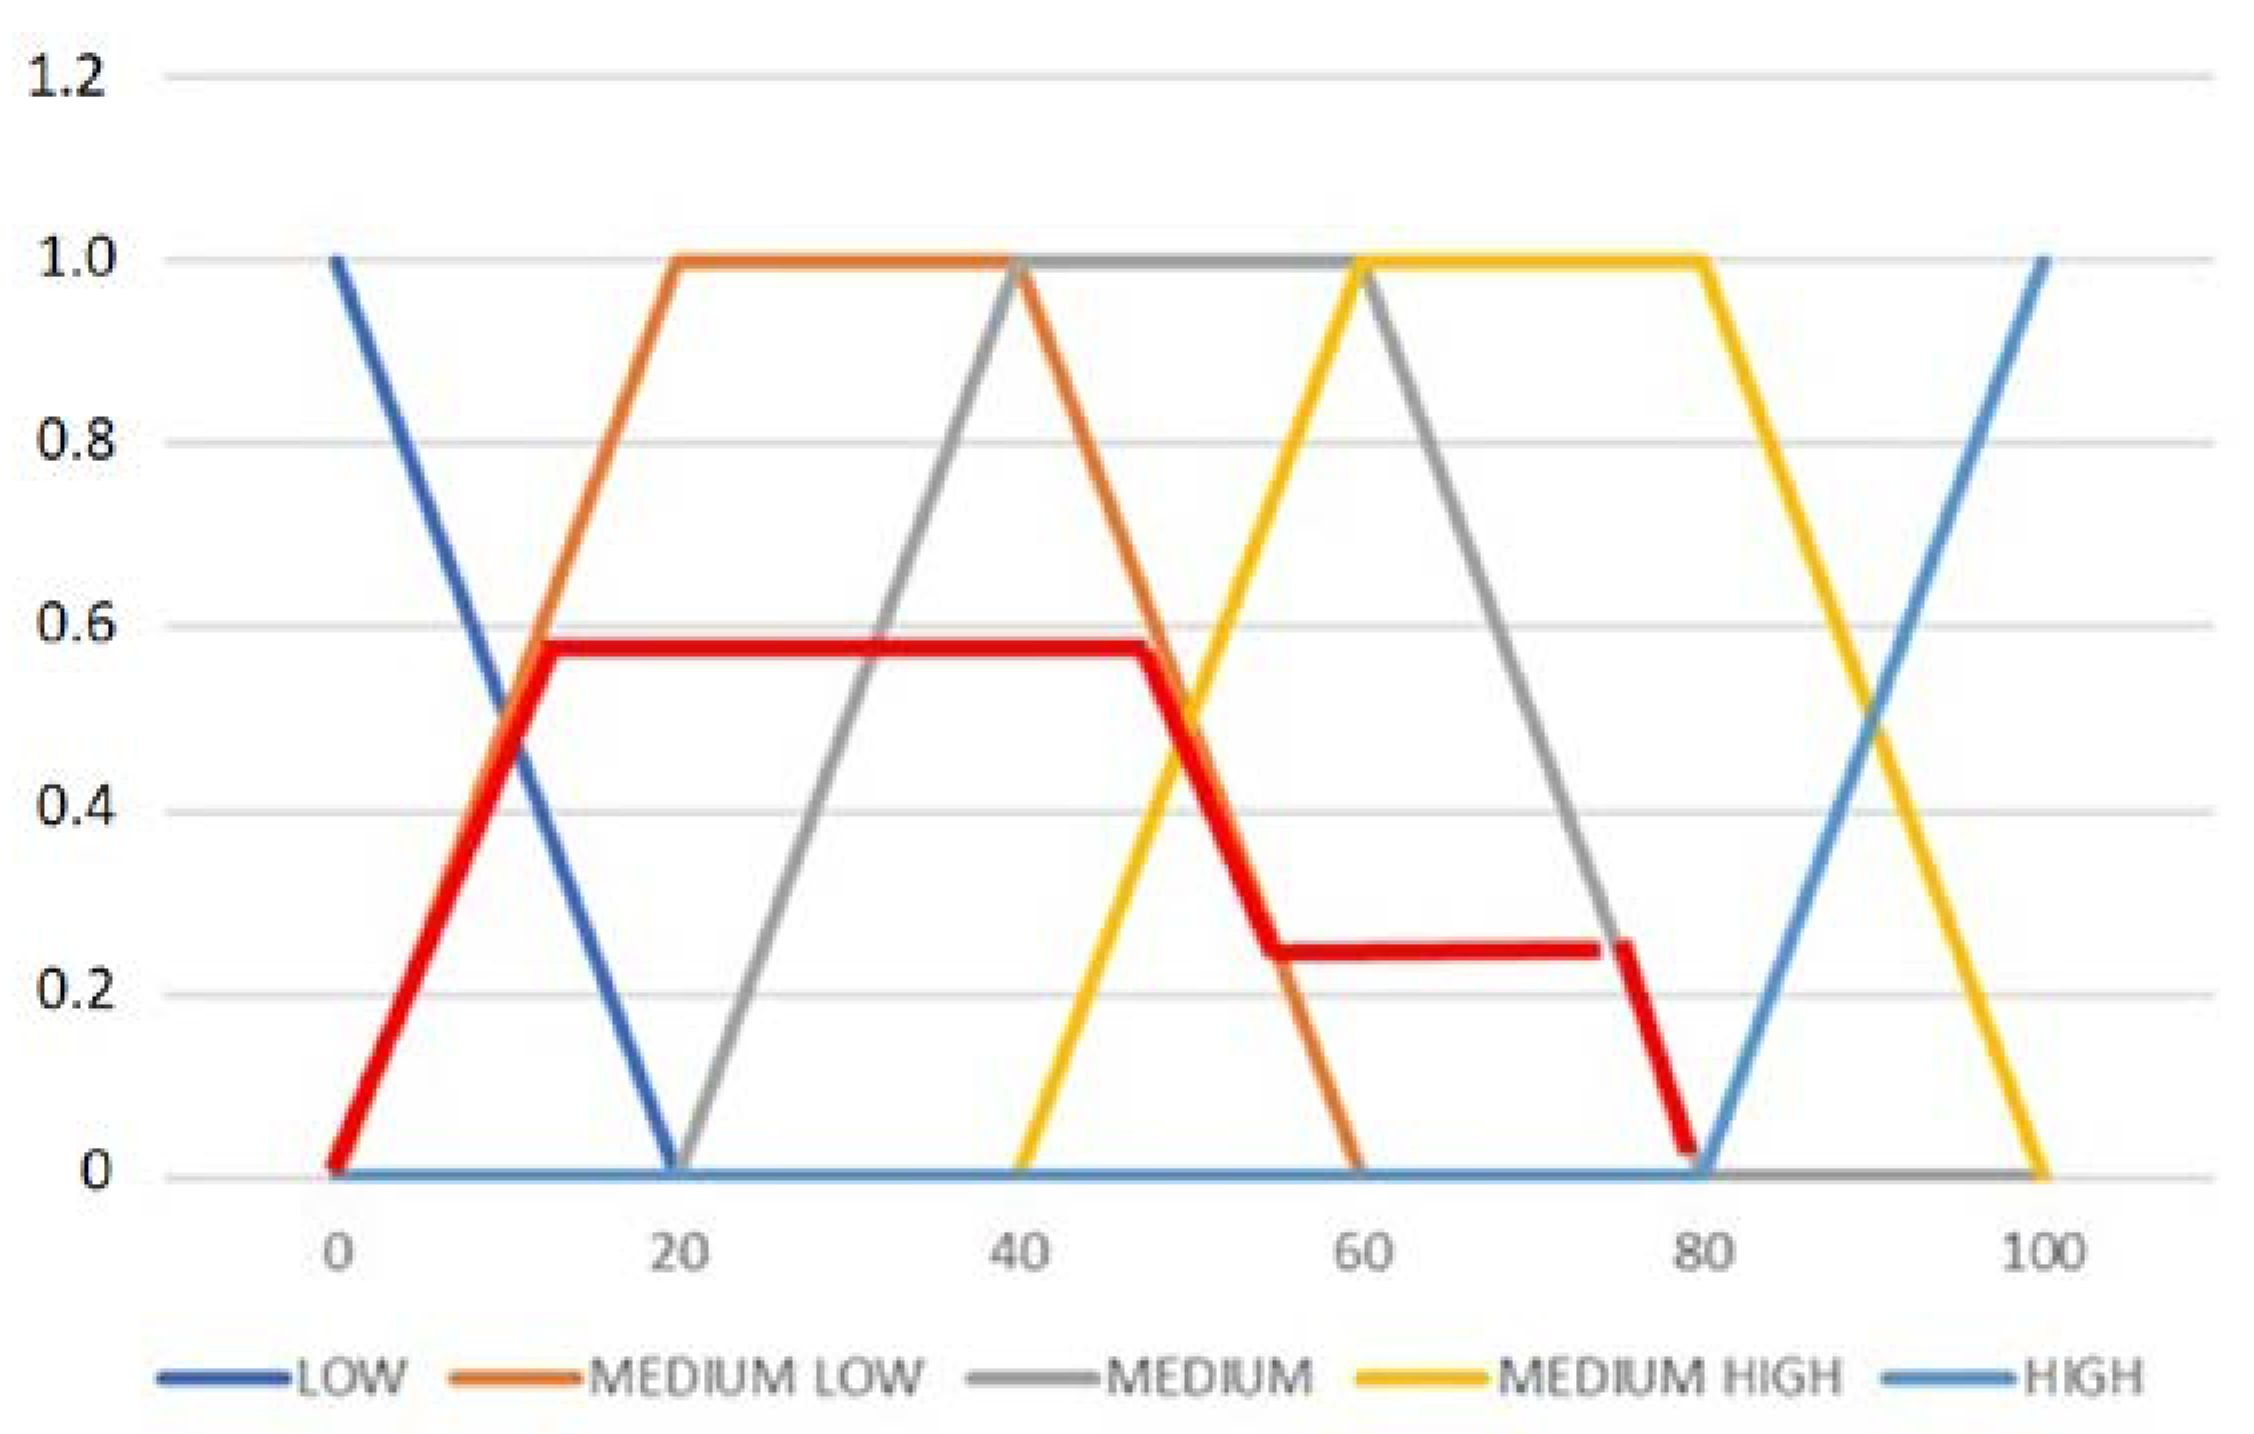
Applsci 10 03935 g003
Figure 4. Example of a fuzzy partition where vs. -, S-, M-, L-, VL-.
Applsci 10 03935 g004
Figure 5. Reference model of the project is of the type: multiple entries—multiple outputs.
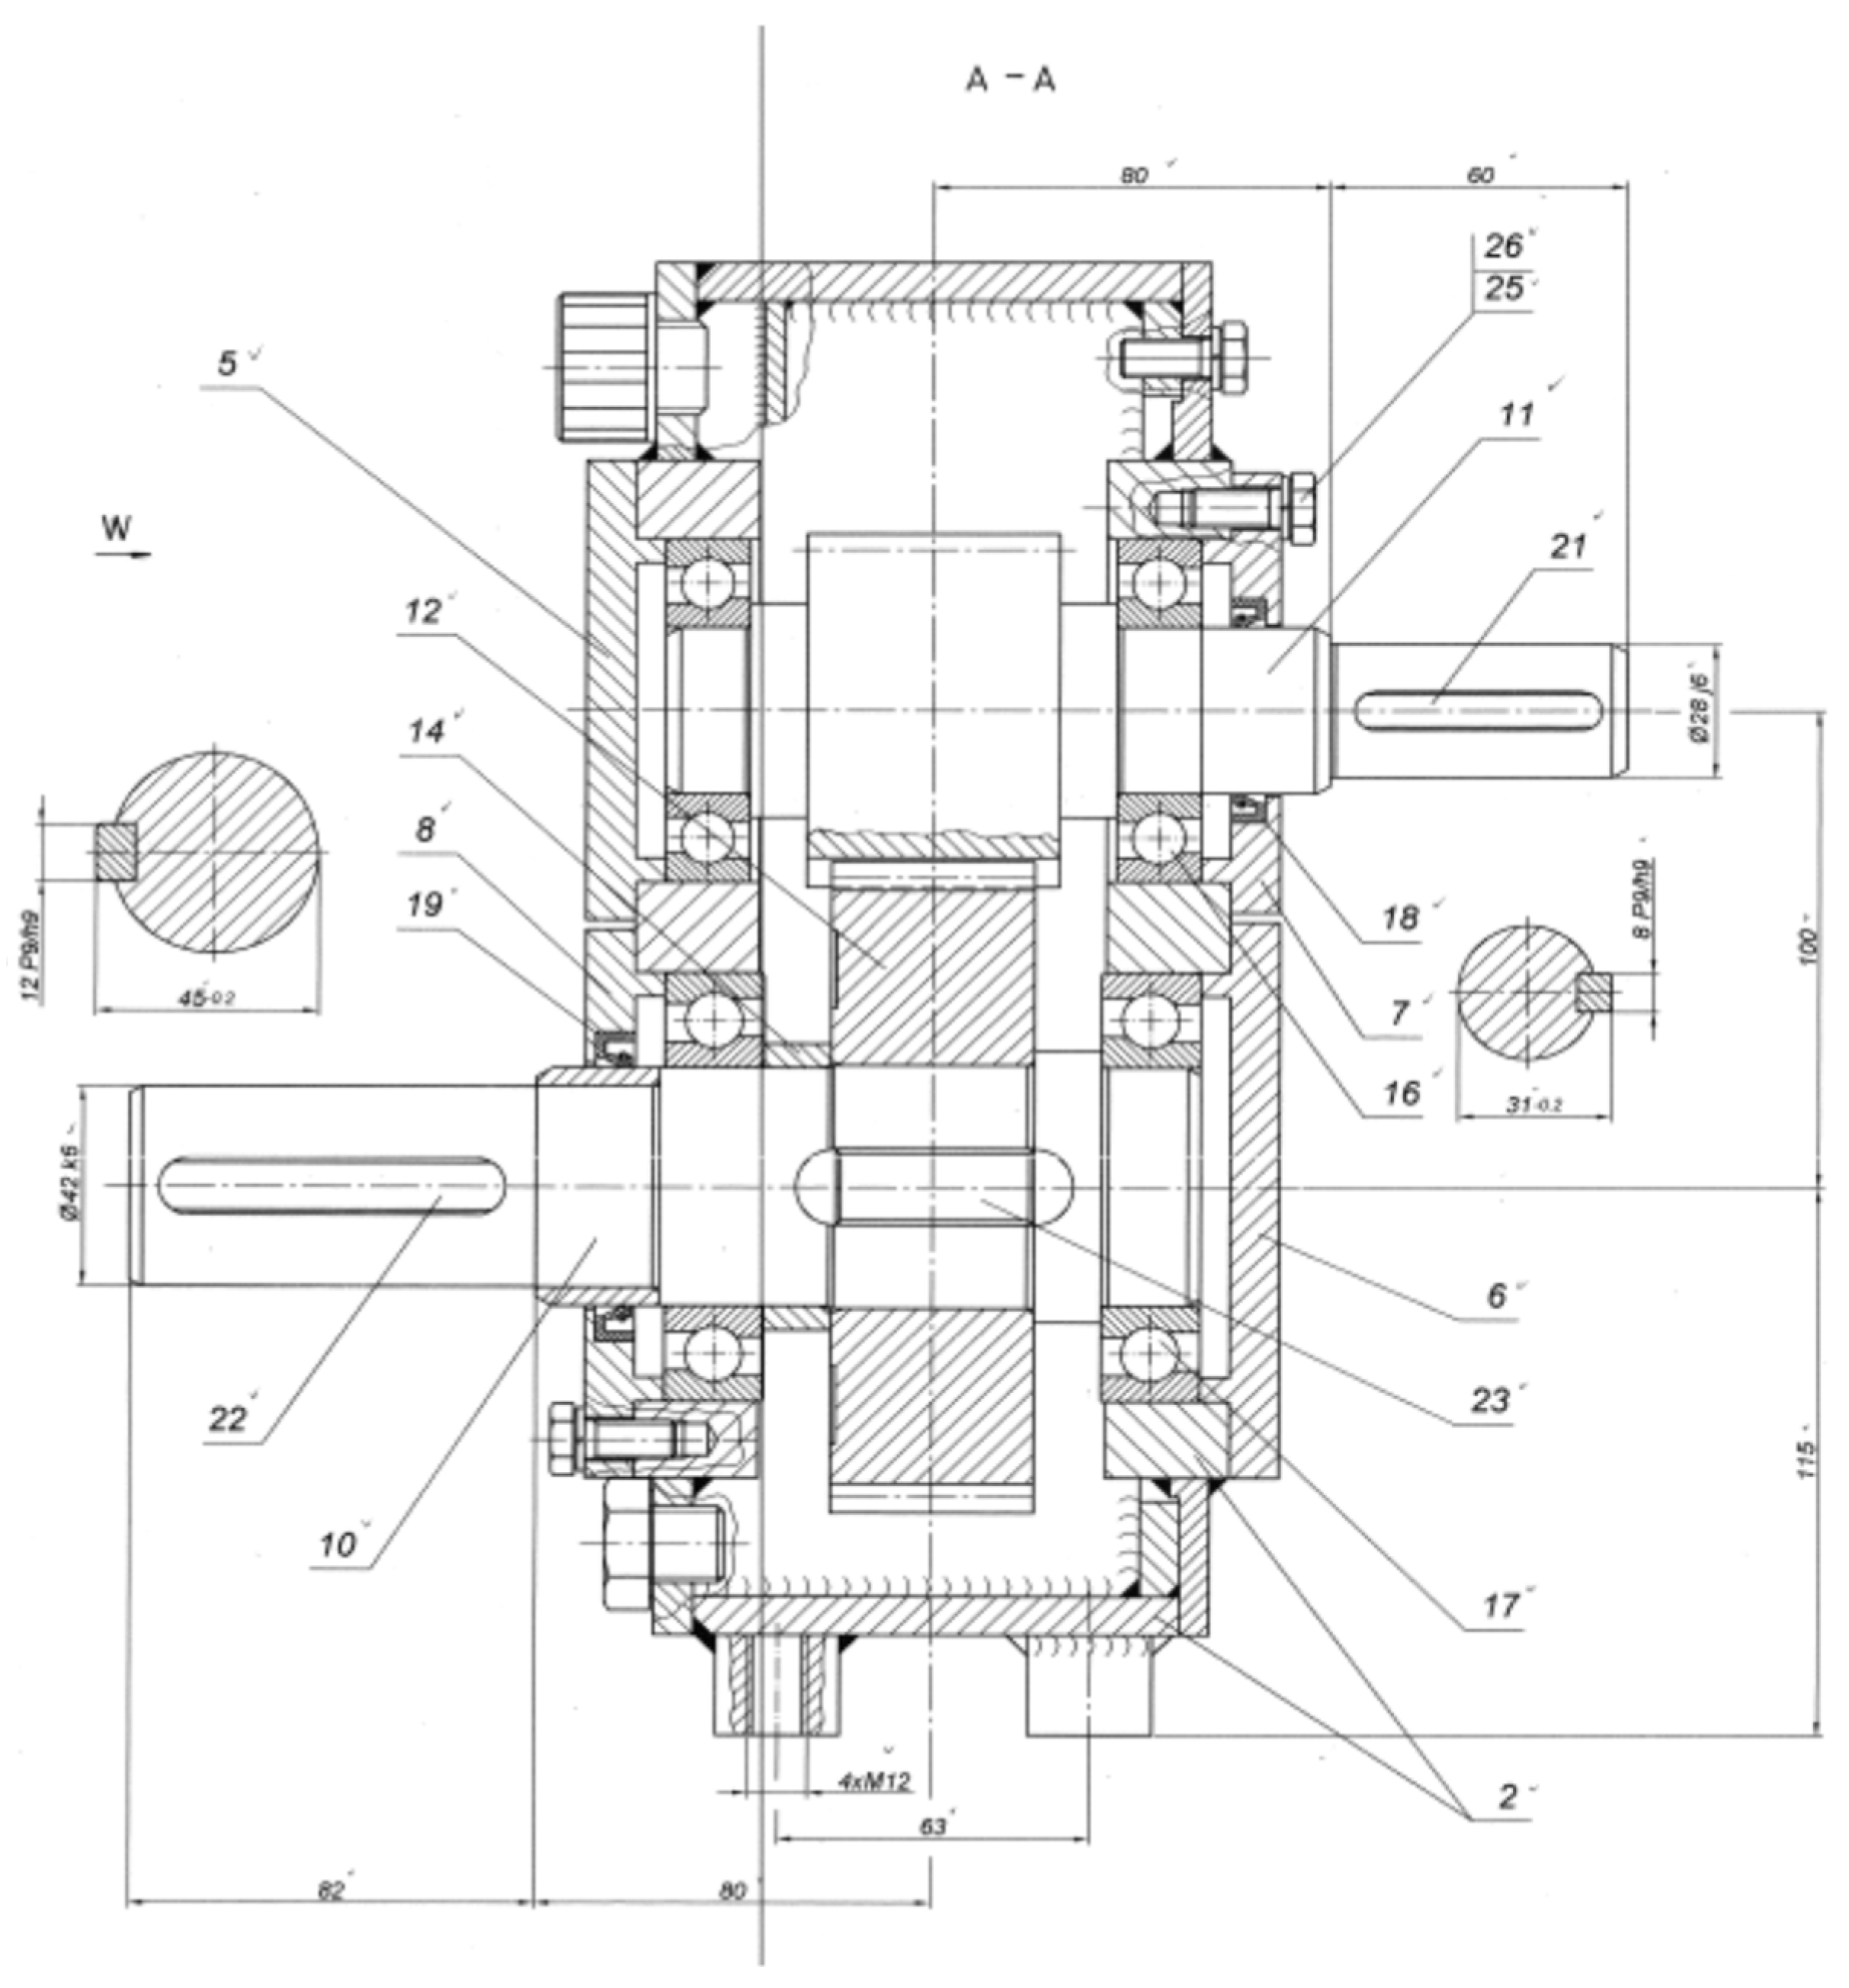
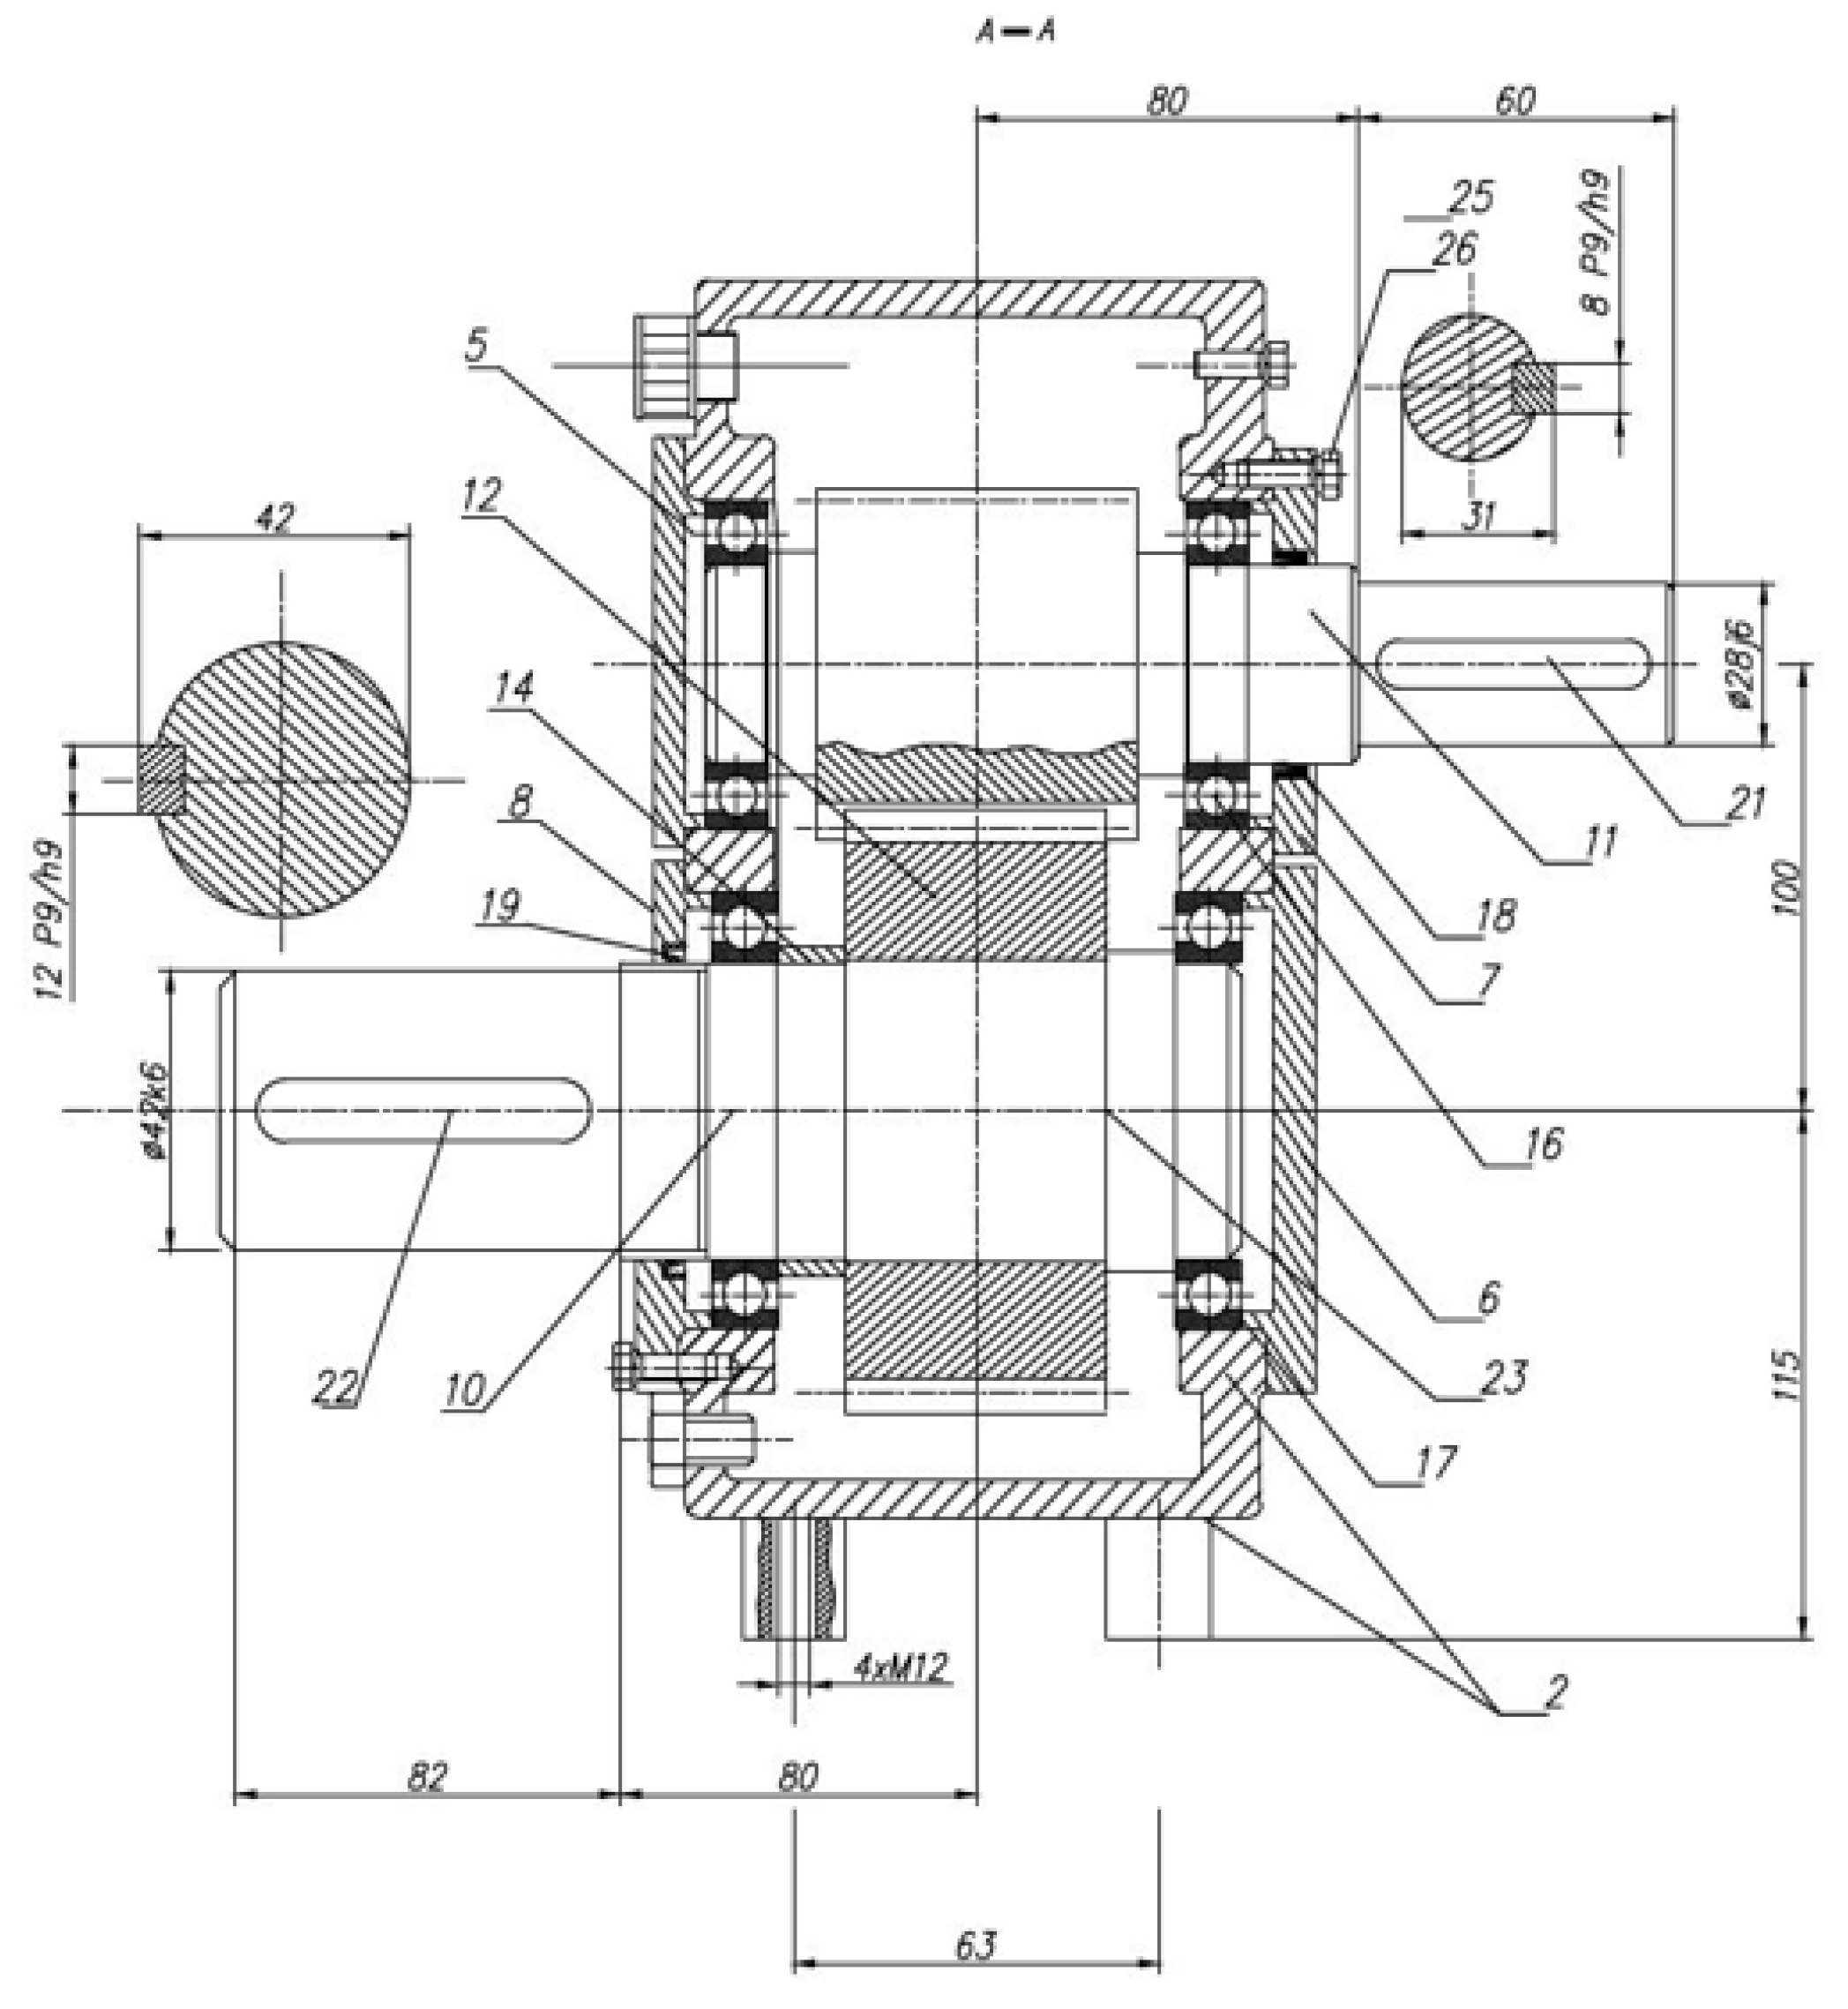
Applsci 10 03935 g005
Figure 6. Diagram of the analyzed gearbox. 2—body; 5, 6, 7, 8—bearing caps; 10—shaft; 11—pinion; 12—tooth gear; 14—spacing rings; 17; 16—bearings; 18, 19; —seals; 21, 22, 23—keys; 25, 26—washers; screws.
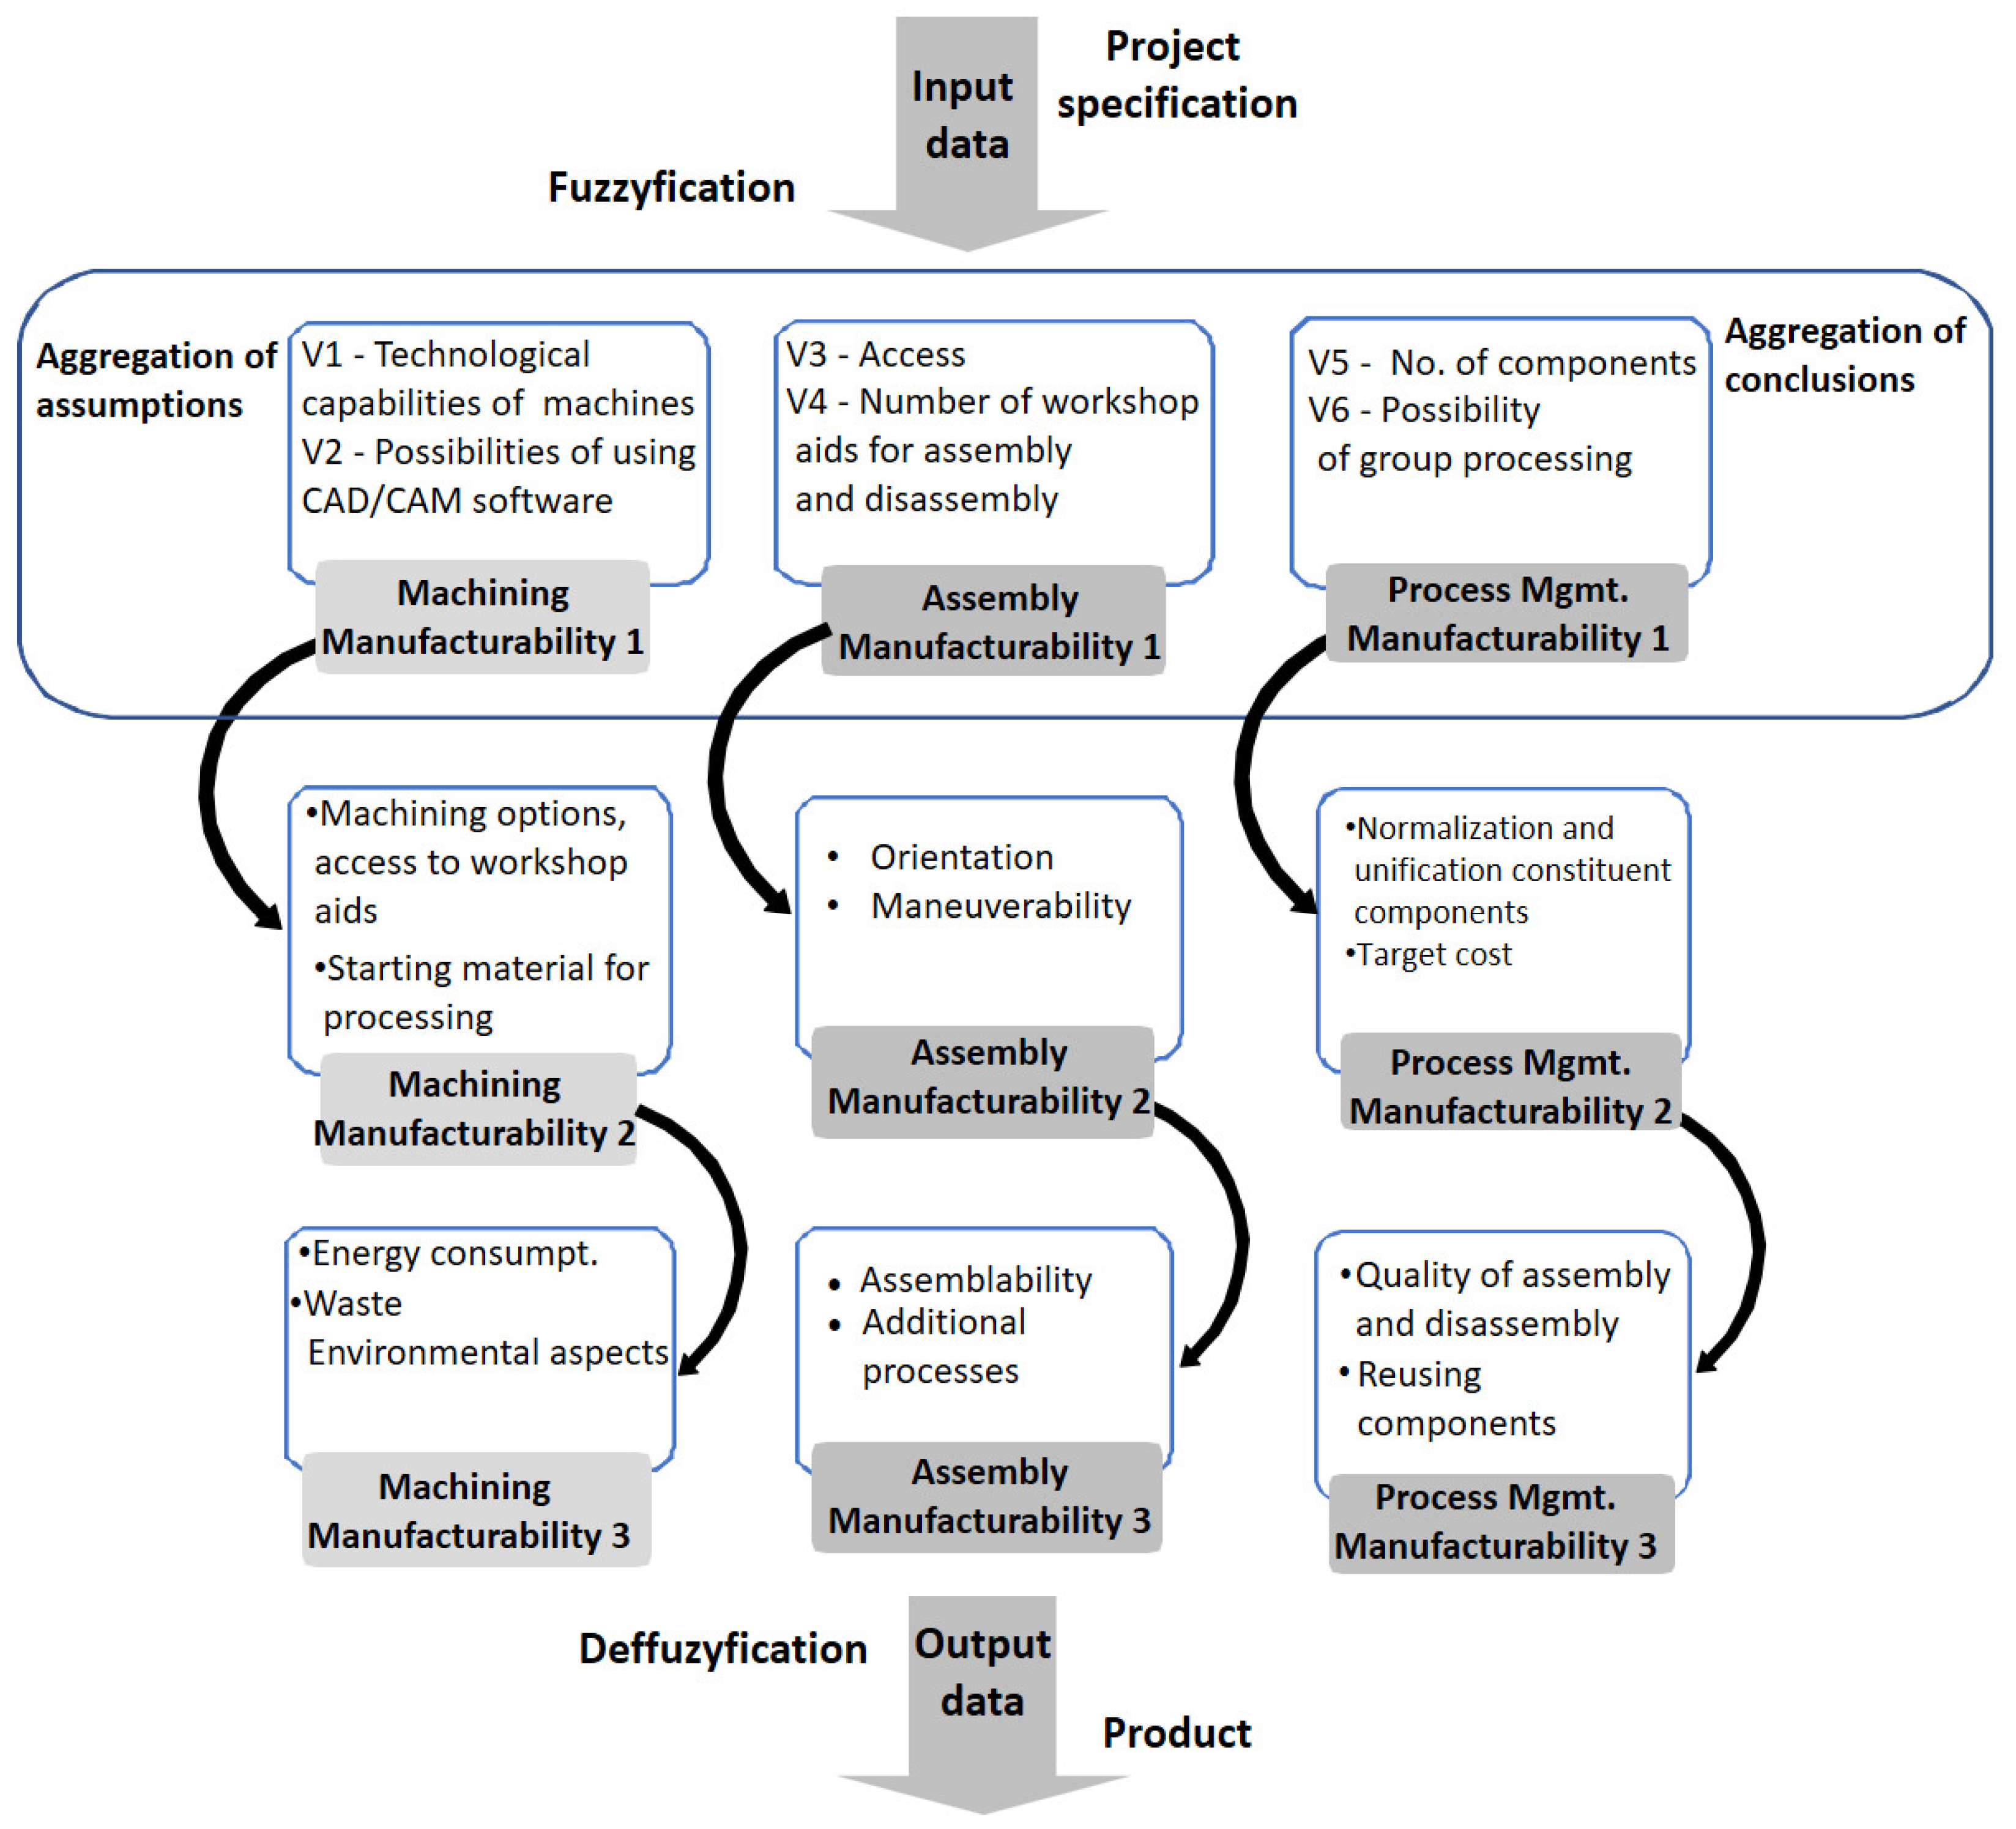
Applsci 10 03935 g006
Figure 7. Model of the new method design for manufacturability based on three successive stages and substages of fuzzy inference (without feedback).
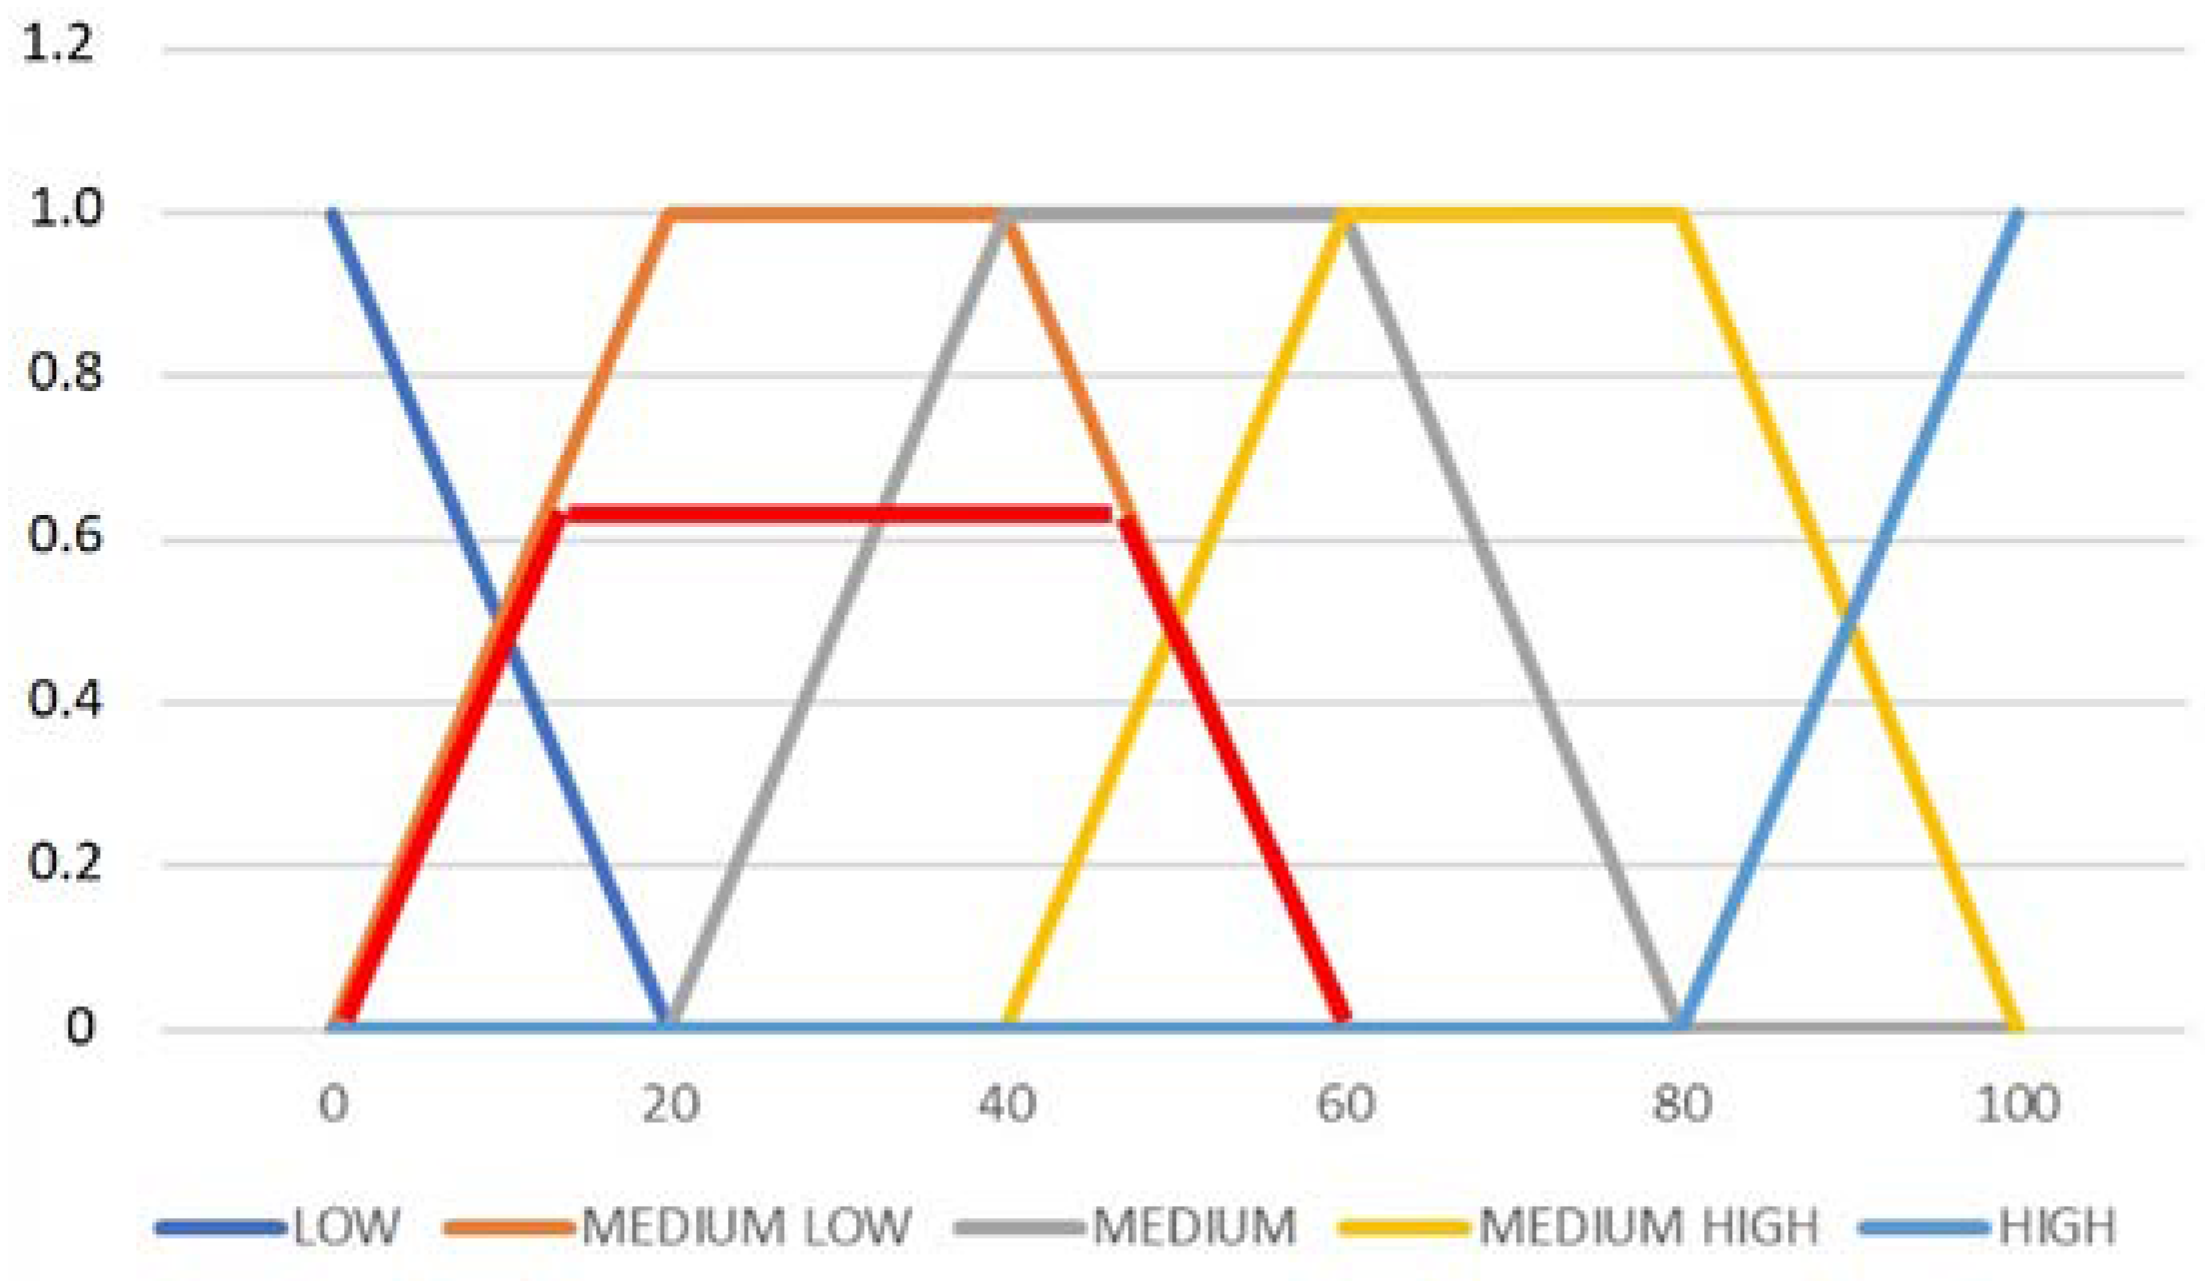
Applsci 10 03935 g007
Figure 8. Aggregation of rules for assembly technology Substep 1.
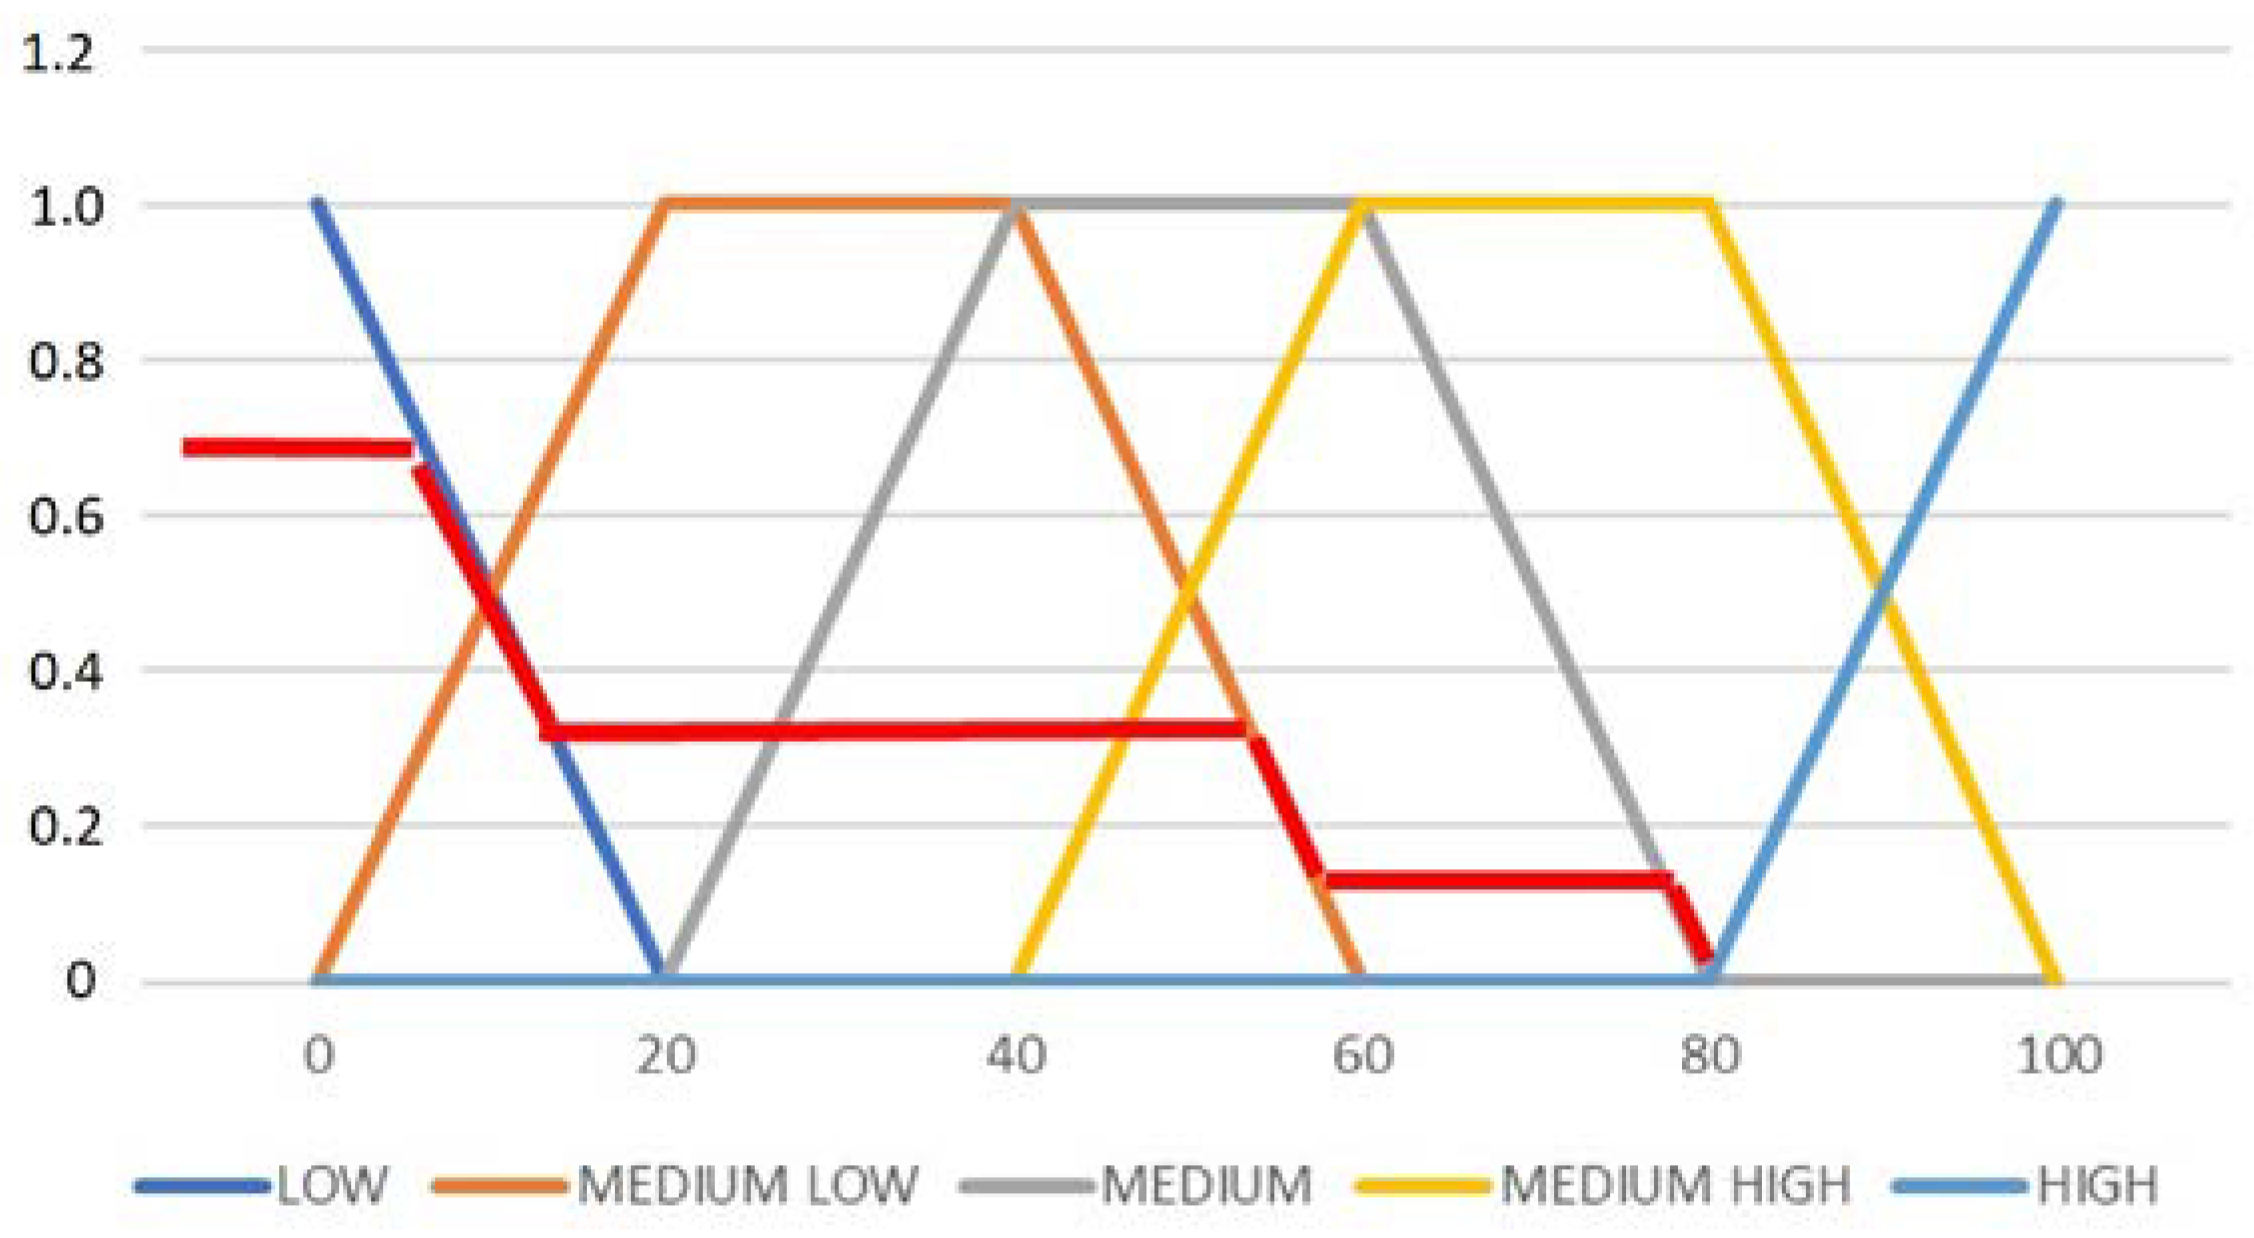
Applsci 10 03935 g008
Figure 9. Aggregation of rules for assembly technology 2.
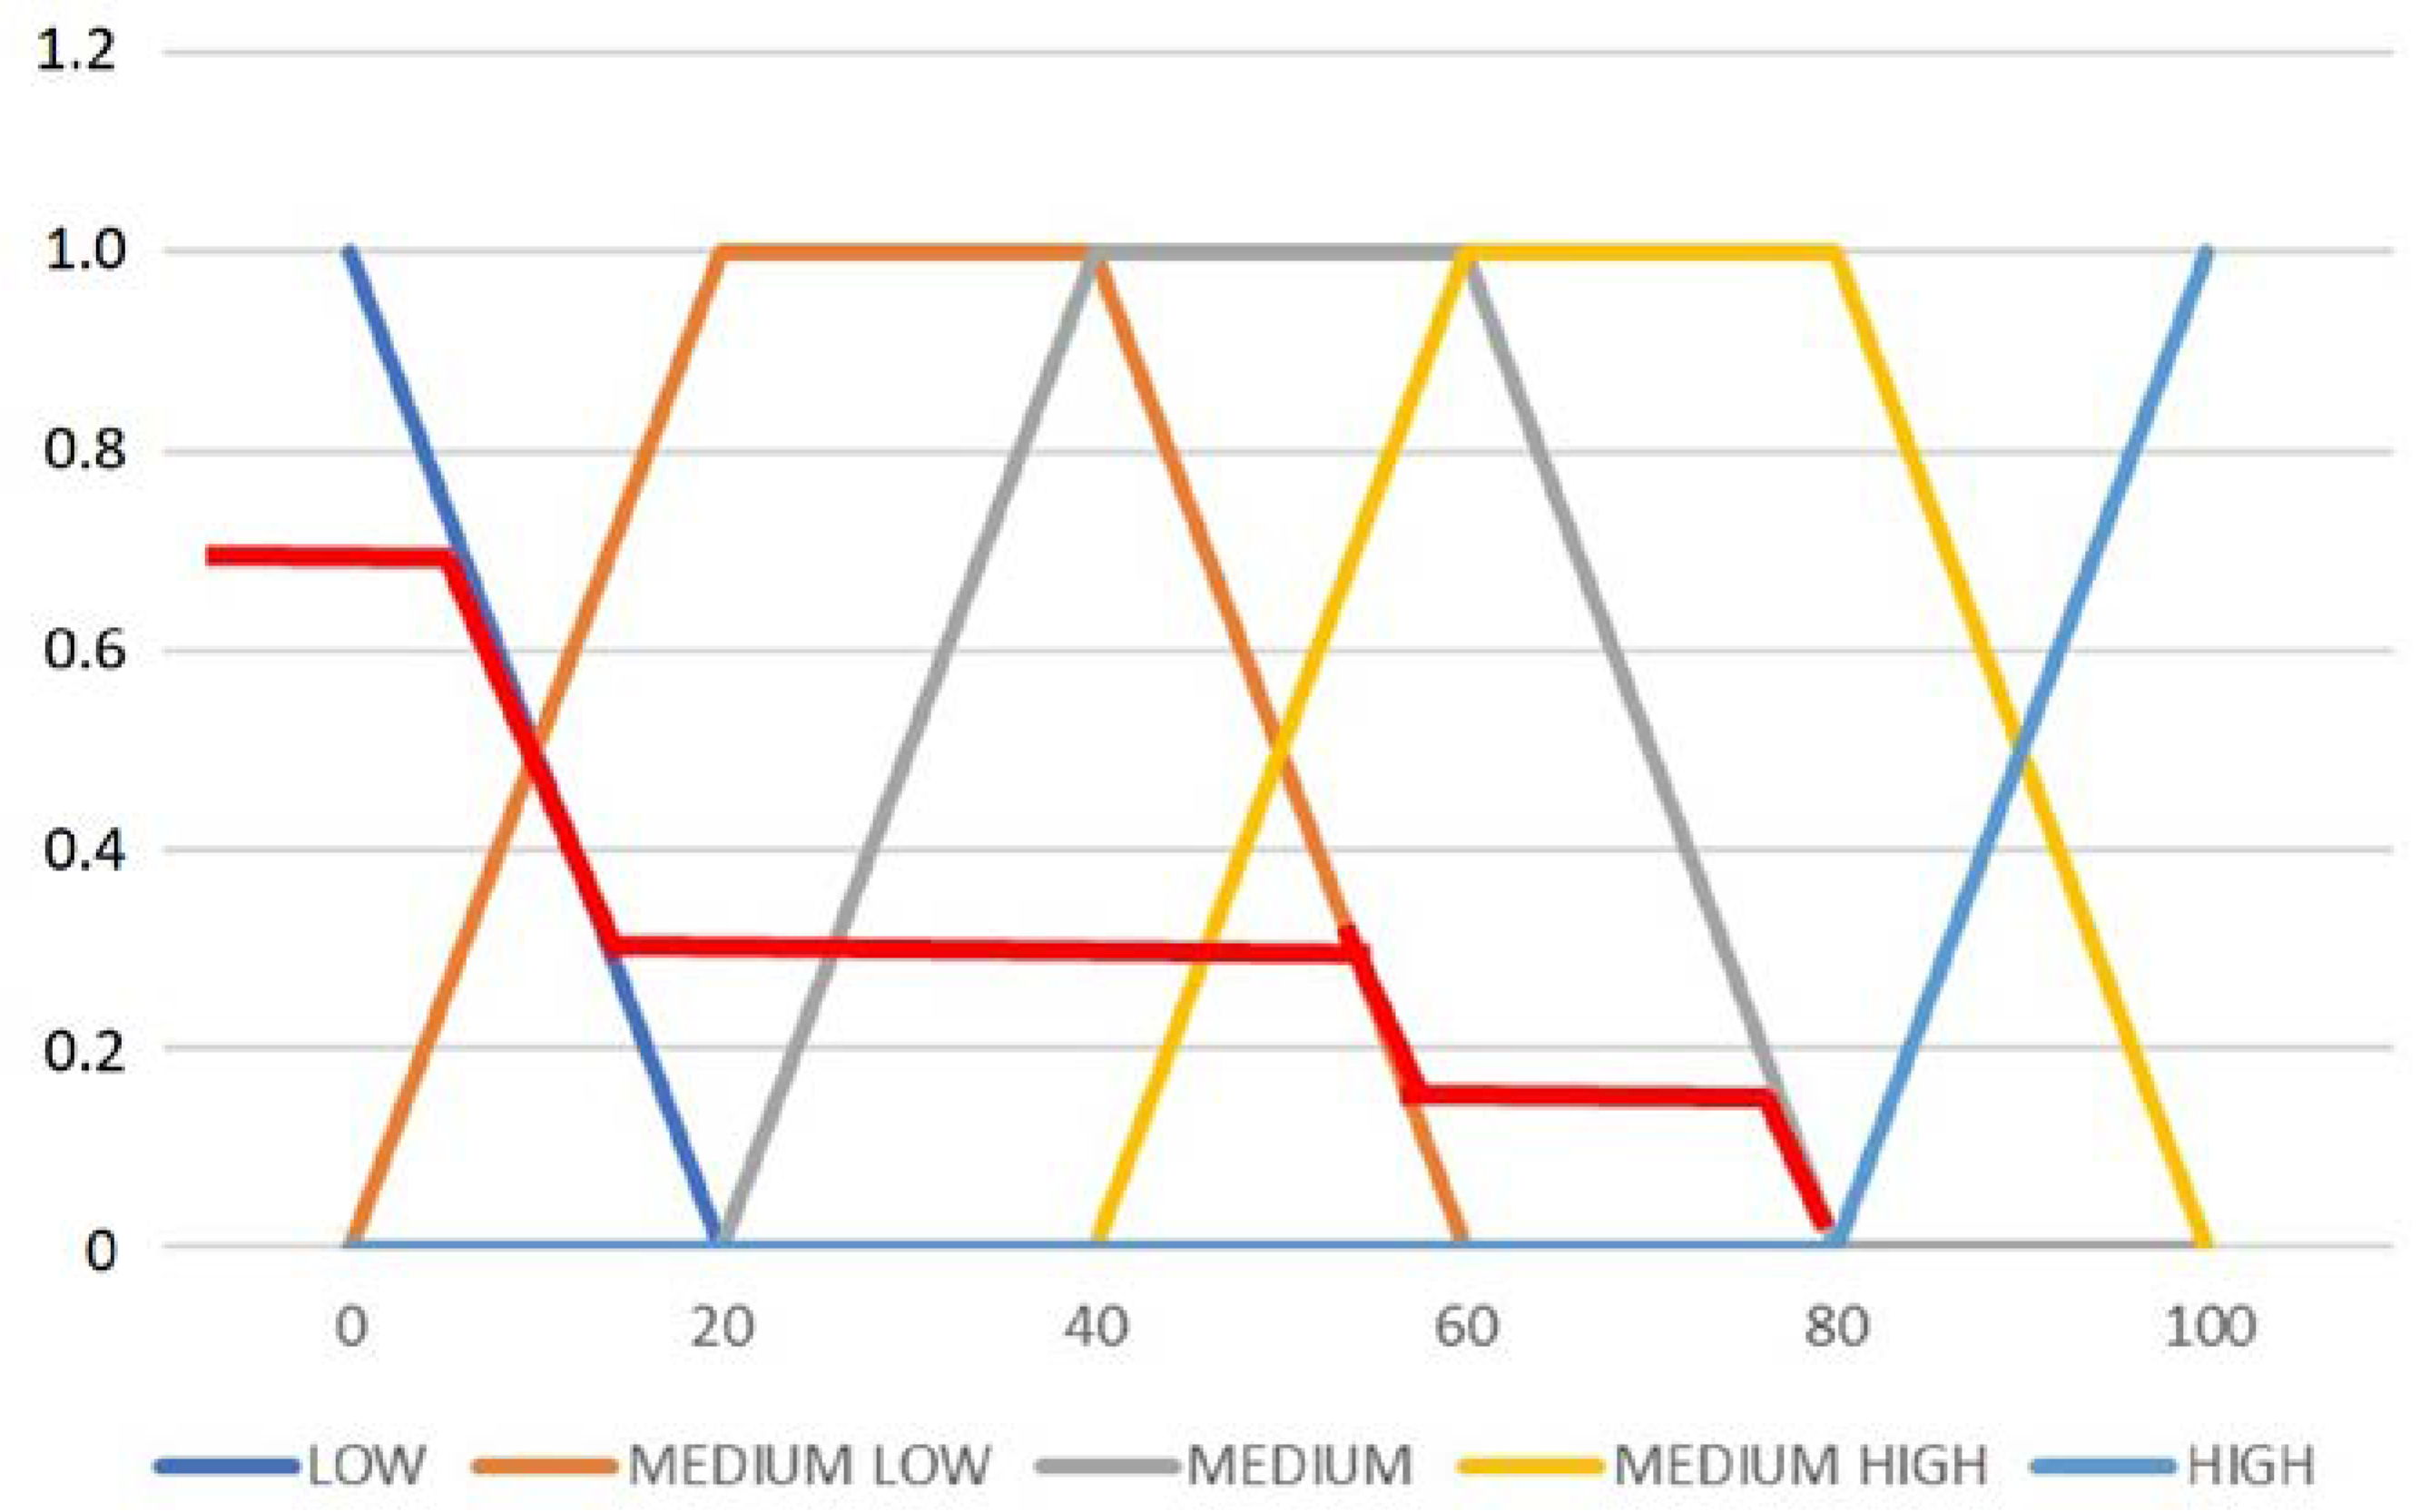
Applsci 10 03935 g009
Figure 10. Aggregation of rules for assembly technology 3.
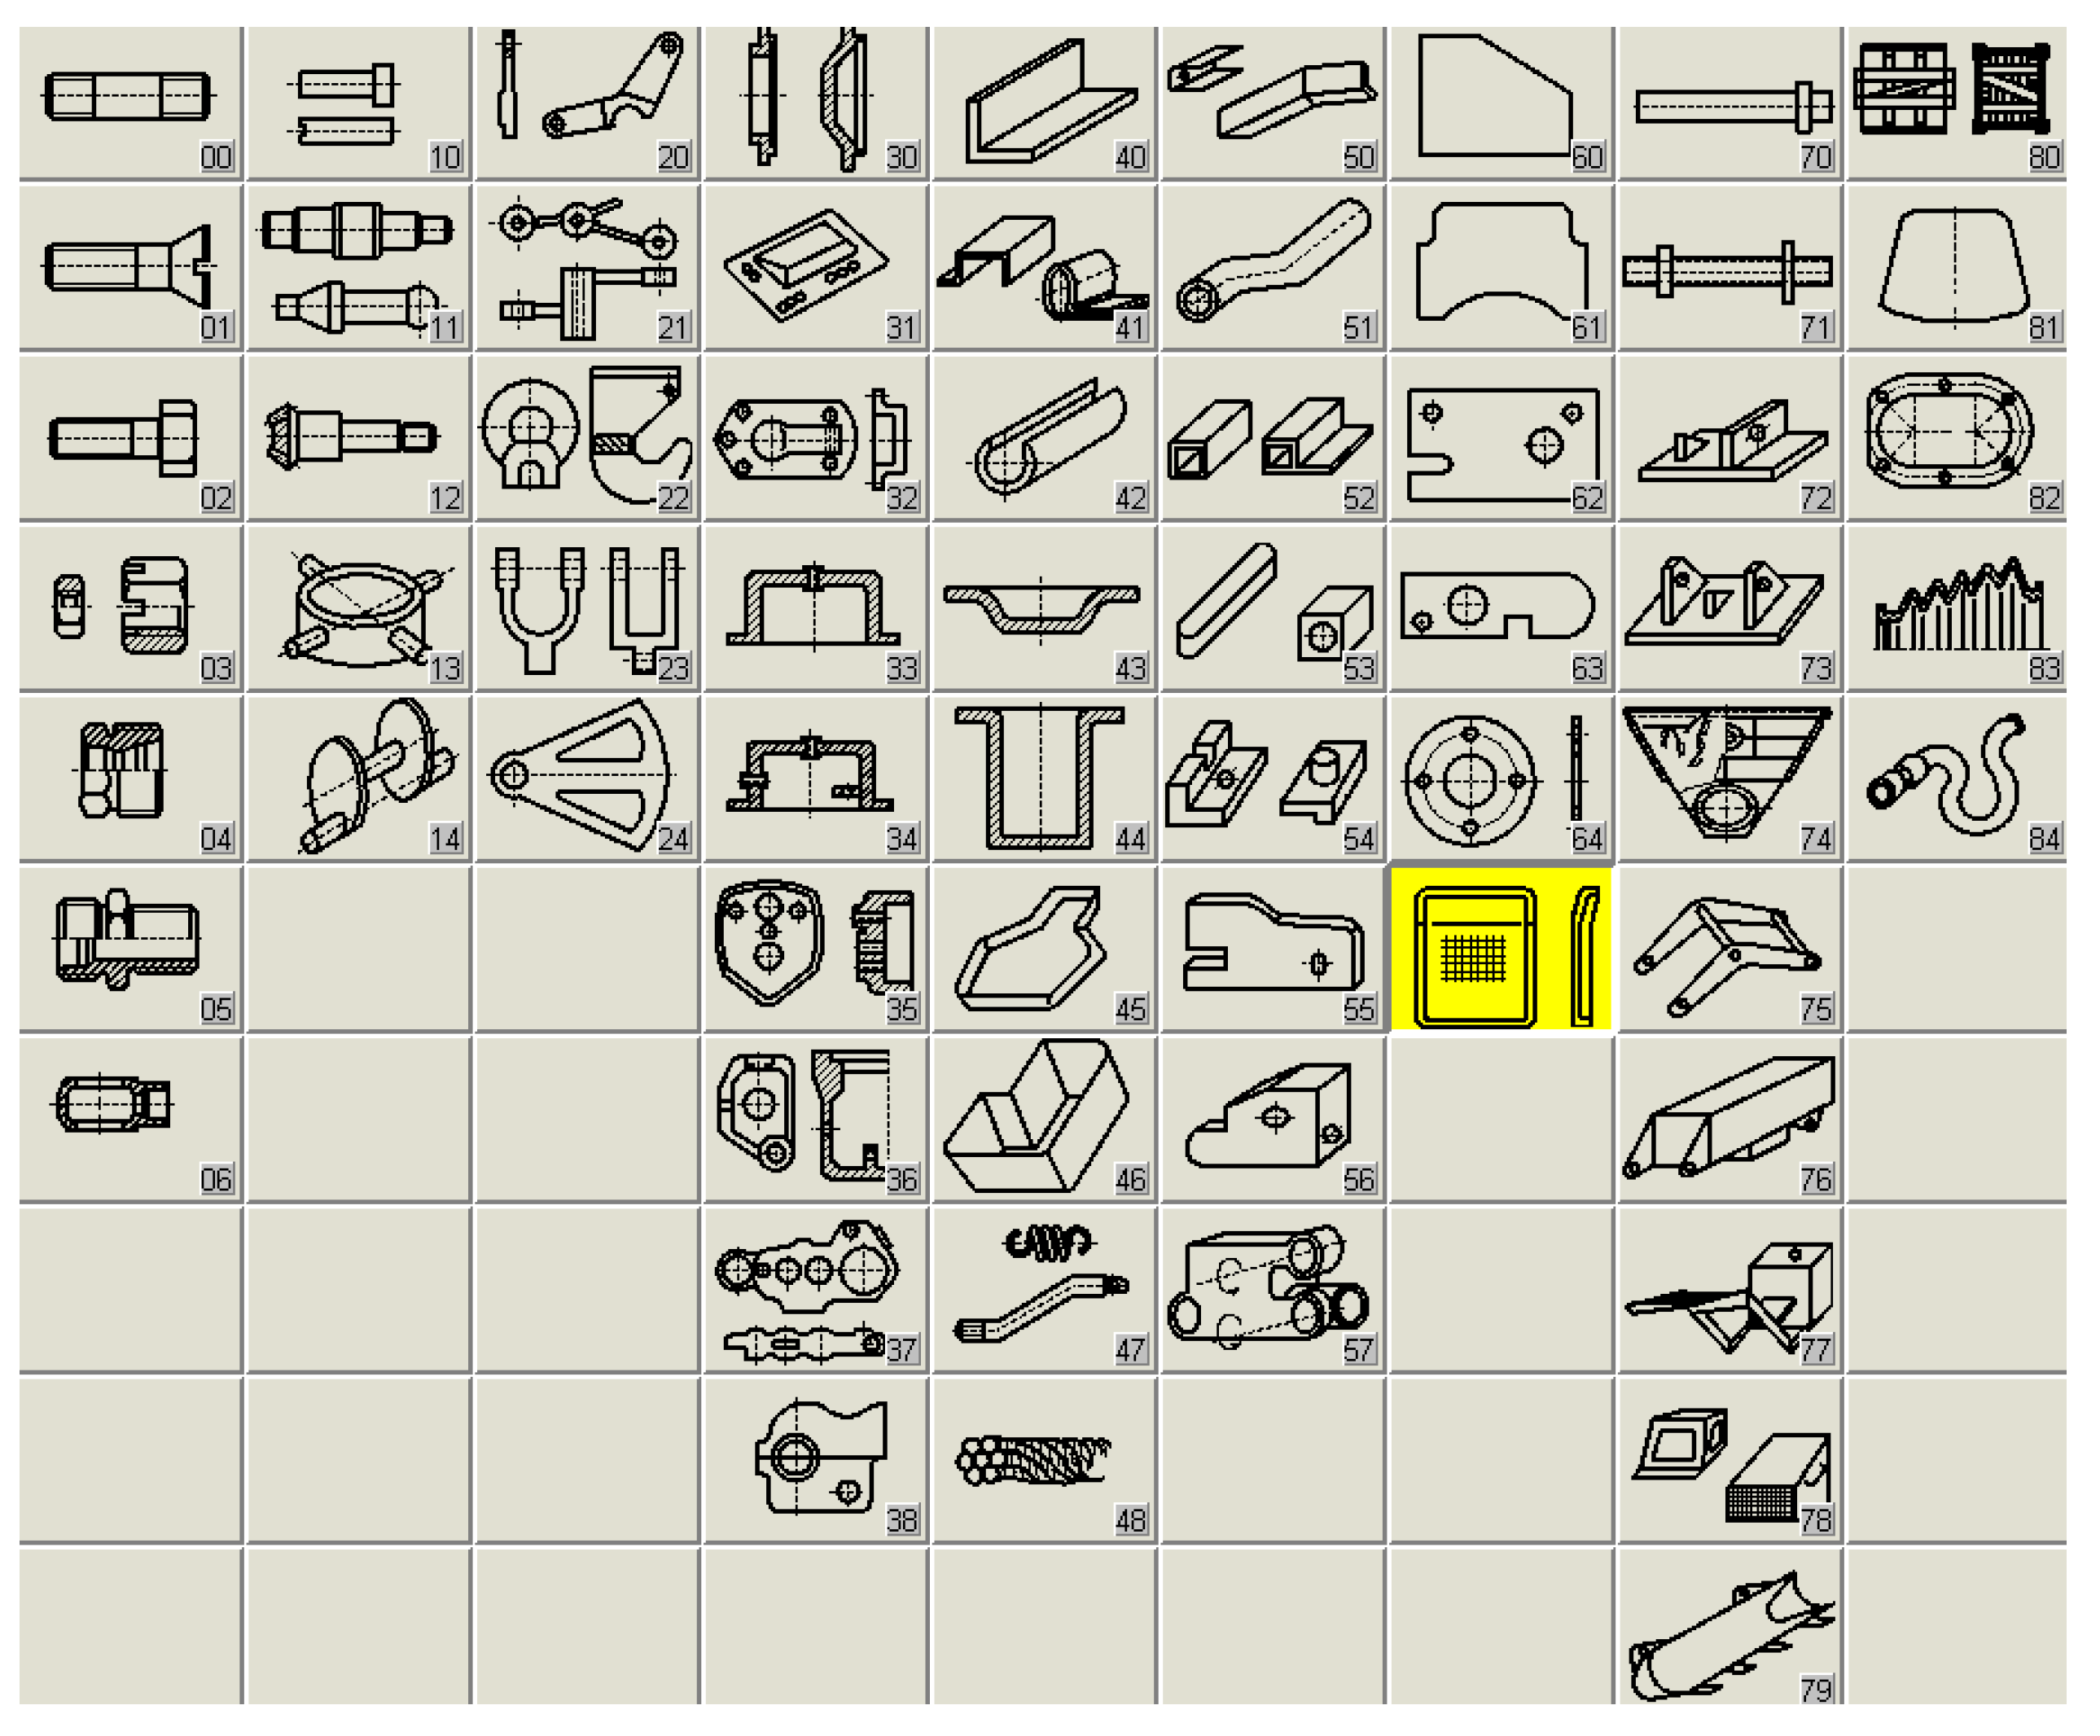
Applsci 10 03935 g010
Figure 11. Example of the first level of the production item classifier–restrictions on unnecessary diversity.
Applsci 10 03935 g011
Figure 12. Graphical representation membership functions for linguistic variables for technological capabilities.
Applsci 10 03935 g012
Figure 13. Graphical representation membership functions for linguistic variables for Software Capability.
Applsci 10 03935 g013
Figure 14. Aggregation of rules for machining technology 1.
Applsci 10 03935 g014
Figure 15. Aggregation of rules for machining technology 2.
Applsci 10 03935 g015
Figure 16. Aggregation of rules for design for machining technology 3.
Applsci 10 03935 g016
Figure 17. Aggregation of rules for design for manufacturing organization 1.
Applsci 10 03935 g017
Figure 18. Aggregation of rules for design for manufacturing organization 2.
Applsci 10 03935 g018
Figure 19. Aggregation of rules for assessment of design for manufacturing organization 3.
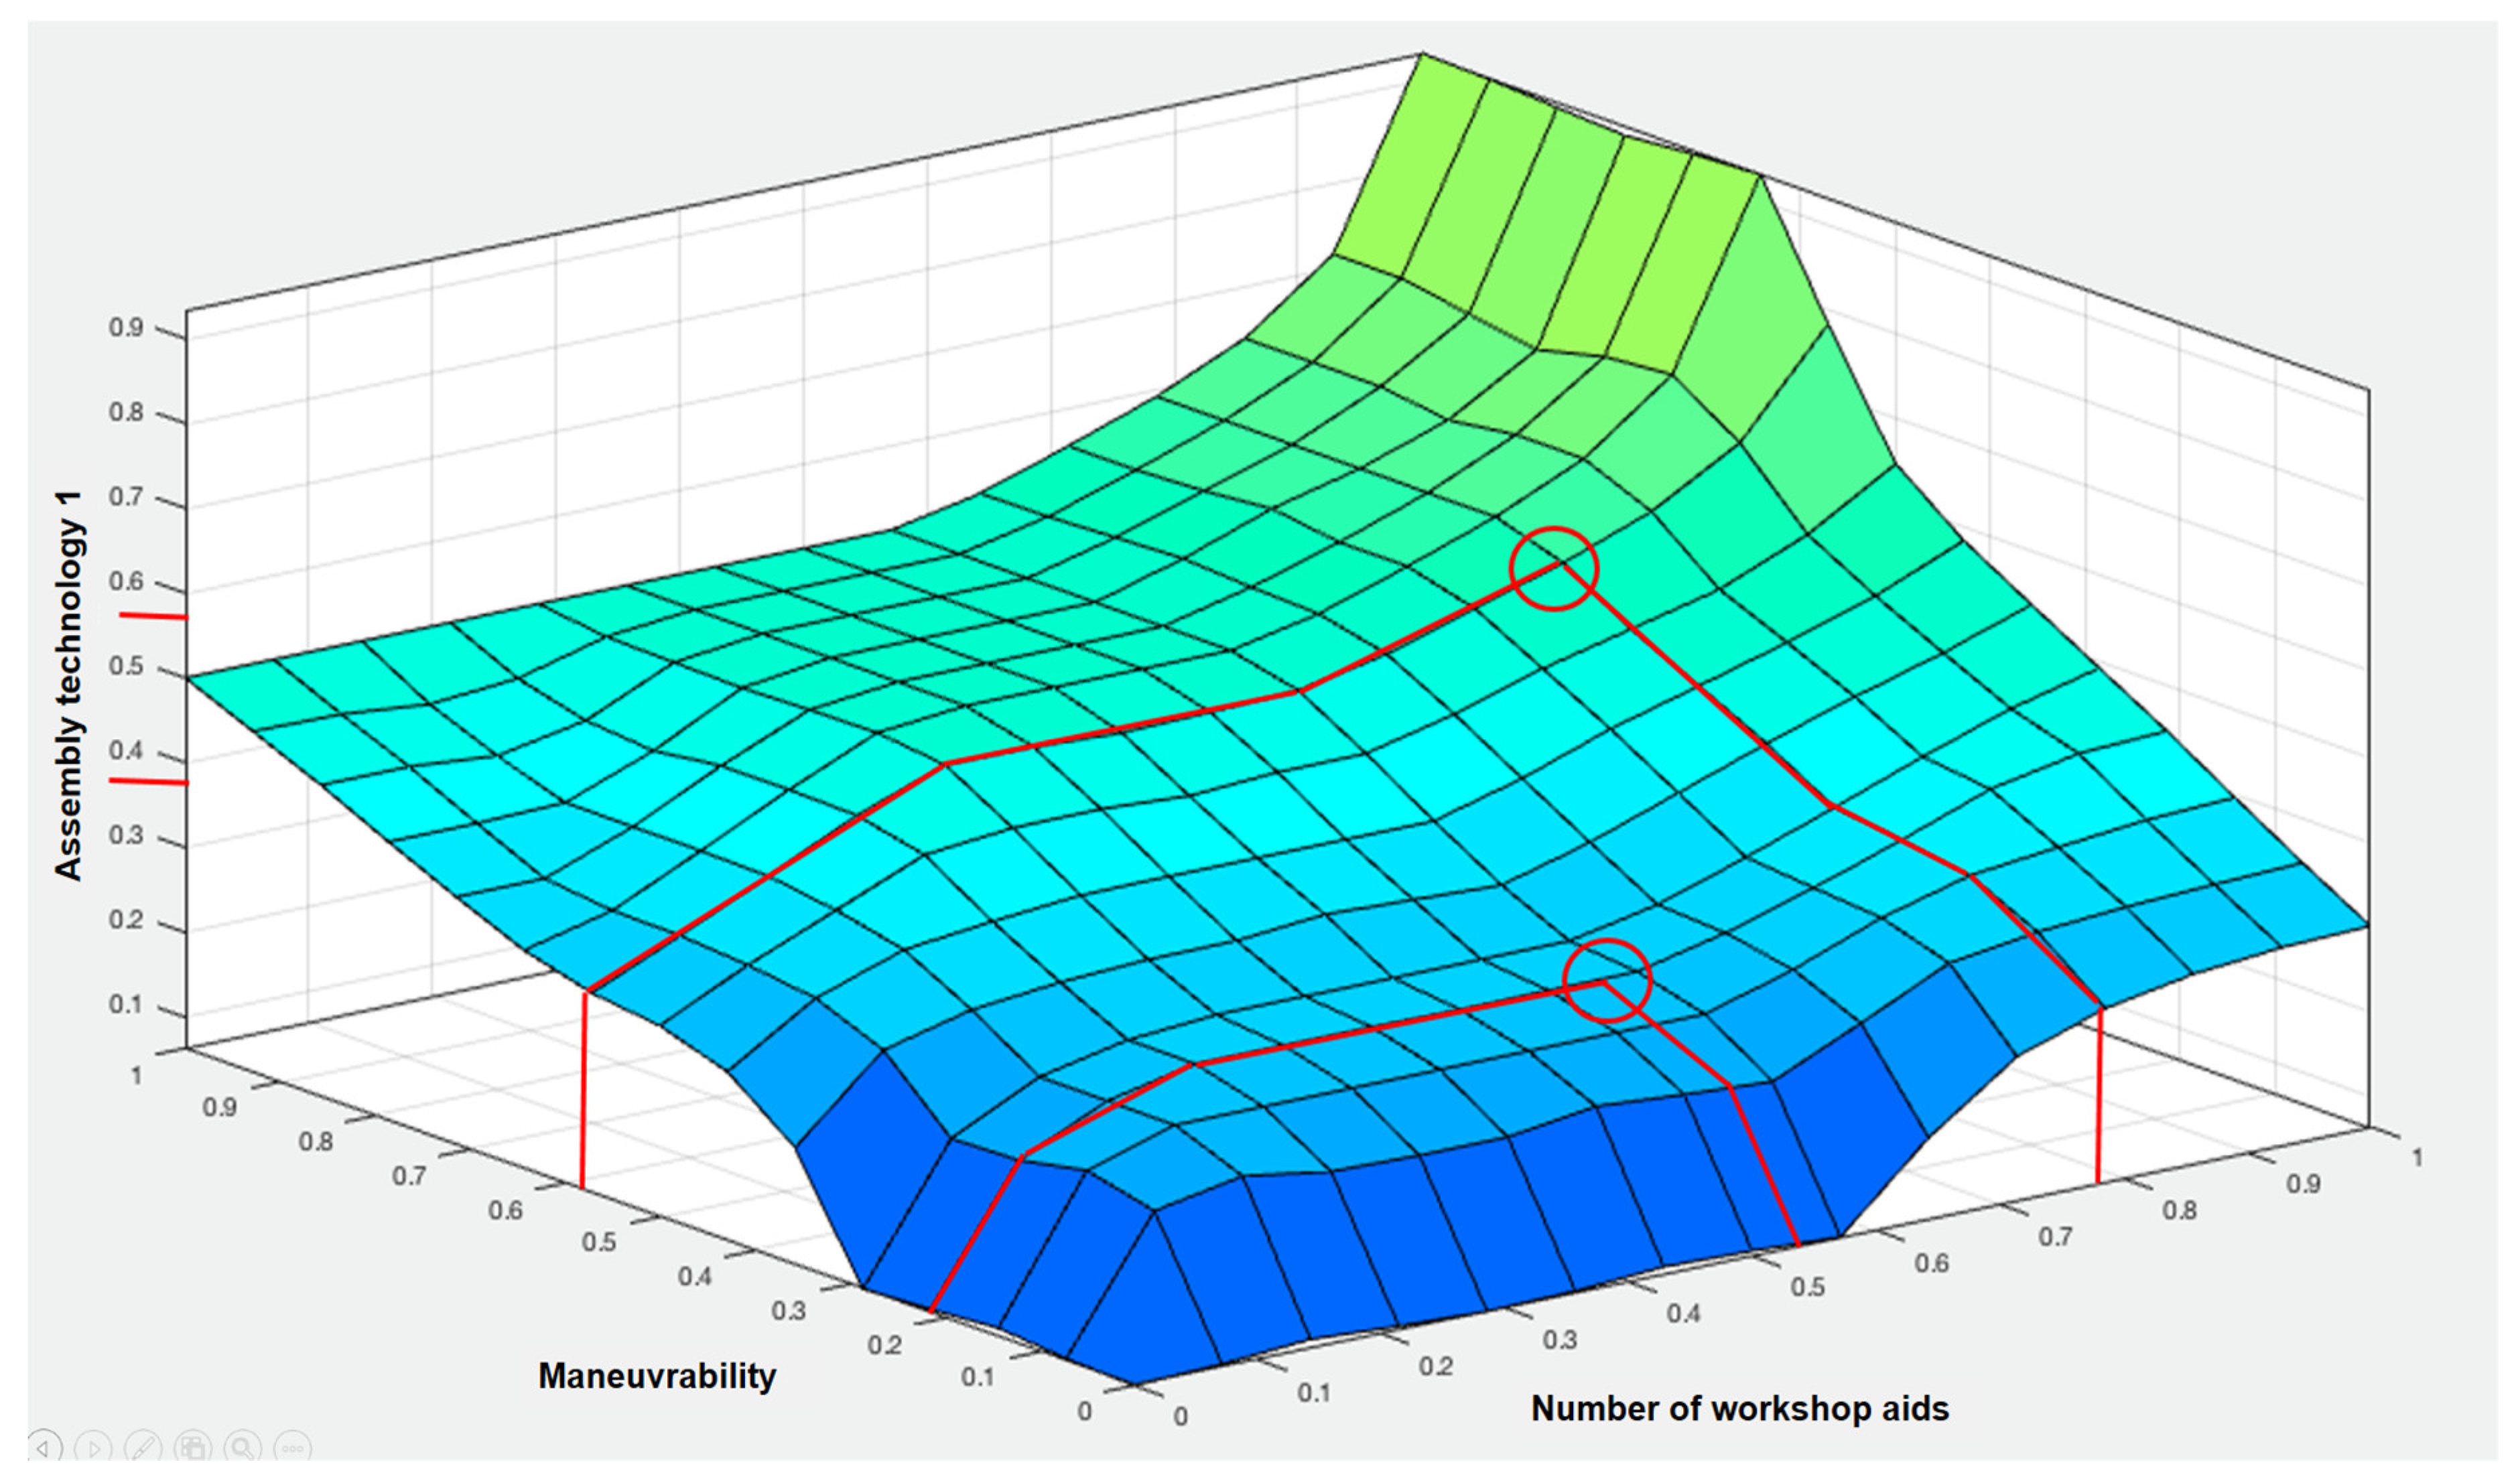
Applsci 10 03935 g019
Figure 20. Surface viewer—The surface of the dependence of the variable “installation technology 1” on the input variables for “gears”.
Applsci 10 03935 g020
Figure 21. Construction form of the gearbox after the changes were made.
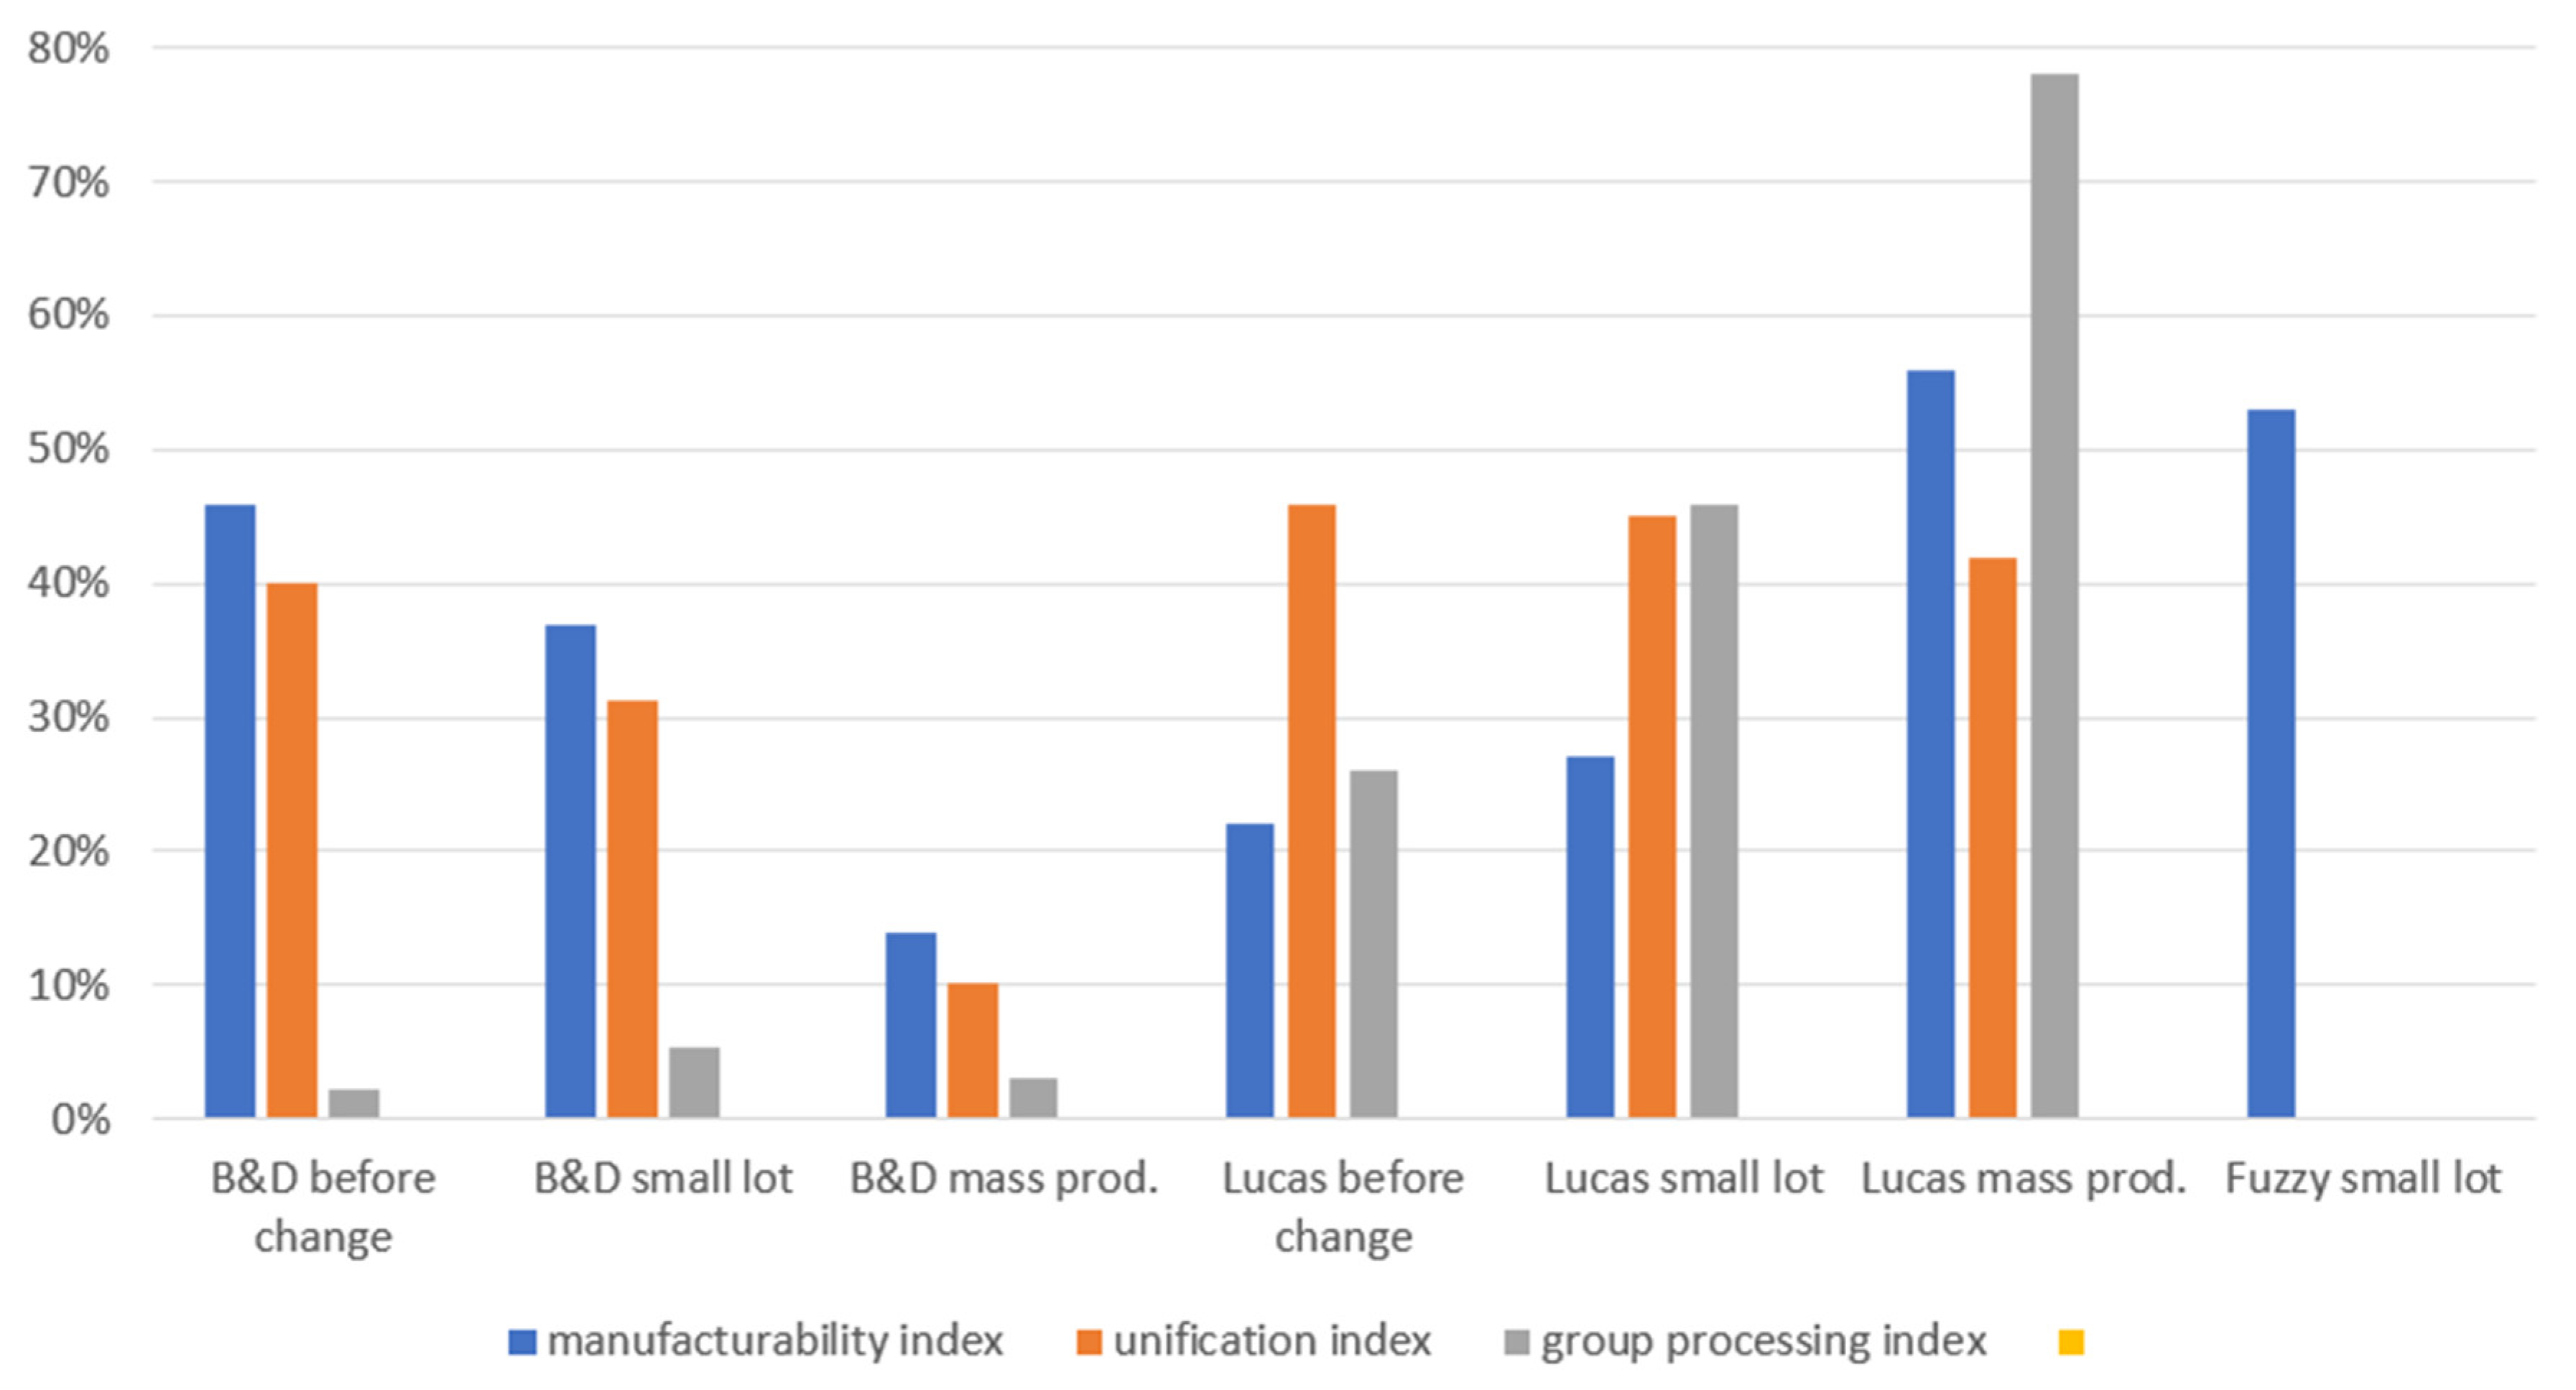
Applsci 10 03935 g021
Figure 22. Comparison of methods for gear groups.
Applsci 10 03935 g022
Table 1. Sample decision table.
x1
x2smallmediumlarge
shortbadmedium
mediumbad medium
long good
Table 2. Membership functions in tabular form of linguistic variables for “access”.
Description—AccessRank
Very difficult to access area, special care/tools/techniques required to remove the part without damaging it0
limited surface/eyesight, extreme care required to take pictures without damage30
The area has limited access, but some can be removed without damage60
The area is easy to assemble, plenty of room for hands/tools100
Table 3. Membership functions in tabular form of linguistic variables for “number of workshop aids”.
Description—Number of Workshop AidsRank
Unnecessary0
Easy to grasp0
Orientation tools in 1 axis30
Orientation tools in 2 axes30
Orientation tools in both axis60
Medium difficult tools60
Heavy nesting or tangling60
Requires a tool to grasp60
Requires 2 operators100
Requires special equipment100
Table 4. Rules database for “access”.
Access
Very DifficultRestrictedMedium RestrictedEasy
01000
300100
600010
1000001
Table 5. Rules database for “number of workshop aids”.
Number of Workshop Aids
EasyRequire OrientationHeavy/EquipmentTwo Persons
01000
300100
600010
1000001
Table 6. Fuzzy rules table for assembly technology—substep 1.
1IfAccess easyAndnumber of workshop aids two person/equipmentThenManufacturability medium law
2IfAccess easyAndnumber of workshop aids heavy or equipmentThenManufacturability medium
3IfAccess easyAndnumber of workshop aids require orientationThenManufacturability high
4IfAccess easyAndnumber of workshop aids easyThenManufacturability high
5IfAccess medium restrictedAndnumber of workshop aids two person/equipmentThenManufacturability low
6IfAccess medium restrictedAndnumber of workshop aids heavy or equipmentThenManufacturability medium law
7IfAccess medium restrictedAndnumber of workshop aids require orientationThenManufacturability medium
8IfAccess medium restrictedAndnumber of workshop aids easyThenManufacturability medium
9IfAccess restrictedAndnumber of workshop aids two person/equipmentThenManufacturability low
10IfAccess restrictedAndnumber of workshop aids heavy or equipmentThenManufacturability medium law
11IfAccess restrictedAndnumber of workshop aids require orientationThenManufacturability medium
12IfAccess restrictedAndnumber of workshop aids easyThenManufacturability medium
13IfAccess very difficultAndnumber of workshop aids two person/equipmentThenManufacturability low
14IfAccess very difficultAndnumber of workshop aids heavy or equipmentThenManufacturability low
15IfAccess very difficultAndnumber of workshop aids require orientationThenManufacturability medium law
16IfAccess very difficultAndnumber of workshop aids easyToManufacturability medium
Table 7. Membership functions in tabular form of linguistic variables for orientation.
OrientationRank
Not require orientation100
Requires orientation in the assembly axis60
Requires orientation orthogonal to the assembly axis30
Requires orientation in the assembly axis and perpendicular to the assembly axis0
Table 8. Membership functions in tabular form of linguistic variables for maneuverability.
ManeuverabilityRank
Easy to grasp (one hand)0
Easy to grasp (BH)0
Orientation to change (OH)30
Orientation to change (BH)30
Slippery60
Flexible or mall60
Heavy nesting or tangling60
Requires a tool to handle60
Requires two operators100
Requires equipment to operate100
Table 9. Rule base for orientation.
Orientation
Both AxisPerpendicular to AxisIn AxisNo Orientation
01000
300100
600010
1000001
Table 10. Rule base for maneuverability.
Maneuverability
EasyRequire orientationHeavy/EquipmentTwo Person/Equipment
01000
300100
600010
1000001
Table 11. Membership functions in tabular form of linguistic variables for assemblability.
AssemblabilityRank
Difficult access and blind assembly0
Special equipment30
Requires two hands60
No difficulty100
Table 12. Membership functions in tabular form of linguistic variables for processes.
Joining ProcessRank
Place part100
Snap fit100
Light interference60
Pressed60
Manual screwing60
Screwing with tooling30
Automatic screwing30
Riveting30
Clinching30
Soldering0
Welding0
Table 13. Set of component assessments made by experts for established criteria.
Machining
Manufacturability 1
Machining
Manufacturability 2
Machining
Manufacturability 3
Assembly Manufacturability 1Assembly
Manufacturability 2
Assembly
Manufacturability 3
Process Mgmt. Manufacturability 1Process Mgmt.
Manufacturability 2
Process Mgmt.
Manufacturability 3
Technological Capabilities Software Capability Tool Machining Capability Compliance Requirements Energy Consumption Waste, Environmental Aspects AccessNumber of Workshop AidsOrientationManoeuvrabilityAssemblabilityProcessesNumber of ComponentsPossibility of Group ProcessingNormalization, Unification of ComponentsTarget CostQuality of Assembly and DisassemblyReusing Components
Group
Gear605040704020607080706070506090806060
Main housing205510357010205510357010202010357010
Bearing807080703020609080907070506090906090
Vent706070602015456045604550506040606020
Oil sight706070602015456045604550506040606020
Washer959595951010602045204570808090908090
Cover405040358010656030606020404050508010
Add. Process959595959010901010101010101020305090
Screw807080701030507035705560604070607090
Nameplate706070602015456045604550506040606020
Shaft503540704020605080504070355040606060
Groove706070602015456045604550506040606020
Table 14. A set of fuzzy method results for individual components for specified criteria.
Machining Manufacturability 1Machining Manufacturability 2Machining Manufacturability 3Assembly Manufacturability 1Assembly Manufacturability 2Assembly Manufacturability 3Process Mgmt. Manufacturability 1Process Mgmt. Manufacturability 2Process Mgmt. Manufacturability 3
Gear0.560.550.360.50.710.550.640.760.70.59
Main housing0.30.30.360.420.310.360.40.310.360.35
Bearing0.710.610.30.50.760.560.640.560.70.59
Vent0.70.550.290.50.60.420.640.560.440.52
Oil sight0.70.550.290.50.60.420.640.560.440.52
Washer0.830.760.240.290.390.560.730.780.730.59
Cover0.440.360.380.530.50.30.440.560.380.43
Add. Process0.830.760.370.360.240.240.240.290.640.44
Screw0.710.610.250.50.540.50.560.710.710.57
Nameplate0.70.550.290.50.60.420.640.560.440.52
Shaft0.470.550.360.440.620.550.470.560.70.52
Groove0.70.550.290.50.60.420.640.560.440.52
Table 15. Comparison of methods design for manufacturability.
Lucas Manufacturability index0.3
Pressing to bearing 16Pinion shaftA1 100.10.21.3Pick up and hold down100000011
Pressing to bearing20000.70.703.44.4
Pick upMain shaftA1 100.10.21.3Pick up and place100000015.4
AssemblyWedge 23B 11000.21.2Assembly on shaft subassy10000.7001.77.1
Assembly on shaft subassyGear 5B 110.40.10.21.7Assembly on shaft subassy20.1000.70.703.510.6
Assembly on shaft subassySpacer sleeve 14B 110001Assembly on shaft subassy10.1000001.111.7
Preheating gear to 180 deg.PreheatingB 100000Prehating0000007.57.519.2
62 6.5 59.4
Boothroyd Manufacturability index0.24
Gearpressing for bearing 161371943600886.35417.513.85 YNY1
Drive gearPick up and place128216360360301.95 1.95 YNY1
GrooveAssembly11640180360201.8012.54.3 NNN0
Gear no. 5Assembly on shaft subassy141136180360886.3531511.35 NNN0
Sleeve no. 14Assembly on shaft subassy14601800001.13012.53.63 NNN0
PreheatingPreheating gear to 180 deg.1 991212 NNN0
Shaft subassemblyPressing to bearing1136216360360301.9551910.95 YYY1
7 58.03 3
Fuzzy Manufacturability index0.53
Shaft to bearingPressing to bearing0.470.550.360.440.620.550.470.560.70.52
ShaftAssembly0.470.550.360.440.620.550.470.560.70.52
GrooveAssembly0.70.550.290.50.60.420.640.560.440.52
GearAssembly on shaft subassy0.560.550.360.50.710.550.640.760.70.59
SleeeveAssembly0.710.610.30.50.760.560.640.560.70.59
PreheatingPreheating gear to 180 deg.0.830.760.370.360.240.240.240.290.640.44
Shaft subassemblyAssembly0.470.550.360.440.620.550.470.560.70.52

