Article

Unveiling a Recycling-Sourced Mineral-Biocellulose Fibre Composite for Use in Combustion-Generated NOx Mitigation Forming Plant Nutrient: Meeting Sustainability Development Goals in the Circular Economy

1
Department of Bioproducts and Biosystems, School of Chemical Engineering, Aalto University, 00076 Aalto, Helsinki, Finland
2
Faculty of Technology and Metallurgy, University of Belgrade, Karnegijeva 4, 11200 Belgrade, Serbia
3
Innovation Center of Faculty of Technology and Metallurgy Ltd., Karnegijeva 4, 11200 Belgrade, Serbia
4
Omya International AG, Baslerstrasse 42, 4665 Oftringen, Switzerland
*
Author to whom correspondence should be addressed.
Appl. Sci. 2020, 10(11), 3927; https://doi.org/10.3390/app10113927
Submission received: 12 May 2020 / Revised: 29 May 2020 / Accepted: 2 June 2020 / Published: 5 June 2020
(This article belongs to the Section Environmental Sciences)

Abstract

:

Featured Application

Surface flow filter for sorption of NOx in city/industrial pollution and conversion into a plant nutrient.

Abstract

NOx is unavoidably emitted during combustion in air at high temperature and/or pressure, which, if exceeding recommended levels, has a negative impact on the population. The authors found that when moist, limestone (CaCO3) readily sorbs NO2 to form calcium nitrate, which provides the basis for developing a surface flow filter. The substrate was made from “over-recycled” cellulose fibres such as newsprint, magazines, or packaging fibre, which are too weak to be used in further recycling. The substrate was specially-coated with fine-ground calcium carbonate and micro-nano-fibrillated cellulose, which was used as a binder and essential humectant to avoid formation of a stagnant air layer. Pre-oxidation countered the action of denitrification bacteria colonising the cellulose substrate. The by-product CO2 produced in situ during carbonate to nitrate conversion was adsorbed by perlite, which is an inert high surface-area additive. After use, the nitrate-rich CaCO3-cellulose-based filter was proposed to be mulched into a run-off resistant soil fertiliser and micronutrient suitable, e.g., for renewable forestry within the circular economy. Belgrade, Serbia, which is a highly polluted city, was used as a laboratory test bed, and NO2 was successfully removed from an inlet of city air. A construct of street-side self-draughting or municipal/commercial transport vehicle-exterior motion-draught filter boxes is discussed.

Graphical Abstract

1. Introduction

The following introduction aims to explain the claim that NOx released by any form of combustion in air at high temperature is a pollutant that will remain as transport, industry, and energy generation evolve to adopt sustainable materials and processes. It is this continuing NOx release that motivates the sustainable bio-resourced filter development presented in this paper.
Sustainable production methods and processes are either based on the best available technologies (BAT) or contribute to them. Such processes within the European Union (EU) context are certified via the controlling issuance of permits based on provided reference documents (BREFs) outlining the BATs employed. The procedures for assessing the sustainable verification of production processes in this way stems from the Industrial Emissions Directive 2010/75/EU (IED) [1]. Although the evolution of regulatory has been primarily focused on industry, the support infrastructure for industry itself has become increasingly relevant, which includes emissions contributors such as energy generation, raw material extraction, and synthesis, and required naturally resourced services such as water and air.
A prime challenge to assessing sustainability is not only defining the production process itself, but also the product arising from it with increasing scrutiny being given to ensuring product longevity, repairability, and recyclability. In defining recyclability as an aim, benefits arise only after the product lifecycle has been considerably extended. In this context, the ‘design for excellence’ (DFX) concept provides a practical tool for product engineers in which the basis has been focused on a small domestic appliance and enables a systematic assessment of products even in the concept phase to recycle after use, more specifically after ‘shredding’ [2]. Small domestic appliances are an example of the growth in the demand for sustainability with ultimate recyclability. In the context of this paper, the principles encapsulated have a far wider context when considering the design of technologies targeting the mitigation of gaseous and particulate pollutants, i.e., they are as such appliances, and should not, therefore, fail to meet the criteria of sustainability, repairability, and ultimate recyclability.
Many materials, even those sustainably sourced, ultimately fail to meet the recyclability criterion. Their properties deteriorate so drastically during recycling that they no longer meet the requirements of the product from which they are derived, and, by definition, the same product they re-use to produce. An example of this arises from the recycling of printing and writing paper and board packaging to such an extent that the cellulosic fibrous material is mechanically degraded and stripped of the necessary surface chemical bonding groups (OH), which are both needed to re-constitute a uniformly strong matrix able to meet the demands of the end-application, be it printing, binding, folding, or containment of goods during transportation and storage. Other criteria also come into play when considering the recyclability of paper and board. For example, cross-product contamination during recycling, e.g., de-inked fibre, being regarded as unsuitable for food packaging due to mineral oil residue, and derivatives arising from retained printing ink, glues, polymer binders, and more. Additionally, recycling chemical aids themselves are considered as undesirable residues, as outlined in “Guidelines on the safe use of paper and board made from recycled fibres for food contact use” (FoodDrinkEurope) [3]. This incorporates the EU Packaging and Packaging Waste Directive, and, in turn, embodies the German National Institute for Risk Evaluation (Bundesinstitut für Risikobewertung (BfR)) Recommendation XXXVI [4] or the Council of Europe Resolution RESAP (2002). The lifecycle of such materials becomes strongly limited due to their deteriorating properties and applicable regulatory requirements, and, thus, drop out of the ultimate definition of recyclability. Such materials are then mainly considered waste, and fail in terms of the standard recyclable target despite the green labelling they receive.
Transport is an integral component of local, national, and international commerce and the global economy. As a major CO2 emitter, efforts move apace to consider transport energy sources that are non-carbon based. However, frequently, the larger picture of total carbon emissions for a given transport vehicle manufacture, its energy transforming mechanism, and lifecycle use is either not considered at all or misrepresented as a side effect of political and regulatory haste in meeting the popular demand of providing a demonstrable reaction to the threat of global climate change. Recent studies have shown that misappropriation of an ill-studied or superficially evaluated assessment criterion, usually due to component isolation from the total lifecycle with respect to carbon emissions, is rife. For example, recent literature shows that the large increase in the carbon footprint arising from the duplication of motive power in hybrid vehicles, the incorporation of complex battery technology, and the accompanying demand for rapidly diminishing rare elements, including cobalt and lithium, with internal combustion engine (ICE) support, exceeds significantly the overall lifecycle vehicle carbon emissions of a solely ICE-powered unit (Buchal et al.) [5]. The same study further ranks electric vehicles, operated under today’s prevalent electricity generating plant mix in Germany, as the second largest carbon emitting option, after hybrid, available for personal automobiles. The decreasing lifecycle carbon footprint is followed by petrol, and then diesel. Such commentary is made under the caveat that eventual transformation of the electricity generation plant to fully sustainable sourcing would bring about a more level playing field for electric vehicles but does not obviate the question of sourcing increasingly rare materials often under questionable working and social conditions.
The work of Buchal et al. [5] is challenged by a contemporary report issued by the Fraunhofer ISI (Wietschel et al.) [6] in which the authors claim that “electric cars purchased and used in Germany today have a better carbon footprint than diesel or gasoline-powered cars” as quoted by Wietschel and Jung [7] who suggest that these emission savings amount to up to 28% fewer greenhouse gas emissions than a top-range diesel and up to 42% fewer than a small gasoline-powered car over a 13-year vehicle lifespan. However, to support the claim, the report specifies certain actions needed to achieve this if the market for electric vehicles grows. Namely, (i) “charging at home” using self-produced solar power, (ii) using “green electricity” from additional renewable sources, (iii) using “renewable energies” when producing batteries, and (iv) employing “smart load management” by charging on cheap tariff, which they claim coincides with a higher proportion of renewably generated electricity. Though the survey suggests that half of the owners of electric cars in Germany already draw charge from their own photovoltaic system, this shows how the owners of such cars invest personally in additional renewable generating facilities. This is partly historical due to high levels of government subsidies for solar generation installations in Germany, which is a strategy that is certainly not politically global. Though the Fraunhofer report [6] promotes these clearly beneficial developments, it effectively presents a rose-tinted view of electric vehicles that is dependent on rapid societal change, which is only to be encouraged, but it should be driven by the overall sustainability need rather than to make a choice of electric vehicle sustainable for the individual. Additionally, if the car user is dependent on the power grid and adopts “smart load management,” this will inevitably be a short-term policy. Increased vehicle charging will rapidly offset any current lower charge period, as the demand will grow per vehicle sold, which will rapidly exceed sustainable power generation. Ensuring that batteries are made using renewable energy is also a challenge, as rare earth metals are extracted in countries not readily amenable to moving from fossil fuel energy production to sustainable solutions. In short, the Fraunhofer report [6] can support longer-term change to electric vehicles, which contributes to the needed balance between pro and con arguments and the adoption of electric vehicles only where optimal.
The question of variable production from solar and wind power also remains, which urgently demands advances in electricity storage and an understanding of the implications for deciding the future transport power source. The cracking of water to release hydrogen is one of the most efficient options to provide such storage. Thus, it may be simpler to adopt hydrogen alone as the prime distributed fuel for industrial and transport needs. In such a case, the need for fuel cell technology can be removed. Ozcanli et al. describe how the rotary Wankel engine, with its extended combustion volume and ignition timing and its separation of cooler and high temperature regions to prevent premature ignition, is extremely suitable for direct hydrogen combustion [8]. Given the desire to opt for the minimal carbon emissions pathway to navigate the evolving regulatory environment aimed at promoting sustainably favourable energy sourcing and motive power, these findings indicate that ICE transition from petrol to diesel and then to hydrogen provides the greatest relief to the climate change and global resourcing threat. Even if these scientific findings are ignored and political expediency alone prevails in the field of transport, the use of hydrogen for energy storage and for industrial energy processes cannot be ignored on economic grounds. In 2019, the technology for water separation into hydrogen and oxygen took such a great a leap forward that hydrogen production efficiencies of up to 98.7% may be achievable, which could lead to a cost reduction of 50%. The technology is based on decoupling the electrolysis into two reaction steps in which the first is an electrochemical step that reduces water at the cathode while oxidising the anode. The process is then followed by a chemical step driven spontaneously at raised temperature, which reduces the anode back to its initial state by re-oxidizing water. The authors, Dotan et al., claim to be able to split water at average cell voltages of as little as 1.44 V to 1.60 V using current densities of as low as 10,200 mA·cm−2 in a two-electrode cell without needing a membrane [9]. This means that point-of-use combustion will remain and move from carbon burning to hydrogen burning. Burning, by definition, means oxidation, which is most efficient at high temperature and pressure. These are the conditions under which oxidation derived from air, which is a mix of oxygen and nitrogen, inevitably leads to the formation of oxides of nitrogen (NOx). The unavoidable consequence is that NOx pollution at ground level will remain a hazard to human health even if society becomes carbon neutral or abandons carbon altogether. It is imperative to find a way to mitigate this threat without creating further negative effects, such as ammonia release. Ammonia release can lead to particulate formation in the air when using NOx inhibitors as additives directly in the combustion environment. Therefore, capture of released NOx is a viable and sustainable approach for relieving the burden of pollution in the habitable surrounding atmosphere, i.e., a problem that can be solved at ground level while preventing the unnecessary release of excess greenhouse gases into the upper atmosphere by forcing the immediate change to electric vehicles rather than transitioning smoothly through low carbon emitting diesel and methane (natural gas) ICEs directly to zero-carbon-emitting hydrogen-powered ICEs.
Current EU regulatory demands for NO2 are shown in Table 1, and exemplify the global trend for NOx reduction.
However, the targets set by the EU are frequently breached. For example, take the distribution of excessively high NO2 concentrations in the heart of London, England, as shown by the map in Figure 1.
Due to its health impact, NO2 as a pollutant cannot be ignored without economic disadvantage. A study conducted by the publicly funded Helmholtz Centre, Munich and a private company, IVU Umwelt GmbH (Schneider et al.), used widely accepted statistical models to determine the number of premature deaths that could be attributed to NO2 [4]. The report presents a nationwide estimation of the background nitrogen dioxide (NO2) exposure for the population in Germany. It provides a subsequent quantification of the related burden of disease leading to mortality and morbidity arising from the exposure. The study covers the period from 2007 to 2014, and the analysis was modelled on data from the German Environment Agency with measured NO2 values provided by the federal government and federal states. Based on these data, the population distribution was divided into NO2-regional concentration classes. Calculated average population weighted NO2 concentration classes were used to assess the burden of disease of all defined NO2 specific health impacts, and time dependent development of exposure and resulting health effects were reported, including relevant uncertainties. Defining the relevant health outcomes was the greatest challenge in the work. The authors based their analysis on a systematic literature review and derived their considered outcomes to differentiate between natural and cause-specific death, where cause-specific death included hospital admission suffering diabetes, hypertension, heart failure, myocardial infarction, stroke, ischemic heart disease, lung cancer, asthma, chronic bronchitis, COPD (chronic obstructive pulmonary disease), premature birth, and low birth weight. Strong evidence was found for long-term cardiovascular mortality. Short-term effects within the total natural mortality and respiratory mortality also showed strong correlation. Based on an assumed 10 μg·m−3 NO2 concentration determined from NO2 annual mean concentrations, the findings reported 5,966 (95% confidence interval: 2,031 to 9,893) premature deaths and 49,726 (16,929 to 82,456) years of life lost (YLL) due to NO2-attributable cardiovascular mortality from long-term exposure for 2014 (Table 2). Between 2007 and 2014, an overall slightly decreasing trend was seen for attributable premature deaths. The report states that it is important to recognise that the estimates of the burden of disease were solely based on background concentrations for NO2 and, thus, do not account for the expected extra burden from higher concentrations found in urban areas close to traffic. In addition, it must be recognised that the background level is mainly contributed to by the migration of roadway and industrial pollution emissions from concentrated regions of traffic and industrial activity. Therefore, mitigation near the point of emission is particularly effective in reducing background exposure.
The economic value of a life year (VOLY) is complex to estimate. However, various reports, such as the Science for Environment Policy document 2018, European Commission [10], quote a European VOLY of €40,000 given by Desaigues et al. [11]. Although this is only one such estimate, the data from Table 2, which indicates years of life lost (YLL) of approximately 100 per 100,000 population in an industrial, high-living-standard country, such as Germany, means an economic burden of at least €4 million (4 M €) per 100,000 population throughout the EU. Therefore, given the total EU population of 513.5 million (2019), one can estimate a figure of 20.54 G € in annual economic burden due to NO2 alone.
The prediction of continued NO2 generation despite changes to a carbon-free economy provides irrefutable evidence for government acceptance and financial support for NO2 mitigation to offset the economic burden of the ensuing years of life lost (YLL).
The two facets of this introductory exposé, i.e., the need to engender a circular economy approach by finding a further use for otherwise denatured recycled natural cellulose fibres and the foreseeable omnipresent need to mitigate NOx gaseous pollution, form the motivation to seek a technological advance to encompass these aims into a working hypothesis from which an effective NOx sorbing filter can be developed. Sustainability is not served by creating further waste, regardless of the effectiveness of the technology employed for NOx capture. In light of this further constraint and the wish to both follow BAT and provide the necessary BREFs for eventual permit issuance, the choice of sorbent and filter material support is critical. Minerals of various types are known to adsorb oxides of nitrogen. The very principle of surface area measurement of fine materials using the Brunauer-Teller-Emmett (BET) method [12] relies on the inert surface adsorption of gas as a function of applied partial pressure, first as a monomolecular surface layer and, later, as gas pressure increases, as a multilayer condensate that reveals the presence of surface micropores and mesopores. Therefore, the choice of any material having sufficient surface area and sorption potential to adsorb oxides of nitrogen under ambient atmospheric conditions would suffice. However, to prevent desorption under subsequent changes in environmental conditions, and to enhance the total capacity of the process for NOx storage beyond that of surface saturation alone, it is beneficial to have a material that promotes a material surface conversion reaction rather than pure adsorption, which enables the ultimate complete transformation of the host sorbent into a stable nitrogen species such as a nitrate salt. In addition, if the nitrate salt itself can contribute to a further sought-after product, then it not only supplies a solution for mitigation but also valorises a pollutant gas by generating an onward use, which results in significant contribution to the circular economy.
In light of the stoichiometric reaction for calcium carbonate in the form of ground limestone or marble, such as architectural waste cuttings, with NOx gas in the presence of moisture, as shown in Equation (1), it can be hypothesised that, under conditions of sufficient exposure to NOx, calcium nitrate (Ca(NO3)2) can be generated. Calcium nitrate is considered a premium fertiliser for use in horticulture as a concentrate or hydroponic nutrient and, in slurry dilution, for agricultural crops and sustainable forestry plantations.
CaCO3 + H2O + 2NOx = 1,2 + ½ O2→Ca(NO2,3)2 + H2CO3
Furthermore, where calcium micronutrient is required, such as for repeated cycles of forestry re-planting and fruit production in which mineral depletion can become endemic, Ca(NO3)2 can advantageously dissociate readily into Ca2+ for mineralisation and 2NO3 for promoting plant growth. In addition, if magnesium deficiency occurs, then dolomitic stone (CaMg(CO3)2) can be used in place of limestone (CaCO3) to rectify it.
The following report unveils the step-by-step actions taken and solutions that have been found to achieve proof-of-principle in the development of a working model filter-element structure suitable for either a pressure-driven through-flow or, preferentially, a zero-energy-acting surface flow concept for NOx capture. The filter element was formed by coating calcium carbonate, either as valorised ground mineral product (tailings or cuttings waste), or, if needed, specially treated for additional functionality on a porous carrier consisting of no-longer-viable recycling-sourced cellulose paper fibre. In this way, the target of NOx capture extended further to form a mineralic micronutrient nitrate-based fertiliser, which could be used as an aqueous humus mulch after re-pulping. If needed, the mulch could be dried into a concentrate, or the nitrate could be extracted by washing to form a value-added calcium nitrate concentrate. In this way, the target of contributing to the circular economy concept would be fully realisable (Figure 2). A further environmentally driven advantage of using cellulose as the substrate is its ability to enhance water retention in the soil. This is a factor that both benefits plants under conditions of higher temperature and drought as a result of climate change and acts to reduce agricultural nutrient run-off. Run-off is considered one of the most prevalent pollution mechanisms of waterways and oceans, as it leads to algal blooms that cause de-oxygenation and subsequent catastrophic depletion of fish and other aquatic organisms.
The development described in this work meets or contributes to the United Nations’ sustainability development goals (Figure 3a) No. 2, zero hunger (via plant nutrition), No. 3, good health and well-being (by capturing a health-risk pollutant), No. 7, affordable and clean energy (by supporting sustainable energy sourcing and storage options), No. 8, industry, innovation and infrastructure (innovative solutions involving industry and preserving infrastructure–transport), No. 11, sustainable cities and communities (retaining drivers for economic activity and removing pollutants), No. 12, responsible consumption and production (enabling sustainable energy use for vehicle construction, transport, and manufacturing), No. 13, climate action (supporting the path to zero carbon emissions via a route of minimum carbon emission evolution amongst available options in a given sector), No. 14, life below water (the water retention of cellulose reduces nutrient run-off from soil), No. 15, life on land (again via plant nutrition), and No. 17, partnerships for sustainability goals (by being an international collaboration between two academic institutions and a global renewable mineral pigment supplier company). It falls within the concept of circular economy (Figure 3b).

2. Materials and Material Production
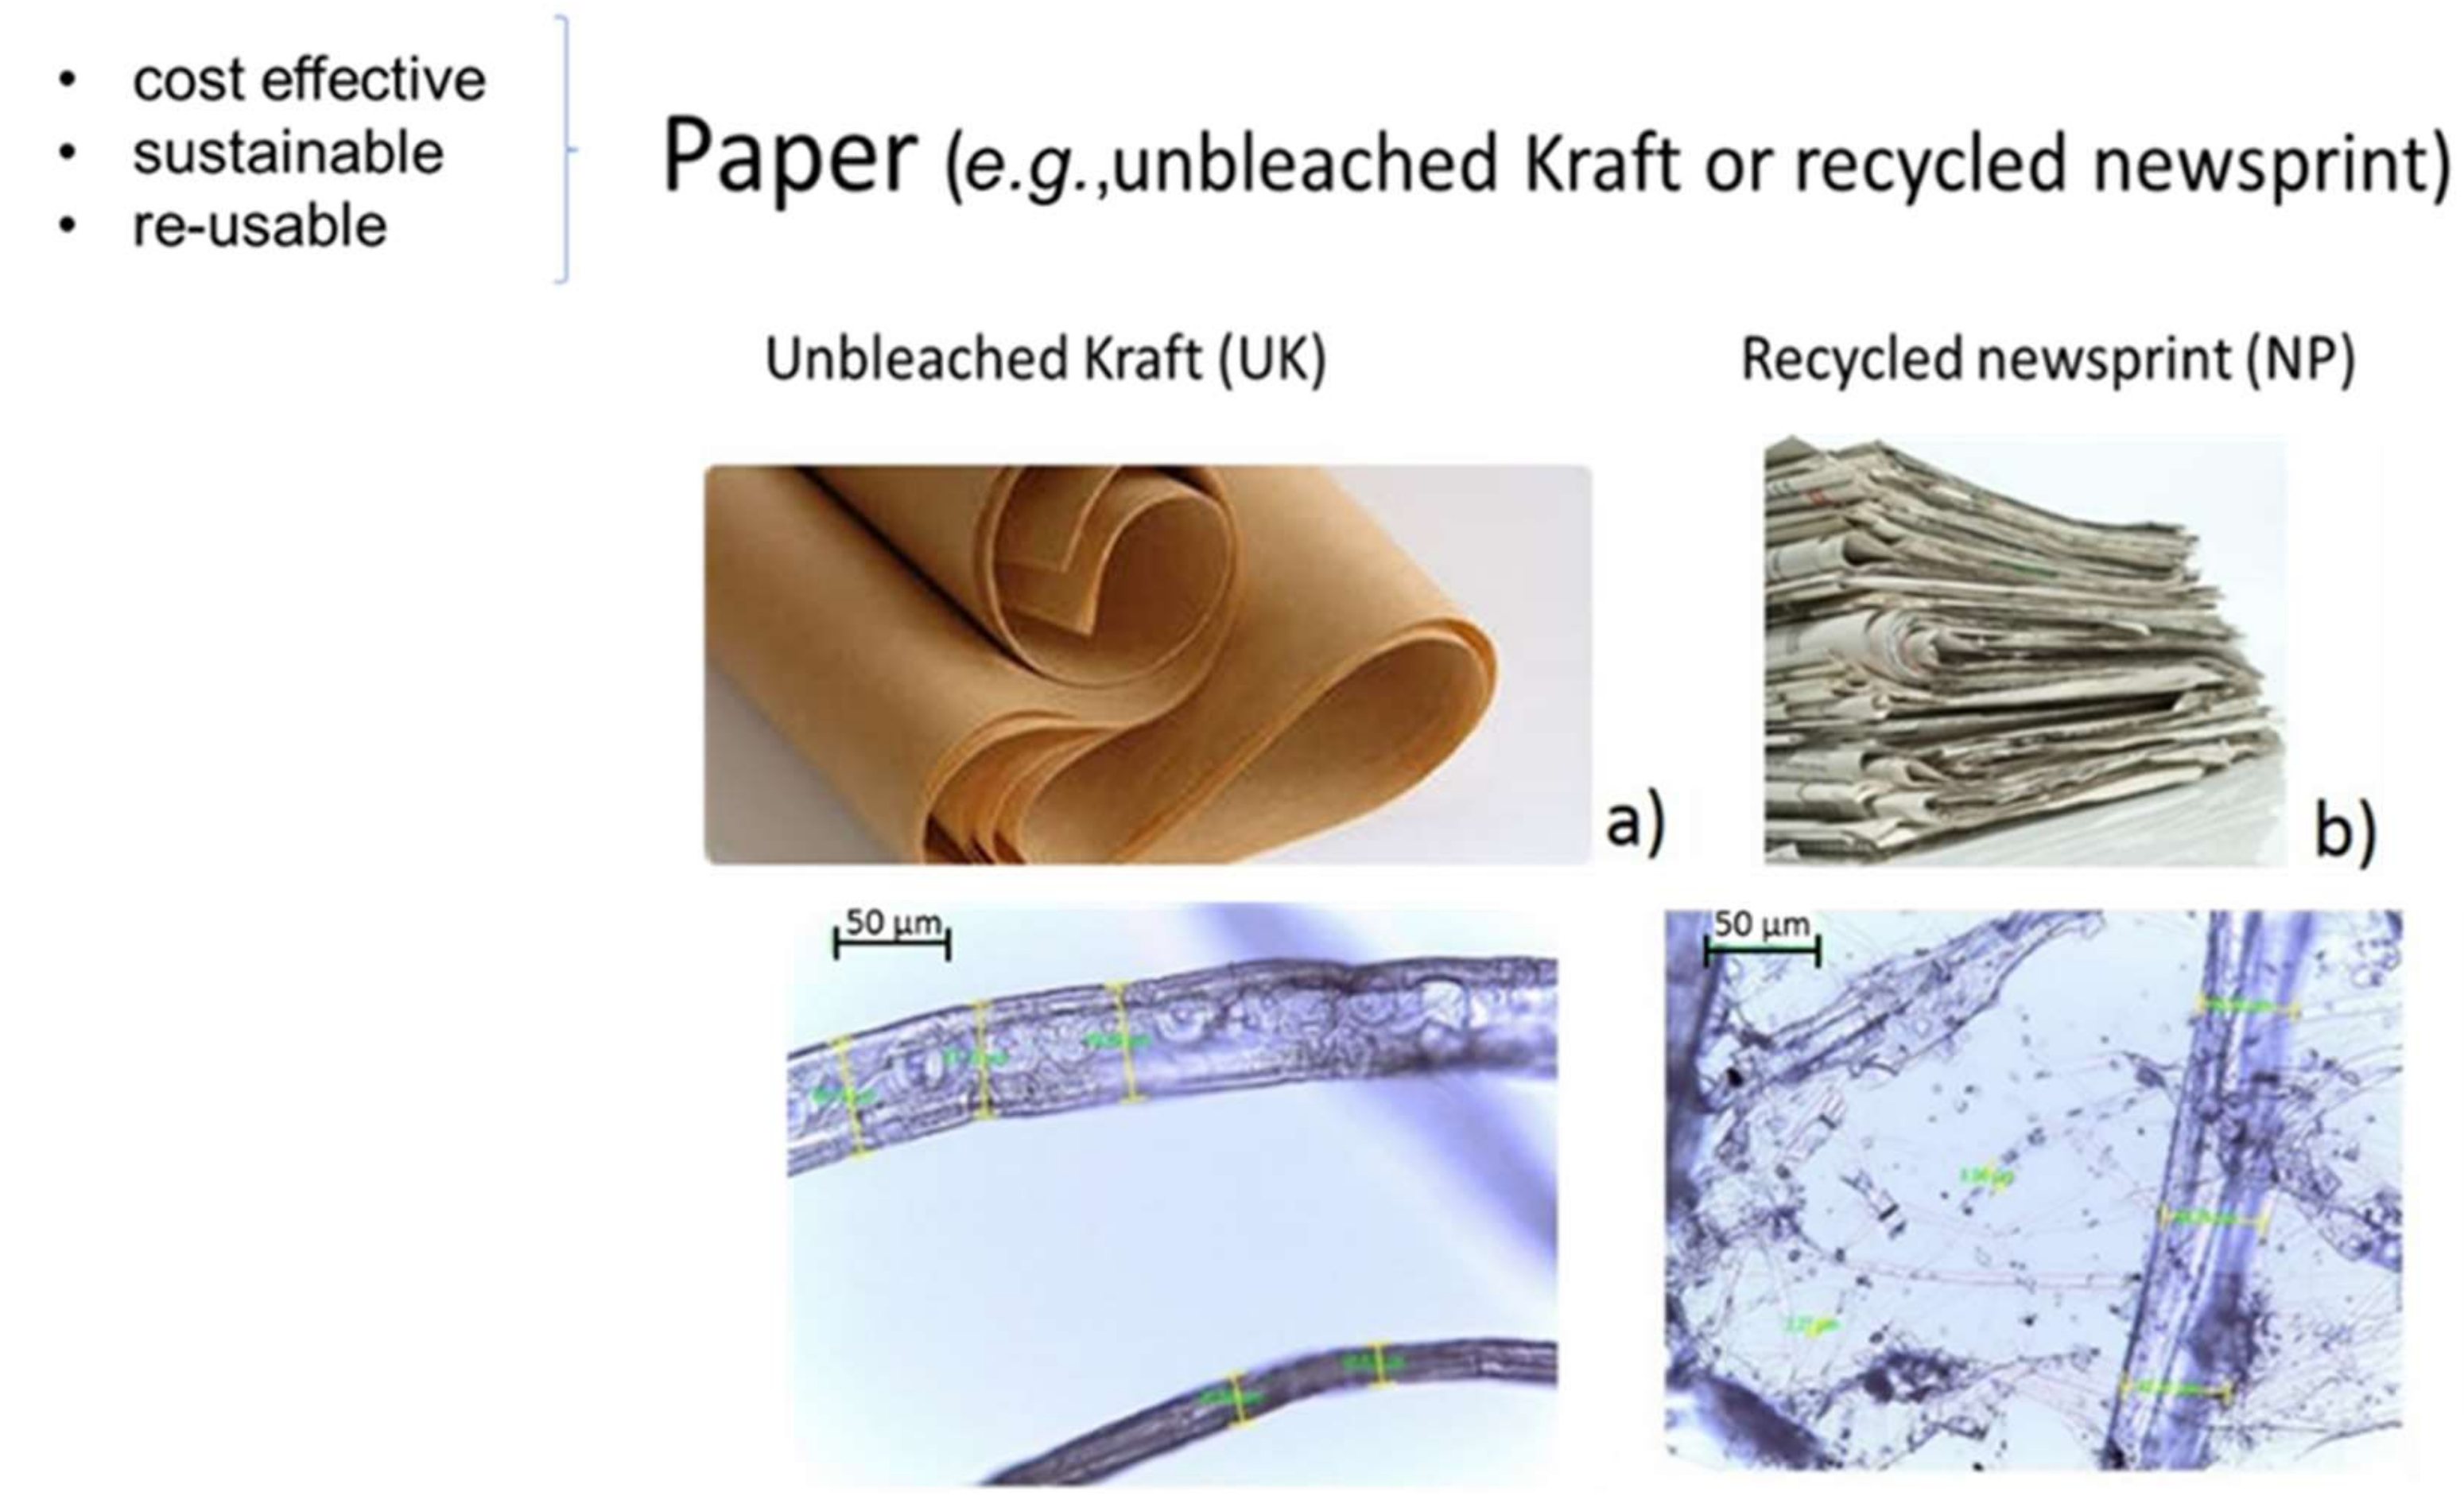
2.1. Substrate

Recycled printed newsprint was re-pulped and the resulting fibre structure was compared with once-dried, unbleached, virgin birch Kraft pulp. Each respective pulp was repeatedly washed and made into an aqueous suspension using a disintegrator (Lorentzen, and Wettre (ABB Group), Kista, Sweden). Following disintegration, the suspension was diluted to 1 w/w% in a high shear laboratory mixer.
The differences in fibre quality are shown in Figure 4. The virgin fibre was fully intact and structurally complete over its whole length, whereas the multiple recycled fibres were smaller, finer, and showed a broad size distribution. Fibre structural integrity determines the strength of paper, and the highly recycled fibres were naturally weak and displayed poor sheet strength. Recycled fibre of such a weakness is unsuitable for normal papermaking designed for printing and packaging. However, despite the shortage of recycled fibre needed for packaging, this over-recycled fibre is commercially plentiful and would go to a landfill as a waste product. Even if sourcing such fibre might prove difficult initially, until the proposed technology becomes mainstream, unbleached lignin-containing Kraft pulp is low cost and highly sustainable when sourced from managed forests that encourage the uptake of CO2, which contributes to the efforts to reduce greenhouse gas concentrations.
Hand sheets were formed (Figure 5) at a weight of approximately 80 g·m−2 using a laboratory hand sheet former. Starting solids content in the former was 0.24 w/w%, and drainage was made from 663 g of pulp suspension. After wet forming, the hand sheets were wet pressed and left to dry for 24 h in a conditioned room (relative humidity (RH) 50% at 23 °C) [13,14,15]. The sheets were constrained in drying frames to prevent shrinkage by clamping the position in contact with in-frame mounted cotton sheets. Brightness was not important for this application. Therefore, both the brown unbleached Kraft and the grey newsprint provided the necessary substrate support for subsequent application of the NOx reactive coating.
The mechanical and physical properties of the hand sheets, including density and porosity, were determined and shown in Table 3.

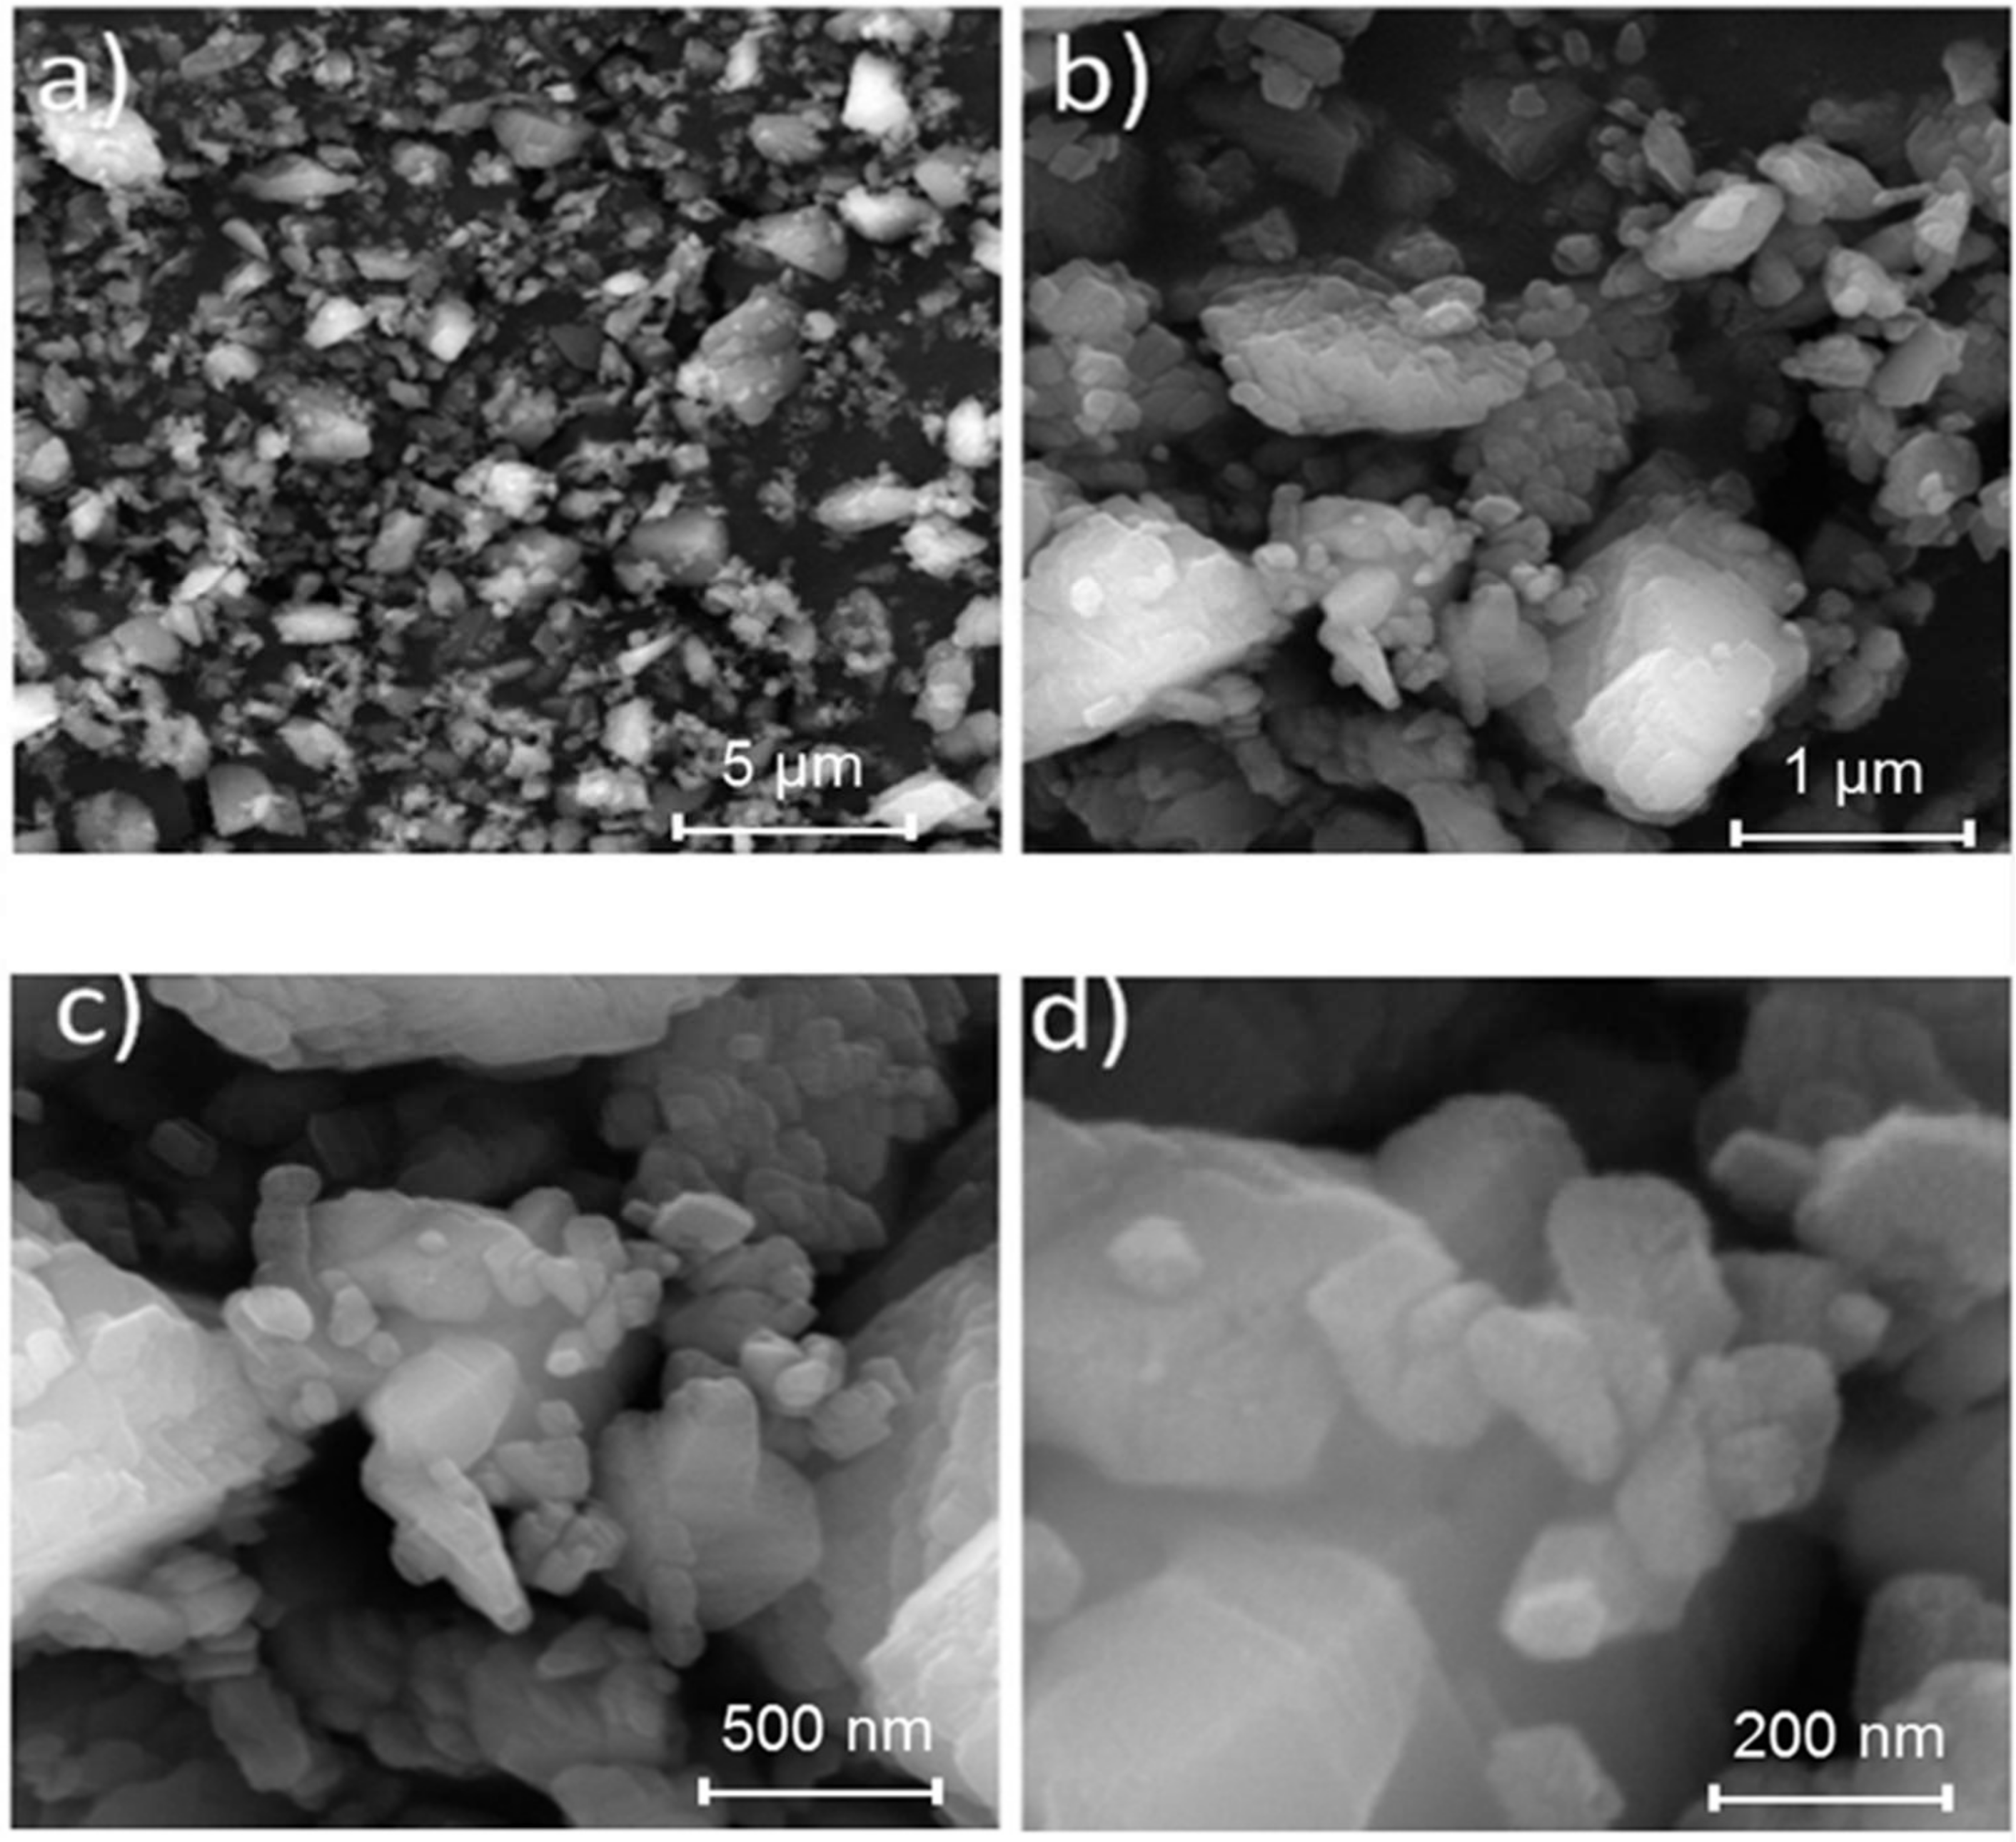
2.2. Reactive Coating

Following the reaction shown in Equation (1), calcium carbonate forms the sacrificial reactive component. To support sustainability, rather than using synthetic precipitated calcium carbonate, which relies on the production of burnt lime (a major emitter of CO2) and, thus, contributes to the greenhouse gas load, ground calcium carbonate (GCC) was chosen as the preferred resource. Additionally, GCC can be produced from waste limestone and marble arising from architectural cladding production as a result of sawing and blasting. Another environmentally-friendly source of marble can be found in underground deposits by avoiding open-pit scarring of the landscape, and by being ground to the required fine particle size using carbon-free hydroelectric power. This latter route is exemplified by production on the west coast of Norway, which has excellent shipping access for effective long-range transport. A further alternative is using calcium carbonate or dolomite sources located near their end use, and dry milling plants exist globally for the sustainable production of low-cost GCC.
In this study, GCC was made from Norwegian marble, which was wet ground and chemical-free (Omya Hustadmarmor AS, Molde, Norway). Field emission scanning electron microscope (FESEM) images (JEM-2200FS; JEOL Ltd., Akashima, Tokyo, Japan) of the fine ground material are shown in Figure 6.
Marble and limestone exhibit the calcitic crystal form, having a rhombohedral micro habit. The product, Covercarb 60 ME (nominally individual dispersed particle size distribution being 60 w/w% < 1 μm and 95 w/w% < 2 μm with a Zeta potential of ζ = −27.13 mV, at pH 9.2) was supplied by Omya International AG (Oftringen, Switzerland) in a dispersant-free crumble-like form. The material was produced by wet grinding and dewatered by filtration (Omya Hustadmarmor AS, Molde, Norway). Though less important in this context, the product was extremely pure and had high brightness, as it had an ISO brightness ≥ 96%.
The particle size in the undispersed (as delivered) state was measured using static laser light diffraction as a function of the scattering angle. The GCC particle size values were taken as the equivalent light scattering diameter, d, cumulatively distributed over volume% (v/v%) of the particles smaller than or equal to d and are shown in Table 4.
The GCC was dispersant-free to maintain a chemical-free surface on the particles. This means that the particle size values in Table 4 were not expected to match the distribution of single particles in aqueous suspension, as the particles were likely flocculated due to the missing stabiliser. Evidence for this is seen by the floc size reduction after ultrasonication in the aqueous suspension. This was an advantage in the coating due to enhanced gas permeation and associated gas sorption.
The surface characteristics of the GCC particles are summarised in Table 5. A specific surface area (SSA) was calculated from the linear part of the BET nitrogen adsorption isotherms [12] with total pore volume (Vtot) given at relative pressure p/p0 = 0.998. The volume of the mesopores (Vmeso) was calculated according to the Barrett, Joyner, and Halenda (BJH) method [16] applied to the desorption branch of the isotherm, and the volume of micropores (Vmicro) was calculated from the alpha-S plot [17].

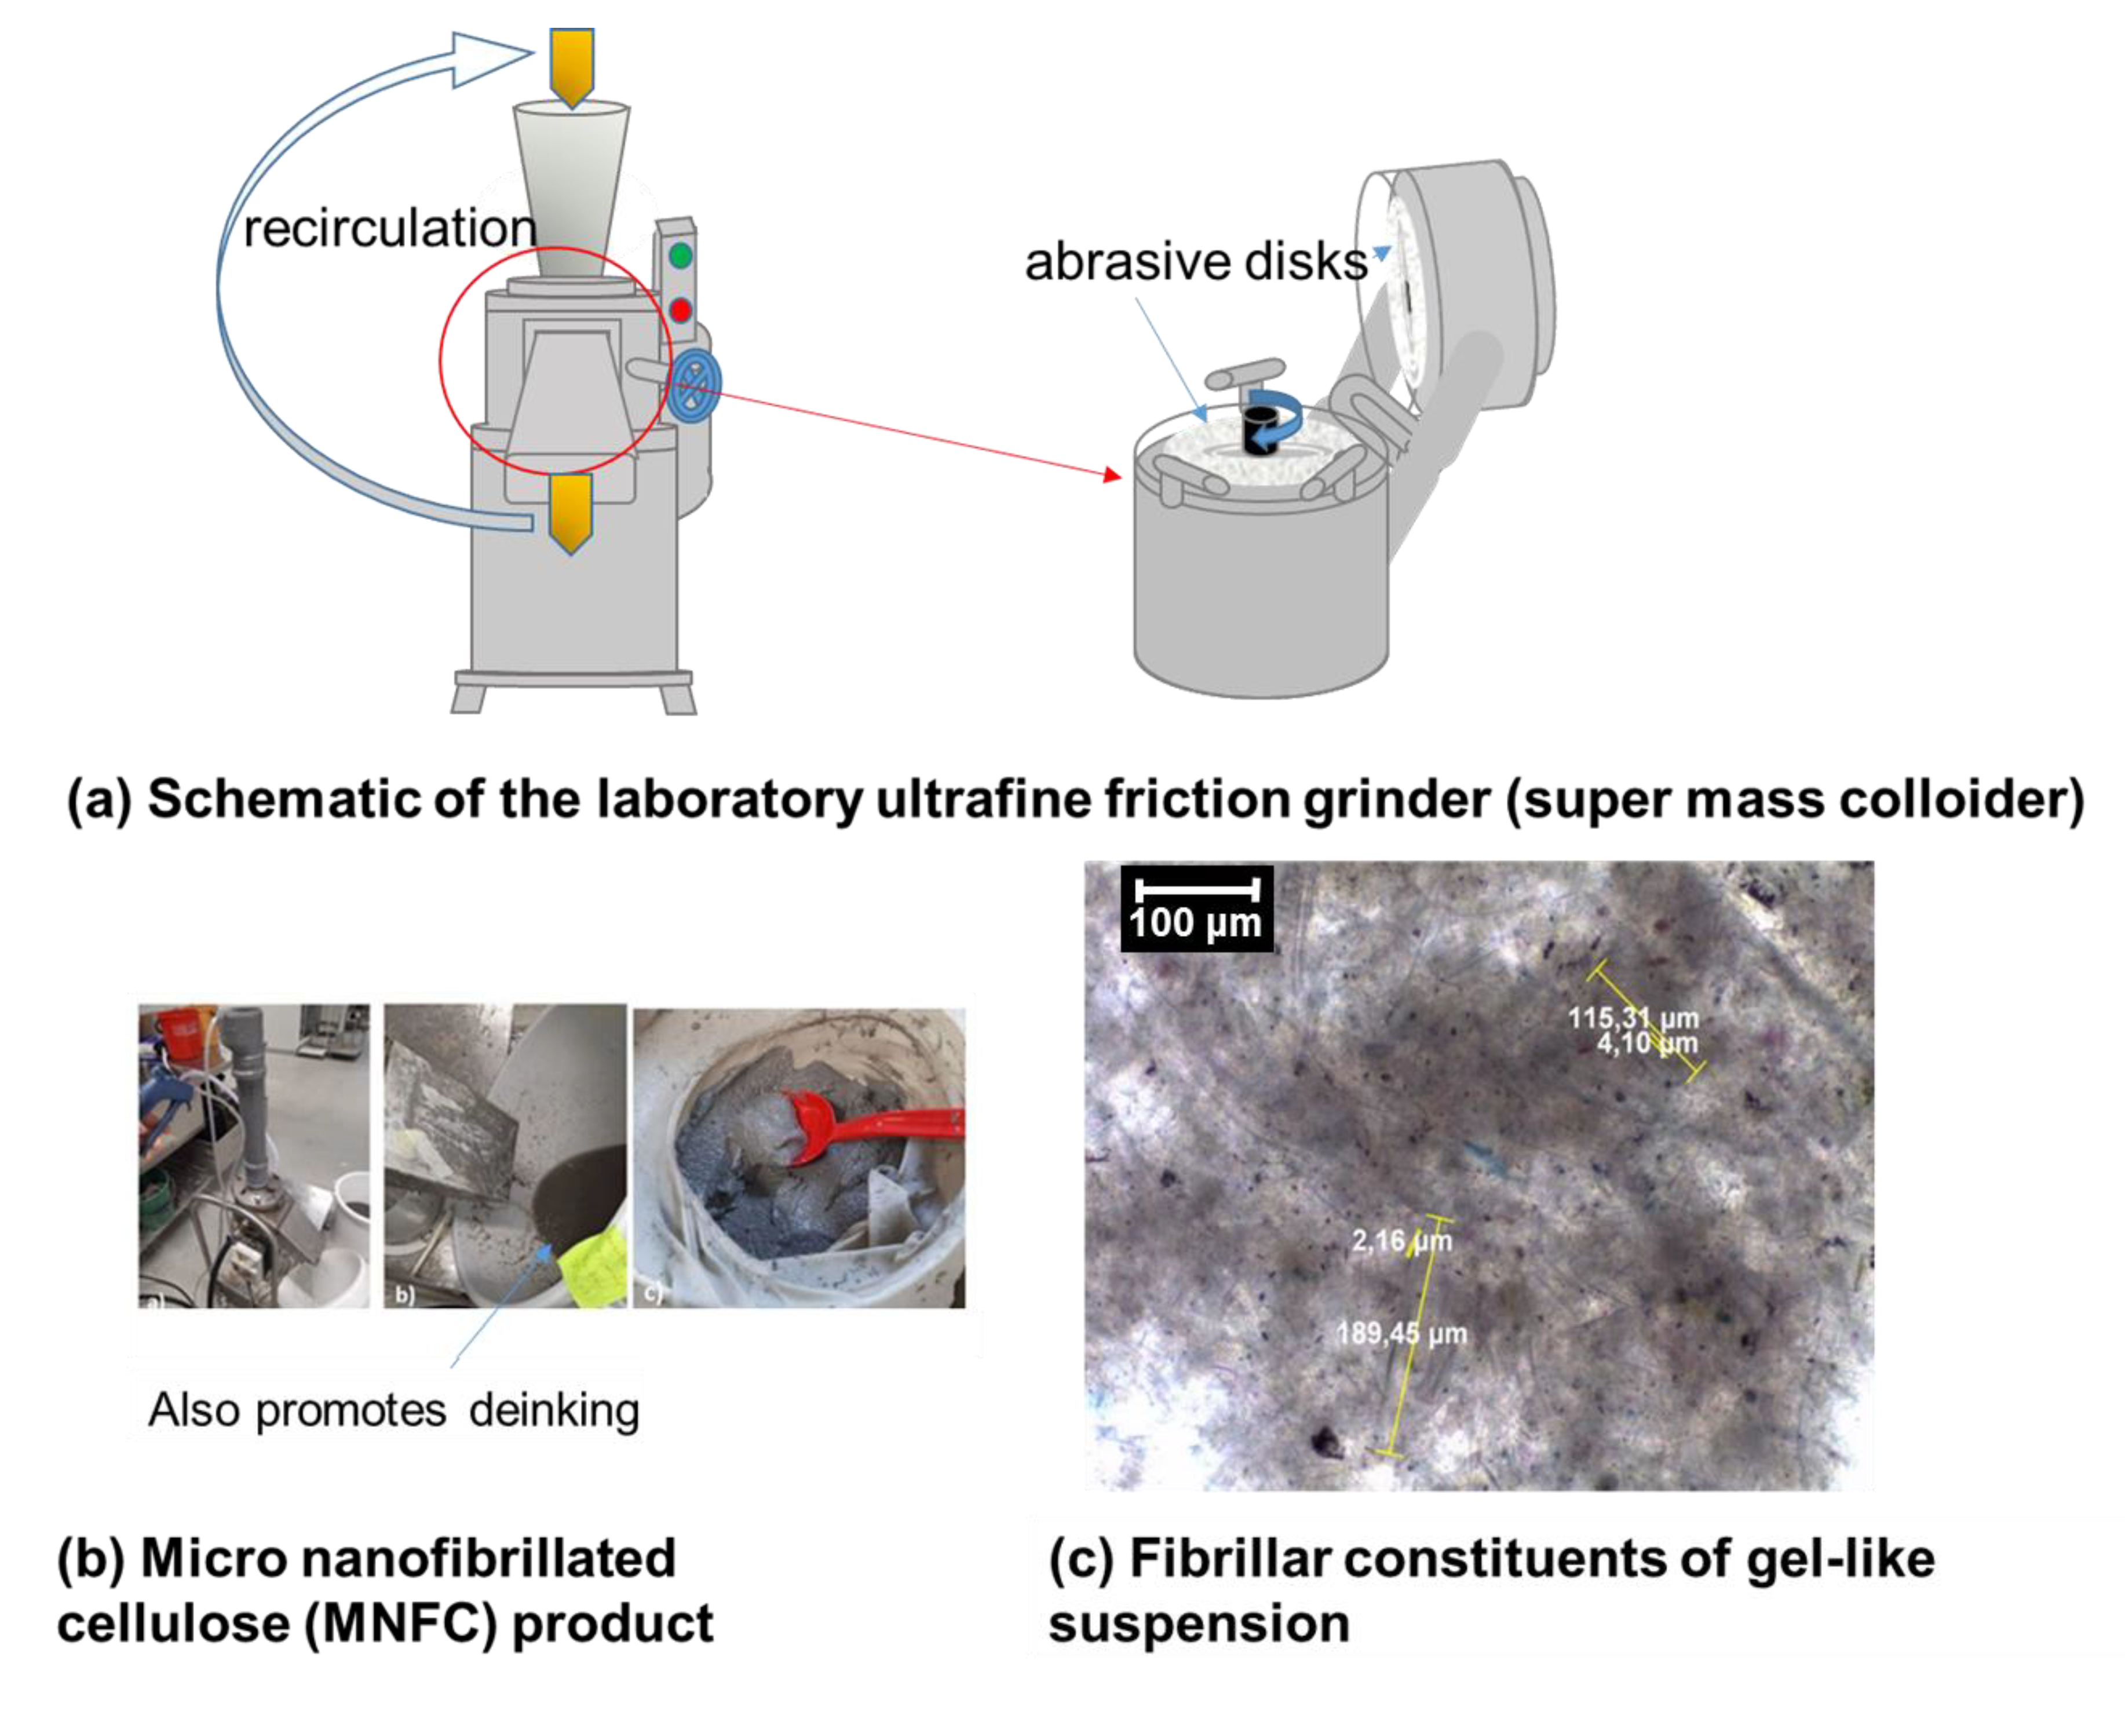
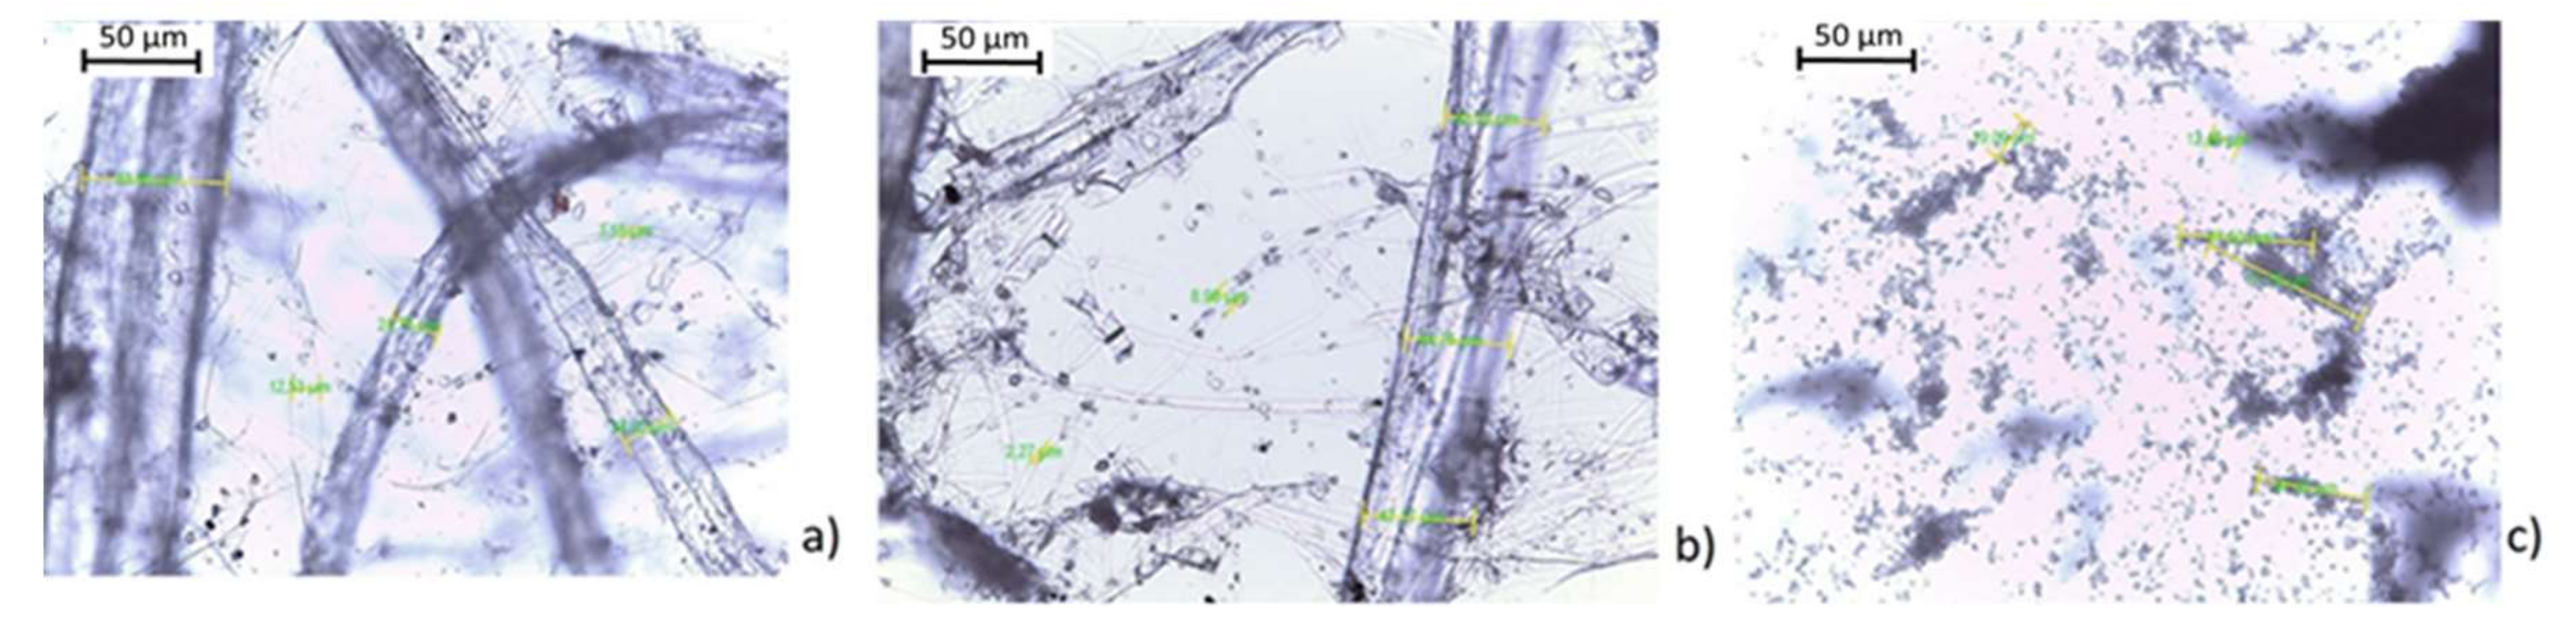
2.3. Nanocellulose (Binder + Humectant)

Equation (1), which shows the reaction of NOx with CaCO3, indicates that moisture (H2O) is an intrinsic part of the mechanism. This occurs because the reaction is an ionic bond exchange of CO32− for nitrite/nitrate 2(NO2/2NO3), and anionic group exchange between the salts requires they dissociate in aqueous medium. A supply of moisture within the immediate molecular environment is needed to support the CaCO3-NOx interaction. To guarantee the presence of moisture, it must be absorbed from the surrounding air. Materials that absorb moisture in this way are termed hygroscopic, and if they also dissolved in the absorbed moisture, then they are termed deliquescent. This need can be met by a humectant material that absorbs and stores moisture in excess of its own matrix dispersion. Such a material is conveniently sourced from the same feed material used as the substrate (cellulose fibres) [18] and produced in the form of micro nano-fibrillated cellulose (MNFC), which is readily derived either by high shear homogenising under high pressure extrusion or by micro-grinding, as shown in Figure 7, from either virgin or multi-recycled fibres [19]. Using over-recycled fibre, which is intrinsically weak, enables less energy input to be consumed to form the fine fibrillar material needed. To reduce energy consumption further, sodium sulphite (Na2SO3)2 was added, following the report of Ämmälä et al. [20], which effectively reduced the number of passes through the laboratory mass collider from 10 to 7. In addition, the bleaching effect of sulphite facilitated further de-inking of the newsprint fibres. To aid removal of excess sulphite and reduce the number of ink particles, the product was repeatedly washed with water.
The disintegrated pulp suspension was fed through a feeding neck into the mass collider, where it passed between a static and a rotating abrasive grinding stone rotating at a speed of about 1500 min−1 (rpm) with a motor frequency setting of 560 MHz. The fibrillation occurs under the hydrodynamic pressure, mechanical grinding, and shearing forces generated by the grinding stones, which result in the breakdown of the macroscopic plant fibre walls and the release of nanometre-thick strands of nanofibrils branching from the parent fibre wall. This combination of reduction of plant fibre to microfibrils with nanofibrils branching from the surface gives the material its name of micro nano-fibrillated cellulose (MNFC) [21,22,23].
The nanofibrils on the surface of MNFC form a hair-like water-sorbing network branching from the parent fibre [24,25], as shown by the cloudy-appearing regions in the scanning electron micrograph in Figure 7. The microscope image shows the mass of fine fibrils formed and illustrates the dimensions (length and breadth) of a few retained larger fibres, which were many orders of magnitude larger than the fine water-sorbing (humectant) fibrils.
The MNFC fibrils have surfaces, which expose many OH groups. The binding functionality of cellulose nanofibrils, such as those present in the MNFC described here, is considered to be due to these plentiful primary and secondary hydroxyls on the fibrillar surface. These OH groups, as reported by Tayeb et al. [26], are able to attract each other electrostatically via hydrogen bonds, which cause the particles to build ordered structures. These groups not only promote hydrogen bonding but can be used as sites to modify surface chemistry via ready grafting. The strength of hydrogen bonding is high, so MNFC can be used to add strength to the substrate to compensate for weakness of the multi-recycled fibre structure. However, this was not done in the current work. The intended use was to act as a binder to bind the coating CaCO3 particles together and bind the coating to the substrate. The OH bonding potential is ideally compatible with the cellulose fibre substrate, which also bonds via OH groups.

2.4. Coating Formulation

Given the choice of combining dispersant-free GCC particles and MNFC, the latter provides an extra function of enhancing dispersion under shear of the otherwise agglomerated GCC, which simplifies the coating colour without the need for ultrasonication (as required previously when measuring particle size). The GCC and MNFC were, thus, combined under high shear mixing only with a ratio of 100 parts by weight (pph) GCC with 10 pph MNFC. Solids content ranged from as low as required by water dilution up to the inherent solids content of the crumble GCC (> 85 w/w% to 90 w/w%) with the low solids content MNFC to provide a maximum of approximately 75 w/w% solids (Figure 8). Therefore, depending on the coating technique and its respective rheological flow demands, the coating colour can be optimised with ease.

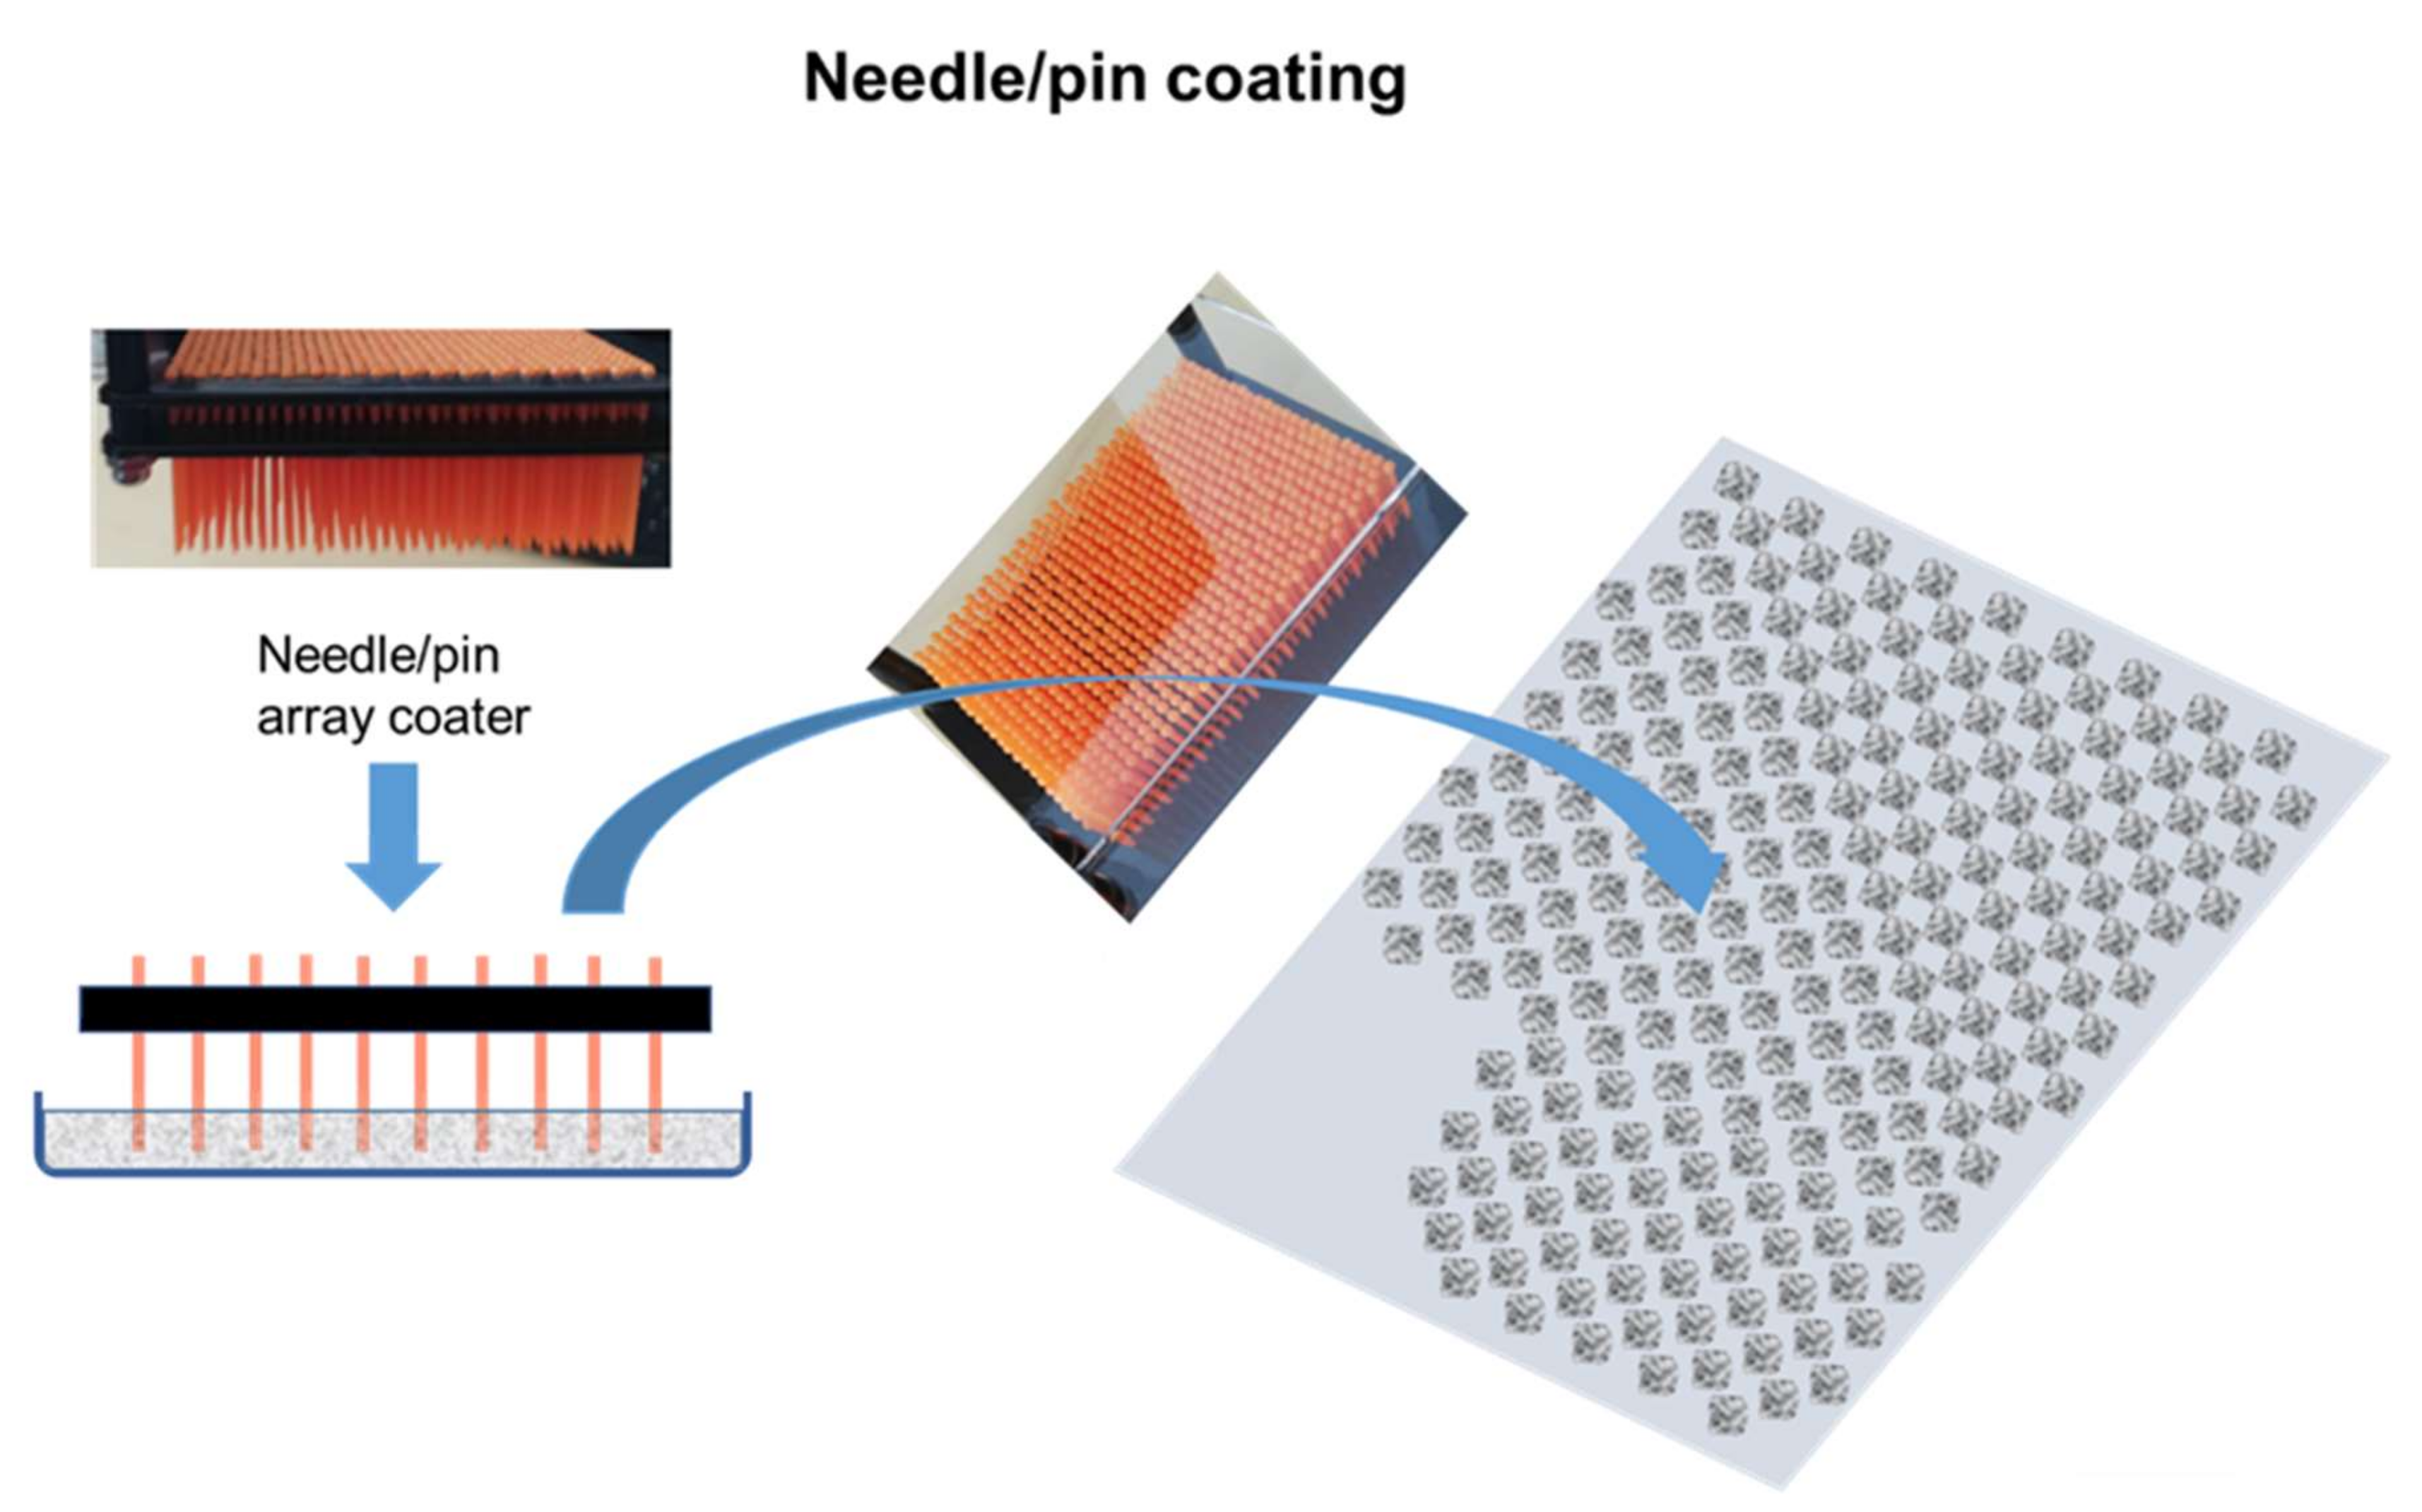
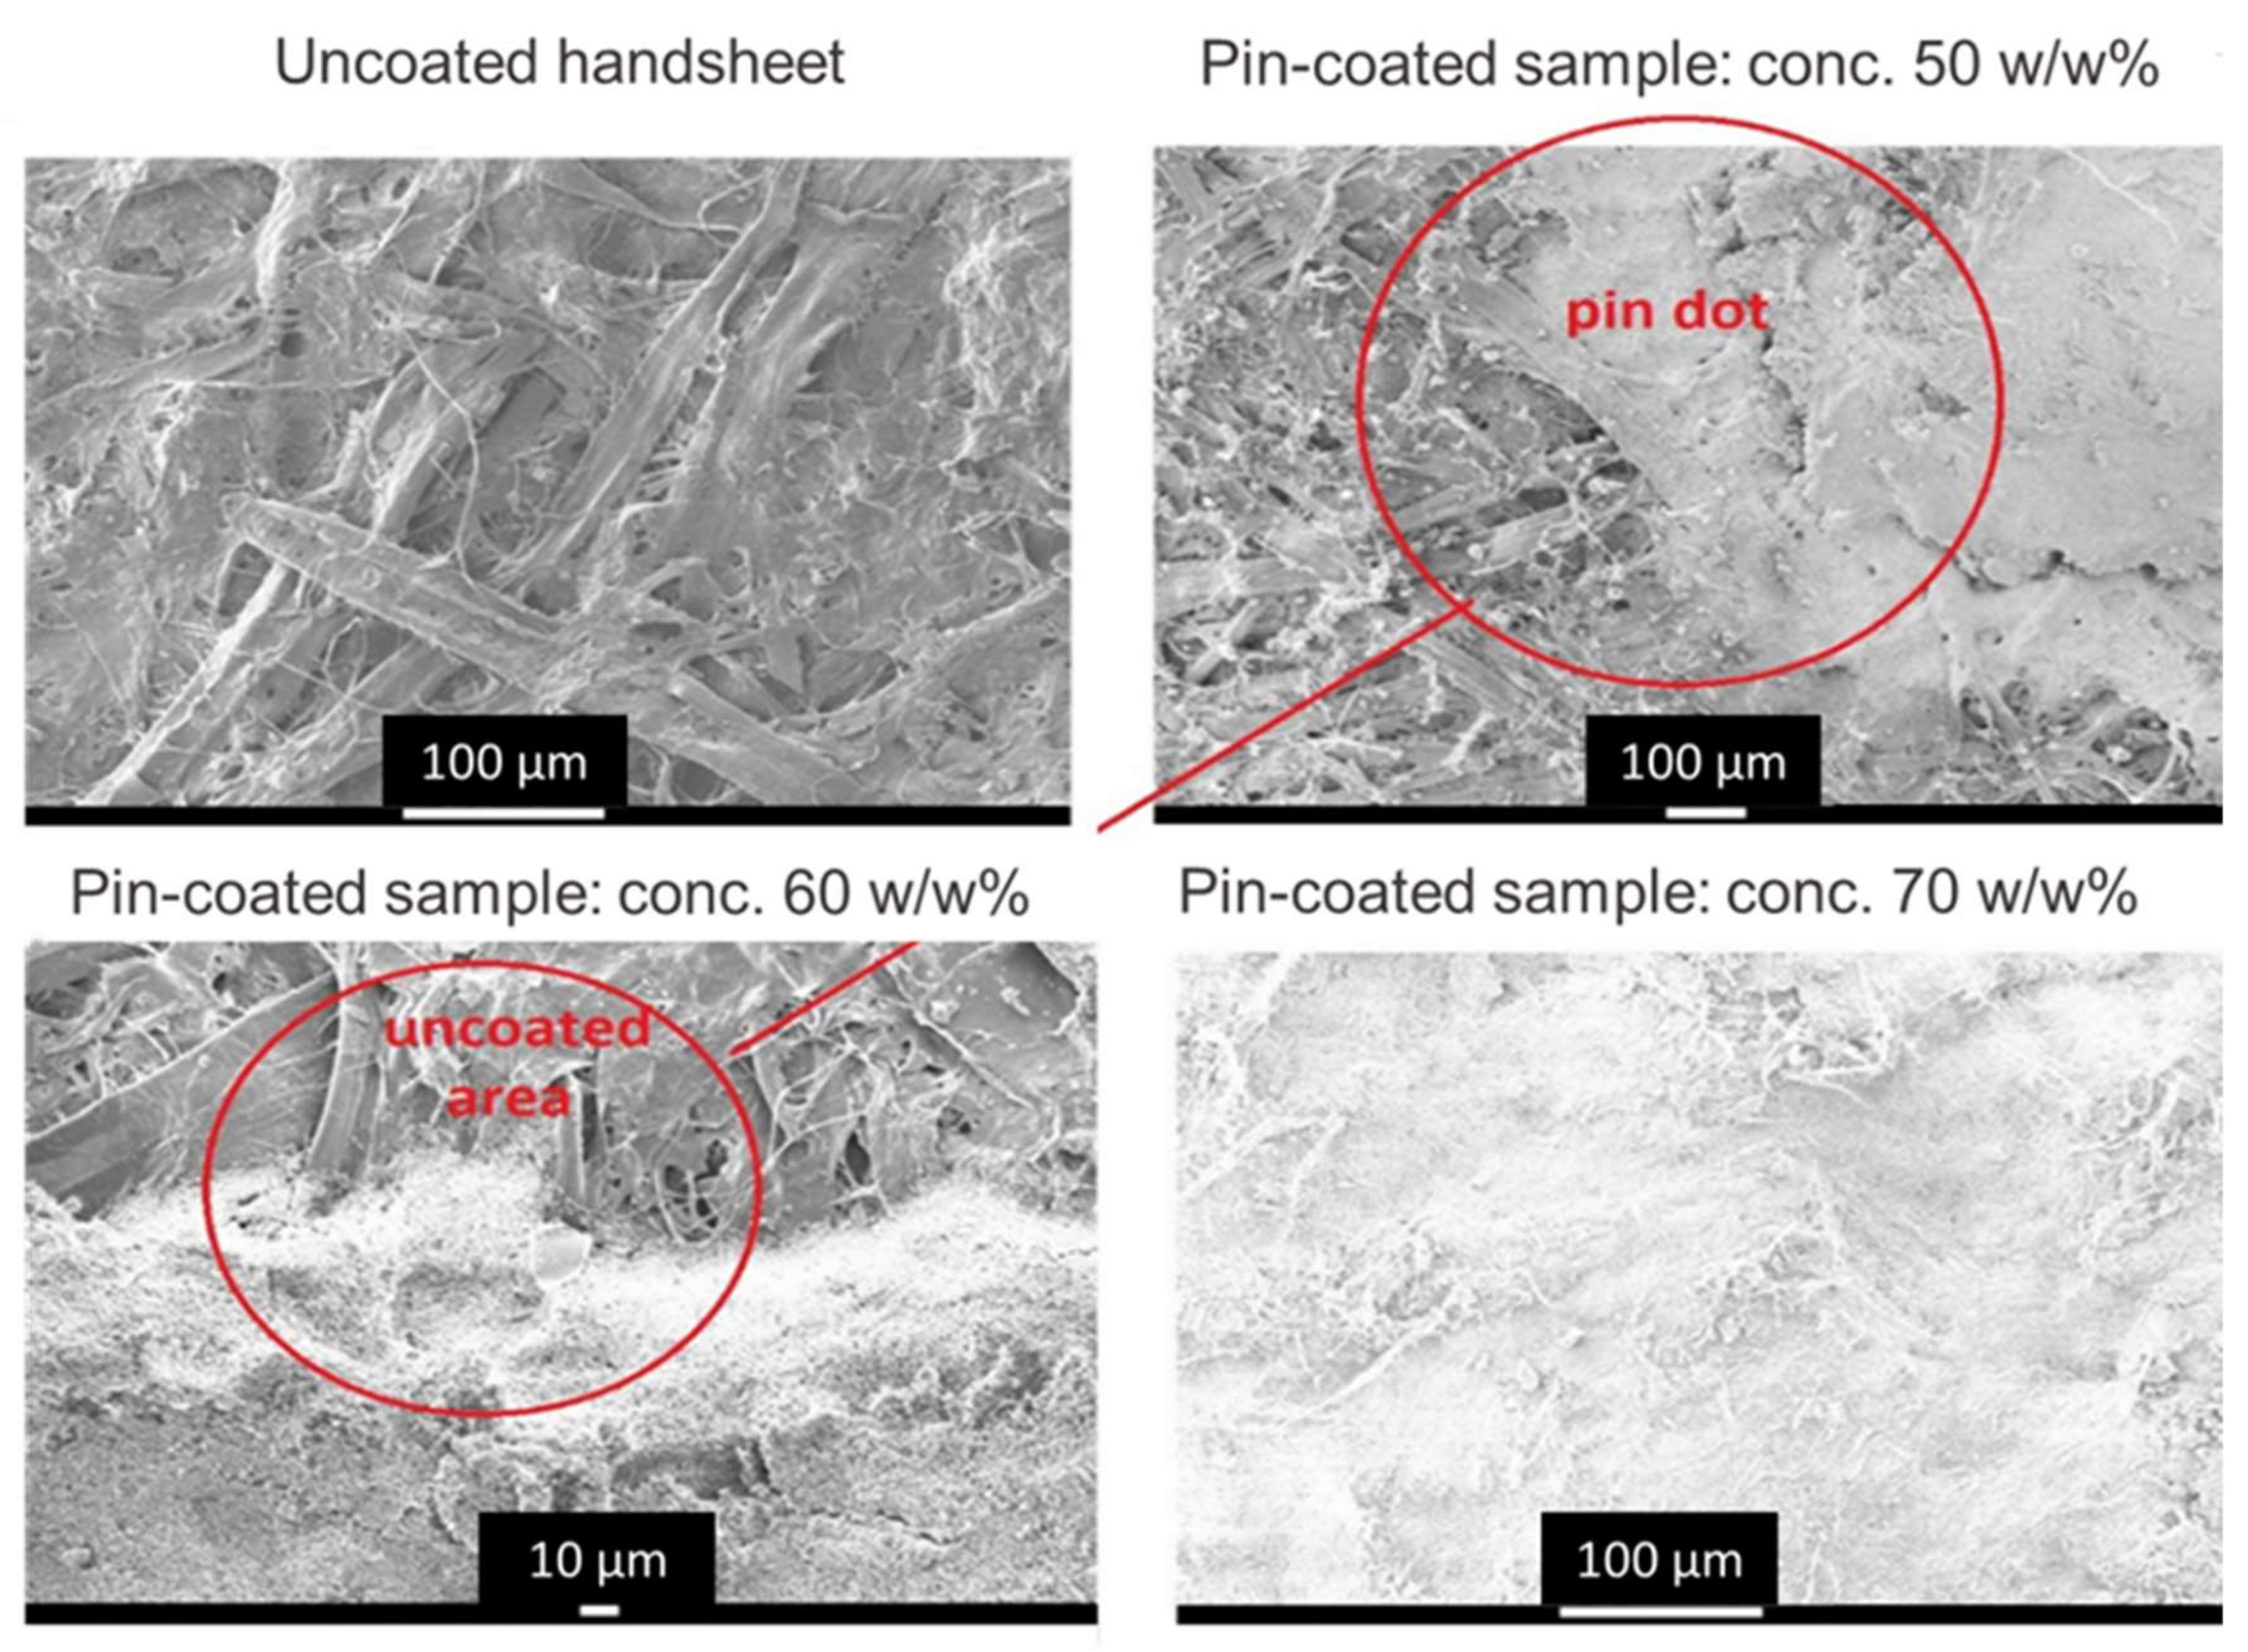
2.5. Coating Application

The paper and board industry continually optimise mineral-based coatings to be applied reliably and efficiently at high speed over large web widths and maintain excellence in printability, smoothness, and optical properties. Multilayer coating, for example, is used for the highest quality art printing papers and high-priced goods packaging. Multiple layering enables smoothness and opacity to be achieved by different functioning layers, and the top layer accounts for the printability properties. Scheduling is also used to generate the high gloss needed in some grades, and matte and silk grades are produced via careful choice of mineral particle size.
In this work, much of this knowledge with respect to achieving smoothness and evenness of both substrate and coating layer no longer applies, which may cause discomfort for skilled papermakers. Already optimised criteria must be ignored because the production of a porous, permeable, and rough surface distribution of coating regions to maximise exposure for gas contact, permeation, and diffusion is necessary. The schematic in Figure 9 illustrates the challenge.
The concept is primarily to devise a filter that can be used either in a permeable through-flow or, preferably for energy reasons, exposed in a surface flow mode. A high-quality thick coating, as shown at the top of Figure 9, is both relatively impermeable (unsuitable for through-flow) and, due to its smoothness, prone to establishing a static (stagnant) boundary layer of gas, irrespective of the flow rate of gas. Therefore, only slow diffusion can engender contact between the gas and the reactive coating bulk regardless of whether the static surface layer is in contact with any extended regions of coating. In contrast, a thin coating layer, broken up by poor coverage (fibrous exposed areas) allows gas to circulate. However, the transport mechanism at low coat weight also remains mostly by gas diffusion, but the path length for diffusion is reduced. Unfortunately, by reducing coat weight, the capacity of the filter for NOx uptake is greatly reduced.
The most convenient method to present a greater interactive surface is shown schematically since the pixelated coating in Figure 9 consists of a spatial distribution of coating agglomerates over the surface of the permeable substrate. Such a configuration aids both through-flow and surface flow modes by generating turbulence at the solid-gas interface, which destroys the static boundary layer. The destruction of the static layer provides ready access for the gas to the surface of the agglomerates, which, due to their largely flocculated particle-particle structure, are themselves highly permeable and have open and highly connected pores for pressure-driven ingress and easy diffusion of gas.
One possible method to achieve pixelated coating is to use pin/needle coating. A hand-operated apparatus is shown in Figure 10. In this case, the pins were constructed from the polymer. Therefore, a surface treatment of the pins by surfactant was employed. Upscaling would require reel-to-reel methods for efficiency, and printing could be used instead of metered coating technology, e.g., a large cell ceramic Anilox cylinder in flexography, to achieve a pixel structure.
In contrast with contact metering methods, such as blade coating, pin coating, spray, or flexographic printing, introduce little to no strain on the substrate, which, because the substrate becomes wet by the water content in the coating, and, thus, even further weakened, is not strong enough to withstand such a dynamic process. Furthermore, solid content can be considerably increased when using pin coating to reduce substrate wetting and enable larger pixel quantities to be applied. This study was able to apply solid content of up to approximately 70 w/w% with the potential of reducing drying costs greatly. To illustrate the benefits of pixelated coating, smooth coatings were also prepared using a rod draw-down coater K Control coater (RK PrintCoat Instruments Ltd., Litlington, Royston, UK). The applied coat weight was targeted at approximately 10 gm−2 in all cases.
Scanning electron microscope (SEM) images (JEM-2200FS; JEOL Ltd., Akashima, Tokyo, Japan) that show both the regions of printed coating neighbouring uncoated substrate and regions of solid coating to illustrate structure are provided in Figure 11. The boundary between the printed pixel coat and the substrate was microscopically ragged and designedly diffuse. This would be a lack of image definition in terms of quality printing, which is advantageous with respect to maximising the gas-coating interface and encouraging turbulent flow and high permeability, which guarantees active ingress of the gas phase into the pore structure of the reactive coating.

3. Experimental

3.1. Filter Development, Test Methods, and Results

The initial finding that CaCO3 underwent the reaction shown in Equation (1) was based on a first observation where ground limestone was left exposed to ambient air in a product store from which material was regularly collected for further processing using motorised vehicular access. Figure 12 reveals the results from which important conclusions can be drawn. Namely, (i) the balance between nitrite (NO2) and nitrate (NO3) production favours nitrate over time, (ii) the NOx uptake, defined by nitrogen content as the sum of the nitrogen contained in the analysed nitrite and nitrate concentrations, was linear over an extended duration (months), and (iii) the continued uptake could not be based on surface saturation by inert adsorption, but rather by continuous reaction via conversion of -CO32− to -(NO2/NO3)2. Given the linearity in Figure 12, estimations of the rate of uptake were made when examining the results from the laboratory surface’s flow filter design without having to extract samples repeatedly.

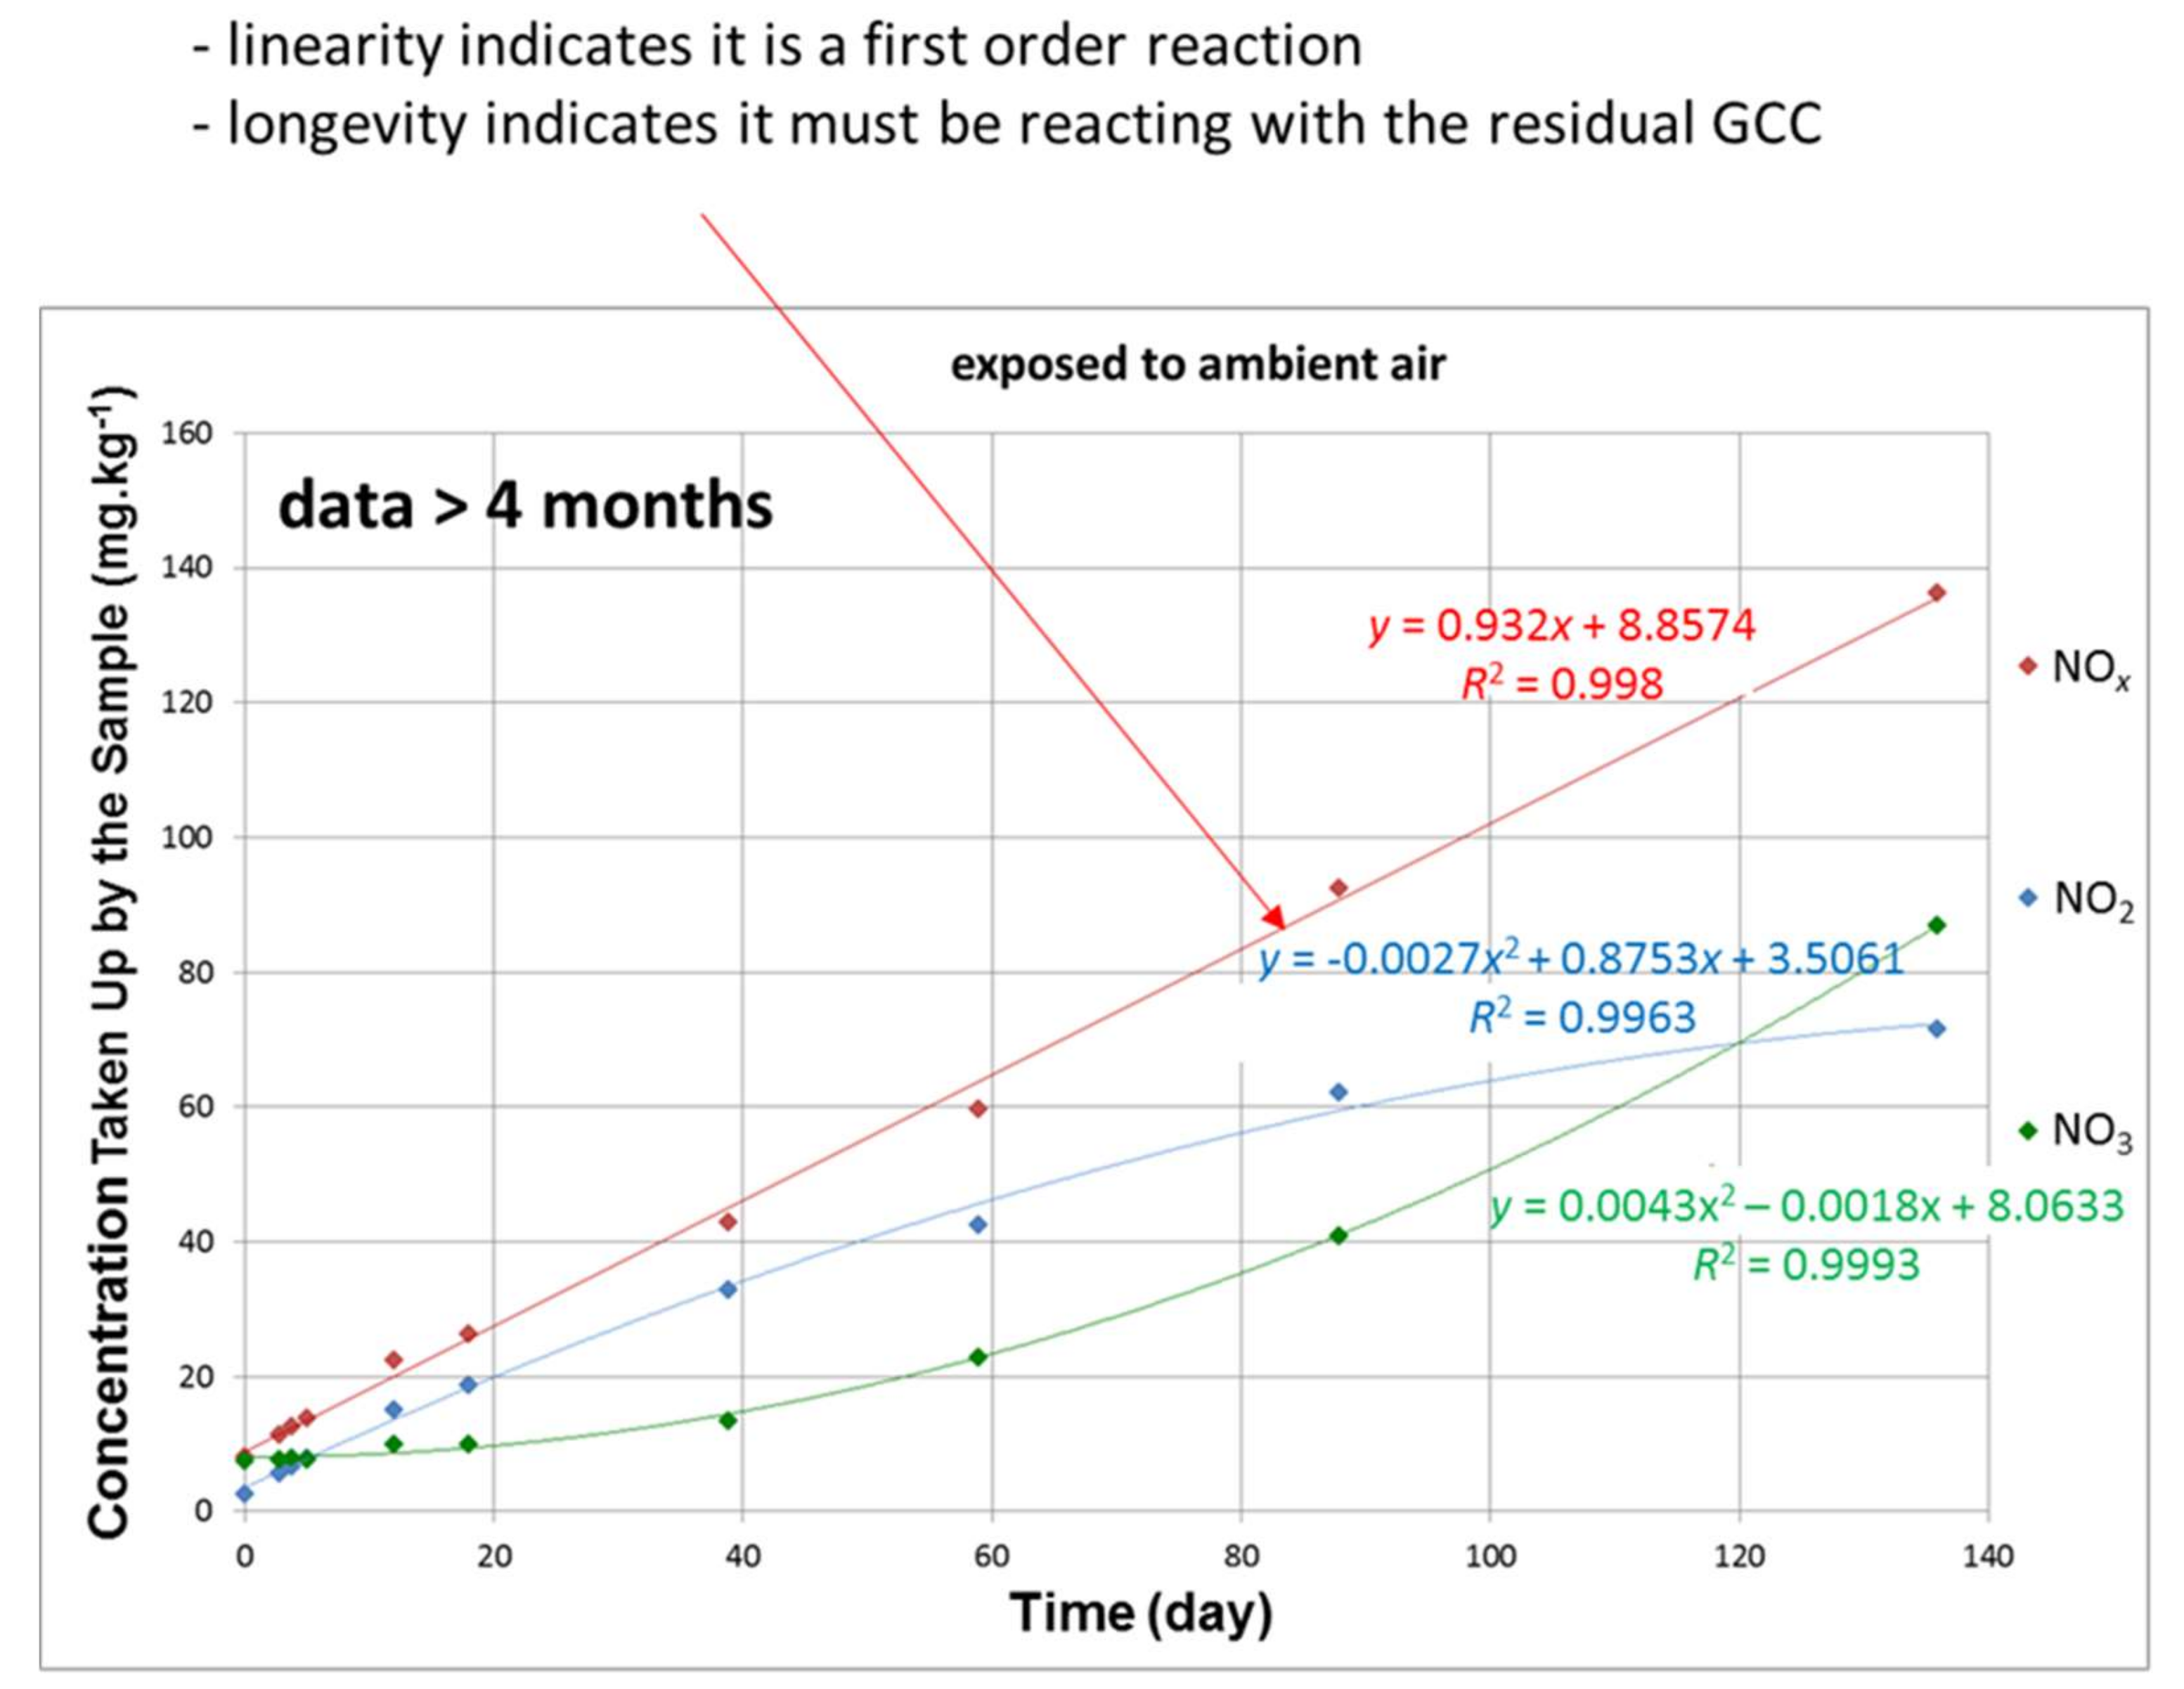
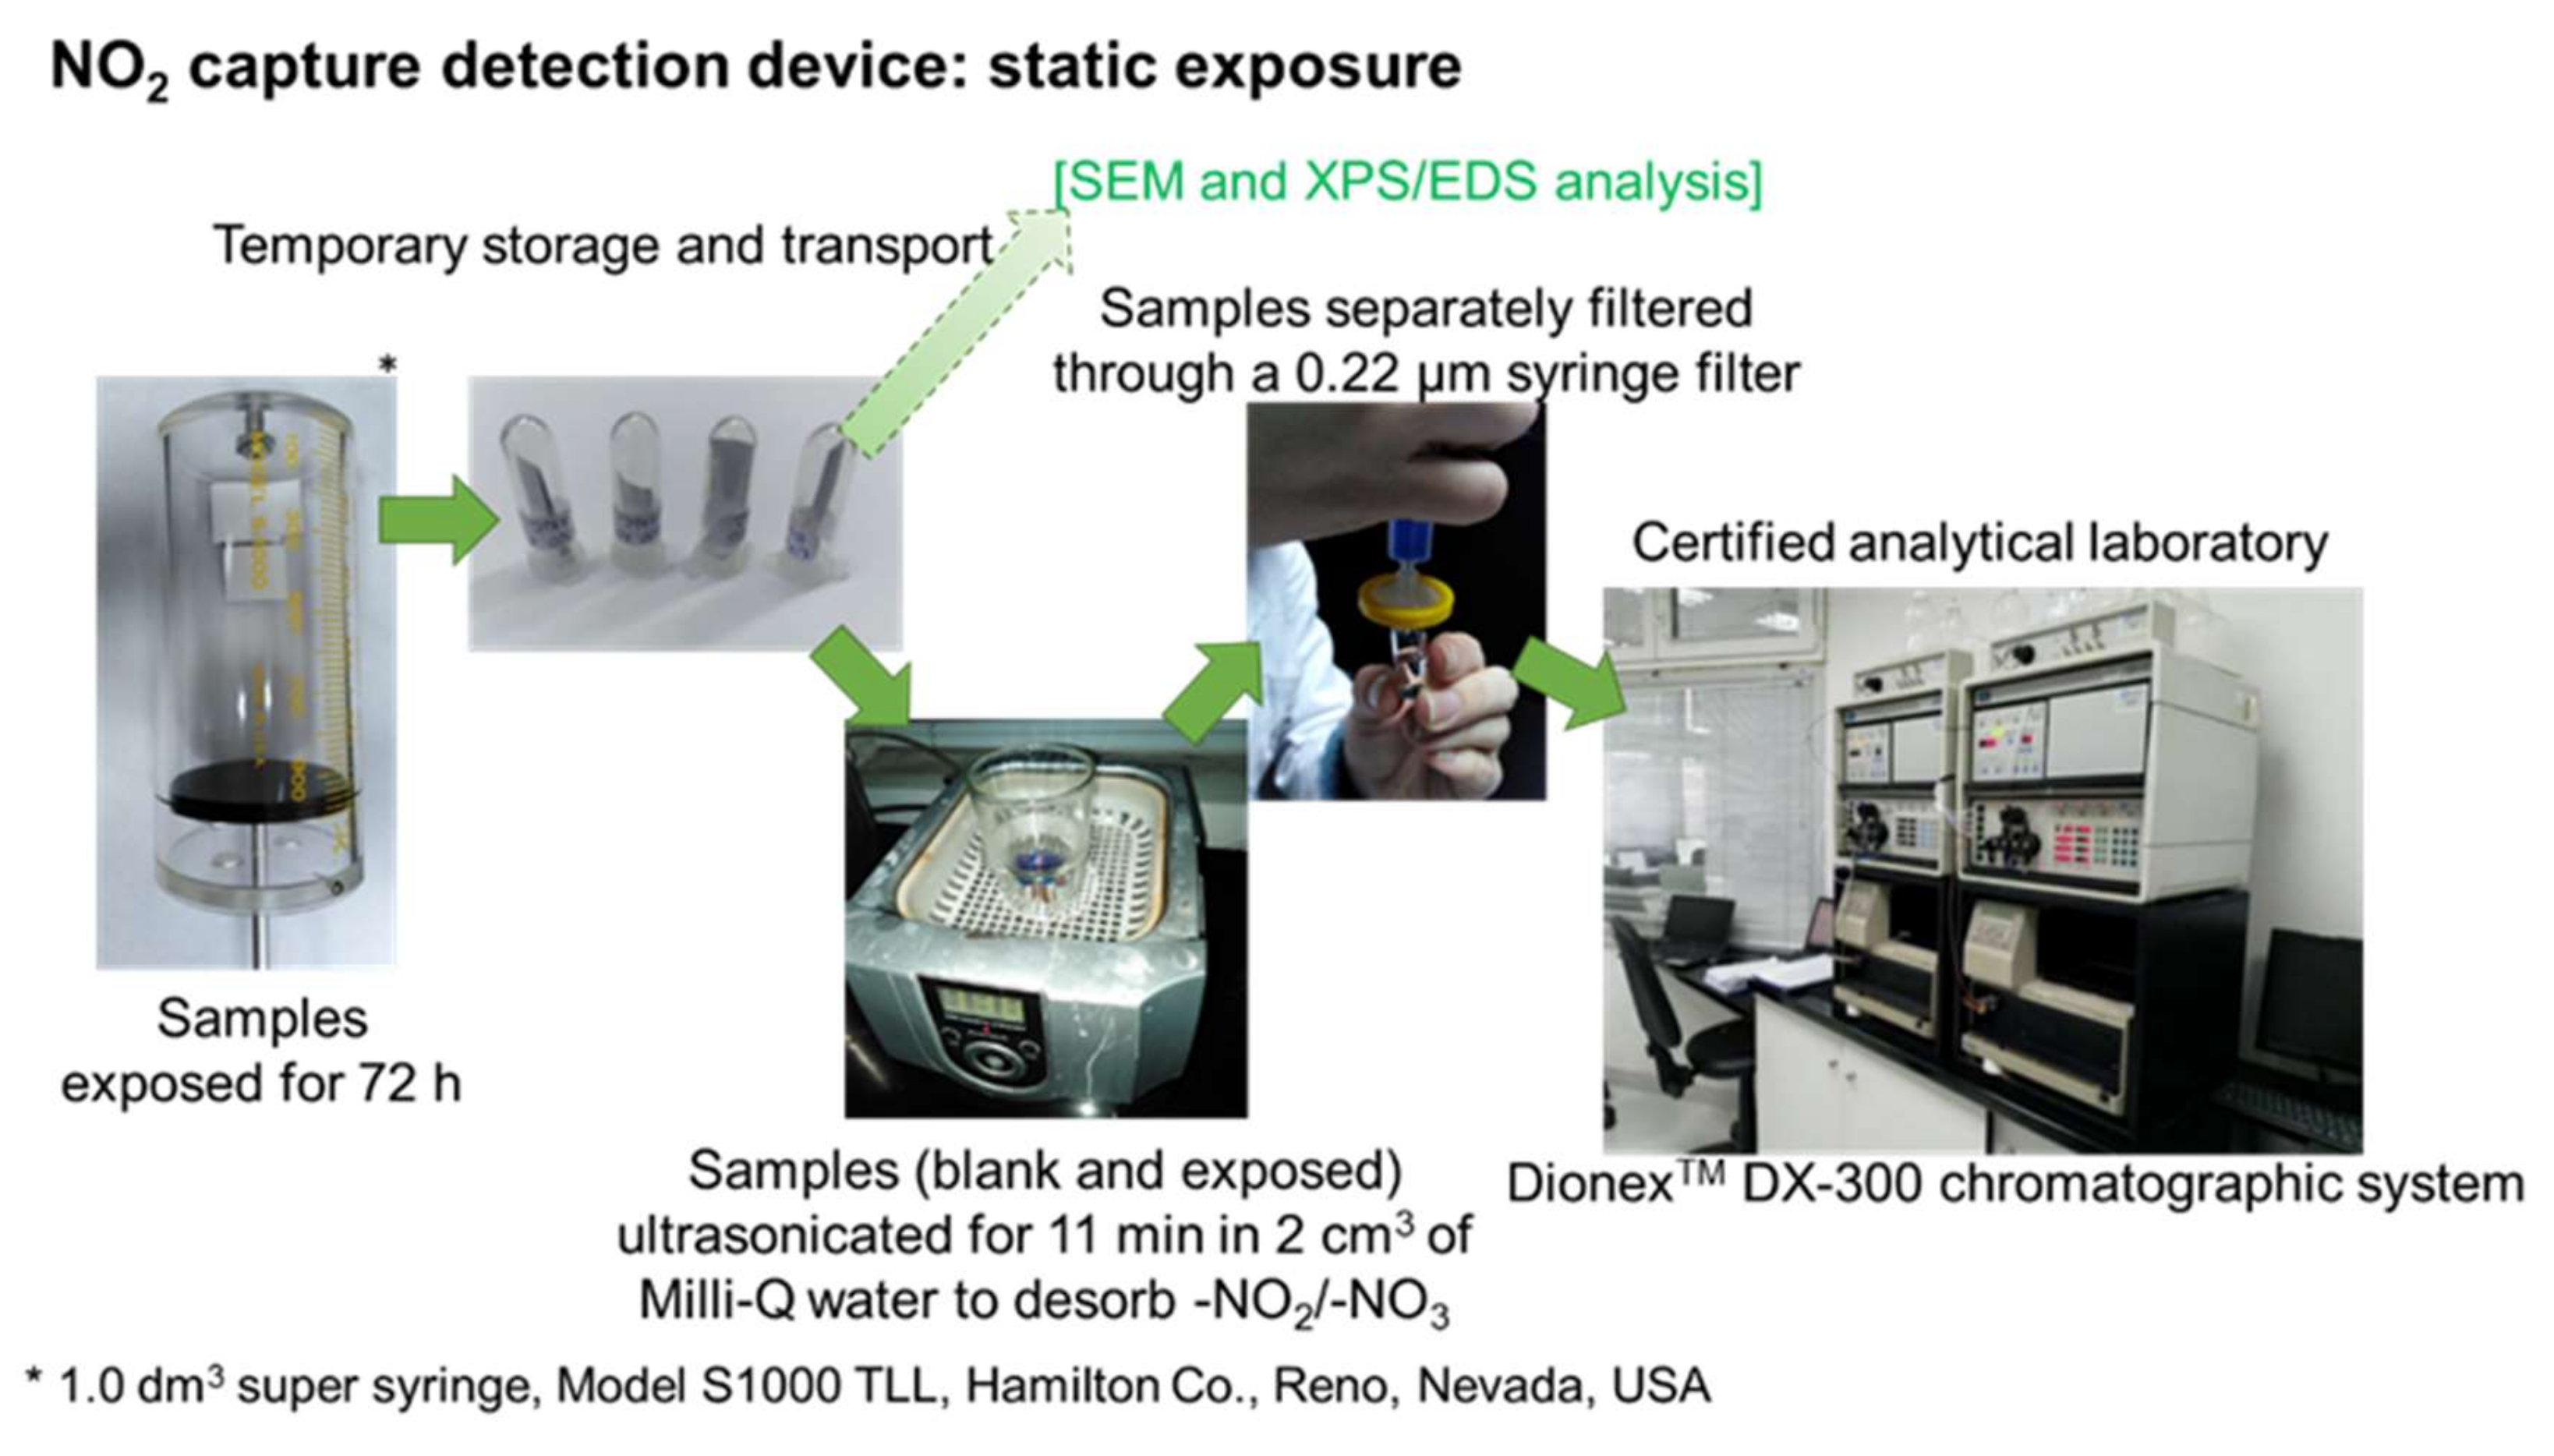
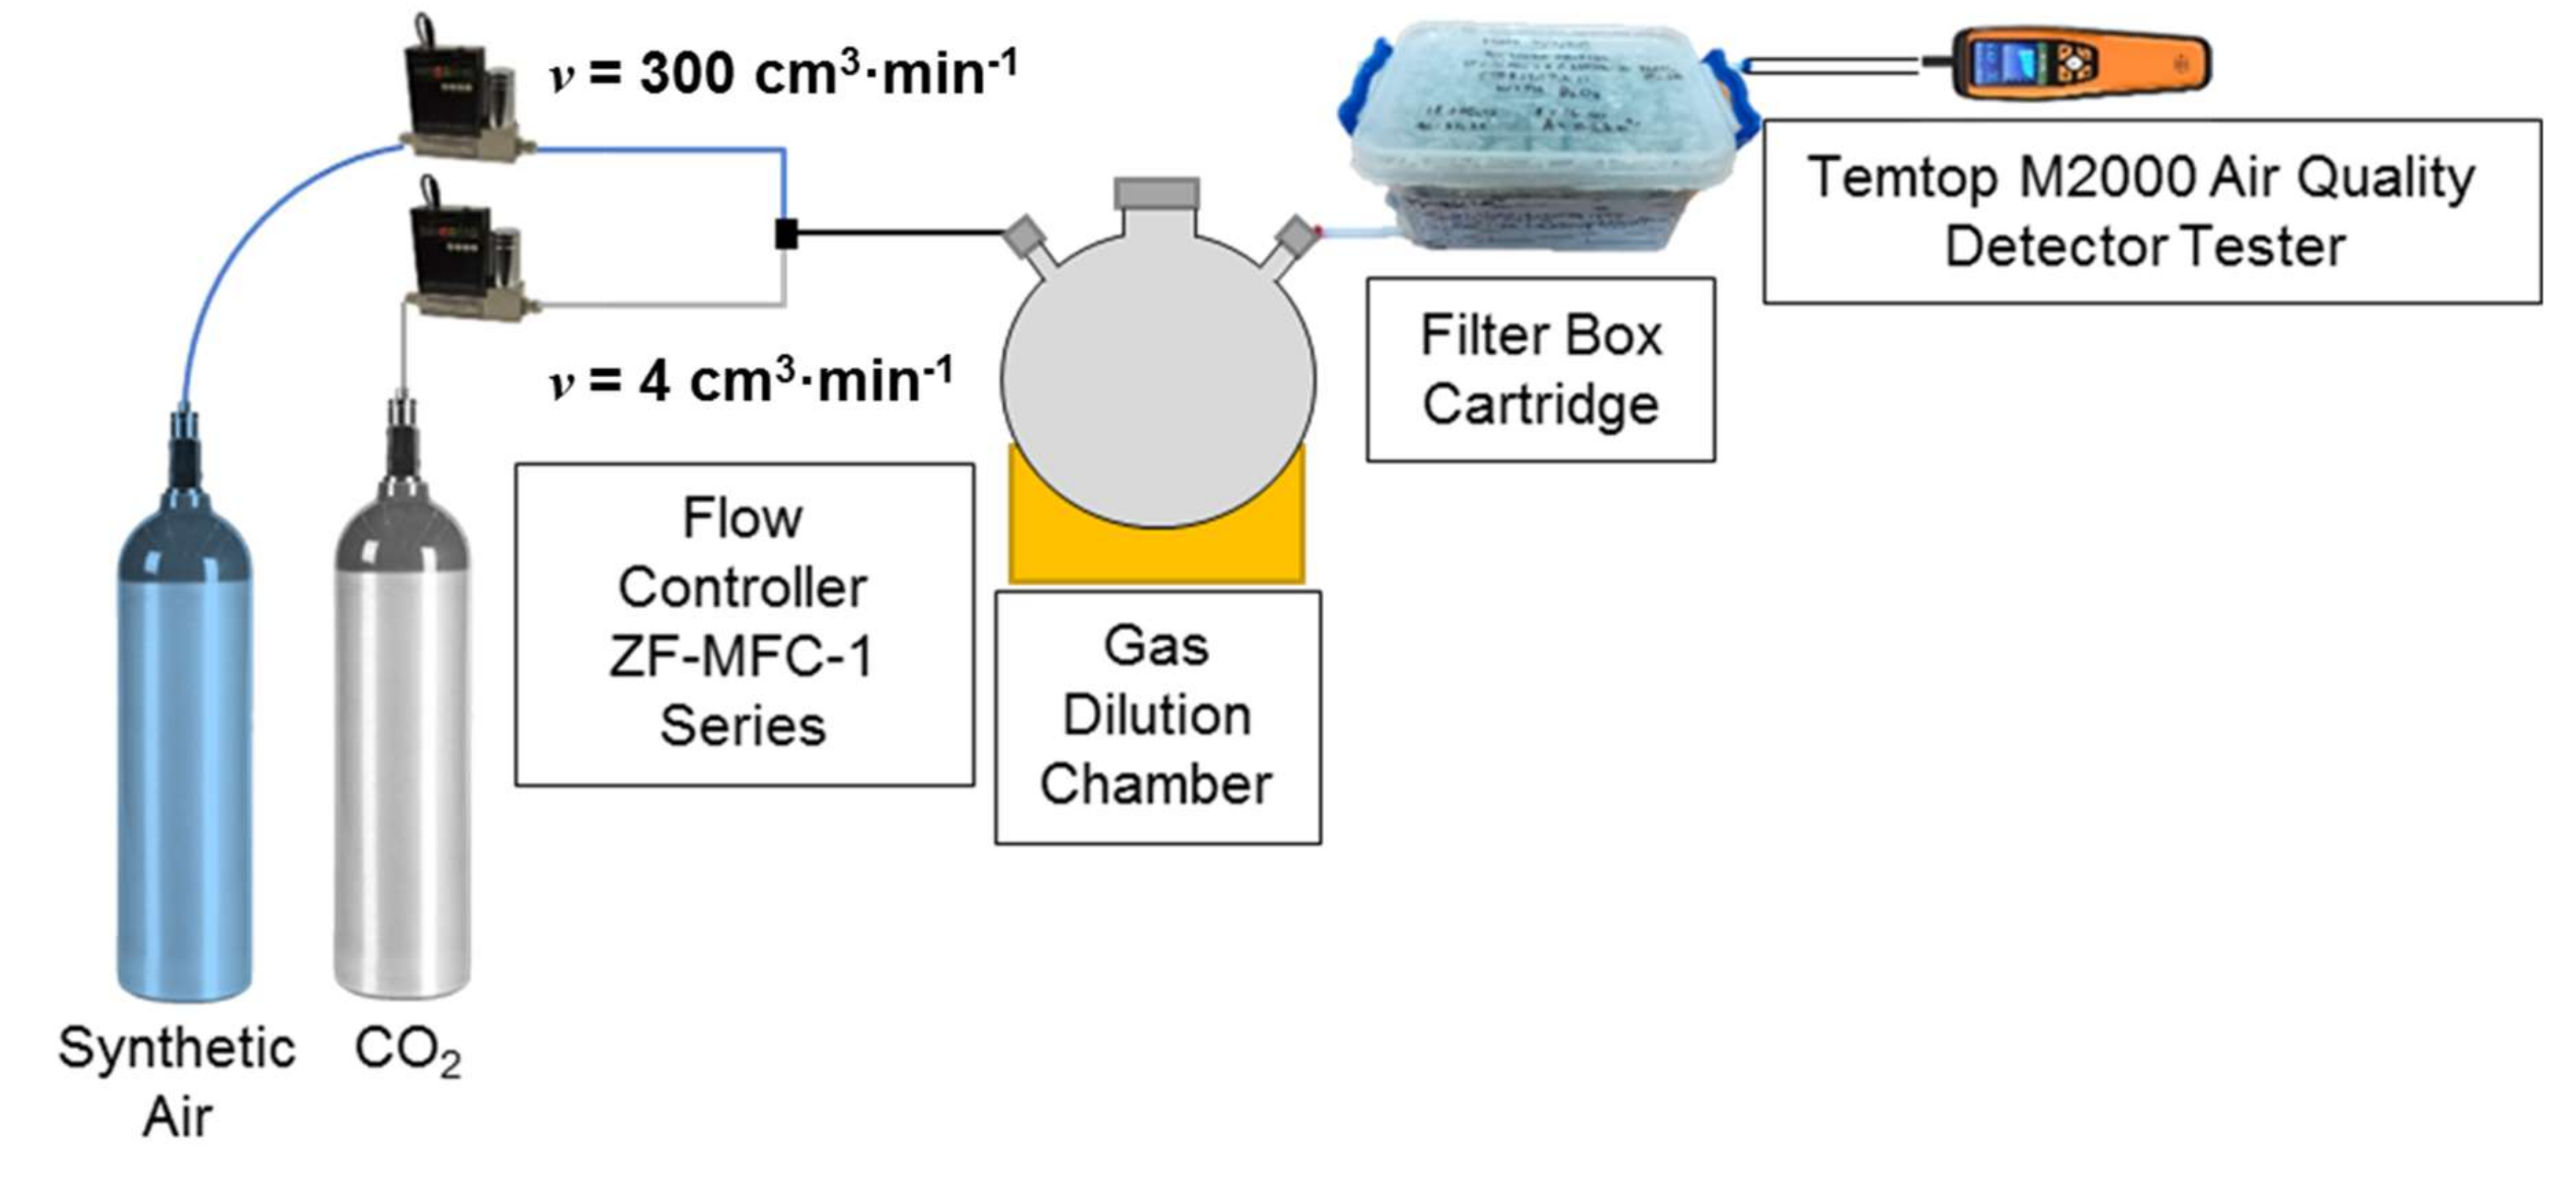
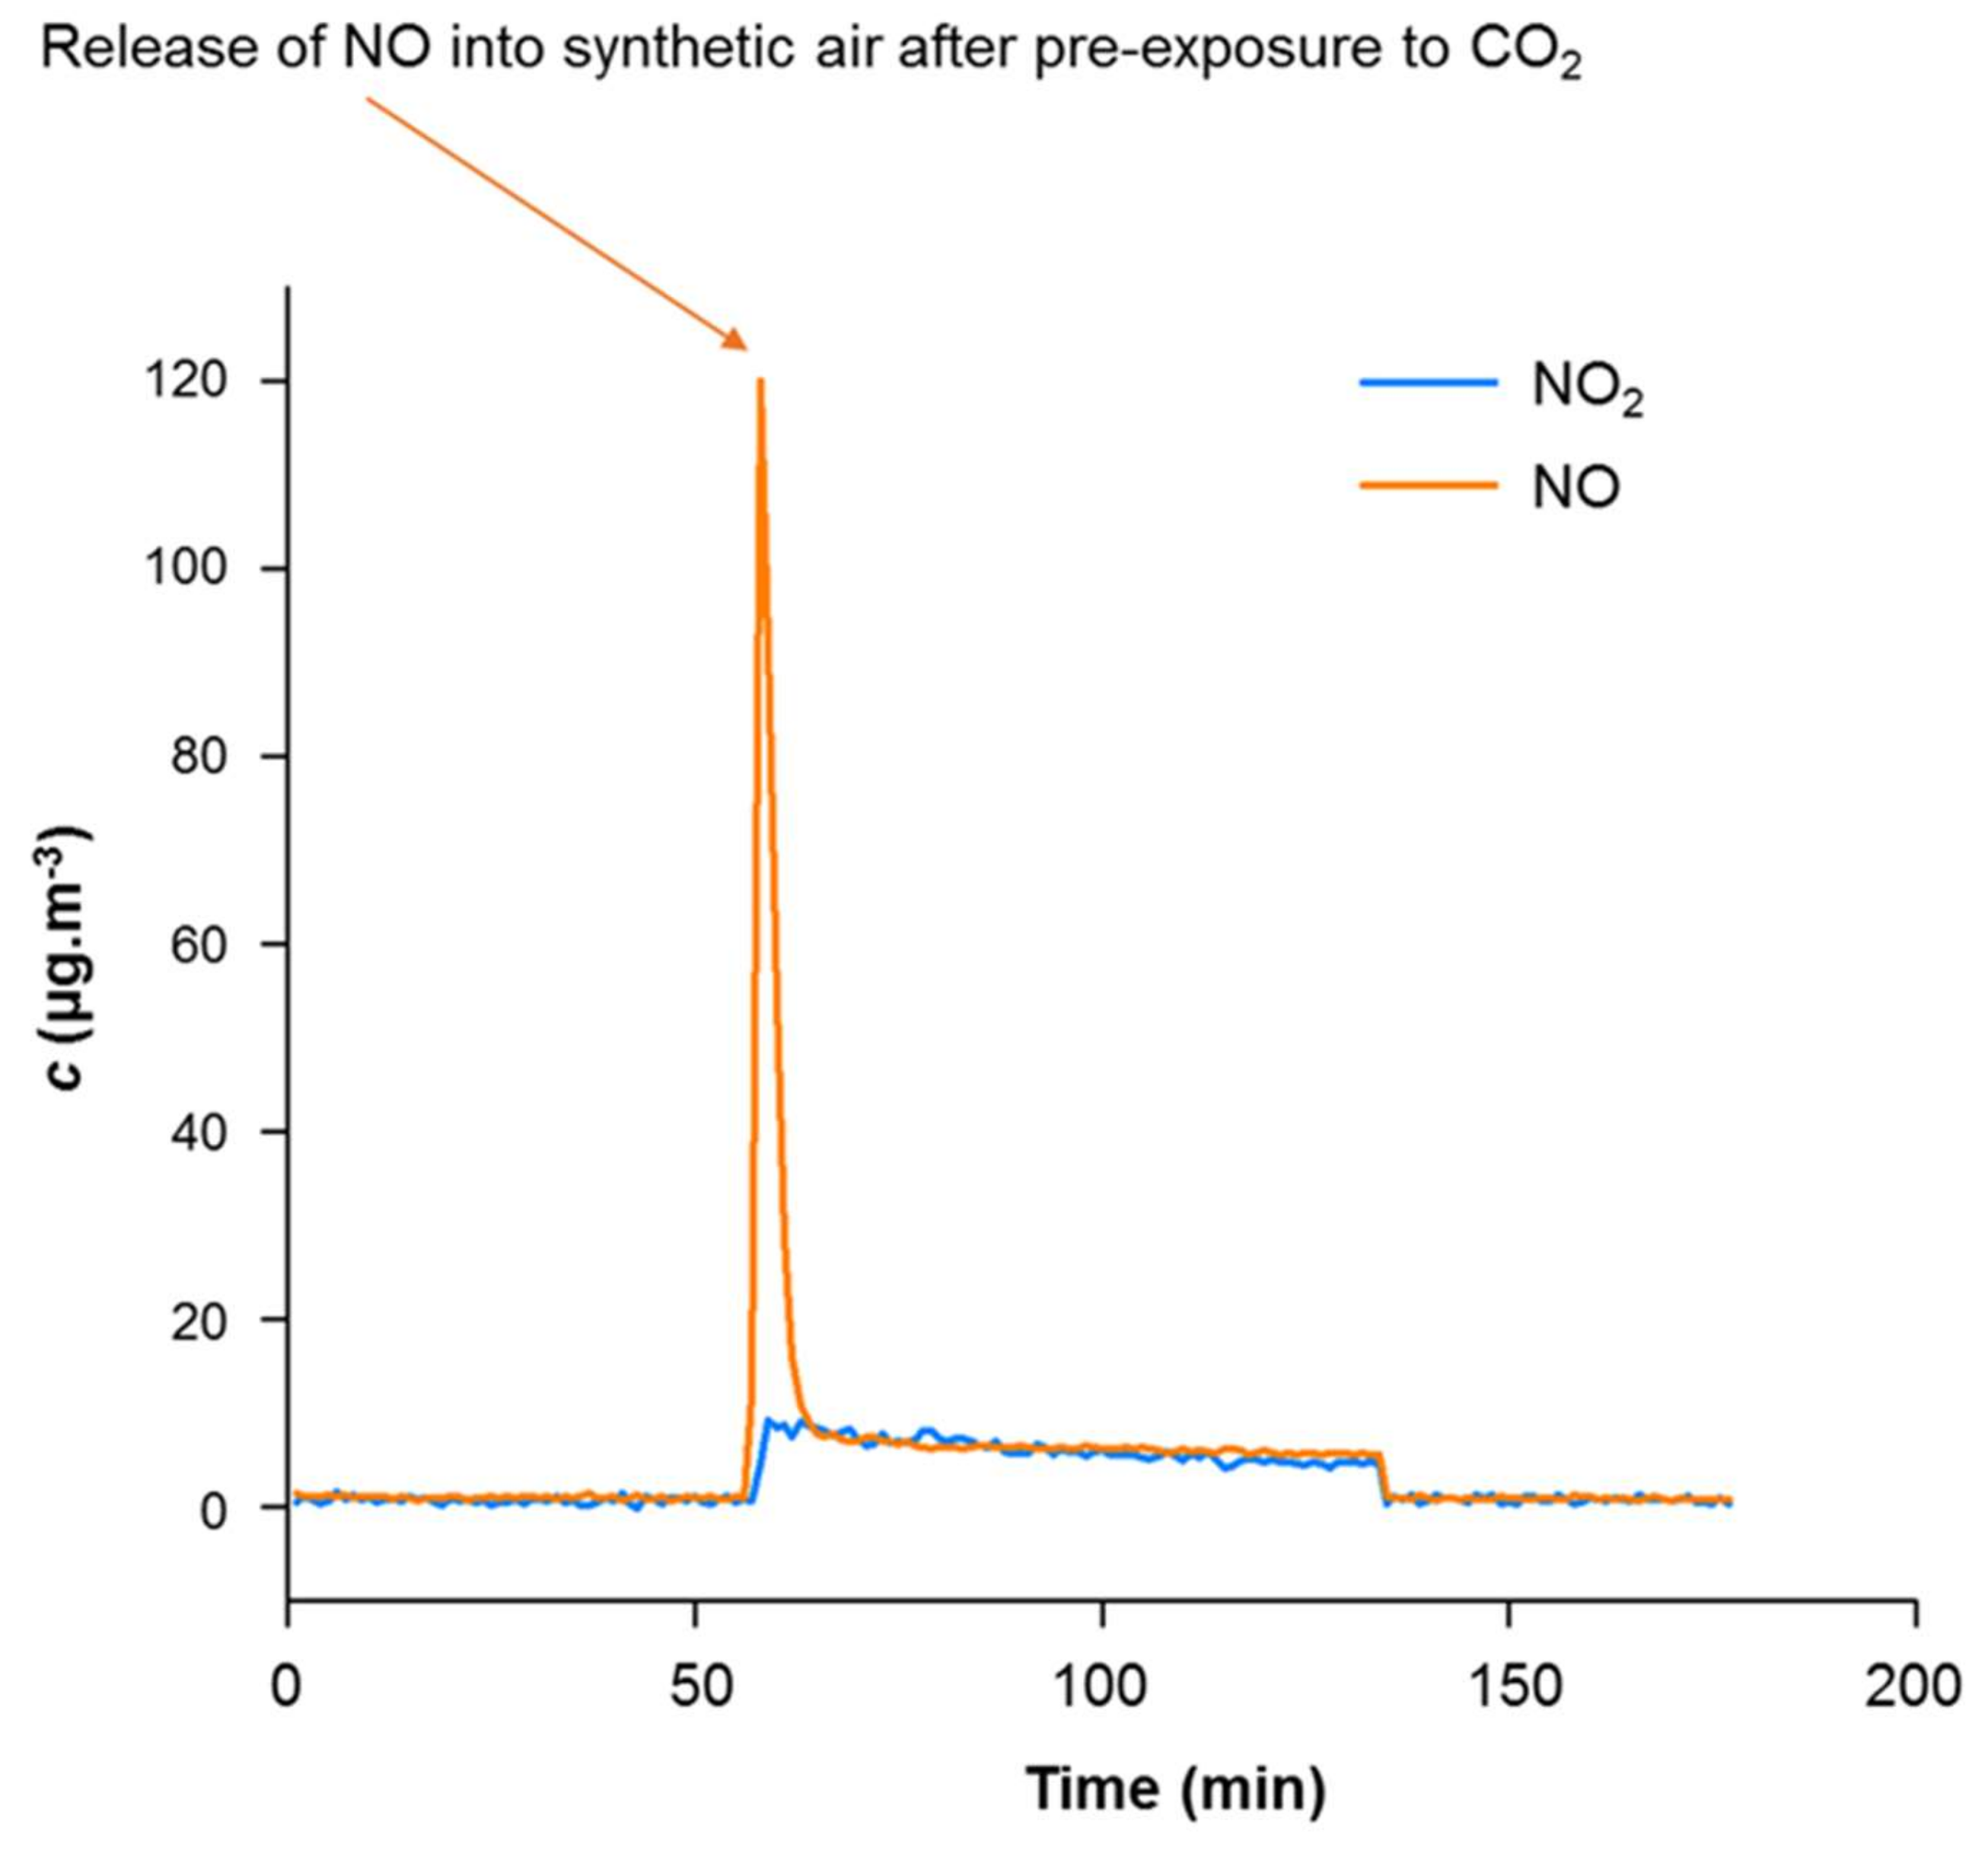
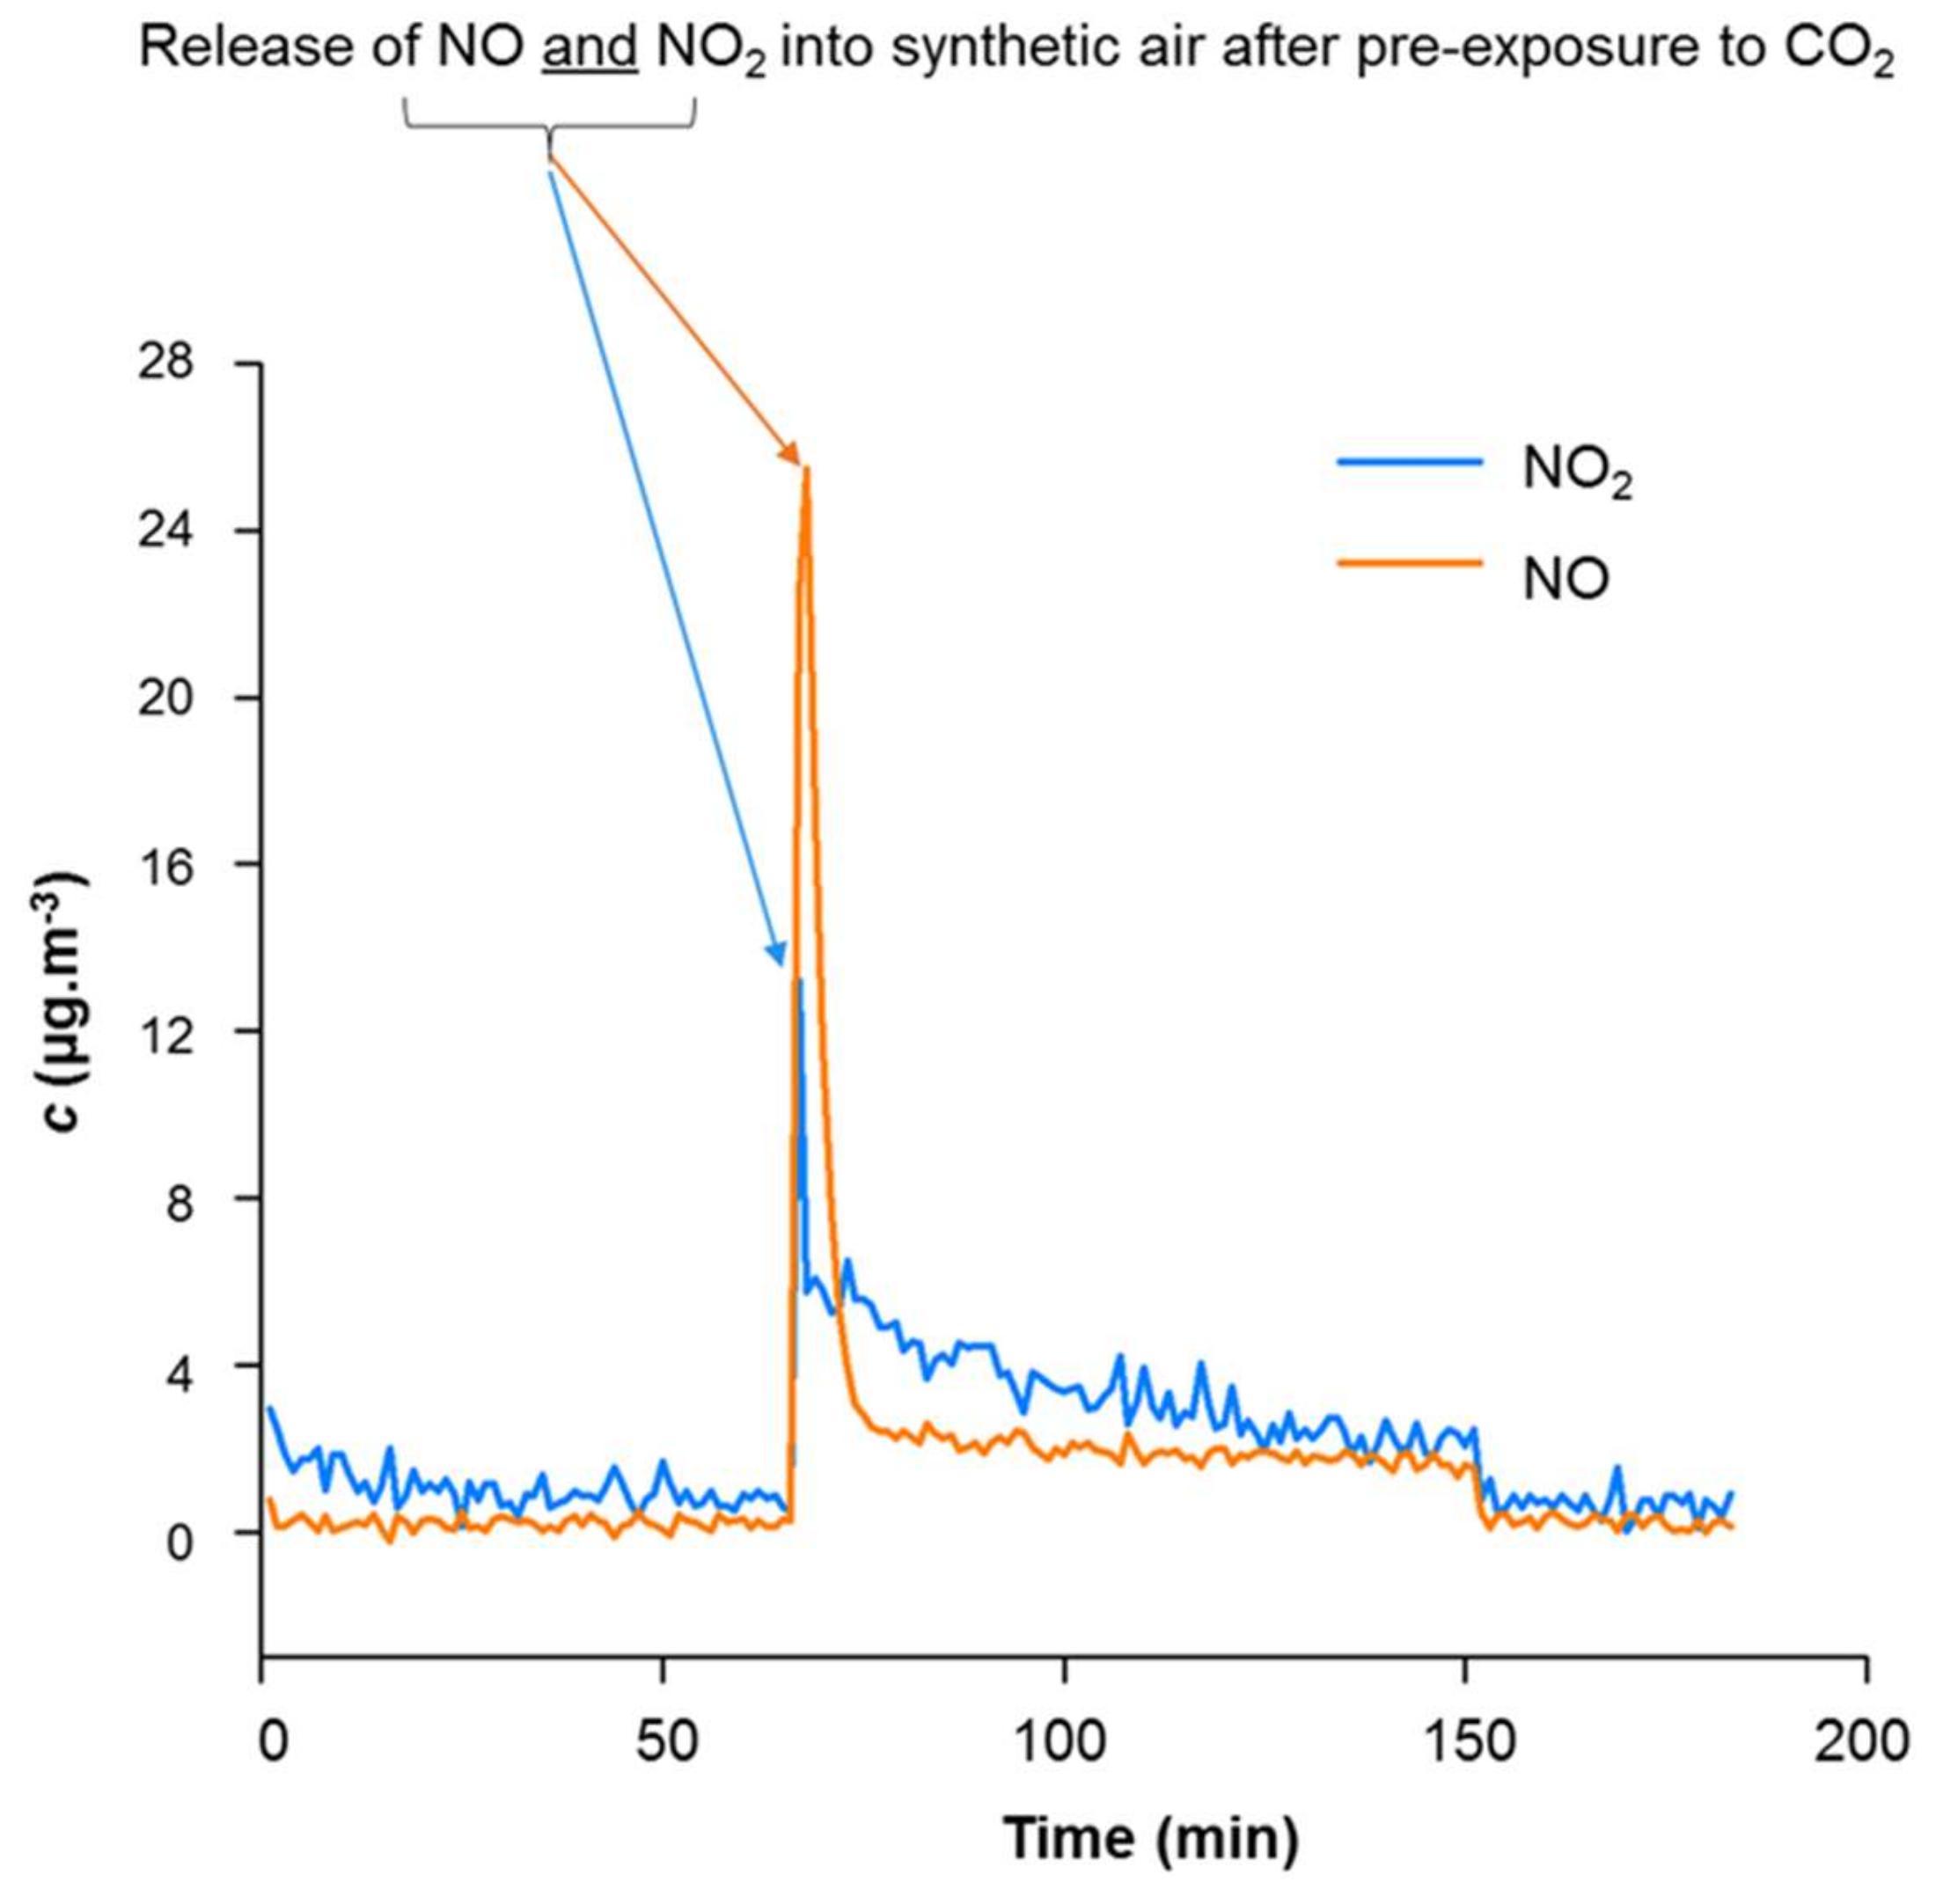
3.1.1. Confirmation of the CaCO3-NOx Reaction

A powder method was initially used to confirm the reaction shown in Equation (1) and in Figure 12. Powder, which was stored under ambient moisture conditions, was loaded into a chromatographic column with an inlet and outlet used to introduce and expel NO2 gas at an adjustable low flow rate. After given intervals of exposure time, a sample of the powder was recovered for liquid extraction to measure the nitrate and nitrite contents via ion chromatography.

3.1.2. Proof of Principle for Coated Samples

Constraints on measurement techniques limited the test volume design construct to one that could be sealed to enable single inlet and outlet points only, such that the pump action of the gas detector for ambient, or the overpressure from a synthetic gas bottle for synthetic air, NO2, CO2, etc., could be used to introduce and draw/pressurise gas through the filter housing.
Initially, some pre-tests were conducted using small samples of smooth coated substrate (coatings made by hand draw-down, as described previously) absorbing NO2 under static exposure conditions. Samples were cut from the larger filter element and placed in a 1-dm3 super syringe (Model S1000 TLL, Hamilton Co., Reno, NV, USA). The syringe plunger was inserted, and ambient air was expelled. Then, the syringe was joined to a synthetic NO2 pressurised bottle source, and the syringe plunger retracted to fill the body with NO2. In this way, the small coated samples were maintained for a given time and exposed statically to the NO2 gas at a concentration level of 10 ppm (18.8 mg·m−3). The test procedure is illustrated in Figure 13. After exposure, the samples were removed and stored in sterile sealed tubes, which were sent for microscopic analysis and either X-ray photoelectron spectroscopic (XPS) analysis or energy dispersive X-ray spectroscopy (EDS). Others were treated to extract soluble –NO2 and –NO3 salts into Milli-Q deionised water.
An ion chromatographic elution method for the efficient separation and quantitation of anions under isocratic conditions was employed. A chromatographic system (DionexTM DX-300, Thermo Fisher Scientific Inc., Waltham, MA, USA) consisting of a gradient pump, a chromatography module, a conductivity detector, an ASRS® suppressor, and a Peaknet 5.1 chromatography workstation was used. The injected volume was 0.05 cm3. The chromatographic separation of anions was performed on a column (DionexTM AS14, Thermo Fisher Scientific Inc., Waltham, MA, USA) at ambient temperature with a flow rate of 1.0 cm3·min−1. A working eluent containing 3.5 mM Na2CO3 to 1.0 mM NaHCO3 was appropriate for this purpose. This method was used for the chemical analysis of nitrate (NO3) and nitrite (NO2) at concentrations above the detection limits (DL) in the direct water extract of the filter. The DLs were 0.05 mg·dm−3 and 0.1 mg·dm−3, respectively. Other anions, such as fluoride (F) and phosphate (PO43-), were generally below their DL in these samples, but sulphate (SO42−) was detected in the blank filter samples arising from the recycled pulp used to make the substrate containing traces of bleached fibre. The response to concentration was linear over the working concentration range (R2 > 0.999).
Example uptake data from two tests of each coating on unbleached Kraft (UK) and newsprint (NP) comparing blank (non-exposed to synthetic NO2) and exposed (exposed statically in the super syringe to synthetic NO2 at 10 ppm for 72 h) samples are shown in Table 6. Repeatability was explored using only two samples in this preliminary case.
The samples had already reacted partly to produce nitrate simply by pre-exposure to ambient air (Table 6). This was expected, but it indicated that, when designing such filters, a simple surface adsorption does not suffice, as a stored filter under ambient conditions would eventually have its surface completely saturated by absorbed gas, whereas the shelf life of a reactive material is far longer since the material itself becomes gradually consumed. In addition, the reaction could be damped unless the reaction product(s) are removed. Given the sealed nature of this experiment, reaction products were not removed during exposure.

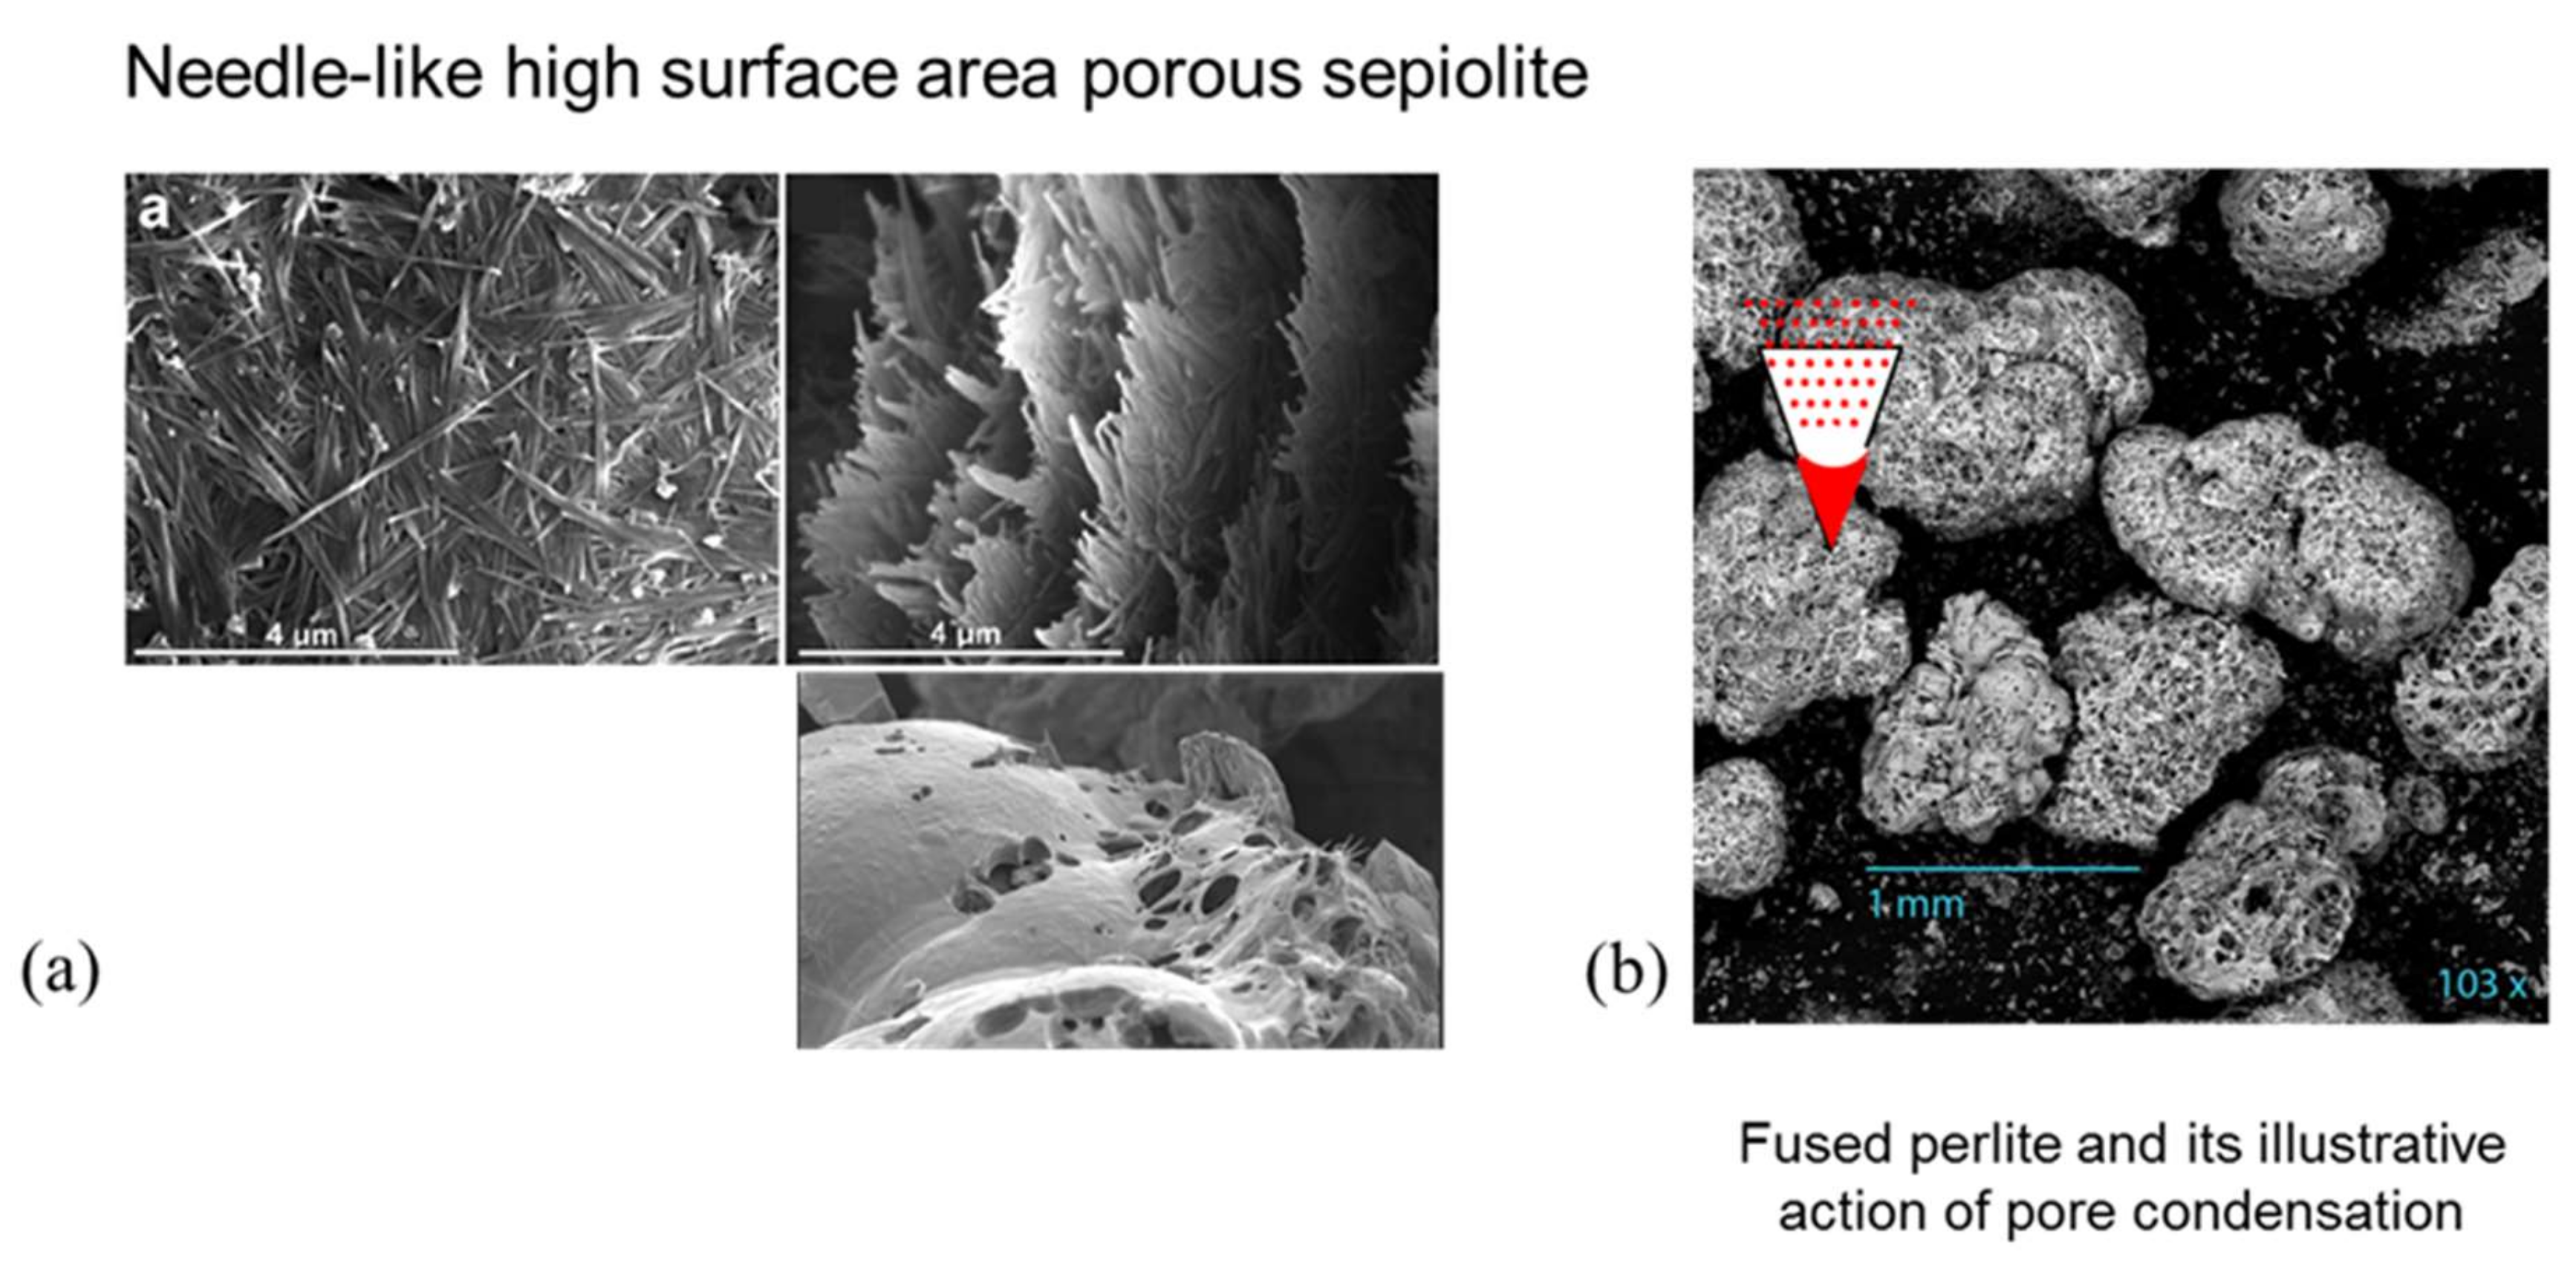
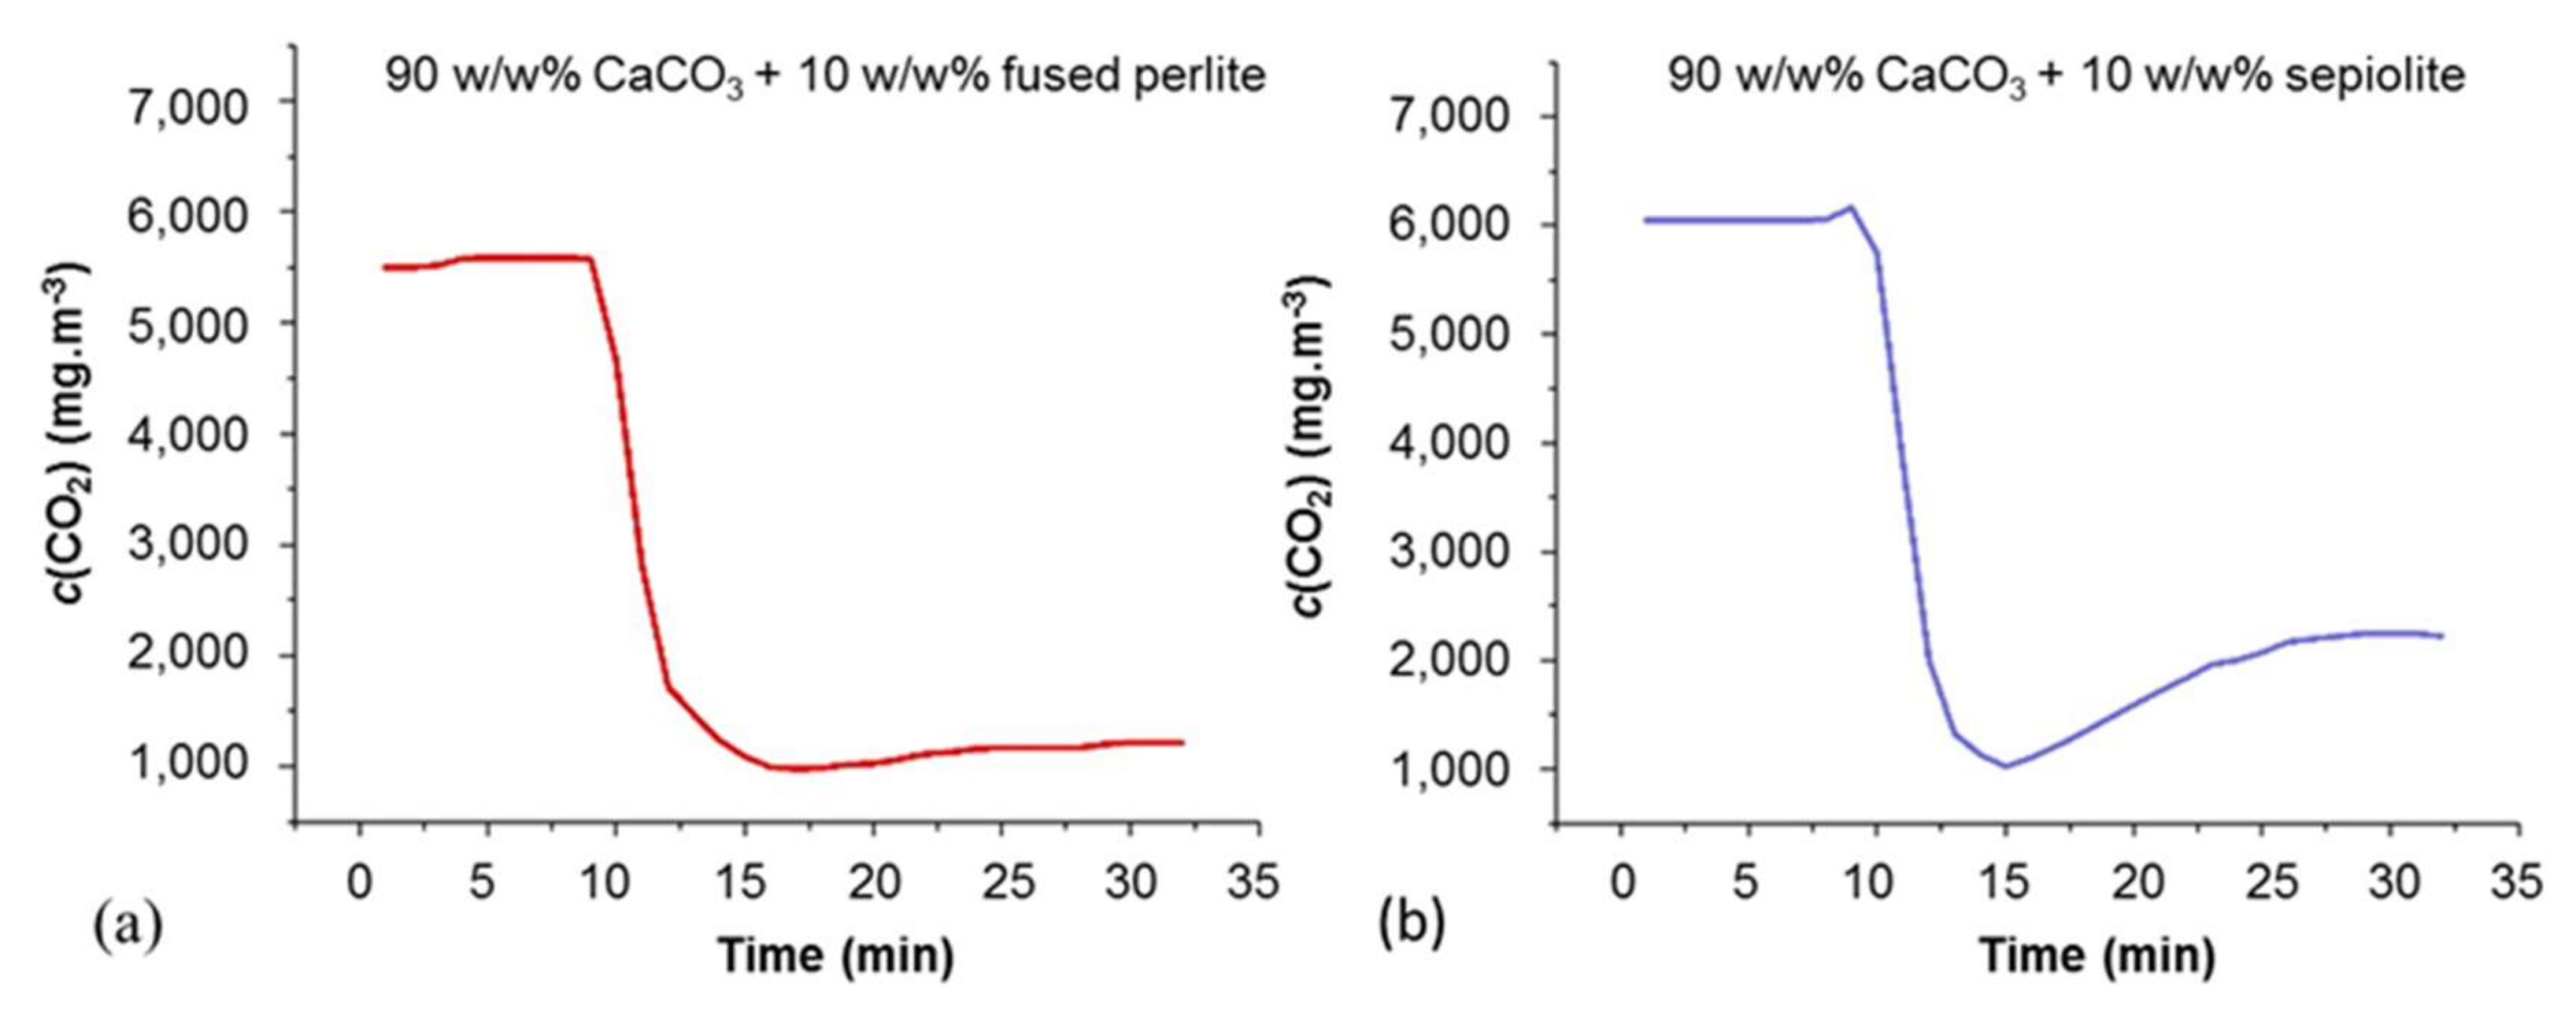
3.1.3. Pluses and Minuses of Adding Inert (Non-Reactive) Surface Area

Traditional wisdom suggests that increased surface area leads to enhanced absorption efficiency. However, as shown in Equation (1), the task in this study is to promote salt conversion, and, therefore, consumption of the sacrificial calcium carbonate (CaCO3). This leads to two important conclusions. First, if the mechanism is one reaction and not simply surface adsorption, then using another material of higher surface area will reduce the end capacity of the filter since capacity is ultimately defined by the salt conversion. Therefore, the sacrificial carbonate is present on the surface area. Second, increasing surface area should only speed the absorption at the outset of exposure. However, since the carbonate is being sacrificed, it is etched during the reaction such that the surface area of the reactive surface automatically increases. The corollary of the second conclusion is that particle size, and, hence, starting surface area within a reasonable range is not of paramount importance.
To test these assumptions, the CaCO3 powder material was modified by employing CaCO3 in the synthesis of hydroxyapatite (HAP). The formation of high surface area plate-like nanometre-thick flakes of HAP on the surface of the calcium carbonate particles provides an easy way to dramatically increase the overall surface area. The synthesis of HAP was performed by adding NaH2PO4 (Riedel-de HaënTM, Honeywell, Charlotte, NC, USA) into the CaCO3 suspension and by leaving the mixture for 1 h to interact and form HAP particles spontaneously (500 cm3 deionised water + 5 g CaCO3 (pH 9.20) + 3 g NaH2PO4 (total solution pH 5.88), which resulted in a pH of 7.01 after 1 h and indicated reaction completion). Synthesis was performed at 30 °C under constant stirring. All reagents were pro analyst (P.A.) grade. The precipitated HAP on carbonate samples was filtered from the mother liquors and washed with deionised water. The samples were dried at 50 °C overnight and manually ground to powders. Furthermore, SEM, EDS, and BET analyses were performed to characterise the products before NO2 exposure. The SEM images in Figure 14 display the successful surface transformation of calcium carbonate to hydroxyapatite.
Comparative surface area data are shown in Table 7 in which a nearly 20-fold increase in specific surface area was achieved by conversion to hydroxyapatite (HAP).
The comparative samples of GCC and HAP were exposed to NOx gas using a wash bottle system connected with an Erlenmeyer flask (Figure 15). Five grams of the powder material was first placed in the flask. The NOx gas at 10 ppm flowed through the system over the sample from the wash bottle for 1 min. Next, 30 g of water was added, and the mixture was shaken. The solution was then extracted by filtration and analysed again by ion chromatography in accordance with the applicable standard (Velthaus et al.) [27].
The data show that there was no advantage with respect to the desired nitrate formation for the same exposure time (Table 8) at the NO2 concentration of 10 ppm. However, the increased hygroscopy of HAP promoted the formation of nitrite.

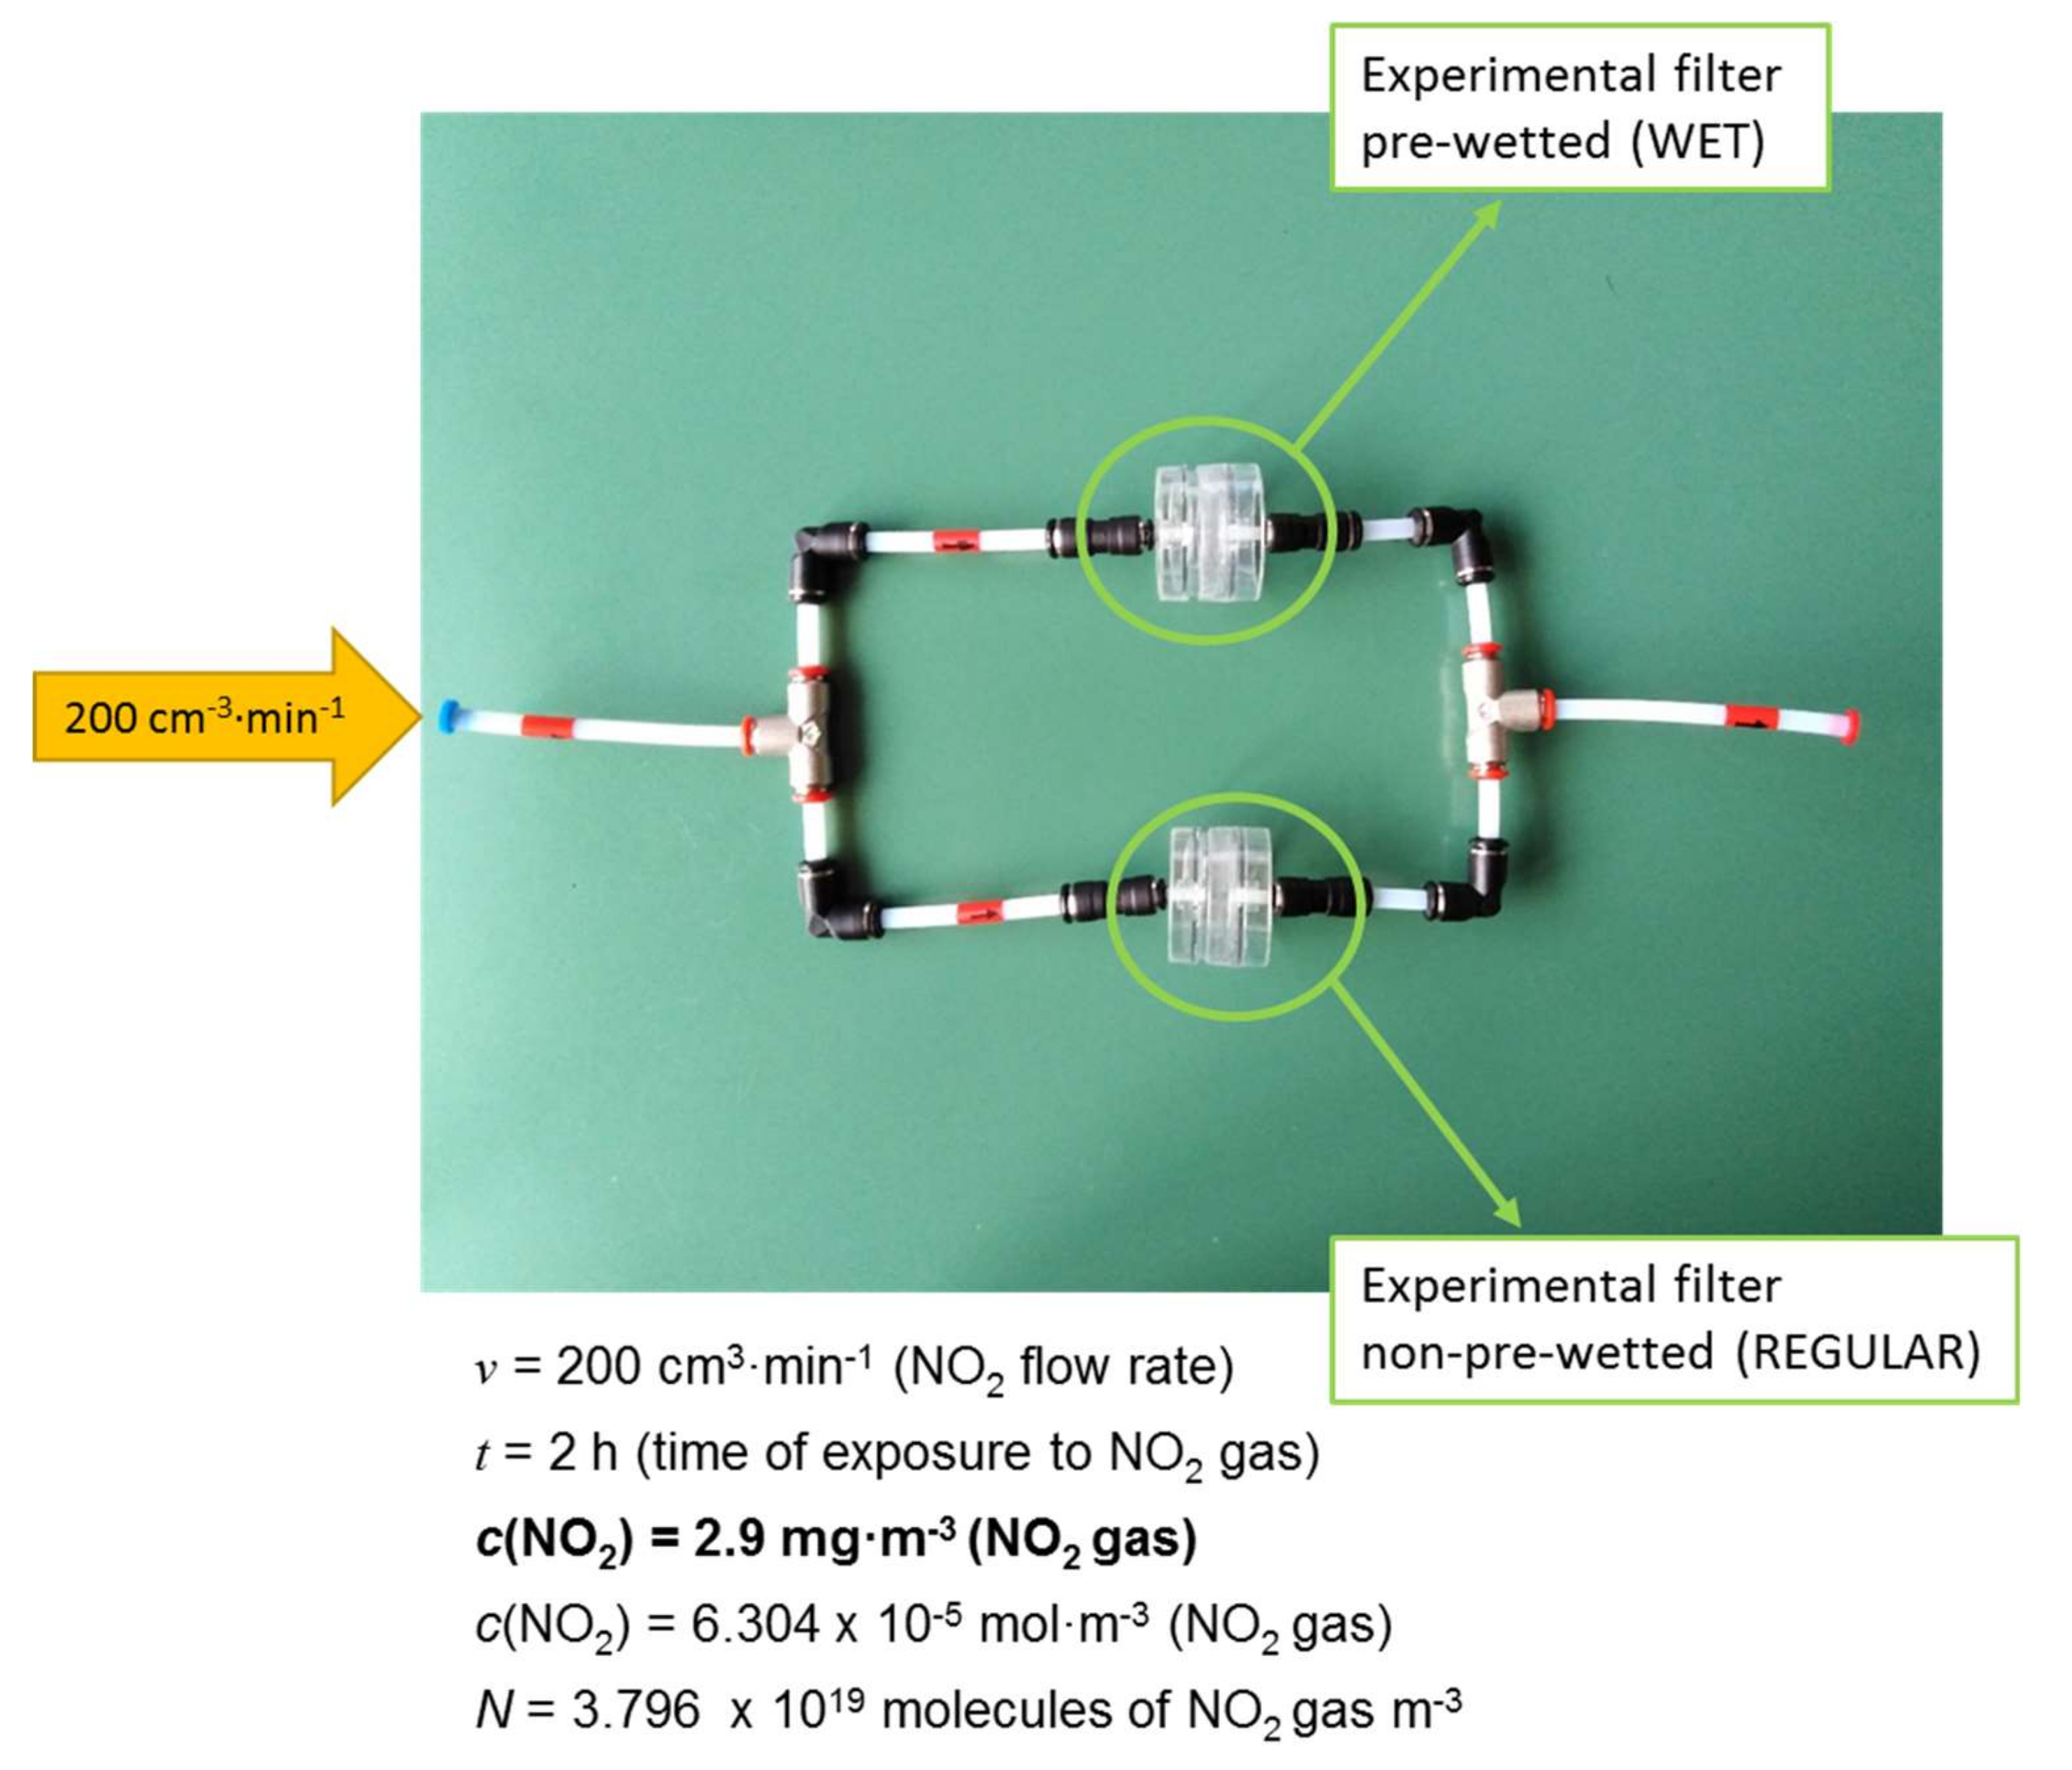
3.1.4. Effect of Moisture

To test the function of the coated substrate under forced through-flow conditions, small cut samples were placed in a clip-together design plastic cassette (Model CU37045–37 mm, Environmental Express, Mt. Pleasant, SC, USA) usually used for sampling dusts, fumes, and mists. However, the membrane was exchanged for an experimental active NOx absorbing filter. Such filter systems come with piping kits, and the set-up used to deliver synthetic NO2 from a gas bottle under pressure-controlled flow rate is shown in Figure 16. Using this method, it was possible to investigate the gross impact of moisture, and, thus, test whether the humectant action of MNFC alone was sufficient to promote the salt conversion in the coating, or whether higher moisture levels were required. To do this, one sample was wetted using an aerosol spray to a level of approximately 50 w/w% deionised water. After exposure for 2 h at a volume flow rate of v = 200 cm3·min−1, the samples underwent extraction and analysis by ion chromatography.
Ideally, and a subject for future work, would be to use a moisture-controlled chamber environment to pre-condition the inlet gas. Additionally, a full knowledge of moisture held in the coating would be of value in designing coating formulations and the humectant level. A rough estimate of moisture content in the coating layer held within the MNFC humectant binder can be considered from prior art. For example, the review of Vilela et al. [28] offers a value of ≤ 9 w/w% H2O based on nanofibrillar cellulose under the conditions of 60% RH at 20 °C. In this work, however, the important factor is that wet versus either ambient air moisture or moisture retention in the MNFC component under dry gas exposure results in a different balance of nitrite to nitrate salts.
In a perfectly balanced system, an inlet flow rate of 200 cm3·min−1 would be expected to split equally between the two experimental samples. However, this is unlikely in practice. Because the flow resistance in each separate cassette is unknown, it is impossible to calculate the relative gas volume rate exposures. Nonetheless, the experiment provided a noteworthy result (Table 9) in that high-water content promoted the formation of nitrite with no extra nitrate formed when compared to the dry starting blank material, which was itself exposed since production to ambient storage air. This finding confirms that the use of humectant was superior to a separate moisture supply and suggests that analysis of nitrite could have been detecting dissolved NO2 rather than the conversion of salt to nitrite.

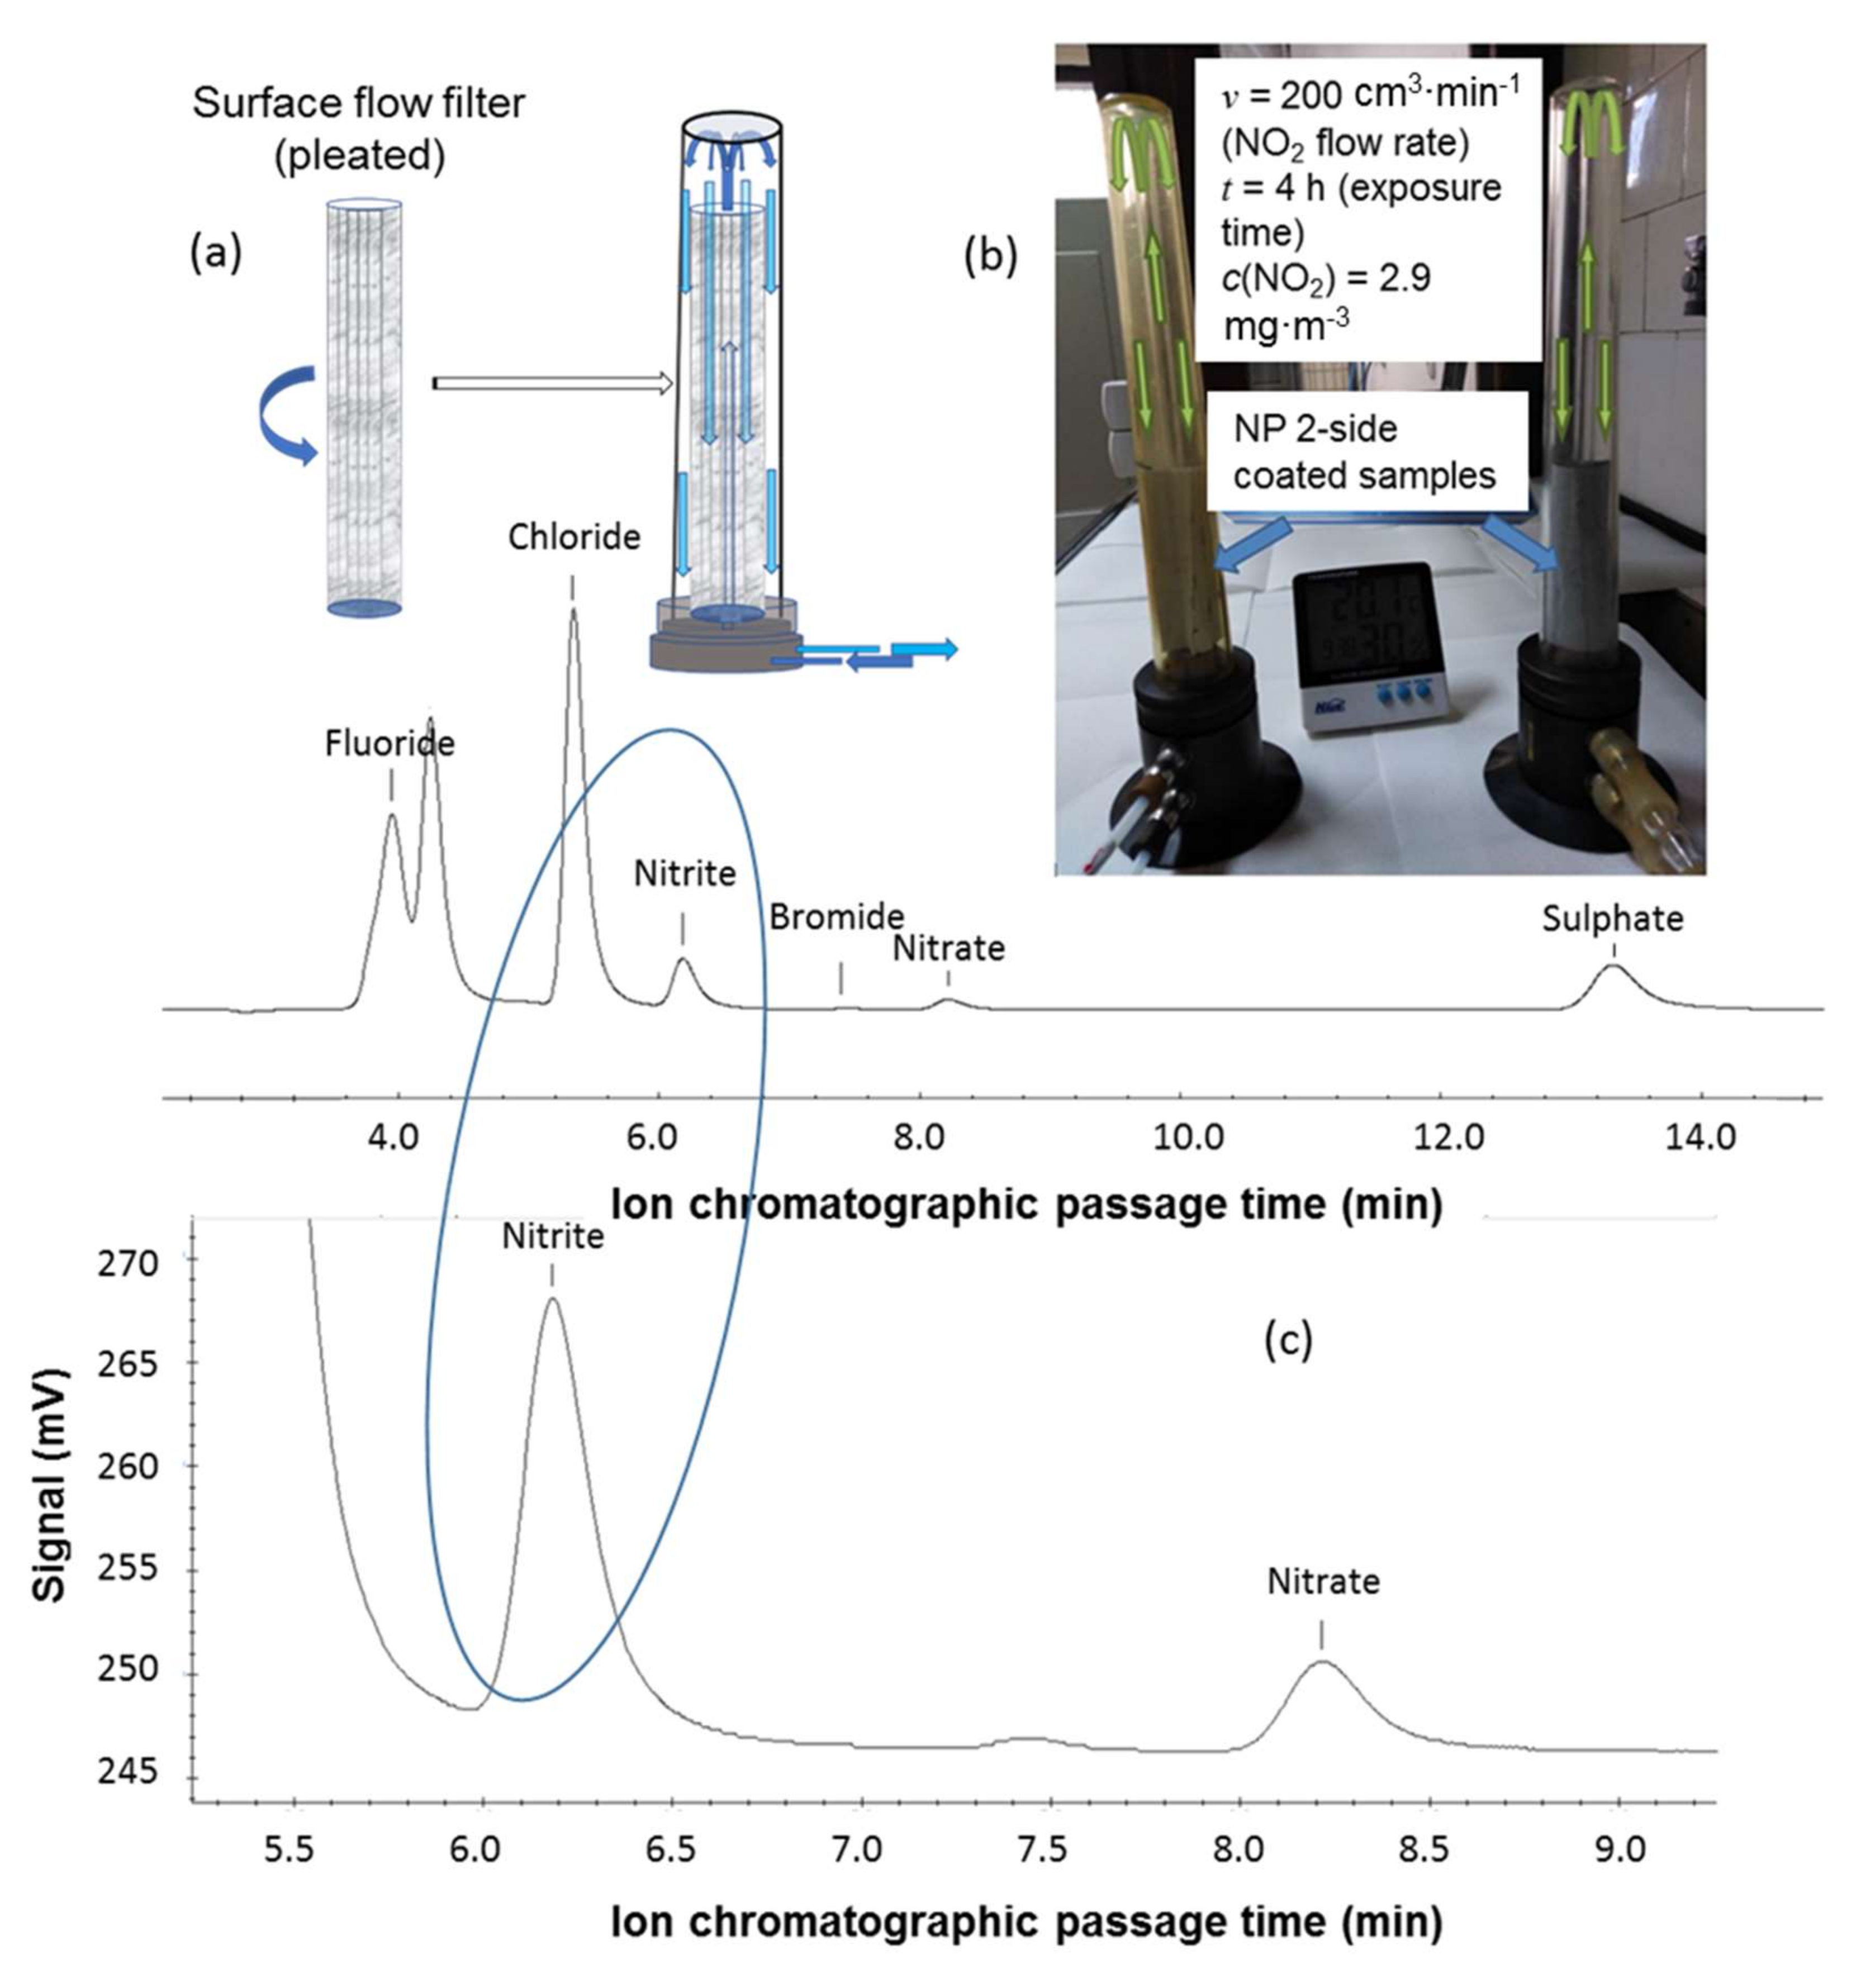
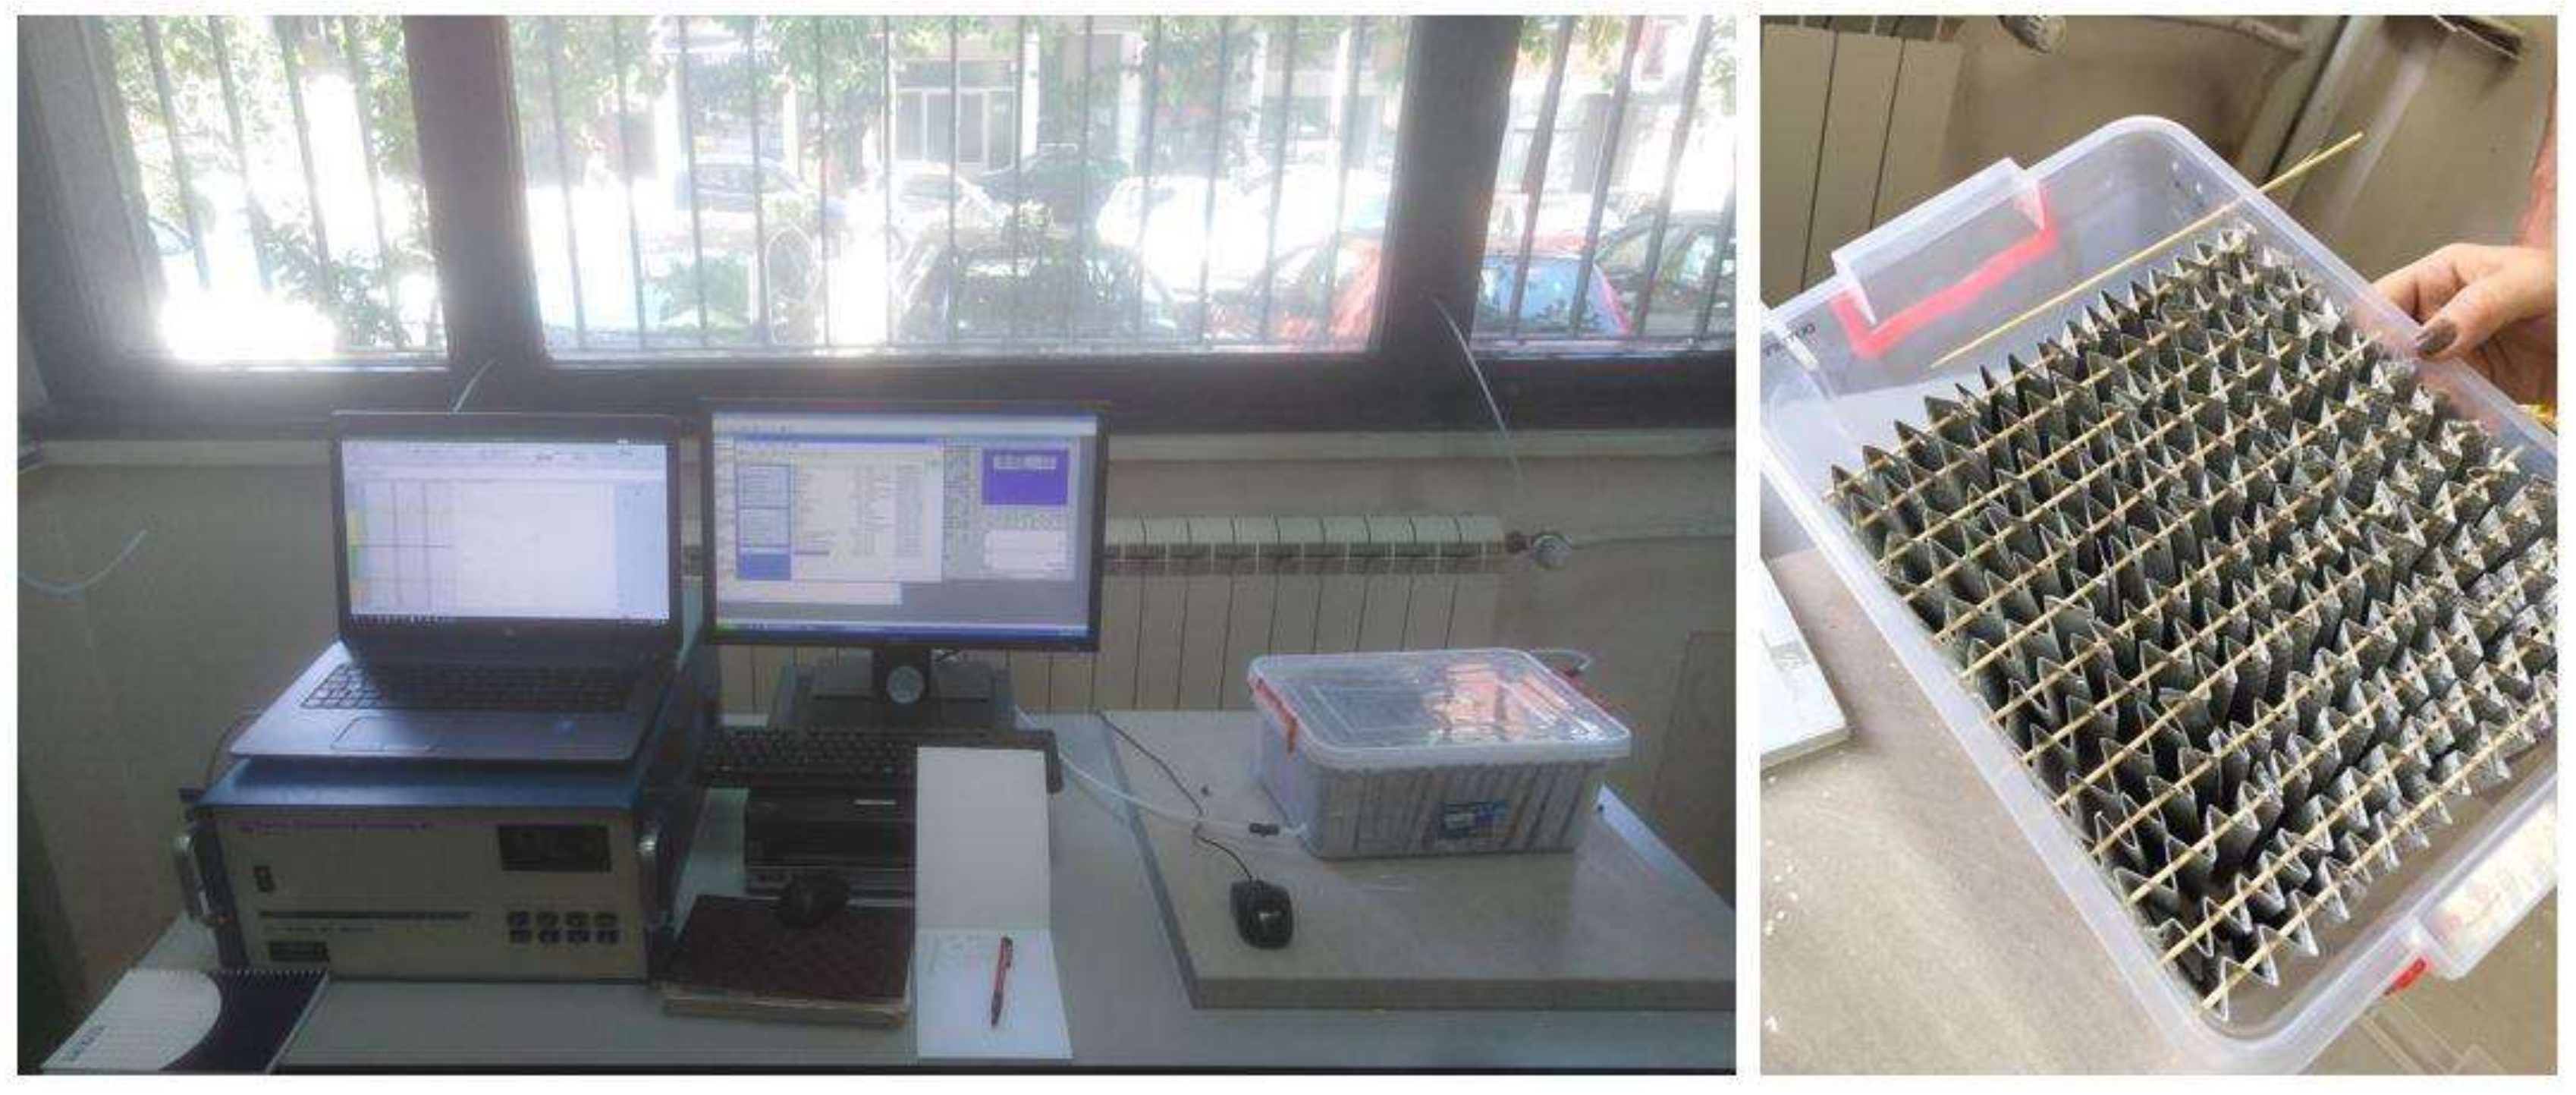
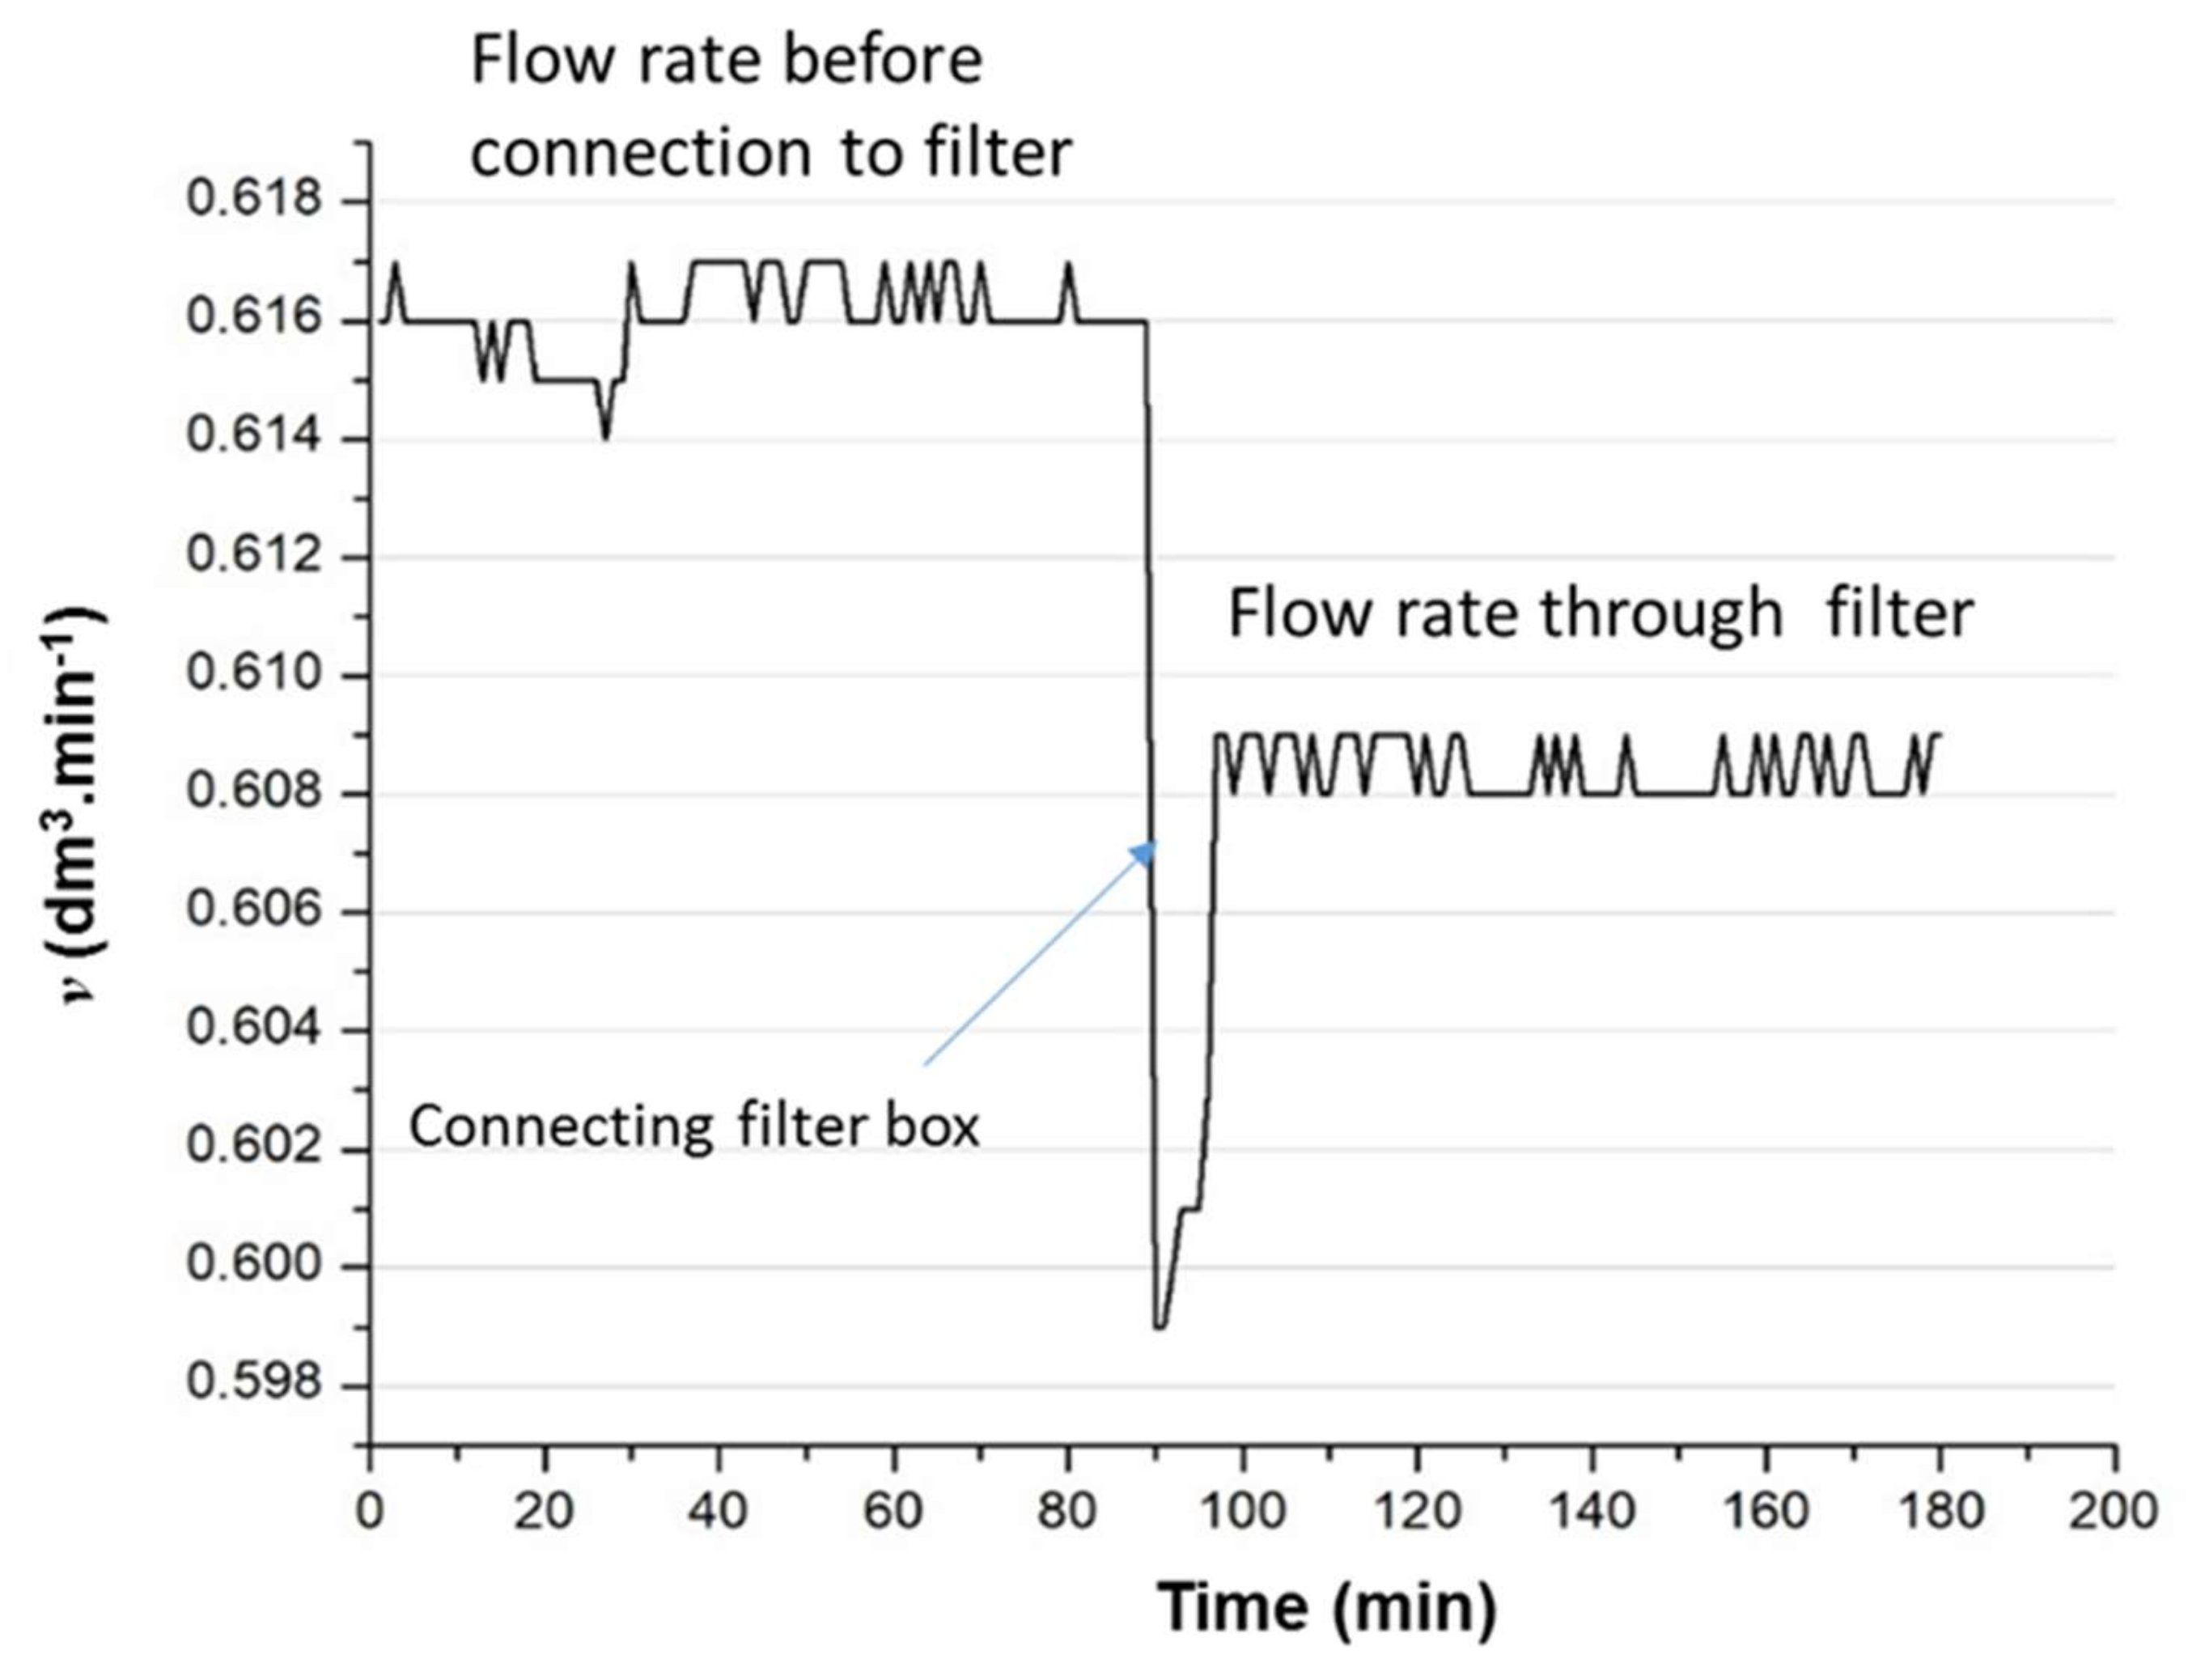
3.1.5. Surface Flow Method

At this stage of development, the proof of principle that the coated substrate provides an active NO2-sorbing filter in both static and through-flow configurations was supported. However, although potentially greater total surface area of filter might be required, the energy-saving benefits of using natural draughting (air flow induced by geometrical or thermal gradient design) to provide surface flow encouraged the investigation of methods to evaluate gas sorption via surface exposure alone.
Surface flow analysis was developed in two steps in which the first was at a relatively low surface area capacity and was followed by higher surface area capacity to evaluate the capacity of the filter material for repeated cyclical exposure. The initial experiments were conducted using a traditional mechanical style flow meter, as shown schematically in Figure 17a and in practice in Figure 17b. The gas was inlet through a central vertical pipe, and it flowed back down through the surrounding volume in which the smooth two-side coated filter was placed. To increase contact area, the filter was pleated with successive parallel folds. The flow rate was controlled at v = 200 cm3·min−1 with an extended exposure time of 4 h.
The method was used again to establish the role of moisture for the surface flow mode. The predominance of nitrite under pre-wetted conditions (approximately 50 w/w% water content) confirmed that the sorption mechanism was likely one of NO2 gas dissolution when excess moisture was present, and it was dominant over the desired active salt conversion of the calcium carbonate, which was effectively suppressed (Figure 17c). Therefore, the localised humectant action of MNFC in the coating was confirmed to be ideal for promoting the desired nitrate formation rather than moisture saturation in both the through-flow and surface flow configurations.

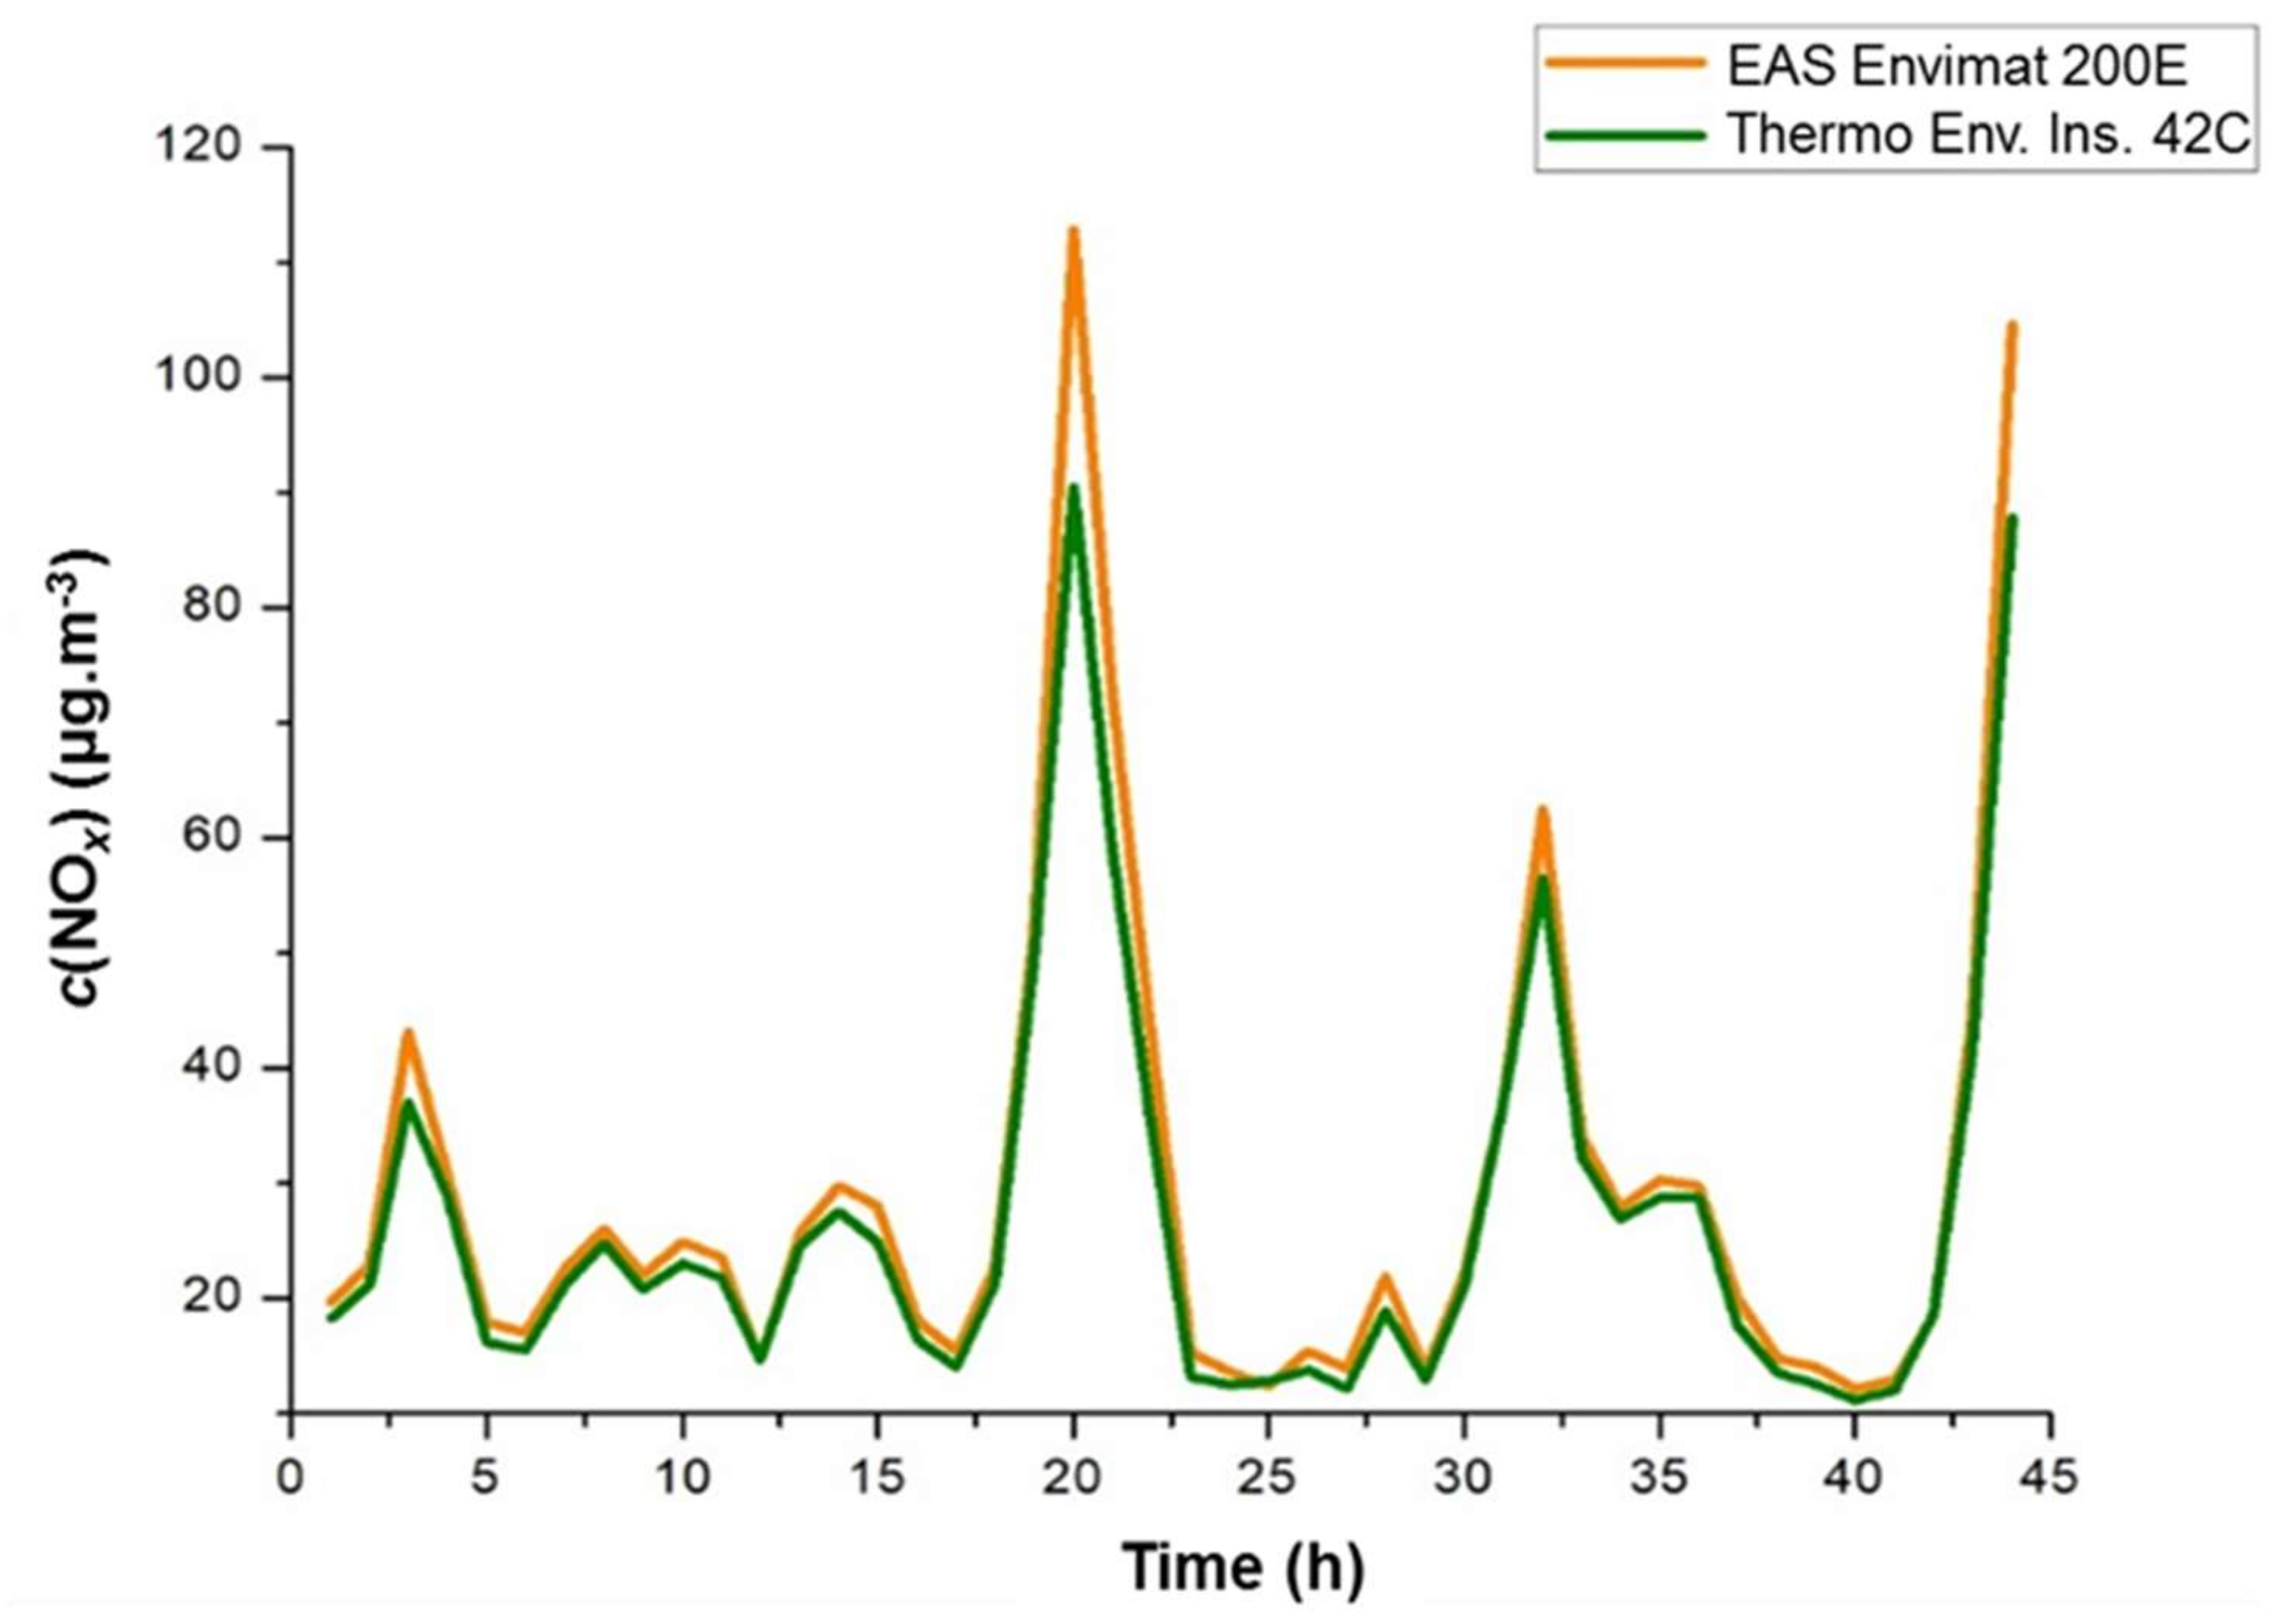
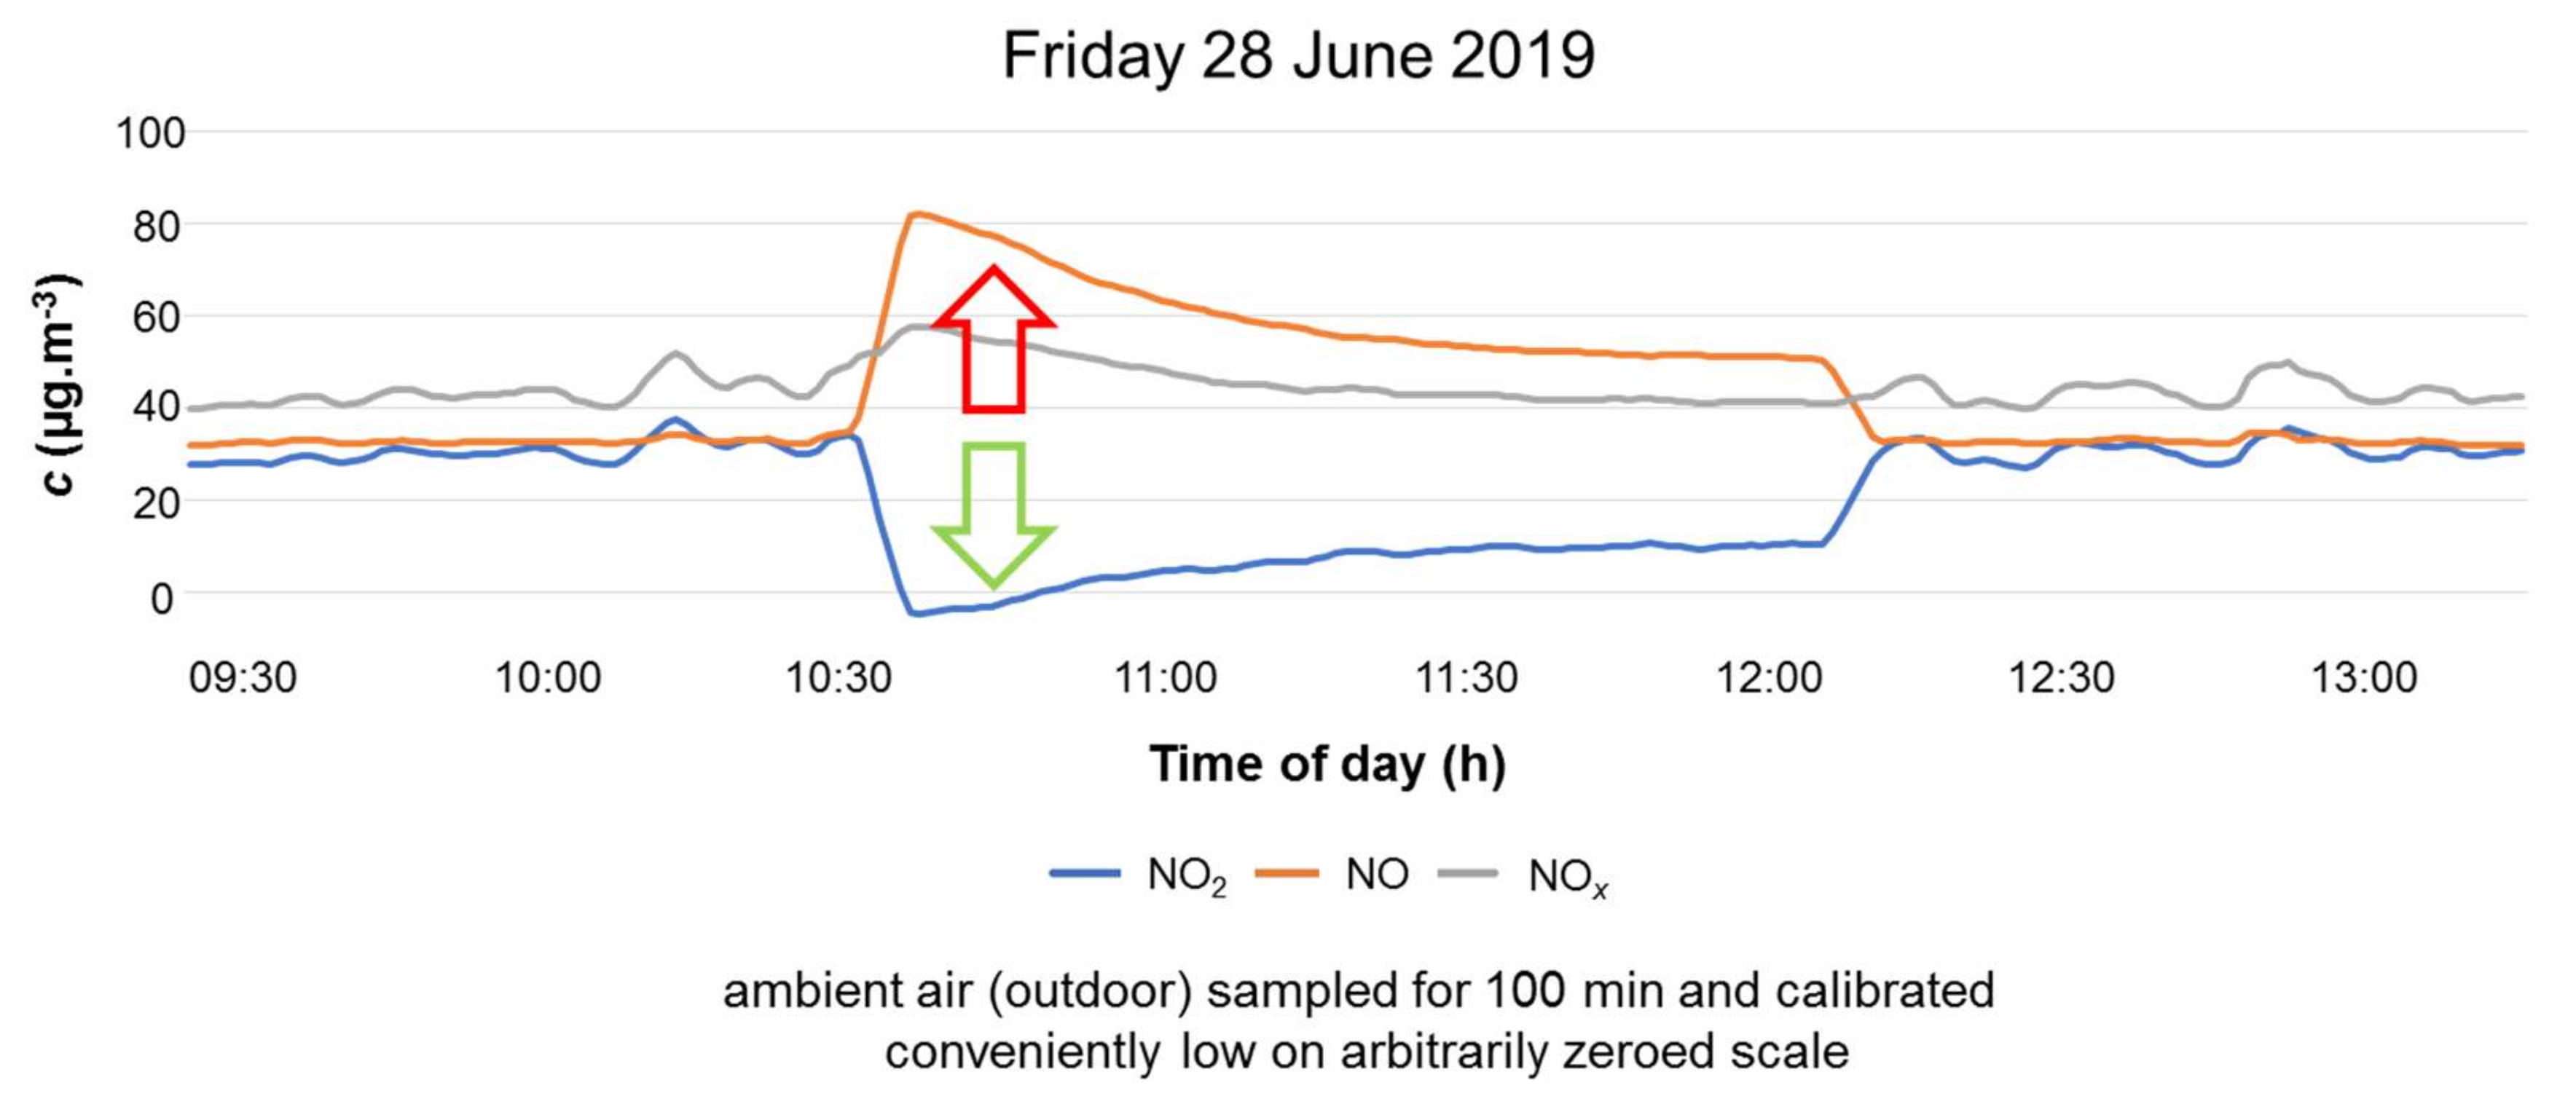
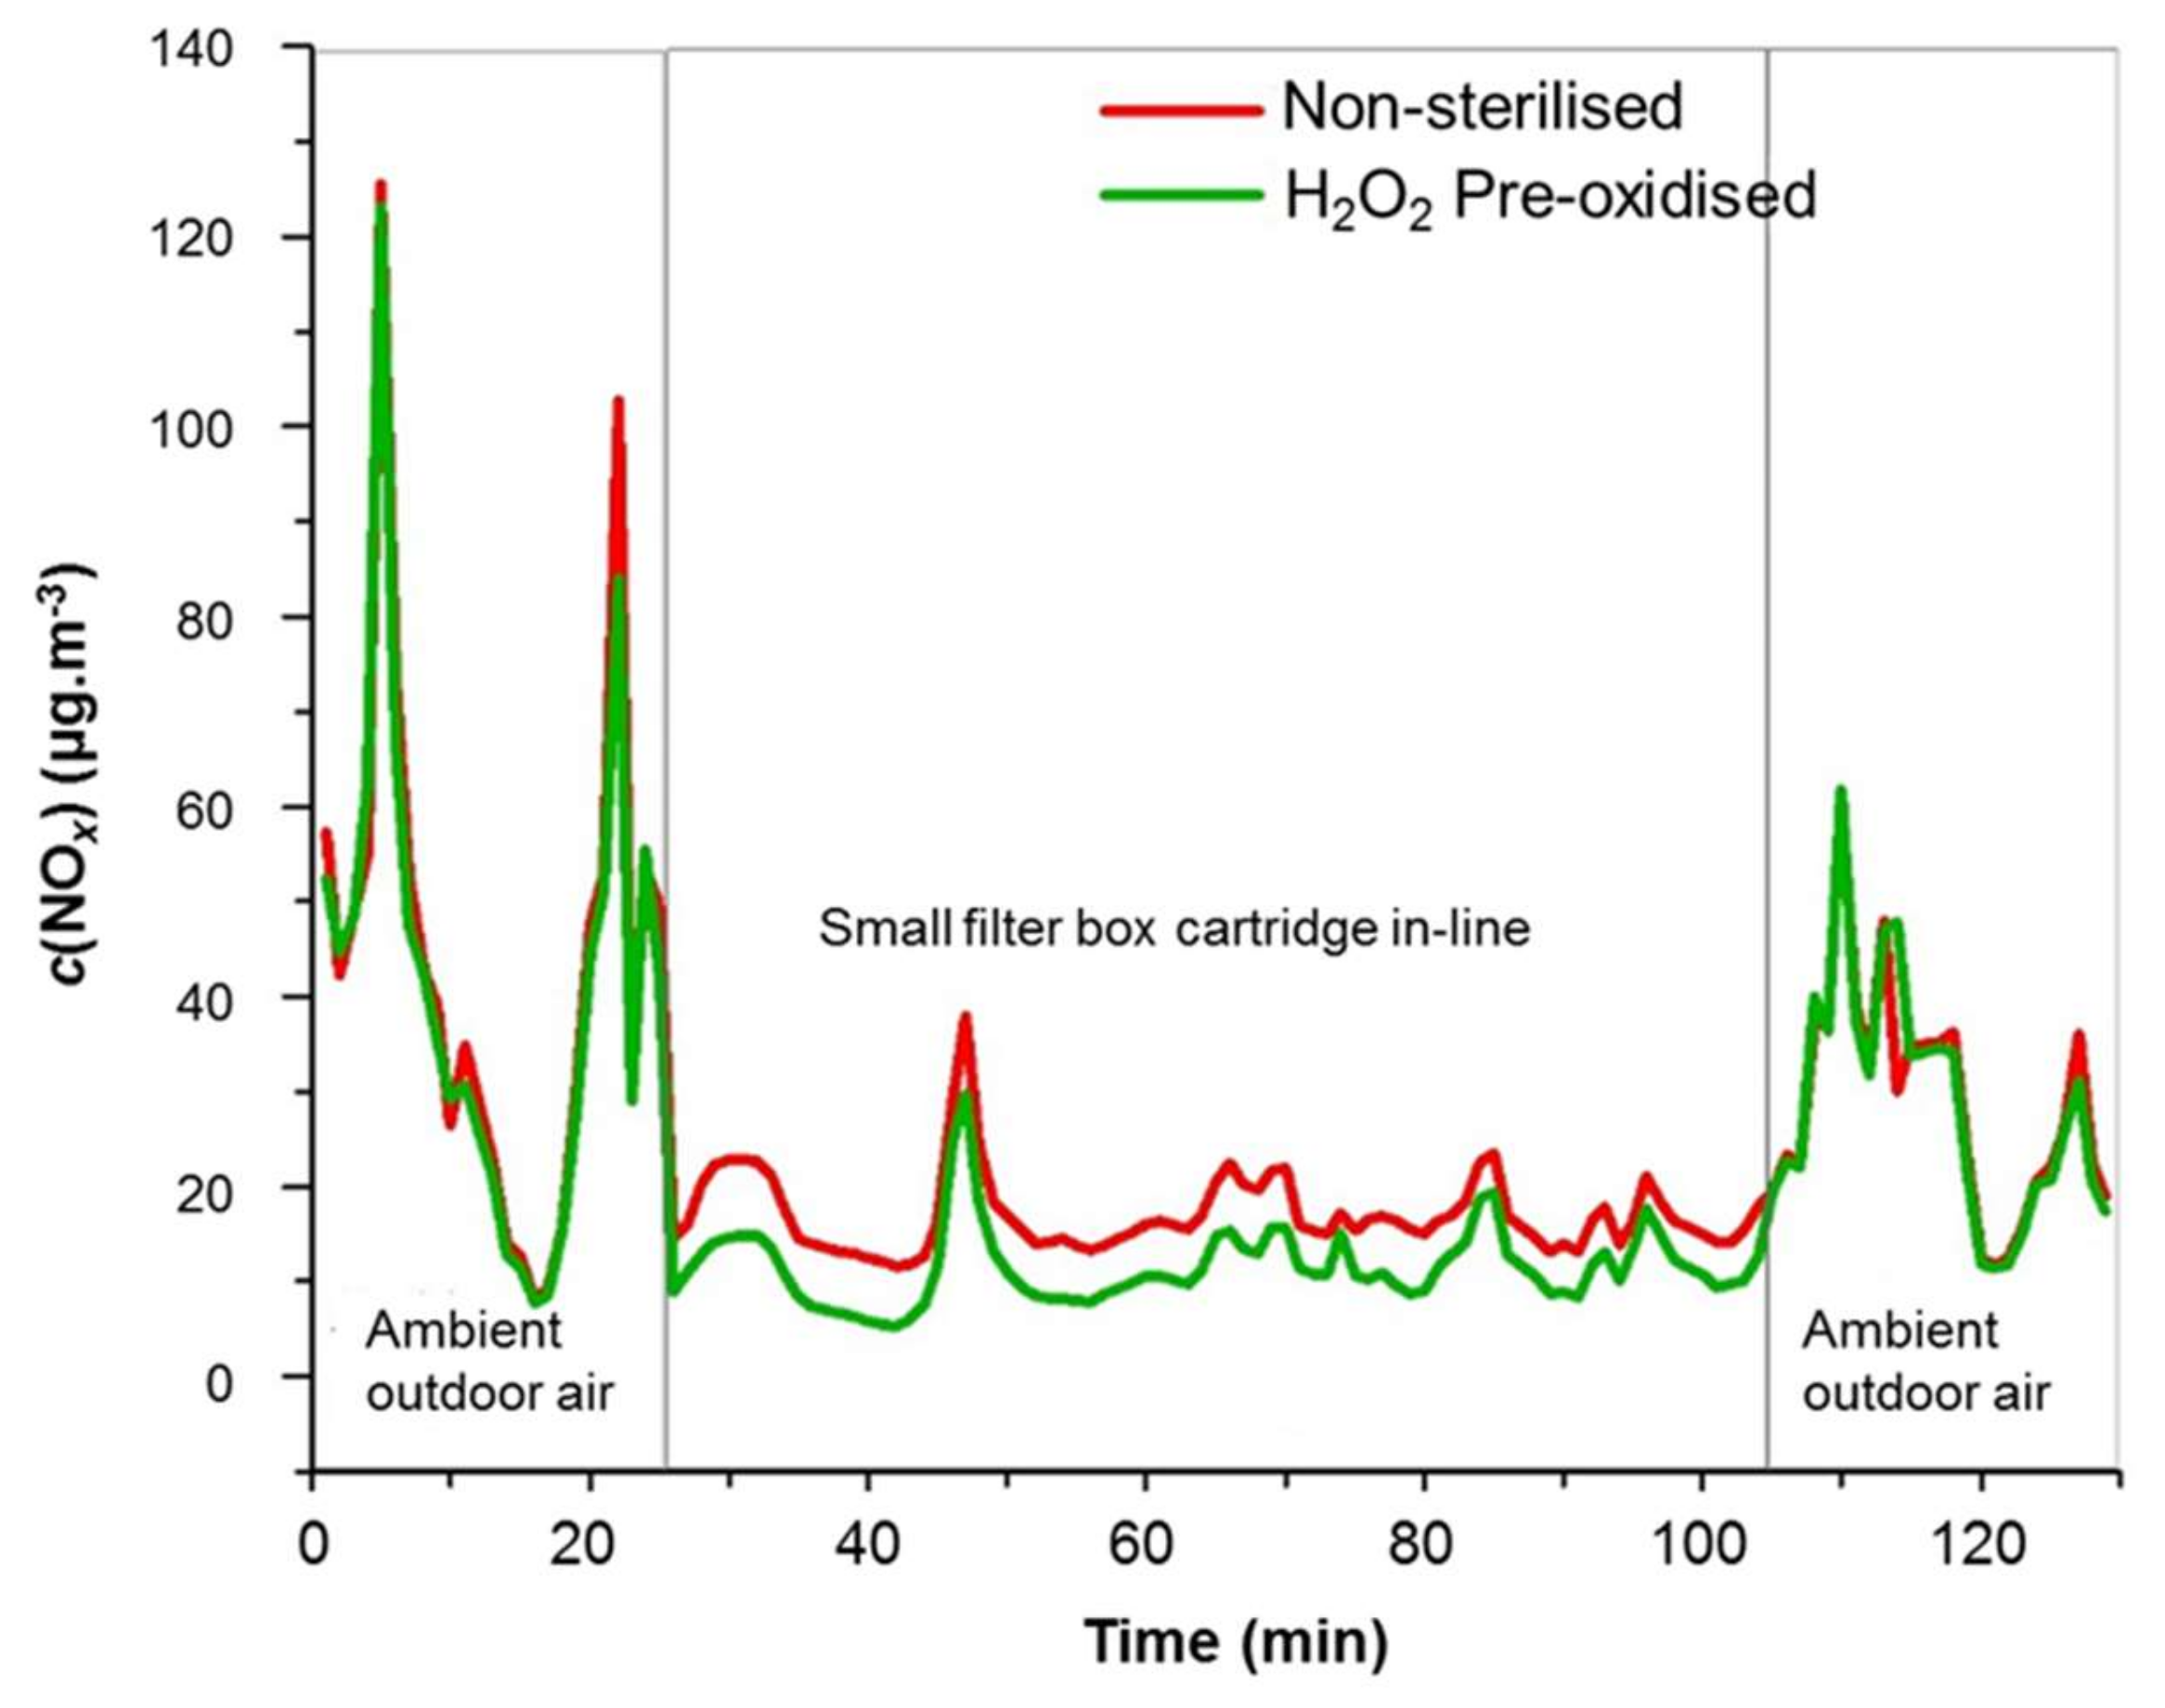
3.2. Filter–Surface Flow in Real-time Air Environment

In the days leading up to 27 October and 4 November 2019, the Balkan region in Eastern Europe was reported by the monitoring system AirVisual (Goldach, Switzerland), based on official sampling by the respective environmental protection agencies, to be among the most polluted environments globally. Belgrade, which is the capital of Serbia, reached levels of particulate pollution that caused it to be classified as the most air-polluted city in the world for a limited period, as reported by the news outlet RSN1 Info, the Serbian Environment Protection Agency (SEPA), and the Serbian Monitor [29,30,31]. Although particulate pollution is not always additive with gaseous pollution, it indicates that its micro-climatic positioning at the confluence of the Sava and Danube rivers renders it liable to stagnant air entrapment. Therefore, the susceptibility to high pollution concentration made the city an ideal case for the first application of a small-scale surface flow NOx filter device. By establishing an air sampling flow from the neighbouring street outside the University of Belgrade’s Faculty of Technology and Metallurgy (FTM), which is close to the city centre, an initial comparison was made between laboratory analytical devices and the official recording values in real time from a range of official monitoring data from the SEPA collected at five locations in the city of Belgrade (national network of automatic stations for air quality monitoring) [30]. Figure 18 compares official monitoring data and those measured independently by the laboratory sampling of external air during a typical six-day period. Measurements of ambient air NOx concentrations were performed via chemiluminescence NO-NO2-NOx analysers. Chemiluminescence, as reported by Jernigan et al., has become the most widely used NOx emissions monitoring technique in exhaust stack emissions and ambient air monitoring instrumentation [32].
Calibration of the NOx analysers was performed at six points (five plus zero) together with a determination of the efficiency of the NO/NO2 converter (Gas Phase Titration (GPT)). To ensure the efficiency of ambient NOx measurement, comparative measurements between two chemiluminescence NO-NO2-NOx analysers were performed for 44 h (Figure 19).
Upon achieving real-time measurement correlation, continuous periods of monitoring were established. Following the desire to consider primarily a surface flow device, a series of active pin-coated filter NP substrates were pleated and then suspended across the flow direction in a plastic storage box (Figure 20). The lid, inlet, and outlet vents were sealed using silicone sealant. The plastic box (V = 10 dm3) was filled with 64 pin-coated sheet samples (16 sticks with four sample sheets each) with a total filter mass (m) of 174.3 g, which presented a total area (A) of 1.3 m2.
The ambient airflow rate (v) was controlled by the NOx analyser pump to an average of 0.607 dm3·min−1 (Figure 21).

3.3. Bacterial Activity

Using the box design, a series of filters were constructed for use in both short and long timescale repeated exposure experiments. Example results from an experiment run for 100 min are shown in Figure 22. In the experiment, external air was run through the filter for the central period of the experiment. A surprising result emerged. A RedOx reaction appeared to cause NO2 to reduce in concentration, and additional NO was generated, as indicated by the arrows illustrating the effect in Figure 22. The box volume naturally acted as a buffer against variation in inlet concentrations and, thus, effectively smoothed the outlet analysis curves.
The samples displaying the mechanism NO2 → NO were analysed for the presence of N species using XPS and EDS. No N species could be detected, which indicated that the total process of NO2 depletion was related either only to its strong oxidising property, or that any nitrate formed disappeared during the time between exposure and analysis.
The NO2 → NO effect was regenerated between exposures and the NO generation declined within a single exposure, even though the background NO in the incoming air remained constant (Figure 23a). Eventually, after long, repeated exposure, the mechanism of NO2 reduction to NO saturated and disappeared (Figure 23b) such that NO concentration remained constant, and NO2 was satisfactorily depleted.
The regeneration phenomenon suggested that the continued production of oxidisable species in the sample was due to microbiological effects. The production of the substrate and the MNFC binder/humectant sourced from multi-recycled fibre and the pulping and forming under non-sterile conditions may have meant that the sample contained bacteria typically found in paper-making storage, sheet forming, and coating processes. Such microbes are often in water suspension systems, usually found in biofilms, and ferment alcohols from the cellulose content. Additionally, the disappearance of N completely between exposure and analysis suggested that the bacterial colony included denitrification bacteria.

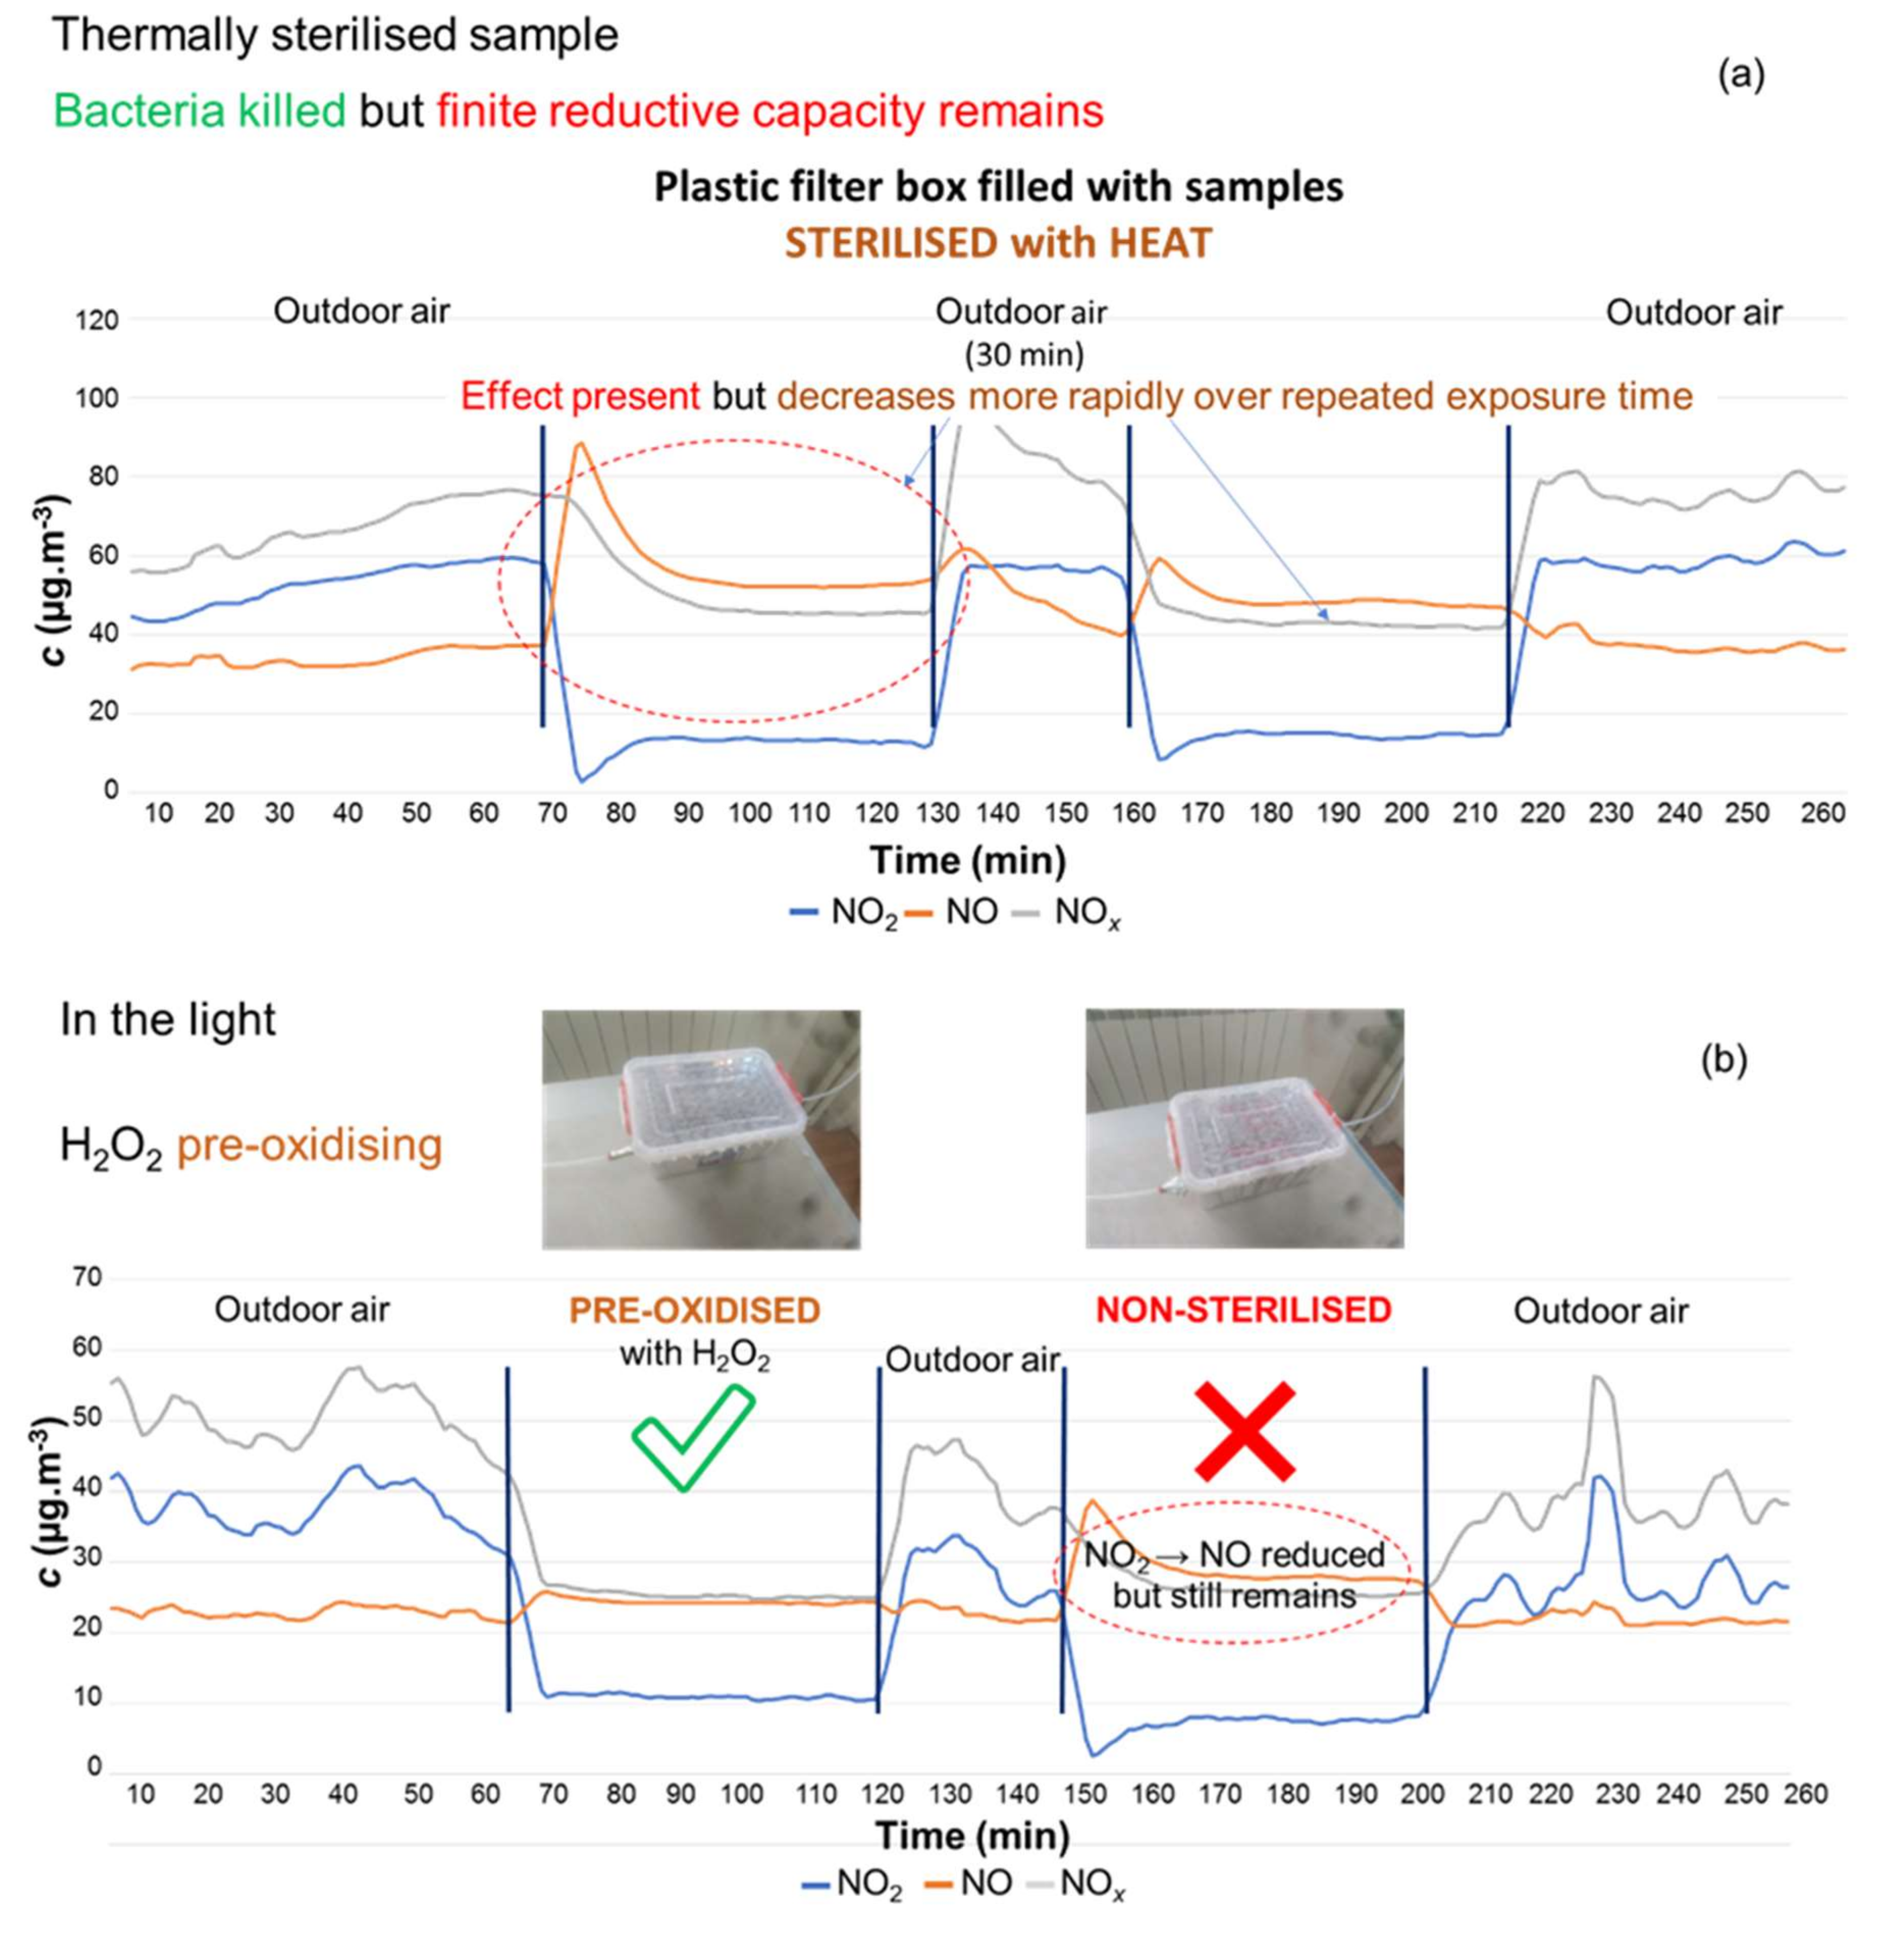
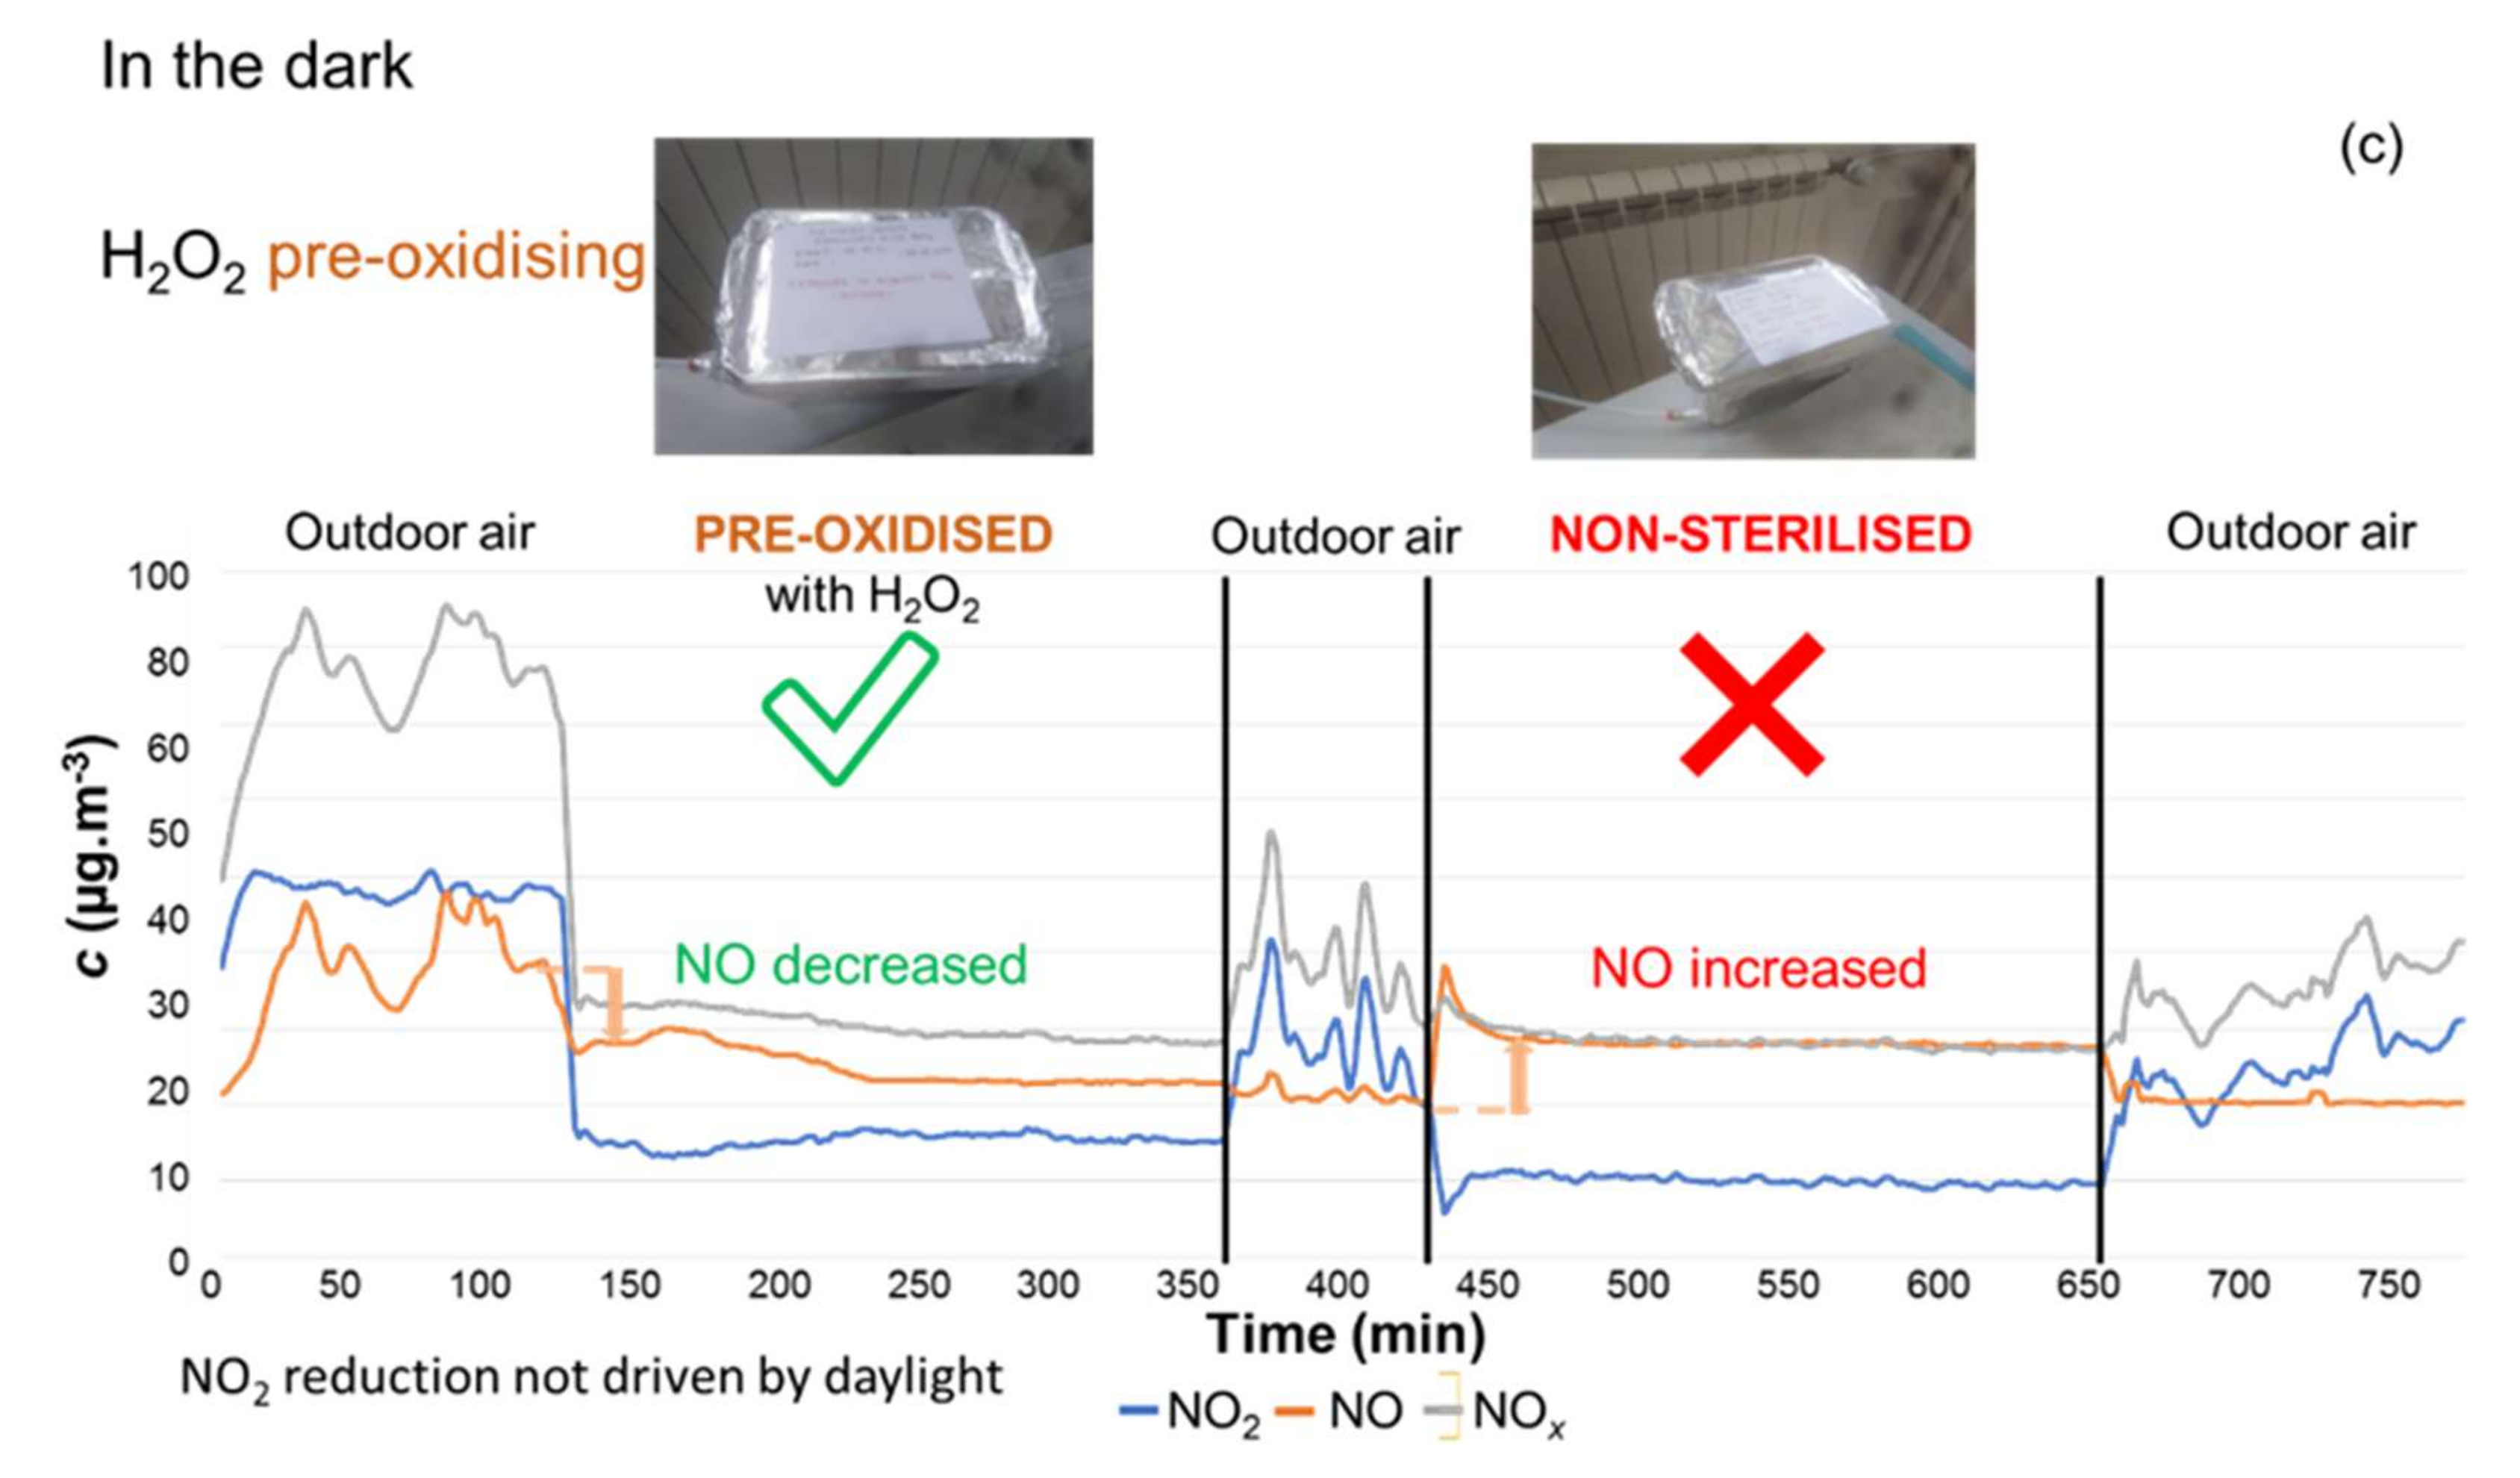
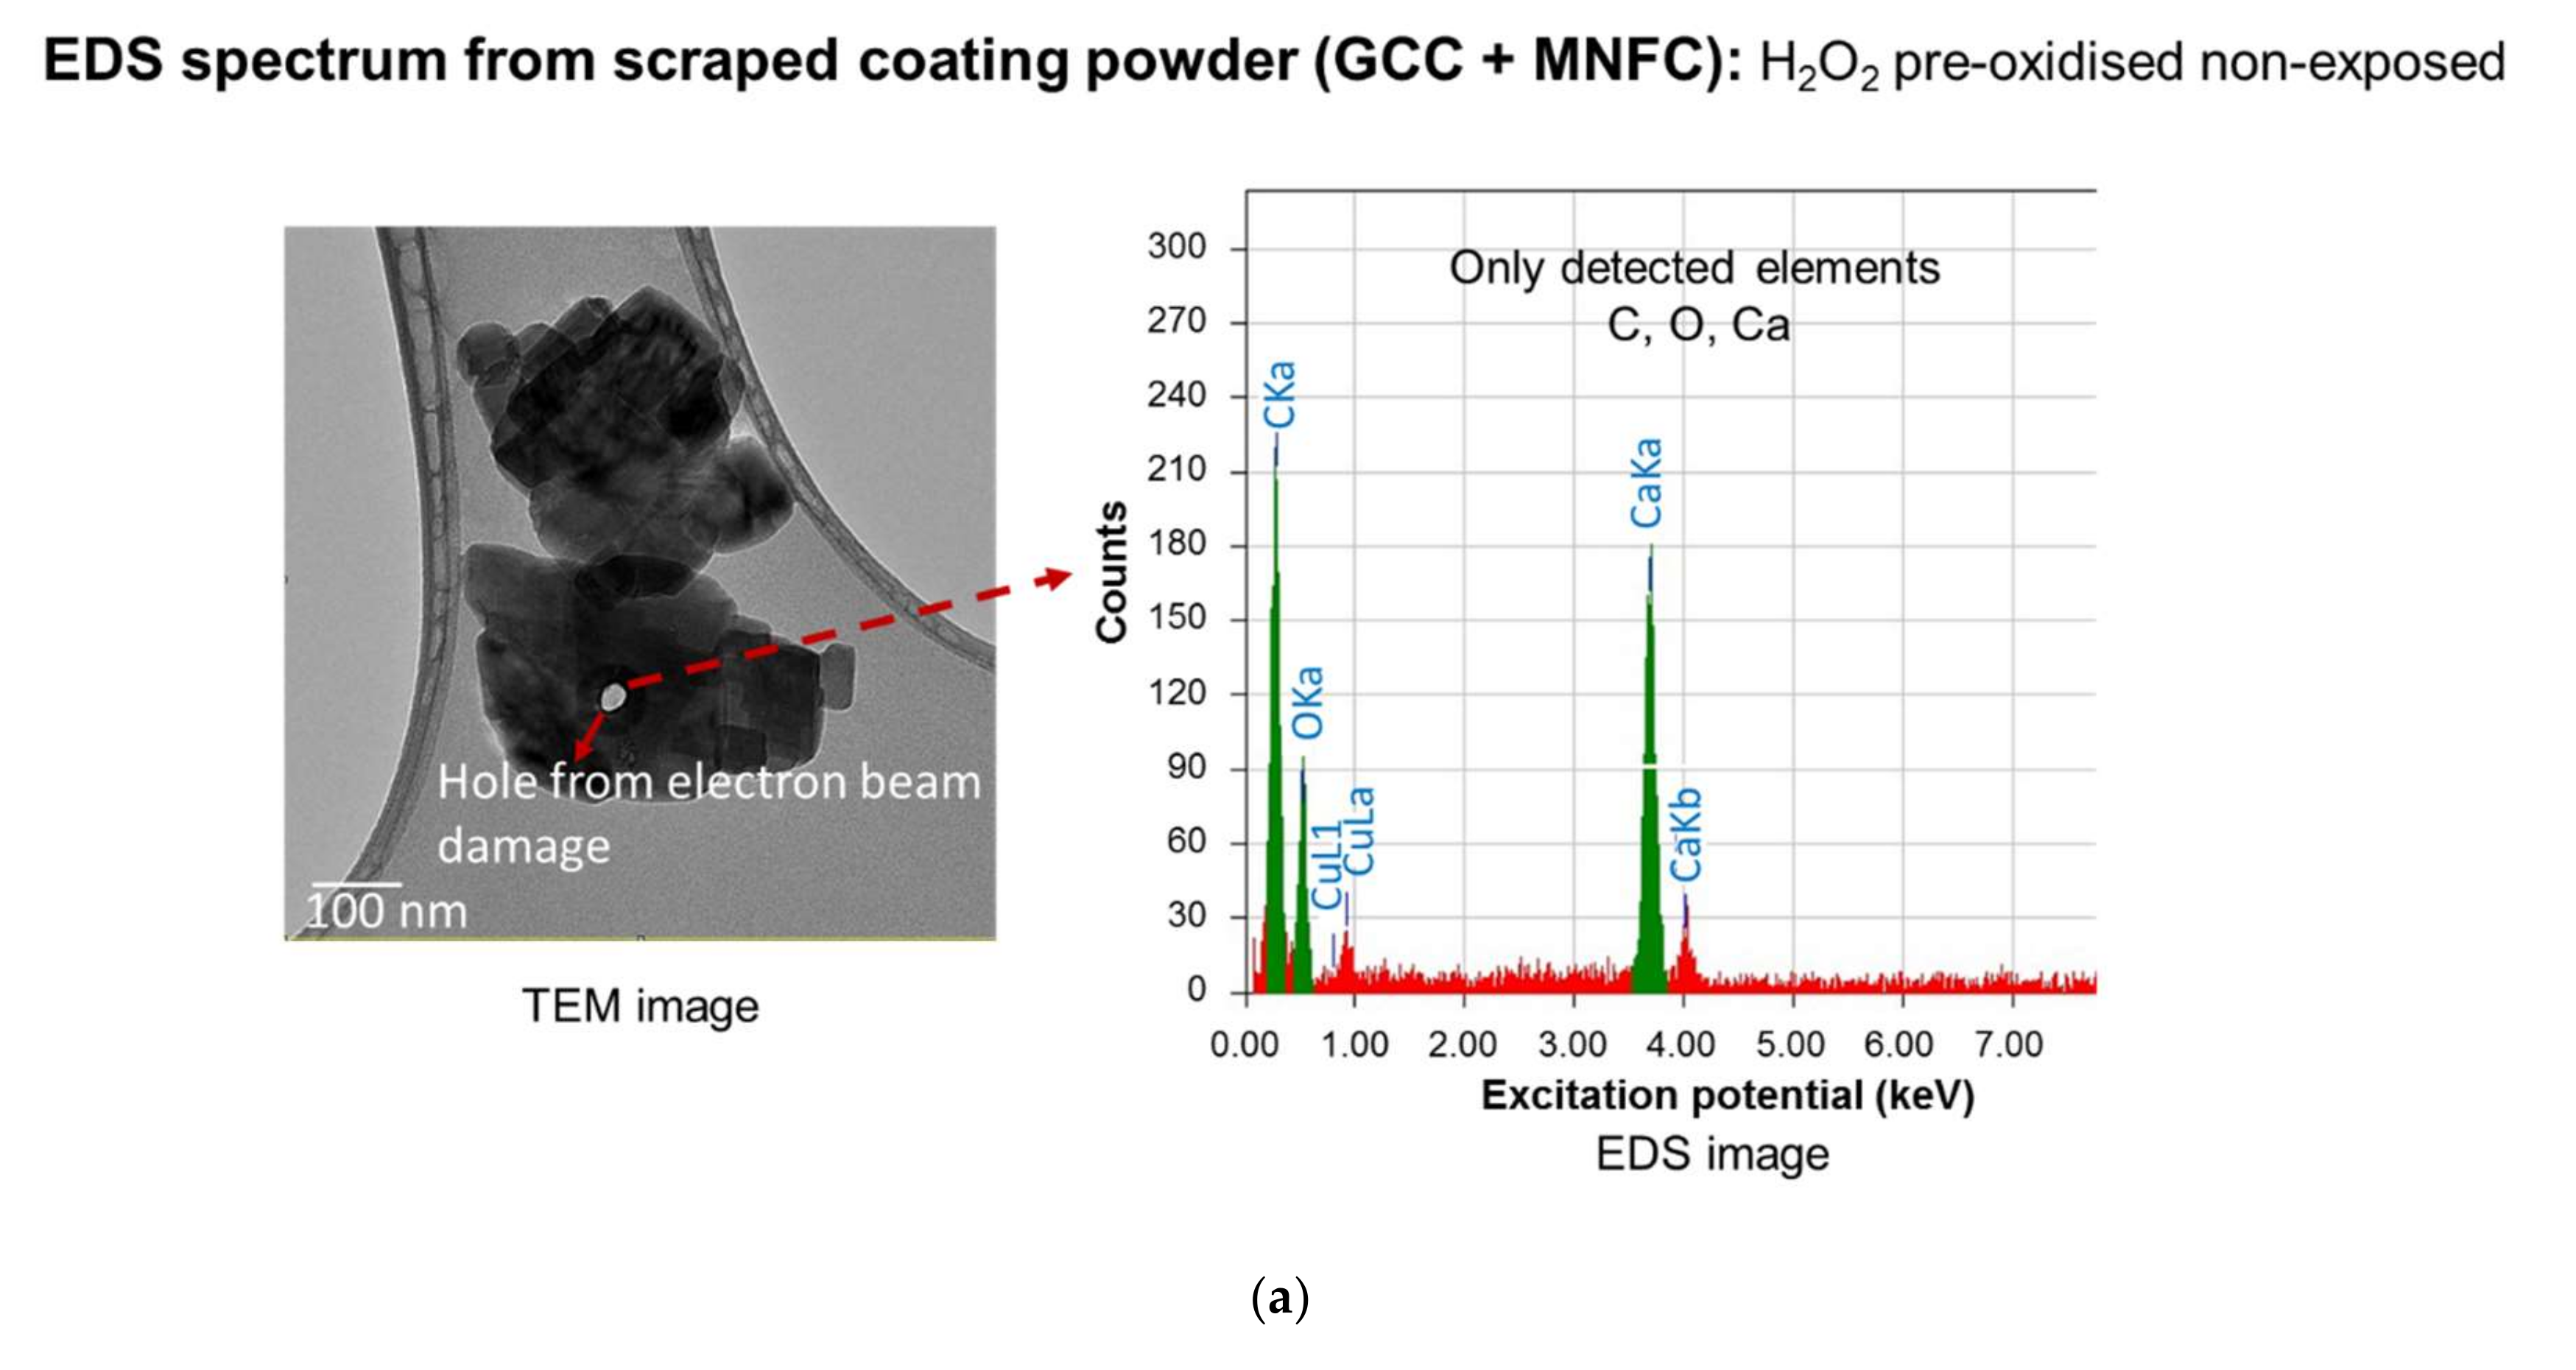
3.3.1. Sterilisation versus Pre-Oxidation

To follow up on the hypothesis that microbial activity might be responsible for the mechanistic effects seen, i.e., NO2 → NO with no N retention in the filter transitioning to the desired NO2 sorption, two sets of samples were prepared using either heat sterilisation at 110 °C in an oven or saturation with 0.1 w/w% H2O2, which pre-oxidises any oxidisable chemical groups in the sample. The possibility that the NO2 →NO reaction may have been light (photon) catalysed was also considered. Each sample was then tested in a smaller filter box for convenience under both light and dark conditions: volume of 3 dm3 filled with 33 pin-coated sheet samples (11 sticks with 3 sample sheets each) with a total filter mass (m) of approximately 60 g with an area exposure (A) of 0.54 m2.
Results showed that heat sterilisation only partly removed the RedOx effect, albeit noticeably. This was expected because heat sterilisation, though it killed bacteria and stopped regeneration of the effect, only partly oxidised the sample. In contrast, the H2O2 treated sample completely lost the RedOx effect due to pre-oxidation. Removing light had no effect, such that light catalysis could be eliminated. The experimental trials and respective results are shown in Figure 24.
Protein extraction showed that the thermally sterilised samples displayed protein content, which is a good indicator that bacterial cell wall breakdown fragments were present as a result of sterilisation. The absence of protein in the non-sterilised samples indicated that the presence of integral bacteria could not be ruled out.
To confirm the bacterial and species content, samples of coated and uncoated paper were analysed with a special focus on denitrifying bacteria. Because high levels of bacteria were detected in the samples, cellulose breakdown bacteria were likely present (well-known contamination) and were analysed. An enrichment of denitrifying bacteria was then carried out separately.
For the quantification of aerobic bacteria, 1 g of paper sample was mixed with 9 cm3 of disruption buffer including tris and sodium lauroyl sarcosinate. Dilutions were spread on tryptic soy agar (TSA). After incubation for 2 d at 30 °C, the colony forming units per cm3 sample (cfu·cm−3) were counted.
For the enrichment of denitrifying bacteria, pieces of the papers (2 × 2 cm2) were incubated in 12 cm3 denitrification medium (3 g beef extract, 5 g peptone, and 1 g KNO3) for 3 days under anoxic conditions. For the samples of mineral GCC only and MNFC, 0.2 g and 0.4 g of the materials were used, respectively. Quantofix® (Sigma Aldrich, St. Louis, MS, USA) peroxide test sticks were used to detect nitrate/nitrite. Dilutions of the enrichment cultures were spread on denitrification agar. After 3 days of incubation under anoxic conditions, colonies were selected for further analysis using a Bruker MS Biotyper (Bruker, Billerica, MA, USA). Conversion of nitrate to nitrite was detected in most of the enriched samples, which indicated the presence of denitrifying bacteria in the original samples. In some cases, species potentially capable of nitrate reduction were identified. The findings of the microbial analysis are summarised in Table 10.

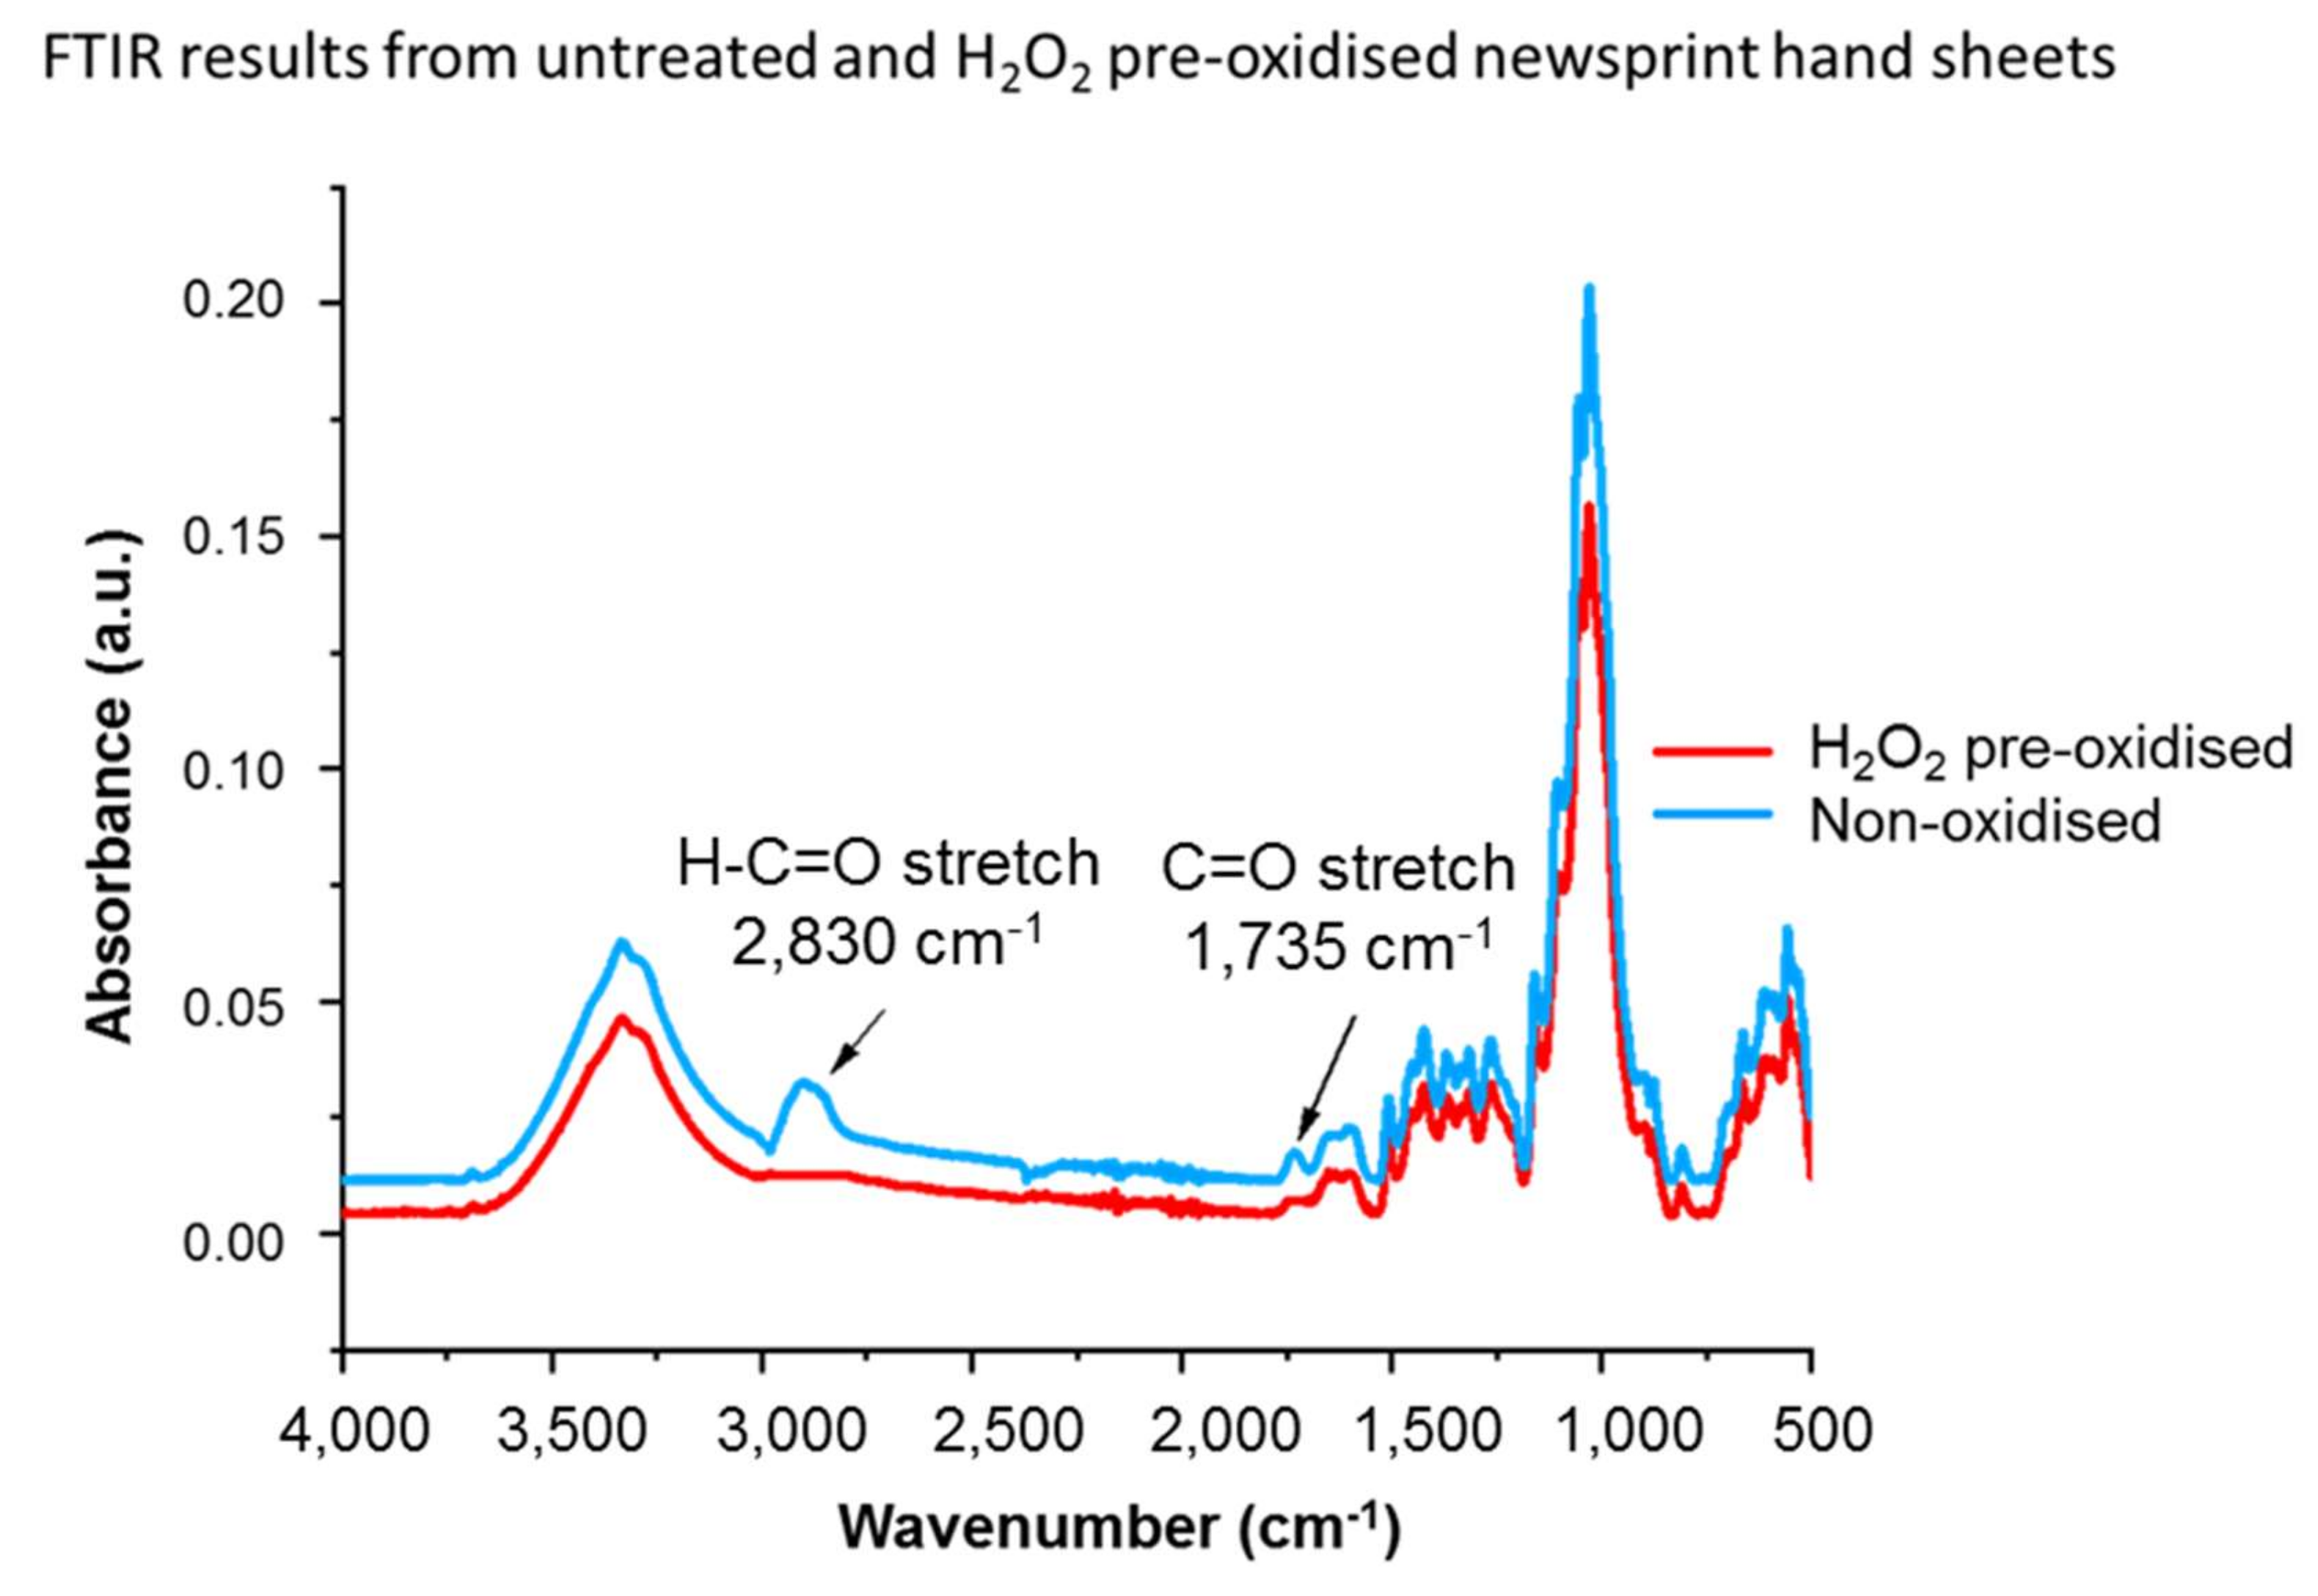
3.3.2. Cellulose Breakdown

The role of the materials comprising the filter was further explored and it was found that the bacterial contamination that led to RedOx reactivity with oxidising NO2 was related to the formation of alcohol (–OH) due to cellulose breakdown and could be oxidised to aldehyde (Equation (2)). This is followed by oxidative conversion to carboxylic acid (Equation (3)). This reaction pathway is like that of the unwanted oxidation of wine.
Applsci 10 03927 i001
Applsci 10 03927 i002
The action of pre-oxidising using H2O2 is to pre-run the reaction parallel to Equation (2), following Equation (4), to saturate the transformation from alcohol to aldehyde and to complete the transformation to carboxylic acid (Equation (5)). In this way, the filter action for the desired absorption of NO2 rather than conversion to NO could be preserved.
Applsci 10 03927 i003
Applsci 10 03927 i004
The Fourier transform infrared (FTIR) spectroscopic analysis result, shown in Figure 25, confirmed this assumption with respect to the loss of the H-C=O band at 2830 cm−1.
Following pre-oxidation by H2O2, the desired mechanism of NO2 sorption and formation of nitrate was restored, and the presence of retained N species was confirmed by both EDS and electron energy loss spectroscopy (EELS), which is more sensitive. The results are shown in Table 11, and TEM image selection and EDS spectra are exemplified in Figure 26. The sample material for analysis was scraped from the filter surface, dispersed to high dilution (1000 ×) in ethanol to reduce particle number per sample volume, and studied in a JEM-2200FS 200 kV double Cs corrected transmission electron microscope (TEM) (JEOL Ltd., Akashima, Tokyo, Japan).

3.4. Sorption Capacity Check between Pre-Oxidised and Non-Sterilised Filters

Figure 27 shows a comparison of measured NOx concentration in filtered ambient air using the smaller filter boxes filled with either non-sterilised or H2O2 pre-oxidised samples.
A Mann-Whitney U test, where U is defined as the smaller sum of occasion values fall in one of two groups, indicated that the NOx concentration was lower after filtering ambient outdoor air when using the filter box cartridge filled with H2O2 pre-oxidised samples (median = 10.7 μg·m−3, Table 12) than when using non-sterilised samples displaying the NO2 → NO conversion (median = 16.2 μg·m−3, Table 12) with U = 727.0 and probability p = 0.000. In parallel, there was no statistically significant difference between the two NOx analysers recording ambient outdoor NOx without filtering and with U = 1664.5 and p = 0.682.

3.5. Theoretical Filter Lifetime Capacity

The proportion of active CaCO3 (GCC) can be calculated from the total filter sample weight, which is the sum of the substrate plus coating. The substrate weighs 80 g·m−2. The coating (10 g·m−2 one-sided) makes up 11 w/w% of the total sample weight of which carbonate (100/110) is 90 w/w% of the coating and the sole carrier of the nitrogen species. Thus, 11 × 90/100 = 9.9 w/w% (approximately 10 w/w%) of the sample is active CaCO3 in the process.
Using the flow rate of 0.607 dm3·min−1 ambient air (Figure 21) with a time average NO2 concentration taken over 6 days from 8 to 13 October 2019 at the Faculty of Technology and Metallurgy, University of Belgrade, (FTM) sampling point (Figure 18) equal to the annually averaged concentration for sampling point Mostar (SEPA) [30] of approximately 44.1 μg·m−3. This translates to a gas flow rate of 0.044 μg·dm−3 × 0.607 dm3·min−1 = 0.027 μg·min−1 of NO2.
The box filter specification described has an active CaCO3 content of approximately 10 w/w% of the filter elements (from above) and typically contains approximately 174.3 × 0.1 g and approximately 17.4 g of CaCO3. According to the stoichiometric reaction in Equation (1), 1 mol CaCO3 + 2 mol NO2 reacts to 1 mol Ca(NO3)2. Thus, 17.4 g/100.0869 g·mol−1 (Mw CaCO3), approximately 0.174 mol CaCO3, can sorb 0.348 mol NO2, which, at a flow rate of 0.027 × 10⁻⁶ g·min−1/46.0055 g·mol−1 (Mw of NO2), approximately 0.587 × 10⁻⁹ mol·min−1, means the filter will last an extraordinarily long time under these conditions, i.e., (0.348/(0.587 × 10−9) = 593 × 106 min = 9.88 × 10⁶ h = 9.88 × 10⁶/(8.76 × 103), which equates to approximately 1,130 years). Since the concentration of NO2 in the outlet was effectively zero, this shows that there was enormous capacity at this flow rate and low concentration. Per unit weight of total filter, the consumption rate would be 1,130 years/17.4 g, which is > 64.94 years·g−1 CaCO3. Realistically, the need to remove NO2 from a larger physical street side volume would bring these figures into practical perspective.
Filtering a 10 m length of a large street would require an air exchange of over 10 m × 10 m × 10 m = 1 000 m3 at an estimated exchange rate of 100 m3·min−1. Therefore, the road-size filter lifetime, LTfilter road, would be approximately related to the experimental filter lifetime, LTexperimental, by Equation (6).
LTfilter roadLTexperimental/{road-size flow rate}/{experimental-size flow rate}
= LTexperimental/{100 × 1000 dm3·min−1}/{0.607 dm3·min−1}
= LTexperimental/165,000
i.e., 165,000 times shorter than the experimental set-up. This equates to ~6.5/165,000 = 0.0000394 years·g−1 or 345 h·kg−1 of filter, which, at ~90 g·m−2 specific weight, leads to a filter area consumption of 345 h·kg−1 × 0.09 kg·m−2 = 31.5 h·m−2.
From the above, a weekly filter exchange would require 168 h/31.5 h·m−2 = 5.33 m2 of filter per filter body. Such areas from a coating paper machine are extremely small. A typical older style paper machine, approximately 5 m wide, running at 800 m·min−1, could produce 4000 m2·min−1. The major cost would be the initial filter housing construction and the frequency of installation per unit street length if draughting at the estimated rate can be achieved either naturally or with a sustainably produced energy supplement.
Therefore, a generic scaling formula for the filter area consumption can be expressed, when upscaled, as Equation (7),
A = t exp life (mactive + msub) vexp/v
where v (m3·min−1) is the filter flow rate, which is a function of V (m3), the street air volume per unit filter installation, vexp is flow rate (m3·min−1), texp life (h·kg−1filter) is filter life, mactive (kg·m−2) is the active ingredient amount, and msub(kg·m−2) is the amount of filter substrate.

3.6. Capturing in-situ by-Product (CO2)

As shown in Equation (1), the formation of nitrate by anion exchange leads to the formation of carbonic acid, which exists in equilibrium with gaseous CO2. Clearly, the creation of 1 mol CO2 per 2 mol absorbed NO2 does not make much environmental sense if the purpose of capturing NOx is to mitigate initially existing NOx emissions to minimise vehicle ICE-choice-driven transitions in CO2 emission. Nor does it make sense to release CO2 when, in the future, it will be necessary to meet the ICE and industrial NOx emission from idealised sustainable hydrogen burning, as discussed in the introduction to this paper. Therefore, capturing in situ production of CO2 within the filter must be seriously considered. There are a number of mineral options able to fulfil this function. Among them are intercalating minerals, such as sepiolite (porous hydrous magnesium silicate, palygorskite, best known as white “clay” for traditional pipe-making and conveniently able to be sourced locally in Serbia), or gas condensing microporous and mesoporous minerals, such as fused perlite (a glassy volcanic residue, sodium potassium aluminium silicate).
The action of sepiolite in CO2 capture relies on the function of its –OH groups on the surface leading to acid-base intercalation of CO2, as shown in Equation (8).
−(OH)2 + CO2 → −CO32− + H2O
In contrast, fused perlite, with its myriad of ultrafine pores, induces gas condensation when confined within the pore network following the Thomson, Lord Kelvin effect [33]. Figure 28 shows SEM micrographs of the two minerals (sepiolite and fused perlite). Both the high porosity of fused perlite and the combination of the high aspect ratio needle-like particle shape of sepiolite and its high porosity result in increased volume fraction occupancy per unit weight addition when using either of these materials when compared to solid rhombohedral calcitic GCC. Therefore, the volume swept out during particle rotation during flow in aqueous suspension is also greatly increased when including proportions of such particles, such that the suspension exhibits increased viscosity, viscoelasticity, initial thixotropy after yield, and dilatancy under high shear. Such rheological properties would be unsuitable for most continuous flow metering systems but remain usable in the context of needle/pin coating and enable high loading volumes to be achieved across the localised pixelated coating distribution.
Examples of CO2 capture in fused perlite and sepiolite when mixed at 10 w/w% with GCC are shown in Figure 29a,b, respectively.
Given the two different mechanisms between the CO2 capturing materials proposed, sepiolite is expected to act selectively due to the chemical reaction required, whereas perlite adsorbs purely physically. These differences will manifest depending on the gas species under exposure. For example, sepiolite intercalates NO [34]. In this context, the preference of sepiolite for NO means that any NO initially intercalated in the mineral becomes exchanged for CO2. The apparatus set-up used to run sequential exposure to CO2 and subsequent flushing with synthetic air is shown in Figure 30.
Figure 31 shows the air quality detector data since CO2 is introduced into a filter previously exposed to NOx-containing ambient air using the method illustrated in Figure 30. The active filter coating comprised 90:10 by weight GCC: sepiolite in which the released selectively intercalated NO, flushed using synthetic air following the exchange with introduced CO2, could be clearly observed, and there was little to no evidence of NO2.
In contrast, fused perlite is non-selective, and, when using a filter that comprised 90:10 by weight GCC: fused perlite pre-exposed to NOx-containing ambient air, subsequent exposure to CO2 expelled both NO2 and NO, which were previously absorbed into the pore structure (Figure 32).
In selecting a CO2 capture mineral medium, it is also important to consider other likely interactions related to the mineral and potential contaminants in the environment. For example, both sepiolite and perlite are effective adsorbents for heavy elements, such as Cd(II), Cr(III), Mn(II), Cr(III), Cu(II), and Zn(II) [35].

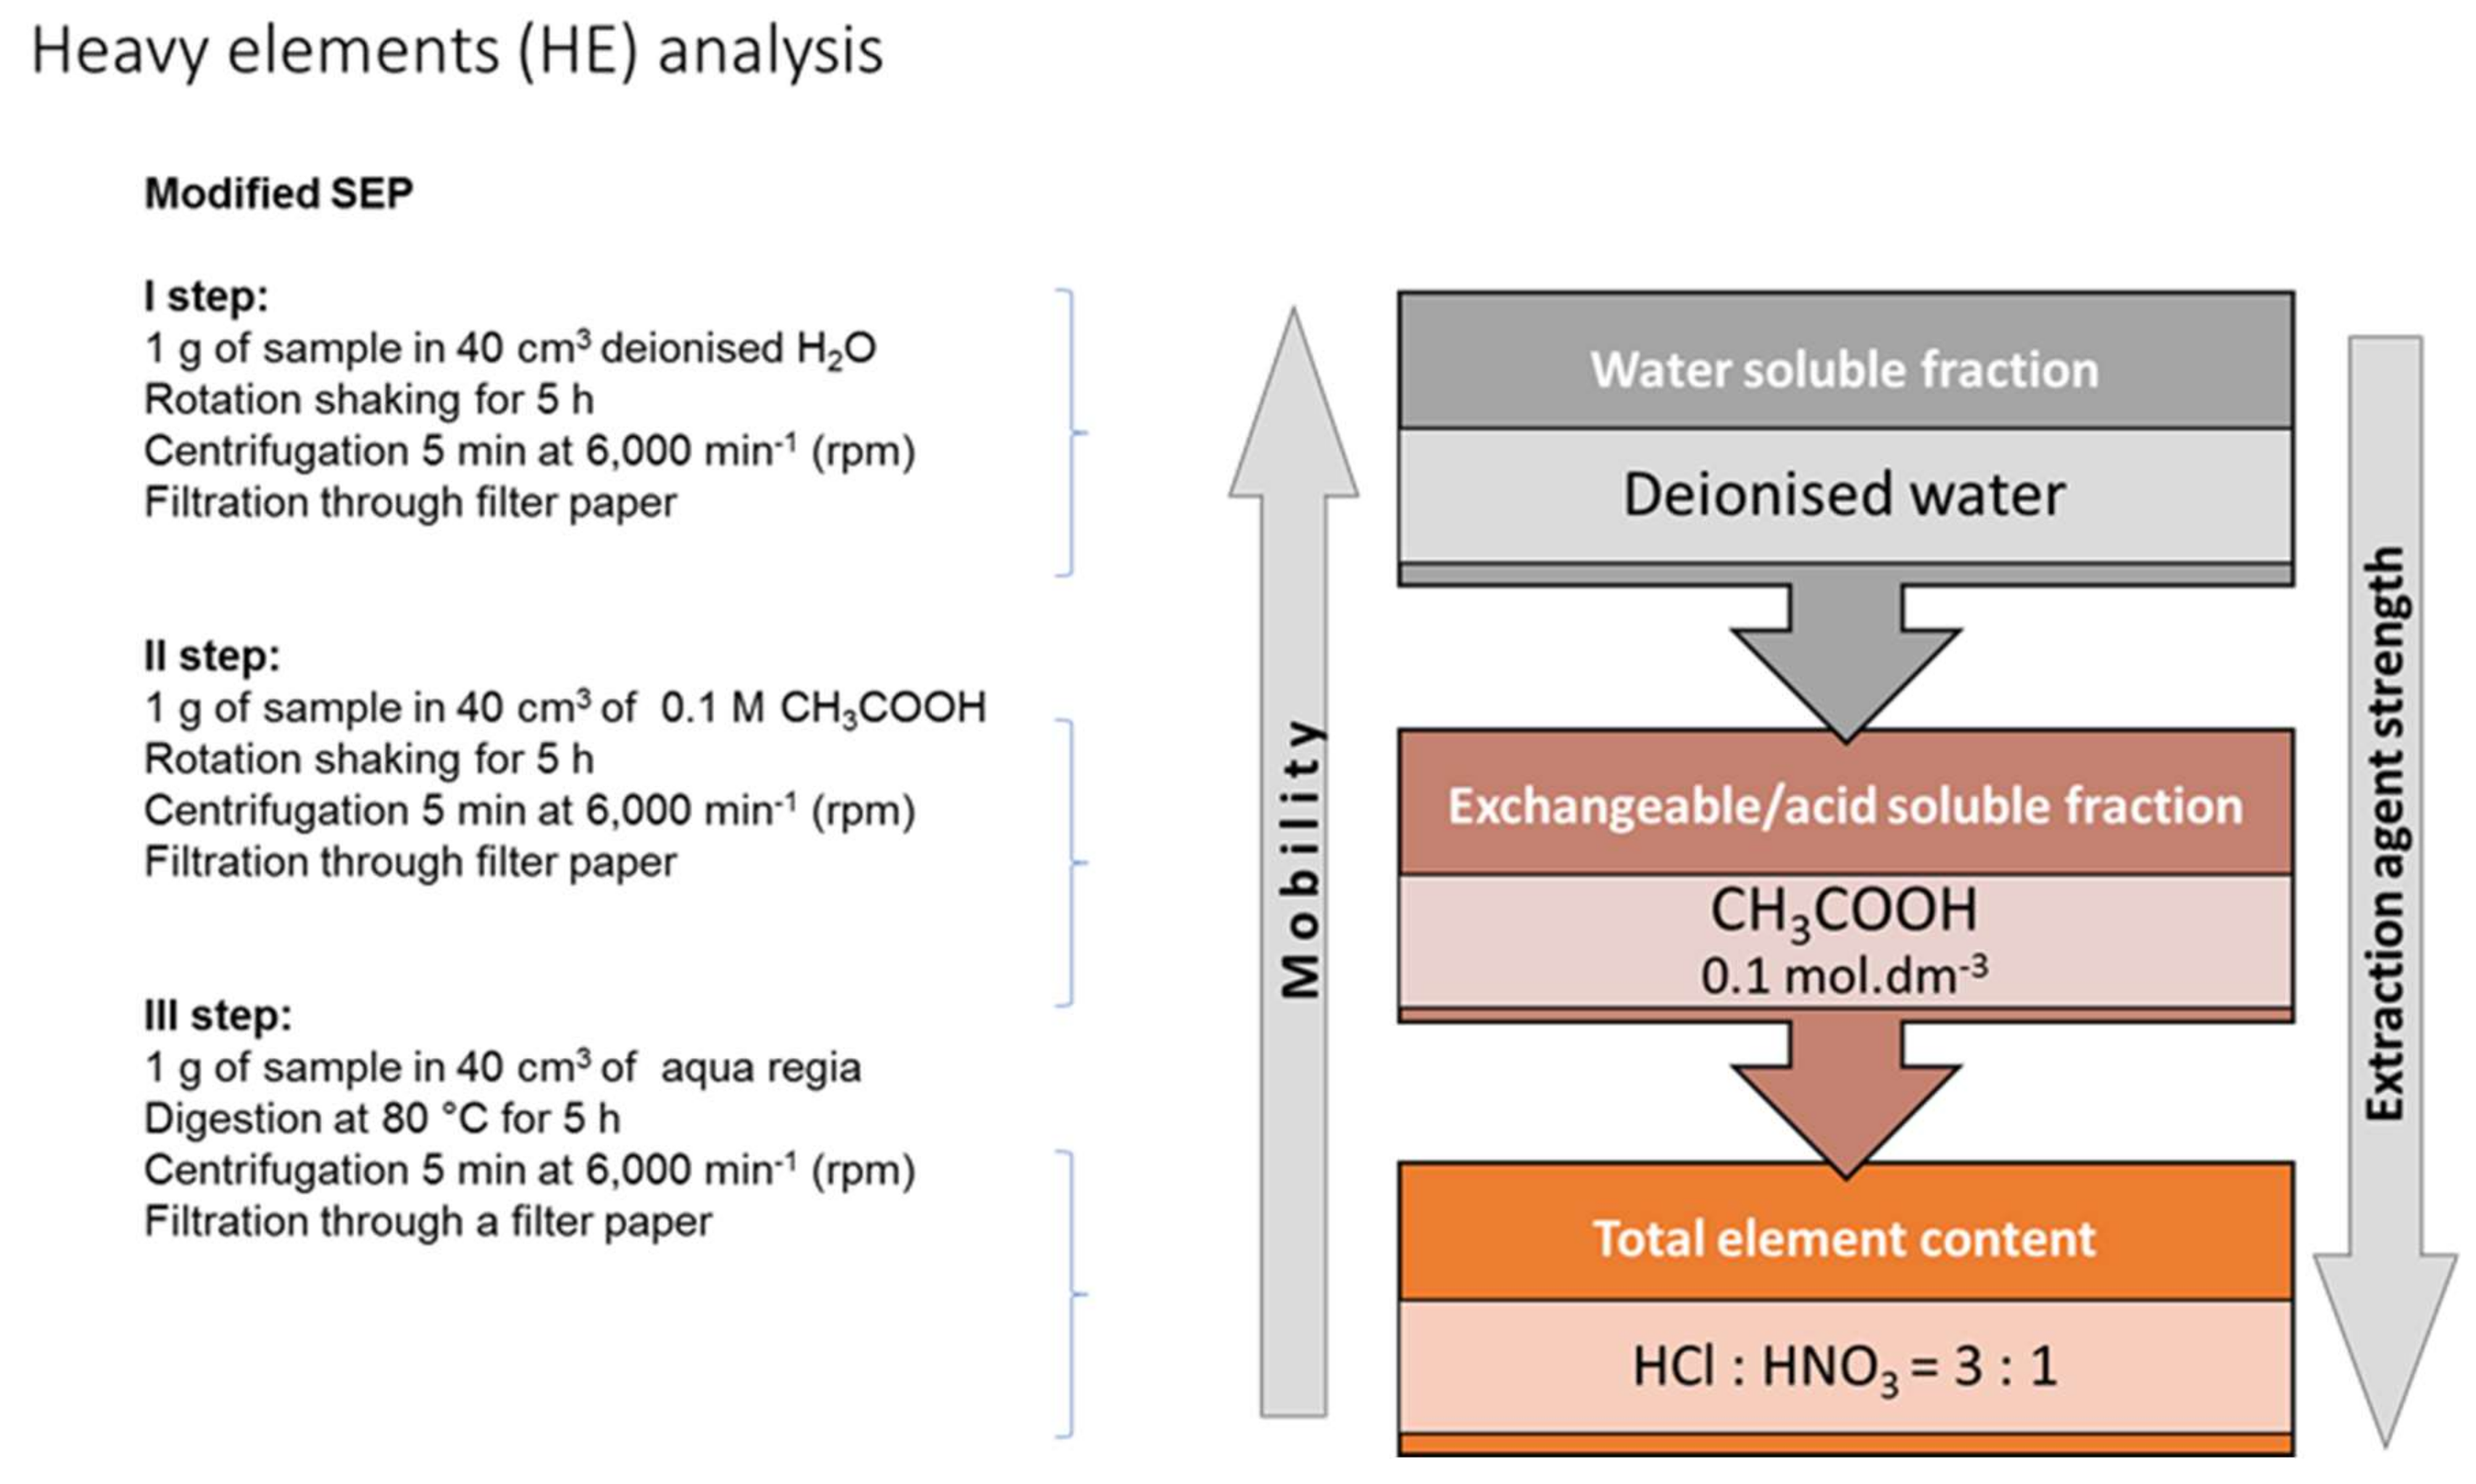
3.7. Meeting Regulatory Requirements: Heavy Element (HE) Analysis

We do not intend to list exhaustive regulatory demands for various end-uses for the circular economy concept of the proposed filter. However, to meet standards for use in agriculture for food production, compliance is required, which differs regionally but is stringent in most cases, with respect to heavy elements. Application in horticulture for garden plants or forestry is less restrictive. However, using an actively reactive component as only a fraction of the total filter can eliminate the role of any contaminants occurring naturally in the minerals making up that fraction, such as ancillary components, when meeting suitability demands for paper production. However, contamination during application may be more serious depending on the environment. In this context, results from exposure to Belgrade ambient air over the time periods used in these experiments followed a methodology defined by the European Community Bureau of Reference (Rauret et al.) [36].
The behaviour of chemical elements in the environment depends on the form in which they occur. The way that an element is bound to a solid phase in the environment affects its mobility, and, therefore, its potential bioavailability and toxicity to living organisms. The result of this is a serious interest in improving the understanding of the system-element interaction, i.e., elemental interaction with the solid phase.

Heavy Element Analysis

The combination of multiple extraction agents, i.e., their successive application on the sample, was first applied by Gibbs [37] to investigate suspended river sediment. This method and its modifications were applied by a number of authors. The most notable was Tessier et al. [38]. Many sequential extraction procedures (SEP) in the literature represent variants and modifications of the same sequential extraction developed by Tessier et al. (Alborés et al.) [38,39].
Generally, the most widely used SEP is the Community Bureau of Reference (BCR) three-step procedure modified by the European Community Bureau of Reference (now Standards, Measurement, and Testing (Rauret et al.)) [36].
The adapted SEP method used here, which focused on the likely prevalent heavy elements (HEs) at a roadside site is shown in Figure 33. Using this kind of methodology could provide some valuable information on heavy element mobility with changing environmental conditions, such as leaching due to rainfall (step I) or acid rainfall (step II).
Analytical measurements were taken in triplicate for all samples. Inductively coupled plasma-mass spectrometry (ICP-MS) (iCAP™ Qc ICP-MS, Thermo Scientific, Waltham, MA, USA) was applied to analyse for HE in the water soluble and acid soluble extract fractions. Results are shown in Table 13. Results for elected HEs all show either very low levels or are below the detection limits (< DL). It is again stressed that these findings are not intended to suggest regulatory compliance and are indicative only.

4. Discussion

The choice of materials used in this study was purely illustrative. It was primarily intended to introduce the concept of a circular economy solution in which the exposed filter could be used as a fertiliser due to the anionic salt exchange mechanism leading to the formation of nitrate. Furthermore, the inclusion of a cellulose fibrous substrate as the filter support material had the added advantage of providing a soil mulch, which, in turn, limited nitrate run-off, which protects waterways from de-oxygenation. Other cellulose fibre sources could easily be substituted for the exemplified newsprint. For example, unbleached Kraft pulp, bagasse, or waste crop cellulose could be used. Other coating materials could also be used as long as they are unreactive. However, this would likely limit the option of entering the circular economy.

4.1. Perspectives on Real Application

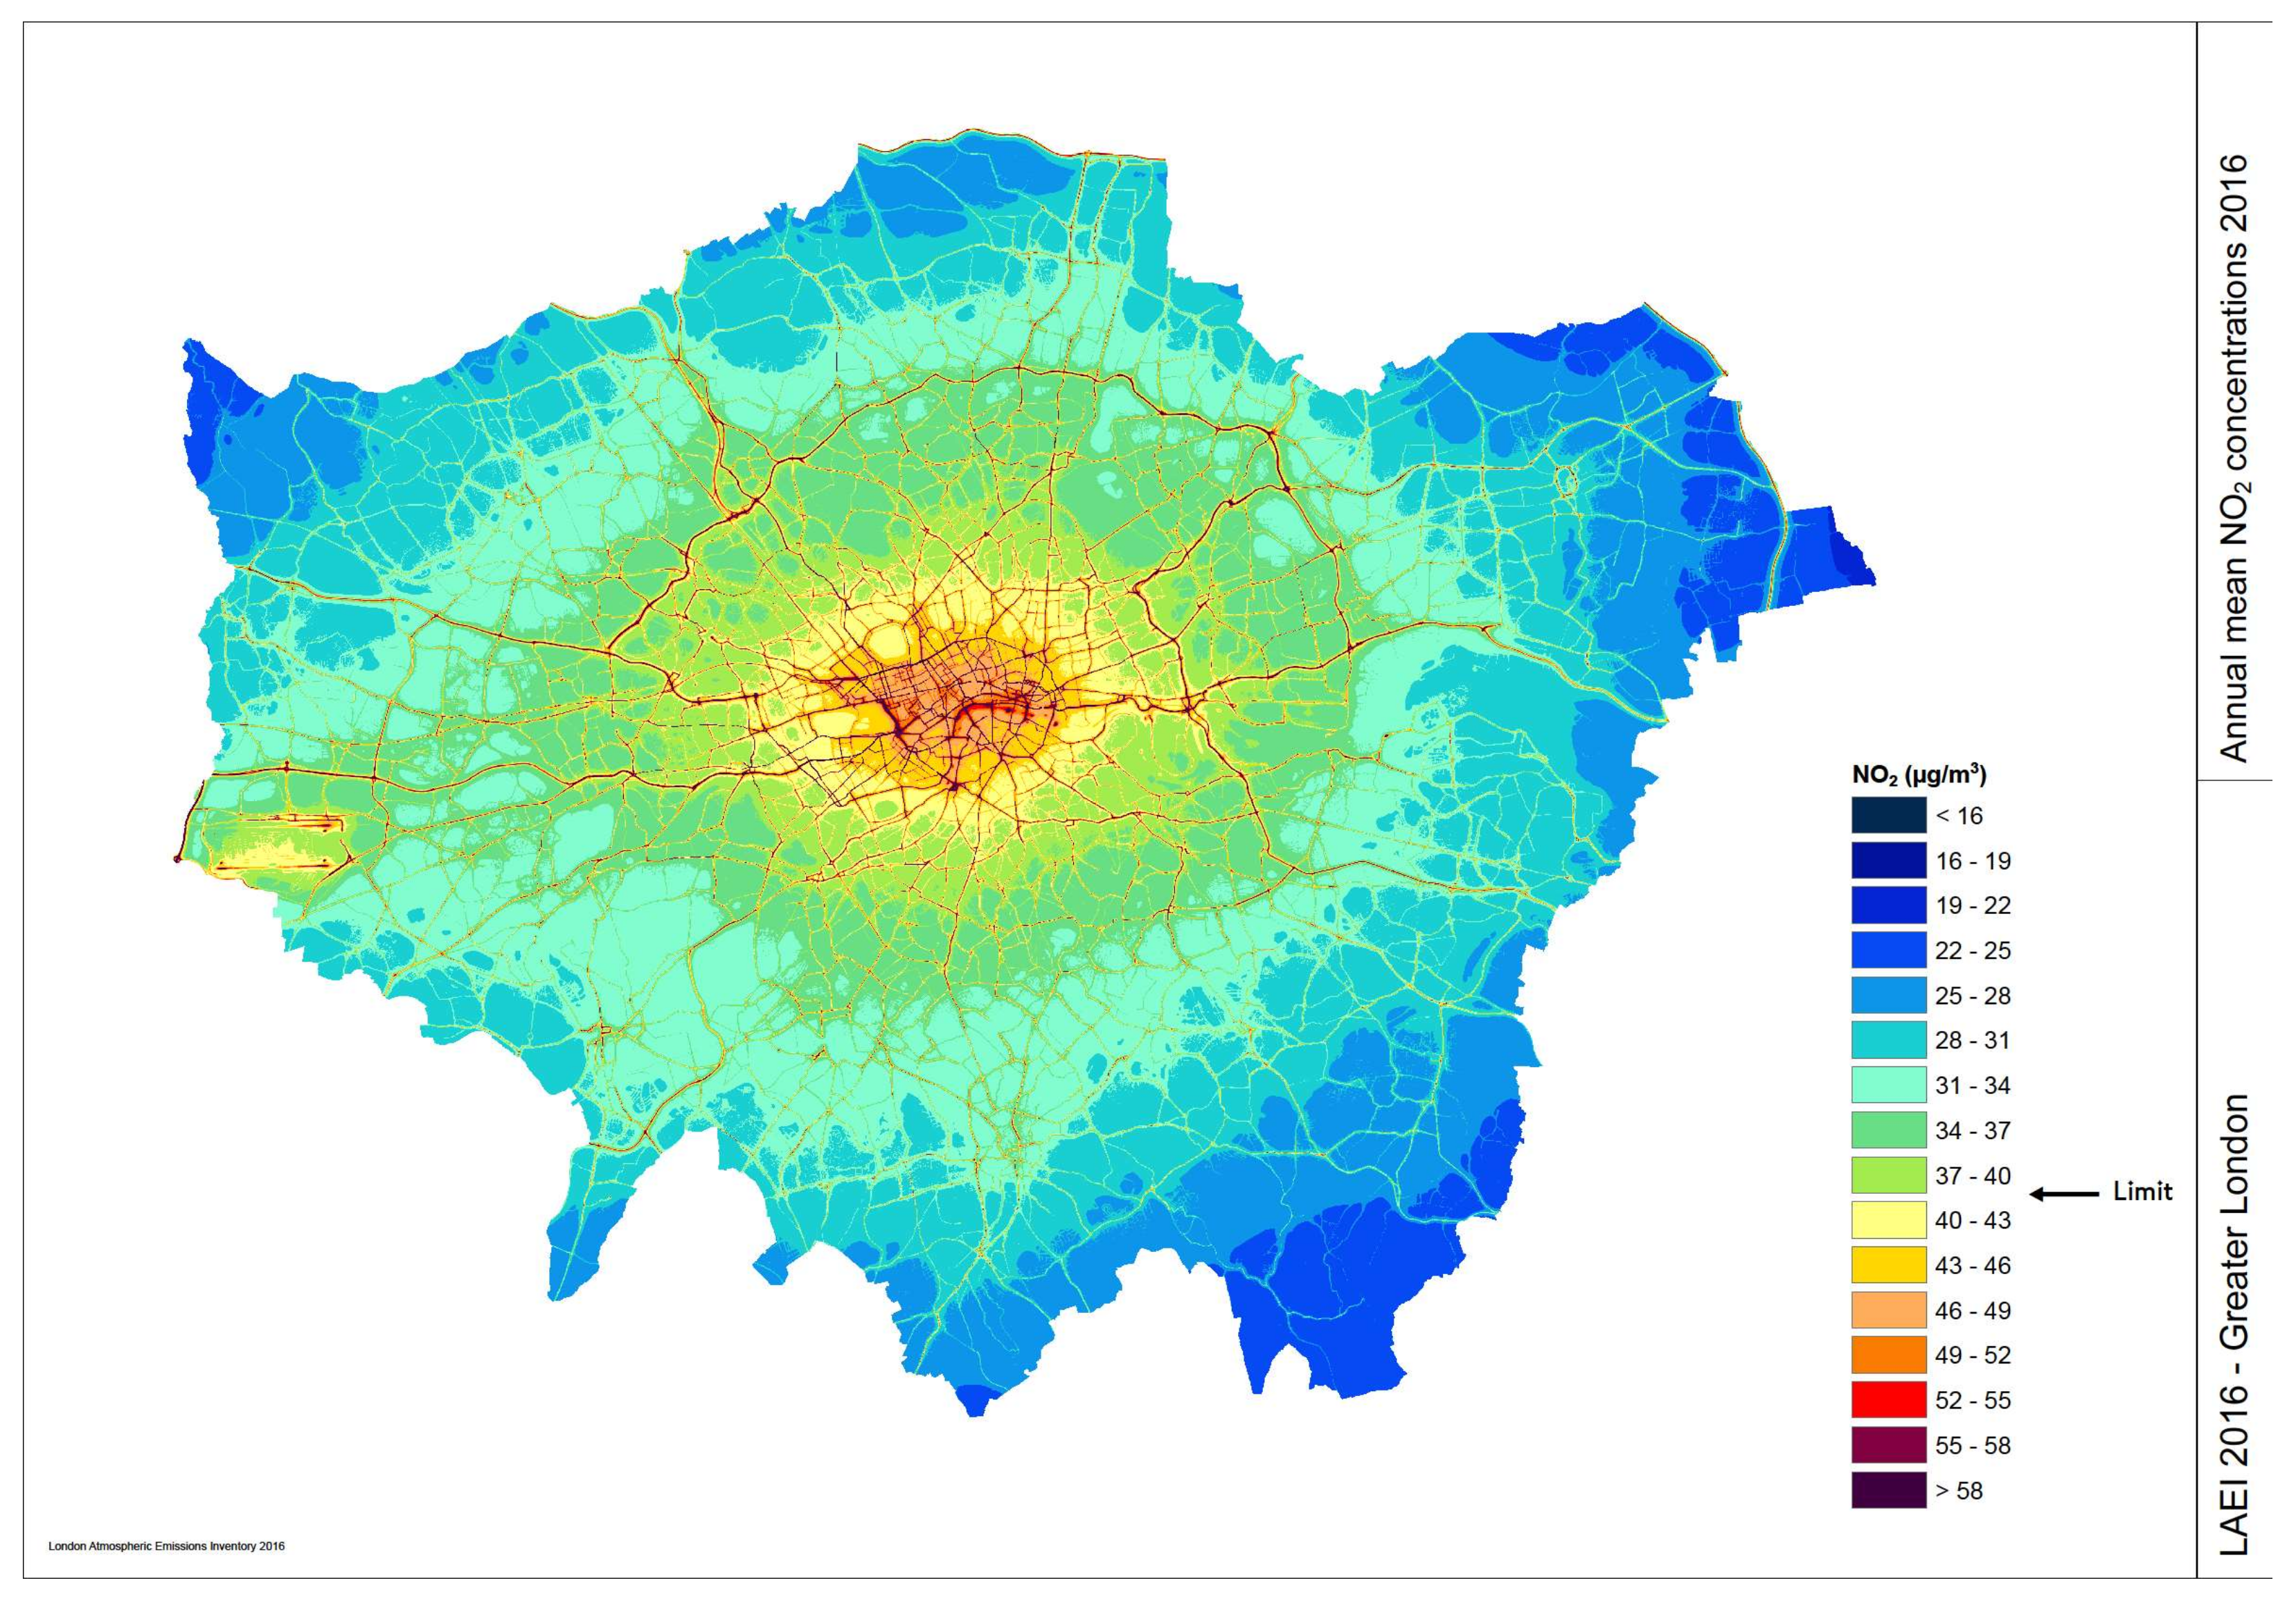
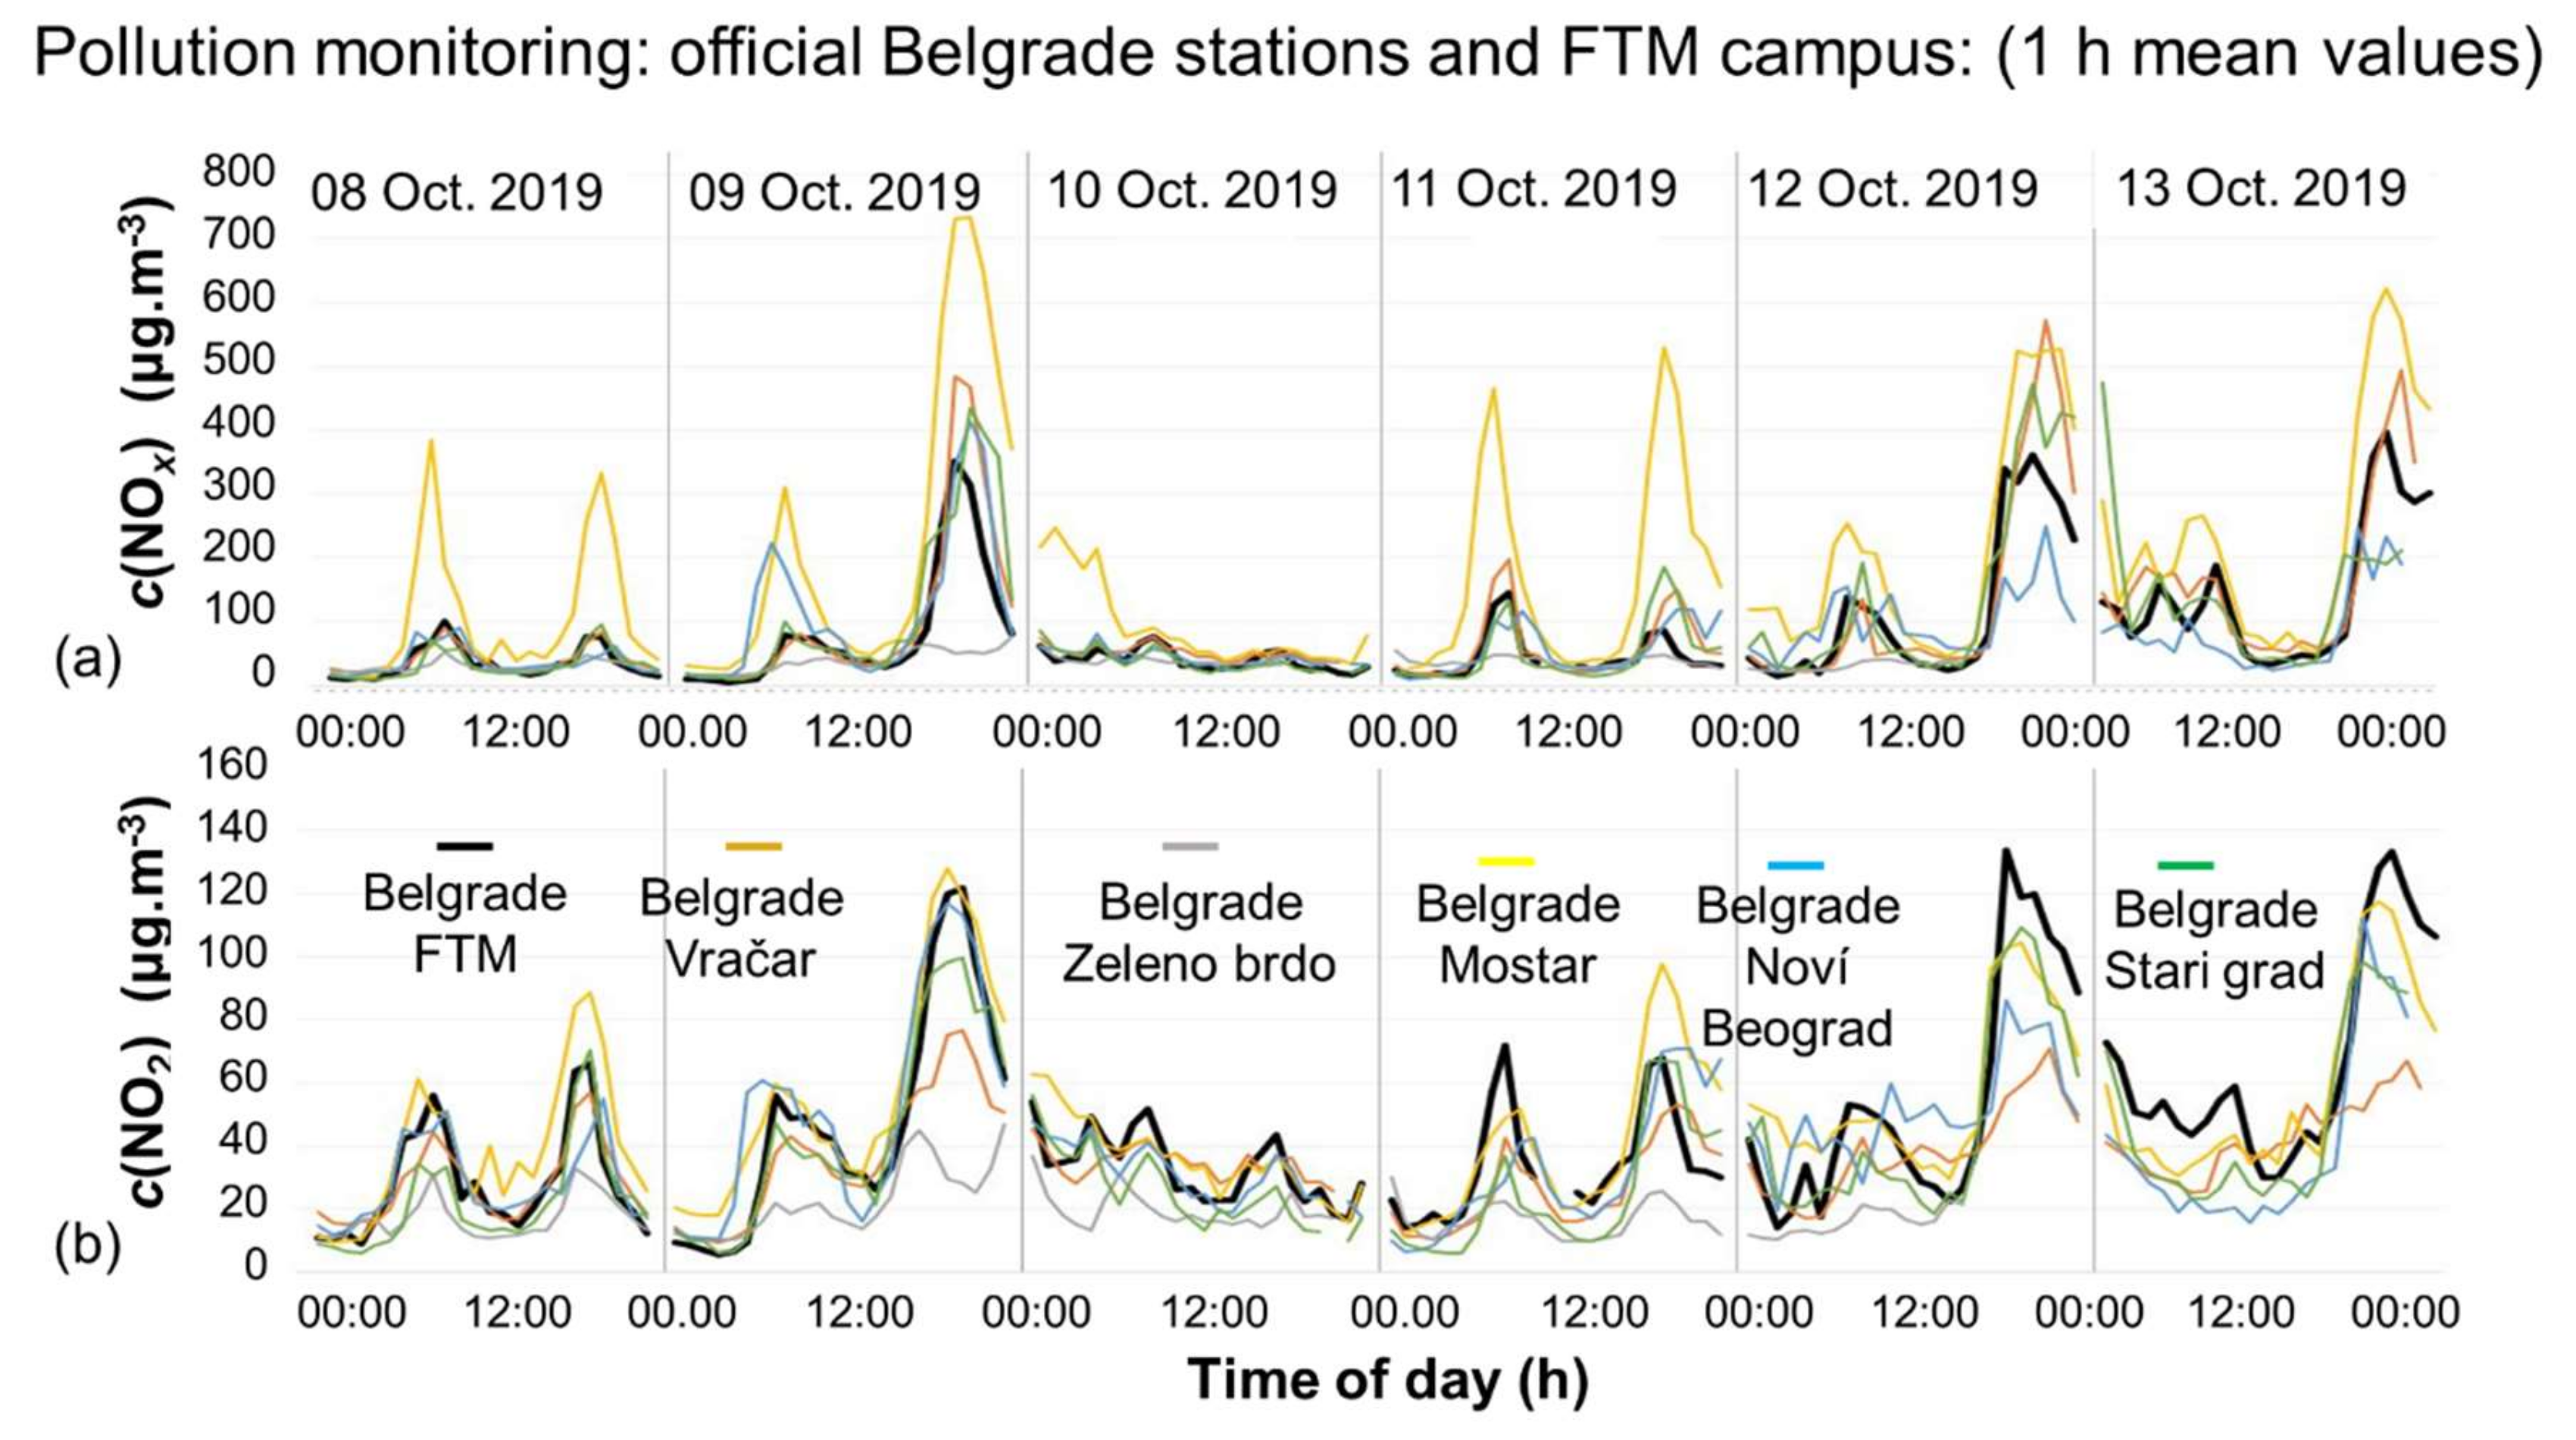
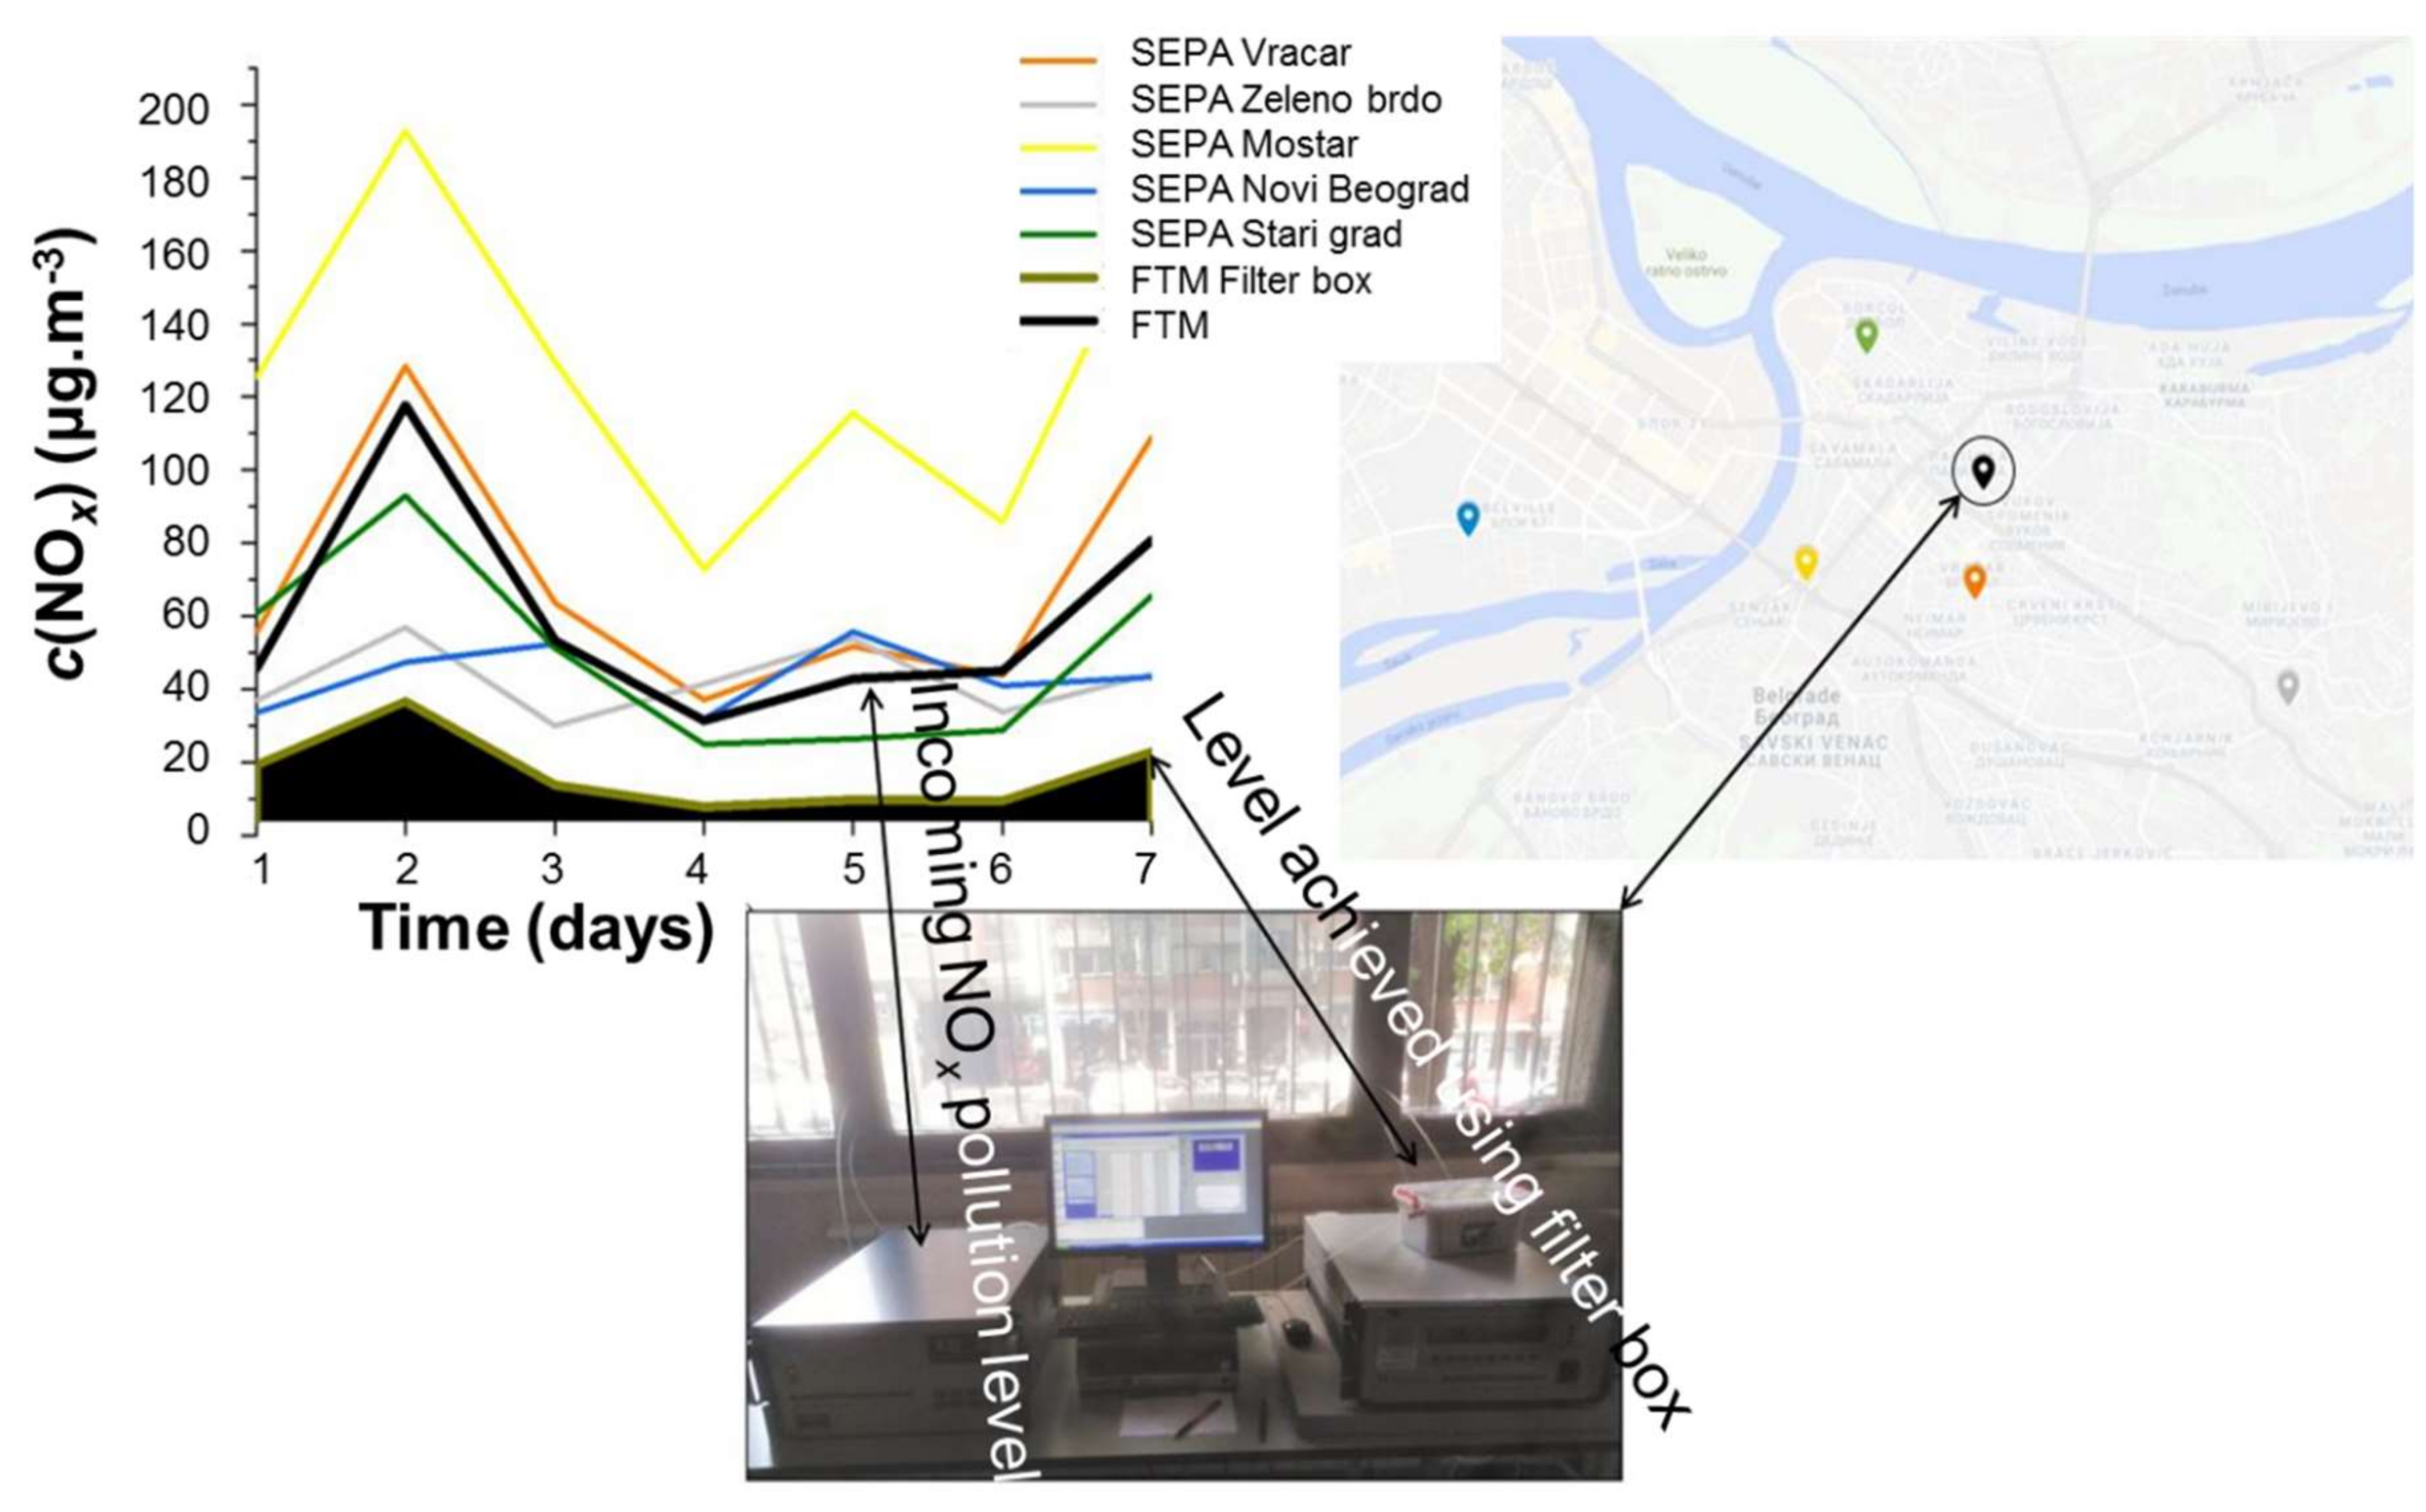
4.1.1. Belgrade City Air

Non-exhaustive but indicative testing suggests that the level of HE contamination in the experiments with Belgrade city air was below detectable limits, and the suitability of the method for mitigating NOx levels to below those of even the lowest recorded values in the city suburbs was confirmed. In Figure 34, official publically available environmental agency data are compared with the test data from the application of the experimental filter.

4.1.2. Putting the Filter into Action

Convincing authorities of the practicality of the developed surface flow filter concept will be a challenge. If strong commitment and cooperation of city and transport authorities can be achieved, a universally standardised filter mounted on the exterior of municipal and public transport vehicles could be deployed, such that, as one vehicle emits pollutant, the vehicle following it acts to mitigate the impact. Eventually, the concept could be extended to the commercial truck fleet and replace the current aerodynamic up-flow wind drag reduction deflectors to provide a cleaner environment on motorways. Such a design would avoid any need for roadside installations, hugely reduce investment, and obviate the need for external energy-consuming forced draughting. This use on municipal and transport vehicles could easily be launched before expanding the concept to private car owners. The cartridges are low cost, and exchange centres could be established for collective and envisaged conversion to the fertiliser. Both concepts for street-side and vehicle-mounted filters are shown schematically in Figure 35. A further distinct advantage of the principle of surface flow rather than through-flow is that gaseous pollution is frequently accompanied by heavy particulate environmental load that a surface flow filter does not block under such circumstances. There may be particulate deposition onto the filter exchange surface, and there might be progressive, slow lowering of efficiency. However, gaseous diffusion cannot be prevented, and the filter will continue to function, whereas a through-flow filter would rapidly stop functioning.

5. Conclusions

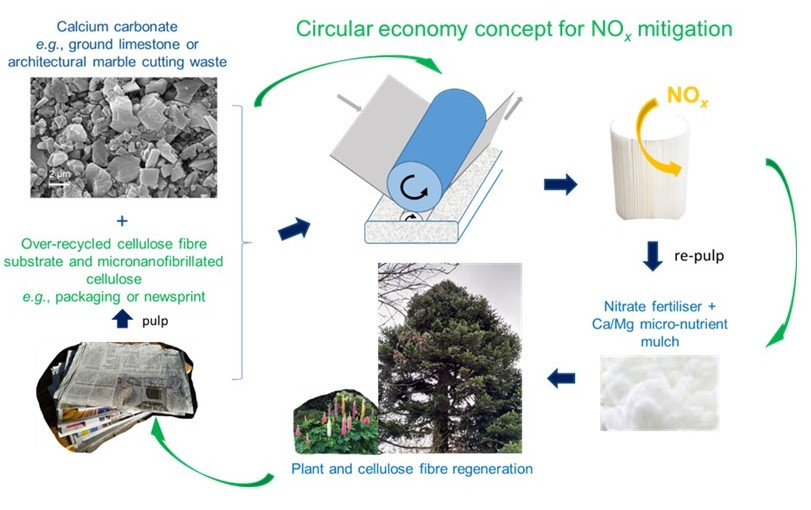
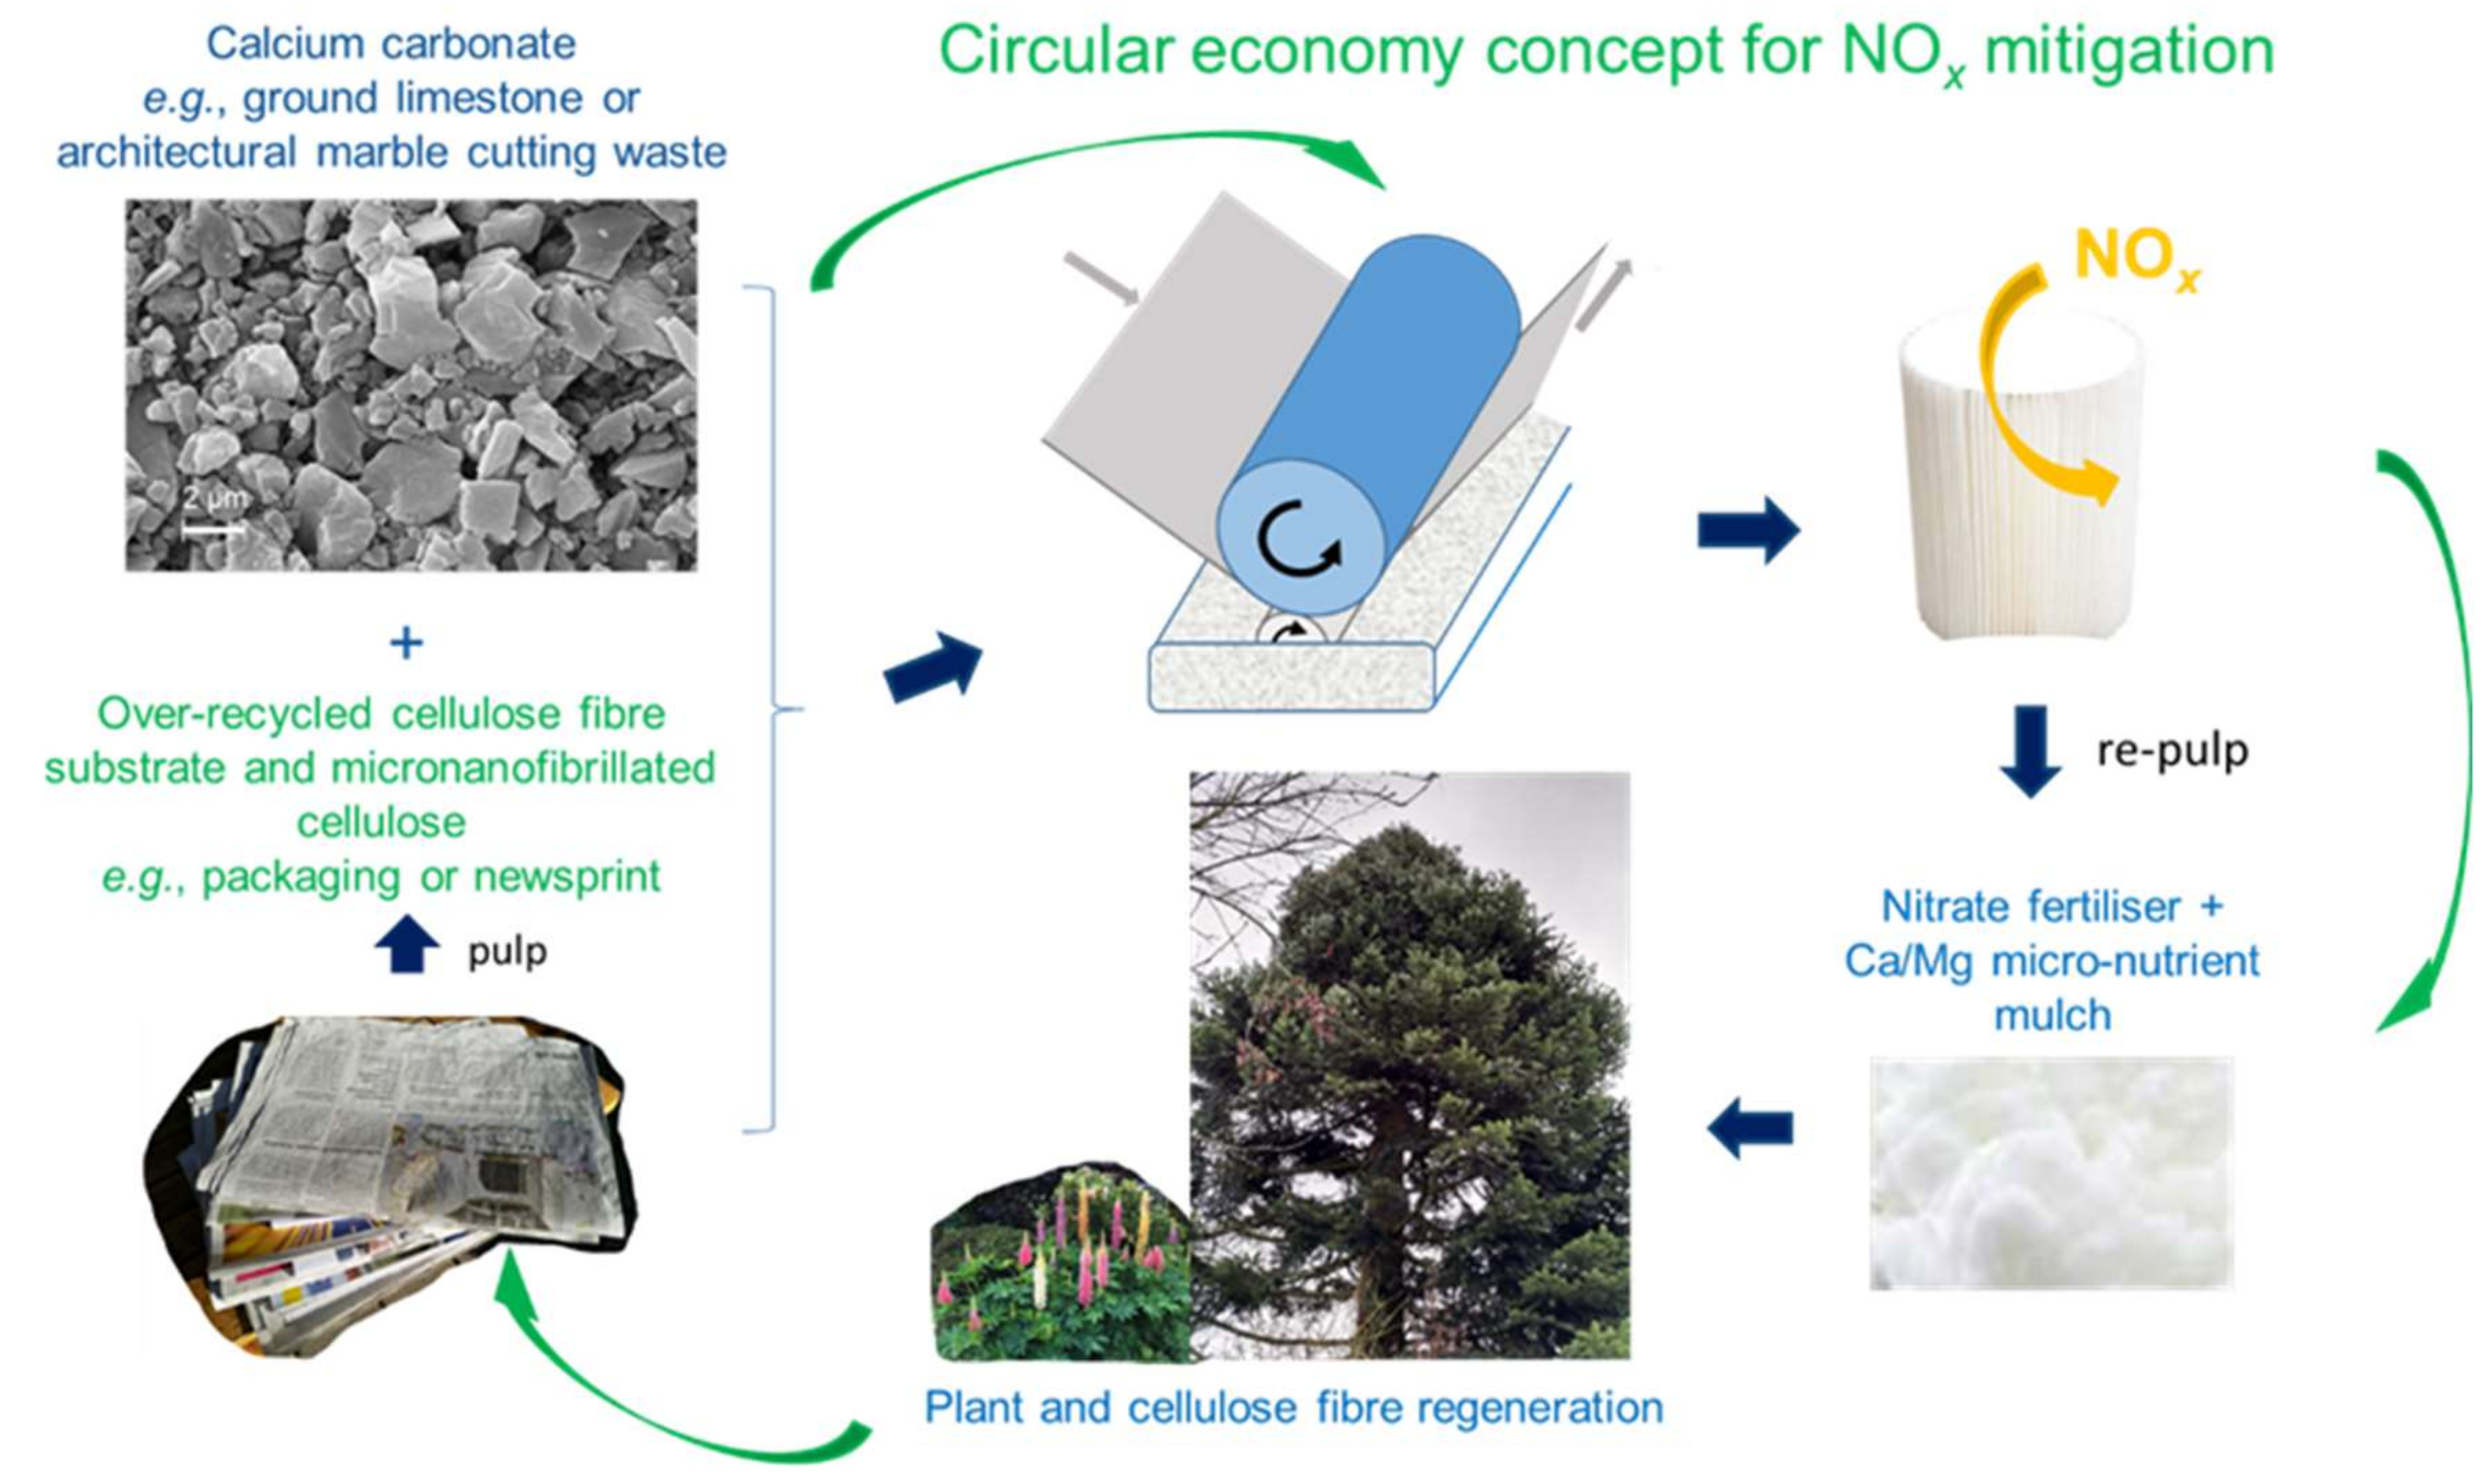
  • Proof of principle was shown for a filter design for the mitigation of gaseous environmental NOx based on no longer viable, multiple, recycled cellulose fibre substrates (newsprint fibre) coated with a reactive coating comprising a fine particulate calcium carbonate combined with a binder-humectant, which is derived from the same recycled fibre source as the substrate, in the form of micro nano-fibrillated cellulose.
  • A laboratory filter construct suitable for illustrating a basis for upscaling was designed by employing the filter material developed. The construct was shown to achieve successful depletion of NOx via the sorption primarily of NO2. NO2 is a pulmonary irritant considered to be highly detrimental to health, and it leads to reduced life expectancy with prolonged exposure.
  • Since EDS analysis initially failed to identify retention of N species, the additional action of de-nitrification bacteria was suspected. Microbial DNA analysis confirmed the presence of several species of de-nitrification bacteria.
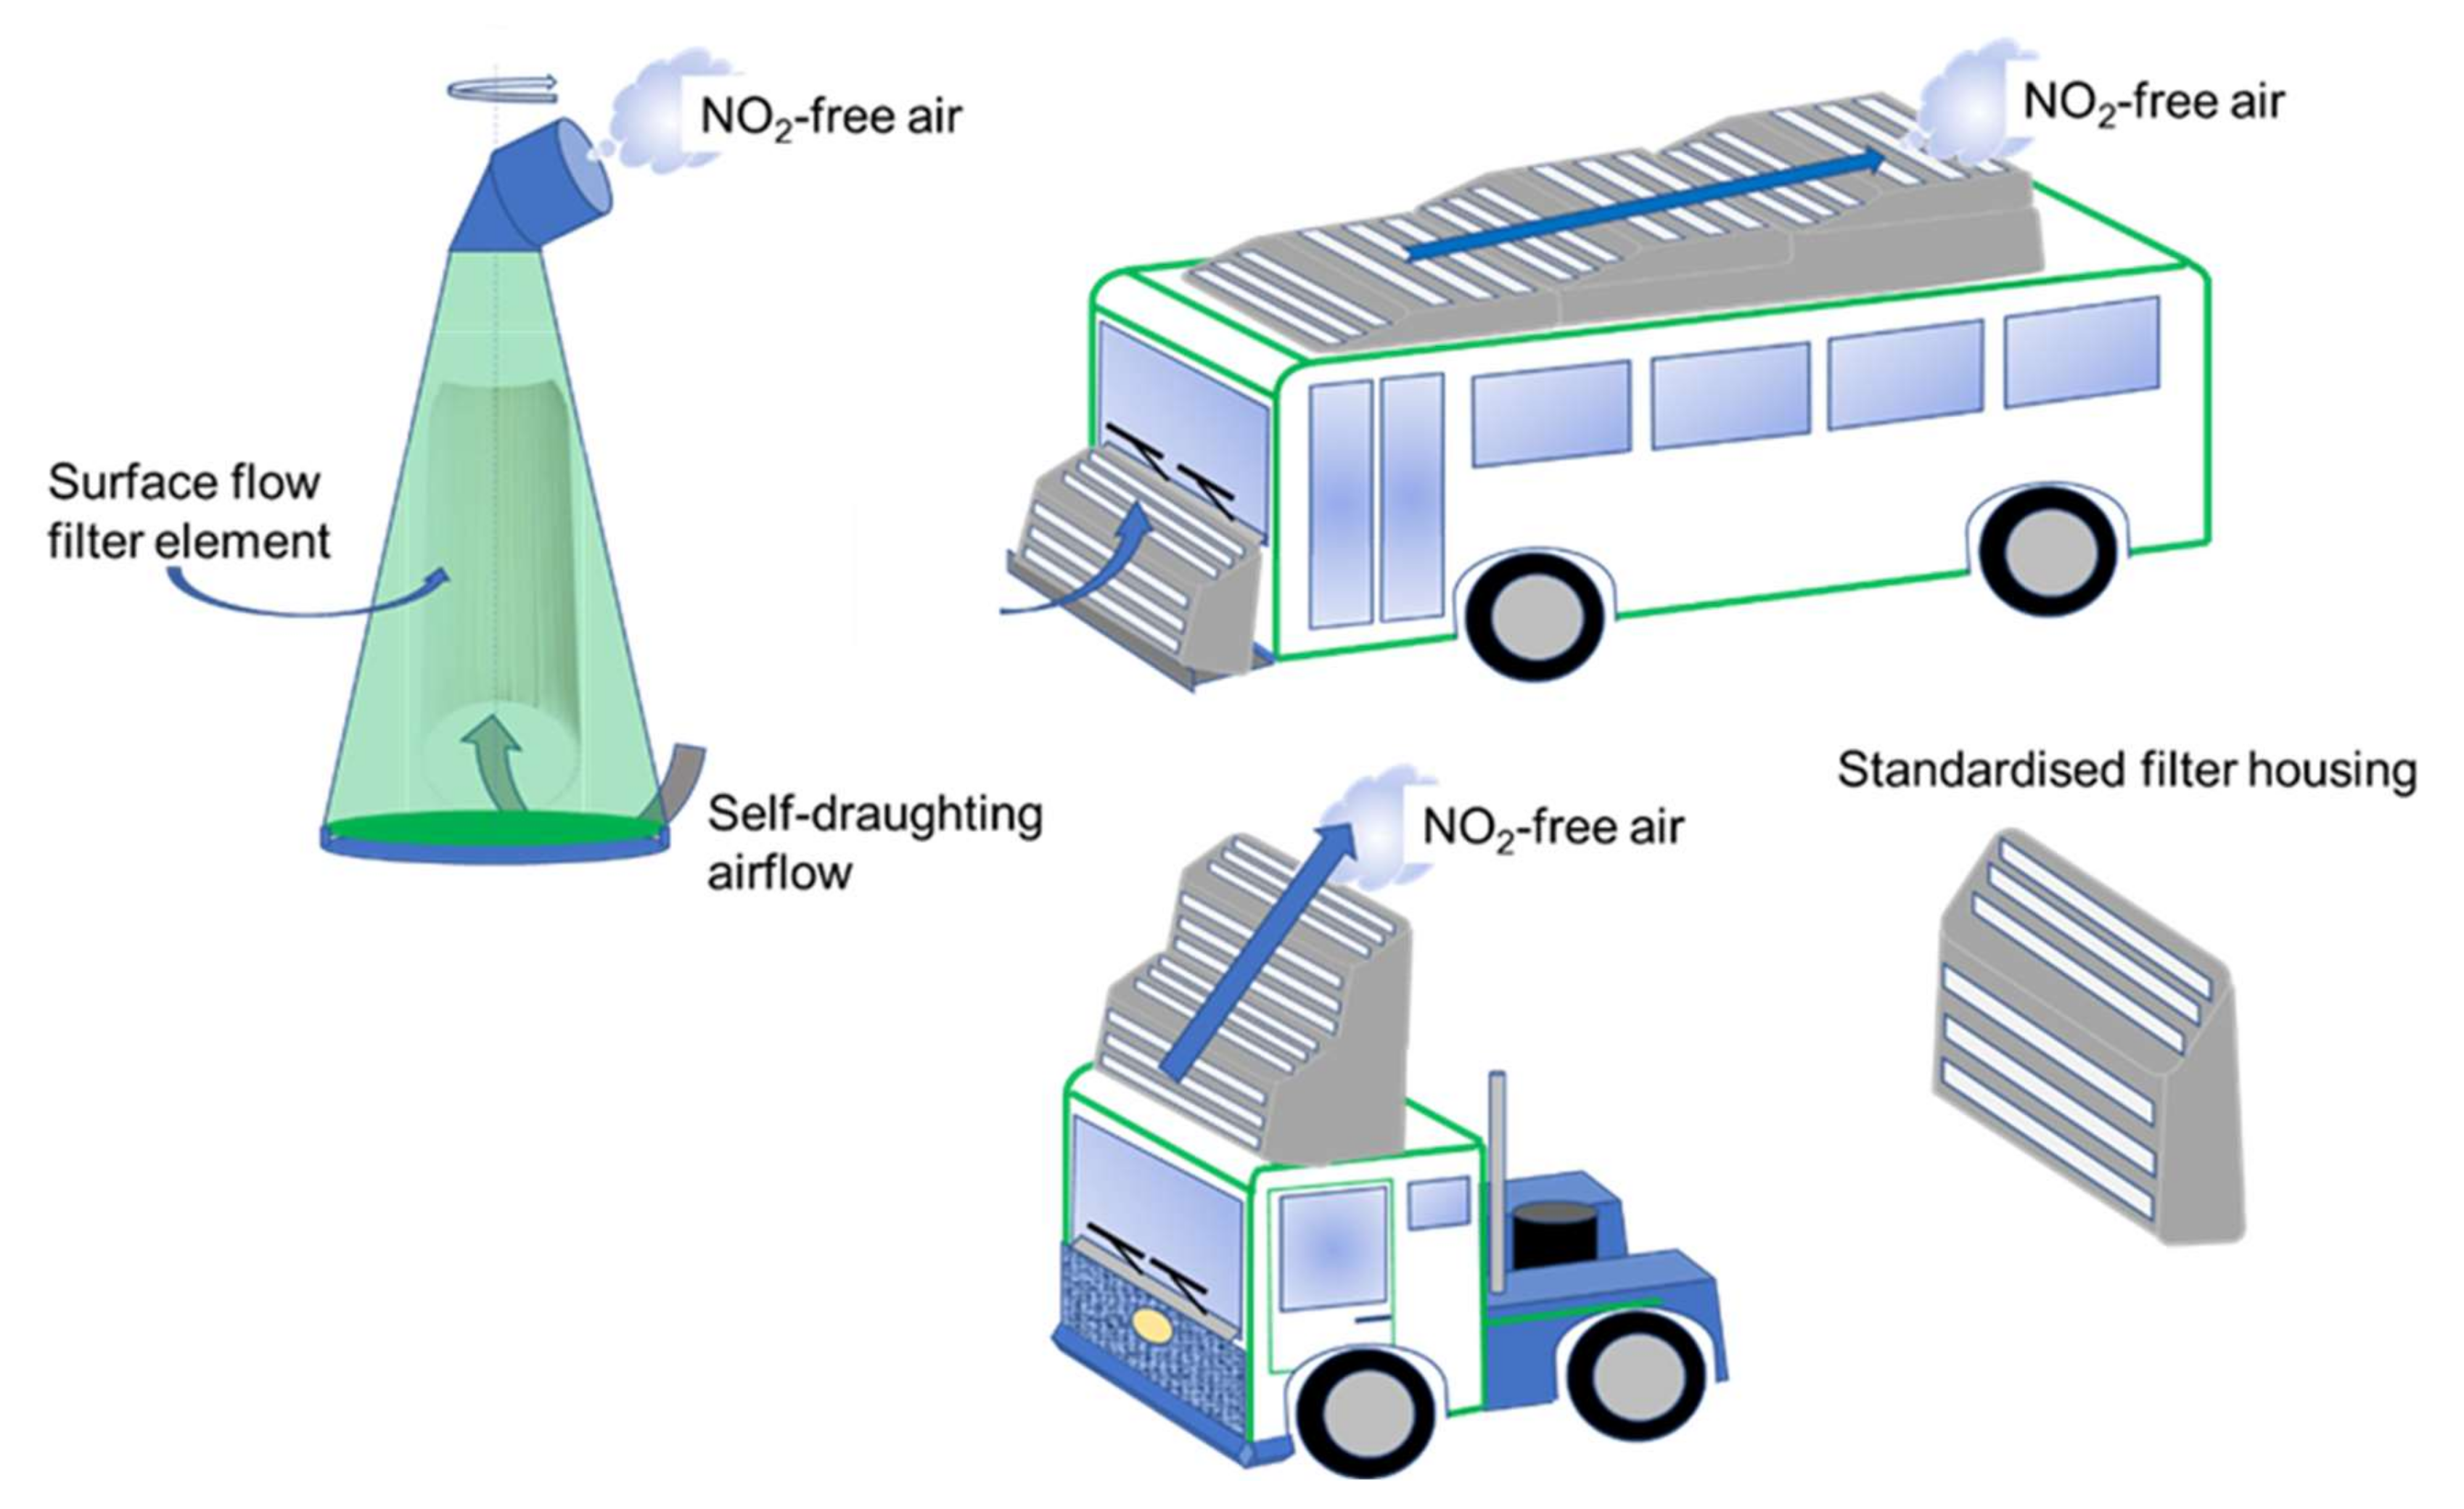
  • Proposals for application include street-side self-draughting installations and/or motion-draughted filters mounted on vehicles. The most likely successful option is to consider municipal and public transport vehicles followed by haulage-trucks.
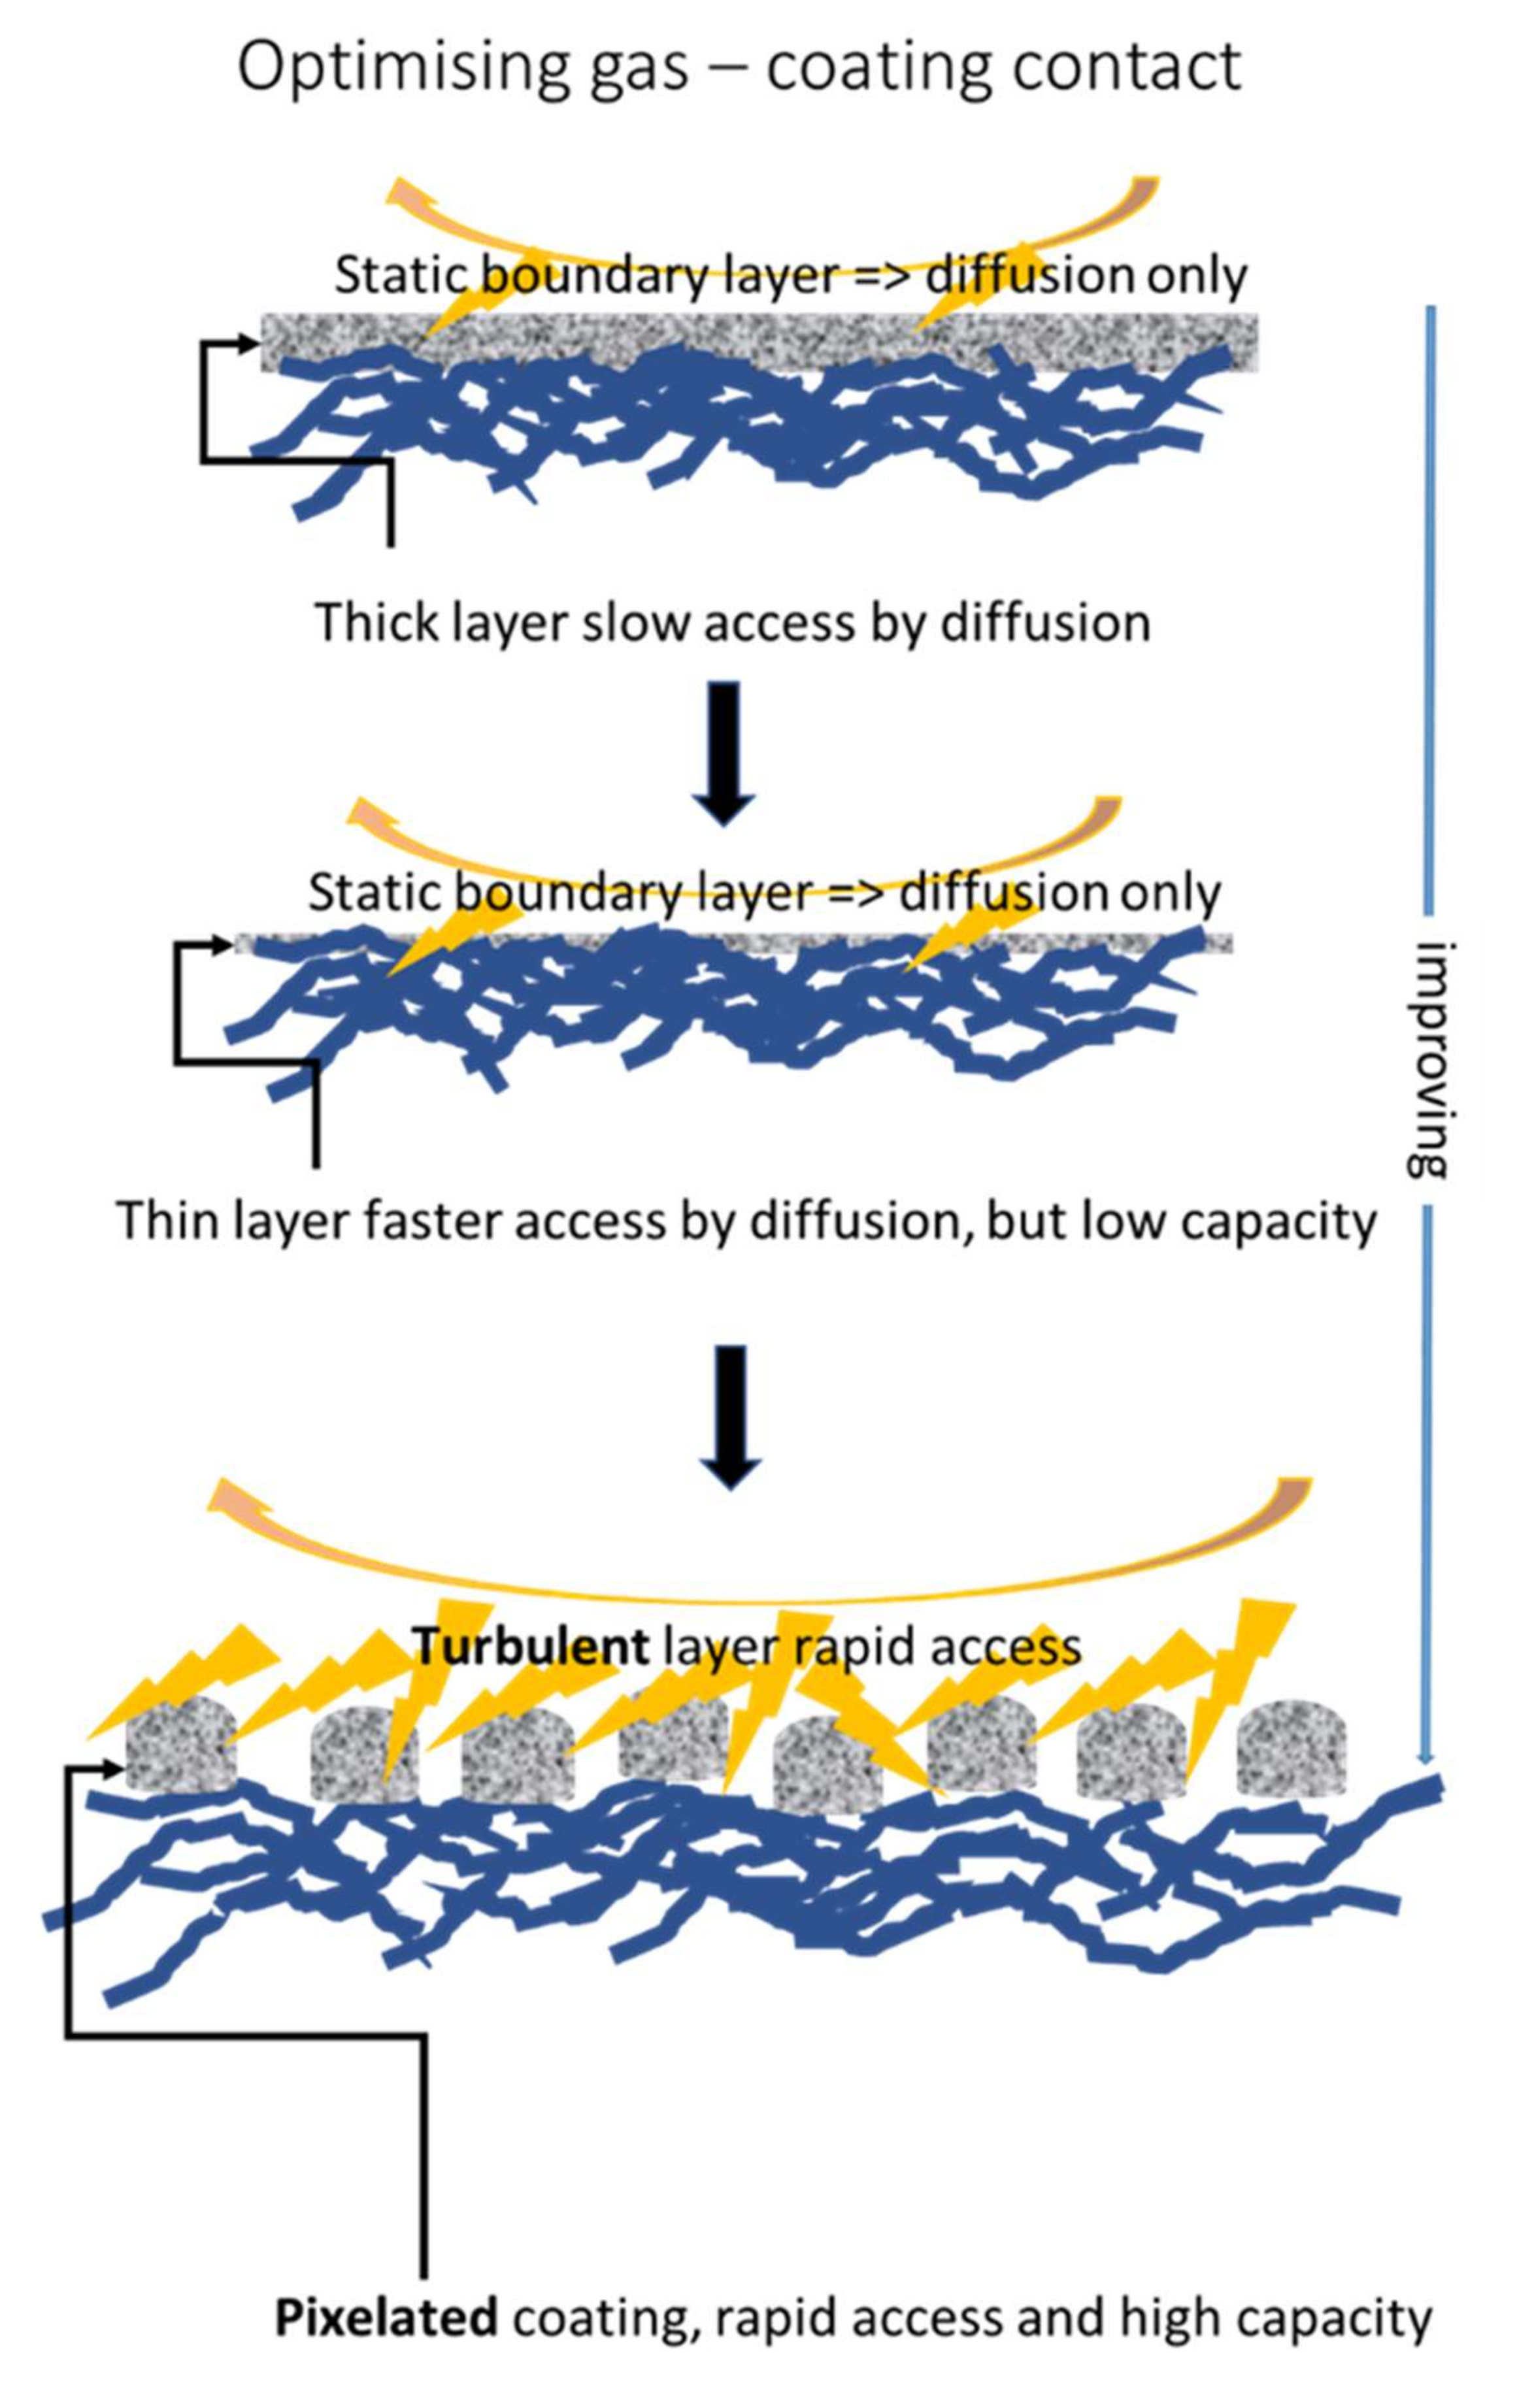
  • The designs developed with respect to special coating constructs in the form of discrete points of coating (pixelate coating) to enhance gaseous exchange and to support turbulent surface flow are not limited to the application illustrated in this work. The designs will be of value in enabling low energy surface-flow filter geometries to be used instead of high-energy through-flow systems.

Author Contributions

Conceptualisation, P.G. and E.B. Methodology, P.G., K.D.-M., N.B., M.I., and D.J. Validation, P.G., P.U., and E.B. Formal analysis, P.G., N.B., K.D.-M., and M.I. Investigation, P.G., K.D.-M., N.B., and M.I. Resources, P.G., P.U., and E.B. Data curation, P.G. and N.B. Writing—original draft preparation, P.G. Writing—review and editing, P.G., P.U., and N.B. Visualisation, P.G., N.B., and K.D.-M. Supervision, P.G., D.J., and P.U. Project administration, P.G., D.J., P.U., and E.B. Funding acquisition, E.B. All authors have read and agreed to the published version of the manuscript.

Funding

This research received no external funding.

Acknowledgments

The Omya International AG, Group Sustainability funded this work. The XPS data were provided by Leena-Sisko Johansson of Aalto University. Ion chromatographic analyses were performed under the supervision of Antonio Onjia from the Faculty of Technology and Metallurgy of the University of Belgrade and the Director of Anahem Laboratories in Belgrade. Electron spectroscopy was performed at the Nanomicroscopy Centre of the Nanotalo Facility of the Aalto University in Finland.

Conflicts of Interest

The authors declare no conflict of interest.

References

  1. European Commission (EC). Directive 2010/75/EU. Directive of the European Parliament and of the Council of 24 November 2010 on Industrial Emission: Integrated Pollution Prevention and Control, the Industrial Emissions Directive (IED); European Union: Brussels, Belgium, 2010. [Google Scholar]
  2. Peters, H.A.R.; Toxopeus, M.E.; Jauregui-Becker, J.M.; Dirksen, M.-O. Prioritizing ‘design for recyclability’ guidelines, bridging the gap between recyclers and product developers. In Leveraging Technology for a Sustainable World; Dornfeld, D.A., Linke, B.S., Eds.; Springer: Berlin/Heidelberg, Germany, 2012; pp. 203–208. [Google Scholar]
  3. FoodDrinkEurope. Guidelines on the Safe Use of Paper and Board Made from Recycled Fibres for Food Contact Use; FoodDrinkEurope: Brussels, Belgium, 2016. [Google Scholar]
  4. Schneider, A.; Cyrys, J.; Breitner, S.; Kraus, U.; Peters, A.; Diegmann, V.; Neunhäuserer, L. Quantifizierung von Umweltbedingten Krankheitslasten Aufgrund der Stickstoffdioxid-Exposition in Deutschland [Quantification of Environmental Disease Burden Due to Nitrogen Dioxide Exposure in Germany]; Abschlussbericht [Closing Report]; Umweltbundesamt: Dessau-Roßlau, Germany, 2018. [Google Scholar]
  5. Buchal, C.; Karl, H.-D.; Sinn, H.-W. Kohlemotoren, windmotoren und dieselmotoren: Was zeigt die CO2-bilanz? [Coal engines, wind engines and diesel engines: How do the carbon footprints compare?]. ifo Schnelld. 2019, 72, 40–54. [Google Scholar]
  6. Wietschel, M.; Kühnbach, M.; Rüdiger, D. Die Aktuelle Treibhausgasemissionsbilanz von Elektrofahrzeugen in Deutschland [The Current Greenhouse Gas Emission Balance of Electric Vehicles in Germany]; (No. S02/2019); Working Paper Sustainability and Innovation; Fraunhofer ISI: Karlsruhe, Germany, 2019. [Google Scholar]
  7. Wietschel, M.; Jung, A.-C. Electric Cars Purchased and Used in Germany Today Have a Much Better Carbon Footprint than Diesel or Gasoline-powered Cars; No. S 02/2019; Fraunhofer Institute for Systems and Innovation Research ISI: Karlsruhe, Germany, 2019. [Google Scholar]
  8. Ozcanli, M.; Bas, O.; Akar, M.A.; Yildizhan, S.; Serin, H. Recent studies on hydrogen usage in Wankel SI engine. Int. J. Hydrog. Energy 2018, 43, 18037–18045. [Google Scholar] [CrossRef]
  9. Dotan, H.; Landman, A.; Sheehan, S.W.; Malviya, K.D.; Shter, G.E.; Grave, D.A.; Arzi, Z.; Yehudai, N.; Halabi, M.; Gal, N.; et al. Decoupled hydrogen and oxygen evolution by a two-step electrochemical–chemical cycle for efficient overall water splitting. Nat. Energy 2019, 4, 786–795. [Google Scholar] [CrossRef]
  10. European Commission. Future Brief: What Are the Health Costs of Environmental Pollution? Publications Office of the European Union: Luxembourg, 2018. [Google Scholar]
  11. Desaigues, B.; Ami, D.; Bartczak, A.; Braun-Kohlová, M.; Chilton, S.; Czajkowski, M.; Farreras, V.; Hunt, A.; Hutchinson, M.; Jeanrenaud, C.; et al. Economic valuation of air pollution mortality: A 9-country contingent valuation survey of value of a life year (VOLY). Ecol. Indic. 2011, 11, 902–910. [Google Scholar] [CrossRef]
  12. Brunauer, S.; Emmett, P.H.; Teller, E. Adsorption of gases in multimolecular layers. J. Am. Chem. Soc. 1938, 60, 309–319. [Google Scholar] [CrossRef]
  13. Busker, L.H. Effects of wet pressing on paper quality. In TAPPI Engineering Conference, Proceedings of the Technical Association of the Pulp and Paper Industry; TAPPI Press: Atlanta, GA, USA, 1985; pp. 117–129. [Google Scholar]
  14. Carrillo, C.A.; Laine, J.; Rojas, O.J. Microemulsion systems for fiber deconstruction into cellulose nanofibrils. ACS Appl. Mater. Interfaces 2014, 6, 22622–22627. [Google Scholar] [CrossRef] [PubMed]
  15. Bajpai, P. Brief description of the pulp and papermaking process. In Biotechnology for Pulp and Paper Processing; Springer: New York, NY, USA, 2018; pp. 9–26. [Google Scholar] [CrossRef]
  16. Barrett, E.P.; Joyner, L.G.; Halenda, P.P. The determination of pore volume and area distributions in porous substances. I. Computations from nitrogen isotherms. J. Am. Chem. Soc. 1951, 73, 373–380. [Google Scholar] [CrossRef]
  17. Sing, K.S.W. Adsorption methods for the characterization of porous materials. Adv. Colloid Interface Sci. 1998, 76–77, 3–11. [Google Scholar] [CrossRef]
  18. Herrick, F.W.; Casebier, R.L.; Hamilton, J.K.; Sandberg, K.R. Microfibrillated cellulose: Morphology and accessibility. J. Appl. Polym. Sci. Appl. Polym. Symp. 1983, 37, 797–813. [Google Scholar]
  19. Li, J.; Wang, Y.; Wei, X.; Wang, F.; Han, D.; Wang, Q.; Kong, L. Homogeneous isolation of nanocelluloses by controlling the shearing force and pressure in microenvironment. Carbohydr. Polym. 2014, 113, 388–393. [Google Scholar] [CrossRef]
  20. Ämmälä, A.; Laitinen, O.; Sirviö, J.A.; Liimatainen, H. Key role of mild sulfonation of pine sawdust in the production of lignin containing microfibrillated cellulose by ultrafine wet grinding. Ind. Crops Prod. 2019, 140, 111664. [Google Scholar] [CrossRef]
  21. Dimic-Misic, K.; Gane, P.A.C.; Paltakari, J. Micro and nanofibrillated cellulose as a rheology modifier additive in CMC-containing pigment-coating formulations. Ind. Eng. Chem. Res. 2013, 52, 16066–16083. [Google Scholar] [CrossRef]
  22. Dimic-Misic, K.; Puisto, A.; Gane, P.; Nieminen, K.; Alava, M.; Paltakari, J.; Maloney, T. The role of MFC/NFC swelling in the rheological behavior and dewatering of high consistency furnishes. Cellulose 2013, 20, 2847–2861. [Google Scholar] [CrossRef]
  23. Schenker, M.; Schoelkopf, J.; Mangin, P.; Gane, P. Rheological investigation of complex micro nanofibrillated cellulose (MNFC) suspensions: Discussion of flow curves and gel stability. TAPPI J. 2016, 15, 405–416. [Google Scholar] [CrossRef]
  24. Dimic-Misic, K.; Puisto, A.; Paltakari, J.; Alava, M.; Maloney, T. The influence of shear on the dewatering of high consistency nanofibrillated cellulose furnishes. Cellulose 2013, 20, 1853–1864. [Google Scholar] [CrossRef]
  25. Rantanen, J.; Dimic-Misic, K.; Kuusisto, J.; Maloney, T.C. The effect of micro and nanofibrillated cellulose water uptake on high filler content composite paper properties and furnish dewatering. Cellulose 2015, 22, 4003–4015. [Google Scholar] [CrossRef]
  26. Tayeb, A.H.; Amini, E.; Ghasemi, S.; Tajvidi, M. Cellulose nanomaterials-binding properties and applications: A review. Molecules 2018, 23, 2684. [Google Scholar] [CrossRef] [Green Version]
  27. Velthaus, K.-O.; Göbel, T.; Choi, J.H. Vector network analyser. WO Patent No. WO2017017579, 2017. [Google Scholar]
  28. Vilela, C.; Moreirinha, C.; Domingues, E.M.; Figueiredo, F.M.L.; Almeida, A.; Freire, C.S.R. Antimicrobial and conductive nanocellulose-based films for active and intelligent food packaging. Nanomaterials 2019, 9, 980. [Google Scholar] [CrossRef] [Green Version]
  29. RSN1 Info. Inside Europe: Belgrade Pollution Breaks Record. News Bulletin Serbian National 1. 2019. Available online: https://www.dw.com/en/inside-europe-belgrade-pollution-breaks-record/av-51545460 (accessed on 1 December 2019).
  30. SEPA. Godišnji Izveštaj o Stanju Kvaliteta Vazduha u Republici Srbiji za 2018 Godinu [Annual Report on the State of Air Quality in the Republic of Serbia for 2018]; Serbian Environmental Protection Agency: Belgrade, Serbia, 2019. Available online: http://www.sepa.gov.rs/download/izv/Vazduh2018_final.pdf (accessed on 13 November 2019).
  31. Serbian Monitor. Belgrade Becomes One of the Most Polluted Capital Cities. 2019. Available online: https://www.serbianmonitor.com/en/belgrade-becomes-one-of-the-most-polluted-capital-cities/ (accessed on 1 December 2019).
  32. Jernigan, A.J.R. Chemiluminescence NOx and GFC NDIR CO Analyzers for Low Level Source Monitoring; Thermo Environmental Instruments: Franklin, MA, USA, 2001. [Google Scholar]
  33. Hunter, R.J. Foundations of Colloid Science, 2nd ed.; Oxford University Press: Oxford, UK, 2001. [Google Scholar]
  34. Fernandes, A.C.; Antunes, F.; Pires, J. Sepiolite based materials for storage and slow release of nitric oxide. New J. Chem. 2013, 37, 4052–4060. [Google Scholar] [CrossRef]
  35. Kocaoba, S. Adsorption of Cd(II), Cr(III) and Mn(II) on natural sepiolite. Desalination 2009, 244, 24–30. [Google Scholar] [CrossRef]
  36. Rauret, G.; López-Sánchez, J.F.; Sahuquillo, A.; Rubio, R.; Davidson, C.; Ure, A.; Quevauviller, P. Improvement of the BCR three step sequential extraction procedure prior to the certification of new sediment and soil reference materials. J. Environ. Monit. 1999, 1, 57–61. [Google Scholar] [CrossRef] [PubMed]
  37. Gibbs, R.J. Mechanisms of trace metal transport in rivers. Science 1973, 180, 71–73. [Google Scholar] [CrossRef] [PubMed]
  38. Tessier, A.; Campbell, P.G.C.; Bisson, M. Sequential extraction procedure for the speciation of particulate trace metals. Anal. Chem. 1979, 51, 844–851. [Google Scholar] [CrossRef]
  39. Alborés, A.F.; Cid, B.P.; Gómez, E.F.; López, E.F. Comparison between sequential extraction procedures and single extractions for metal partitioning in sewage sludge samples. Analyst 2000, 125, 1353–1357. [Google Scholar] [CrossRef]
  40. Real-time Air Quality. Global Open Data Index 2019. Available online: https://index.okfn.org/place/rs/ (accessed on 19 October 2019).
  41. SEPA. National network of automatic stations for air quality monitoring. Available online: http://www.amskv.sepa.gov.rs/?lng=en (accessed on 19 October 2019).
Figure 1. NO2 levels exceeding regulatory limit values distributed over London, England (London Atmospheric Emission Inventory 2016, © Crown 2020 copyright Defra and BEIS, licensed under the Open Government Licence (OGL)).
Applsci 10 03927 g001
Figure 2. The circular economy concept for NOx mitigation (photographs by courtesy of the author P.A.C. Gane (2020)).
Applsci 10 03927 g002
Figure 3. (a) The United Nations (UN) sustainability development goals. The circled goals were achieved in this project and (b) EU (European Union) Commission criteria for circular economy.
Applsci 10 03927 g003
Figure 4. (a) Integral fibres manifest in unbleached virgin Kraft pulp compared with (b) multiple recycled newsprint fibre: optical microscopy images were taken using a Leica DM 750 (Leica Microsystems GmbH, Ernst-Leitz-Strasse 17-37, Wetzlar, 35578 Germany).
Applsci 10 03927 g004
Figure 5. Sheet-forming the substrate sheets using a laboratory hand sheet former. The examples shown were made from unbleached Kraft (brown) and from the recycled newsprint (grey).
Applsci 10 03927 g005
Figure 6. The field emission scanning electron microscope (FESEM) images of ground calcium carbonate (GCC) particles displayed at increasing magnification (see scale bars): (a) through (d).
Applsci 10 03927 g006
Figure 7. (a) Super mass collider grinding fibres between two abrasive contacting disks, (b) water separated from the fibrillar mass during production. Note its colour containing a high proportion of suspended ink particles. (c) The gel-like colloidal mass of micro nano-fibrillated cellulose (MNFC) produced and shown as fine fibrils clustered in the electron microscope image. Dimensions (length and breadth) of the largest retained fibrils are also illustrated by the added yellow lines to increase visibility—black spots indicate retained ink particles (mostly carbon black).
Applsci 10 03927 g007
Figure 8. Optical microscope images present the mix of micro nano-fibrillated cellulose (MNFC) and CaCO3 particles that were used in coatings: (a) and (b) fibres of recycled newsprint sheet (NP), and (c) dispersion of CaCO3 in the matrix of MNFCNP.
Applsci 10 03927 g008
Figure 9. Illustration of the need for and methods that can be used to optimise gas-coating contact.
Applsci 10 03927 g009
Figure 10. A hand-held pin coater and an illustration of its application to produce a pixelated coating on the fibrous substrate.
Applsci 10 03927 g010
Figure 11. The scanning electron microscope (SEM) images of the surface of pin coated substrate showing applications made at medium and high solids content (50 w/w%, 60 w/w%, and 70 w/w%, respectively)—different magnifications are used conveniently to demonstrate both the coating dot edge line and individual coating structure.
Applsci 10 03927 g011
Figure 12. Initial results of the exposure of CaCO3 to ambient air over several months, which revealed a conversion reaction of –CO32− to –(NO2/NO3)2 rather than simple inert surface adsorption data.
Applsci 10 03927 g012
Figure 13. Static exposure procedure for coated samples, which included the gas-loaded super syringe, removed samples in storage vessels and aqueous extraction for ion chromatographic analysis.
Applsci 10 03927 g013
Figure 14. FESEM images showing the typical high surface area structure of hydroxyapatite (HAP) at increasing magnification (see scale bars) (ad).
Applsci 10 03927 g014
Figure 15. Exposure of CaCO3 and its HAP modification to NO2 gas.
Applsci 10 03927 g015
Figure 16. Filter samples mounted in cassettes to enable comparison of moisture content. Flow conditions and gas concentration data are also shown.
Applsci 10 03927 g016
Figure 17. (a) Schematic of the flow system that shows inlet and filter-contact outlet flows, (b) the samples (smooth two-side coated recycled newsprint substrate (NP)) mounted in practice–gas concentration is shown as c(NO2) = 2.9 mg·m−3, and (c) ion chromatograph that shows the predominance of nitrite on a pre-wetted sample.
Applsci 10 03927 g017
Figure 18. Monitoring of (a) total NOx and (b) NO2 levels to compare official data from a range of monitoring stations with laboratory sampling of external air at the Faculty of Technology and Metallurgy (FTM), Belgrade (1-h mean values).
Applsci 10 03927 g018
Figure 19. Comparison of ambient NOx concentrations (Faculty of Technology and Metallurgy (FTM), University of Belgrade, sampling point) between chemiluminescence NO-NO2-NOx analysers: Thermo Environmental Instruments 42C (green line) vs. EAS Envimet ČR, č.r.o. 200E (orange line).
Applsci 10 03927 g019
Figure 20. Construction of the filter box using wooden hangers to mount a curtain-like rank of pleated filter sheets. This is placed in consecutive series across the direction of flow between the inlet, taken from outside the laboratory, and the outlet leading to the NOx analyser. This exhausts the exterior atmosphere.
Applsci 10 03927 g020
Figure 21. Ambient outdoor airflow rate before and during connection to the filter.
Applsci 10 03927 g021
Figure 22. Insertion of the box design surface flow filter in the stream of externally sampled air. The red arrow indicates the generation of NO while the green arrow indicates NO2 concentration and drops during the period of exposure.
Applsci 10 03927 g022
Figure 23. (a) Regeneration of the NO2 → NO effect between exposures while background NO level in the incoming air is constant, (b) long time repeated exposure (as shown Friday 5th July–Tuesday 16th July 2019) saturates the RedOx reaction.
Applsci 10 03927 g023
Figure 24. Experimental exposures of the variously treated filters shown as the period connected between sampling the outdoor air only: (a) thermal sterilisation prevented regeneration of the RedOx capacity but did not fully oxidise the sample, (b) treatment with 0.1 w/w% H2O2 pre-oxidised the sample, such that the regeneration was prevented and the sample showed no RedOx capacity, (c) comparing the light and dark samples eliminates any possibility that the mechanism was driven by photon catalysis.
Applsci 10 03927 g024aApplsci 10 03927 g024b
Figure 25. The Fourier transform infrared (FTIR) spectral analysis of recycled newsprint substrate that illustrates the action of pre-oxidation by removing the H-C=O stretch band.
Applsci 10 03927 g025
Figure 26. EDS spectra from scraped coatings taken from filter elements: (a) control sample, H2O2 pre-oxidised and un-exposed, (b) non-sterilised and exposed to ambient air containing NOx, (c) thermally sterilised and exposed, and (d) H2O2 pre-oxidised and exposed (tabulated values are shown in Table 11).
Applsci 10 03927 g026aApplsci 10 03927 g026b
Figure 27. Filter efficiency comparison between H2O2 pre-oxidised (green line) and non-sterilised (NO2 → NO conversion, red line) samples mounted in the smaller filter box.
Applsci 10 03927 g027
Figure 28. SEM images of (a) sepiolite, and (b) fused perlite with a schematic insert that demonstrates the pore condensation of gas.
Applsci 10 03927 g028
Figure 29. CO2 in situ capture in (a) fused perlite, and (b) sepiolite blended at 10 w/w% with CaCO3 (GCC).
Applsci 10 03927 g029
Figure 30. Illustration of the method for sequential exposure to CO2 and flushing with synthetic air.
Applsci 10 03927 g030
Figure 31. The release of selectively intercalated NO from sepiolite upon exposure to CO2.
Applsci 10 03927 g031
Figure 32. Non-selective pore sorption of NOx components resulted in their release on exchange with CO2.
Applsci 10 03927 g032
Figure 33. Adapted methodology to focus on the elected heavy elements (HEs) Pb, Cd, Hg, As, Sb, and Cu.
Applsci 10 03927 g033
Figure 34. Evidence of reaching air quality better than the lowest measured in the low traffic density suburbs of Belgrade, Serbia. NOx concentration recordings in ambient air for five sampling points in the city of Belgrade in relation to the FTM sampling points (1 d mean values from 13 to 19 October 2019) [40,41].
Applsci 10 03927 g034
Figure 35. Illustrative concepts of street side self-draughting installation and vehicle exterior mounted filter boxes (future development).
Applsci 10 03927 g035
Table 1. European Union (EU) Directive Limits on Atmospheric NO2 Concentration.
PollutantConcentration
(µg·m−3)
Averaging PeriodLegal RequirementPermitted Number of Exceedances per Year
Nitrogen dioxide (NO2)2001 hLimit value to be met as of 1.1.201018
401 yearLimit value to be met as of 1.1.2010 *n/a
* Under Directive 2008/50/EU, the Member State could apply for an extension of up to five years (i.e., based on the maximum up to 2015) in a specific zone. The request is subject to an assessment by the Commission. In such cases, within the time extension period, the limit value applied at the level of the limit value + maximum margin of tolerance (48 µg·m−3 for annual NO2 limit value).
Table 2. Data Translated from Schneider et al. [4], Federal Environment Agency, Germany, under the Creative Commons attribution-non-commercial-no processing 4.0 international license (https://creativecommons.org/licenses/by-nc-nd/4.0/).
Burden of NO2 Exposure20072008200920102011201220132014
Attributable fraction 1 (%)2.192.292.262.261.861.871.581.77
Attributable deaths 278328157803579606343653156055966
Years of life lost 3 (YLL)69,24471,39669,52668,42853,48954,53646,79549,726
YLL per
100,000 population
122.78126.40123.04120.8594.1095.4883.1387.96
1 Percentage of NO2-attributable cases of cardiovascular mortality. 2 Number of NO2-attributable deaths. 3 YLL = number of deaths × standard life expectancy in years at age of death.
Table 3. Hand sheet properties.
SampleArea, A
(m2)
Mass, m
(g)
Basis Weight
(g·m−2)
Thickness, t
(μm)
Volume, V
(cm3)
Density, D
(g·cm−3)
Porosity
(%)
* UK0.0272.18802185.940.3775.6
** NP0.0272.18801834.980.4470.9
* UK = unbleached Kraft sheet. ** NP = recycled newsprint sheet.
Table 4. Particle size upper limits in the fractions contained in the < 10 v/v%, < 50 v/v% (median), and < 90 v/v% regions before and after ultrasonication in water.
Volume Defined Particle Size Distribution Data Measured by Light Scattering
Particle Size 1Before Sonication (µm)After Sonication (µm)
d10 (vol) 23.331.12
d50 (vol)4.611.41
d90 (vol)6.051.77
1 Particle size determined by laser light diffraction in dilute aqueous suspension (Malvern Mastersizer, Malvern Instruments, Malvern, UK). 2 For particles of identical material and optical densities, the v/v size distribution was identical to the w/w size distribution.
Table 5. BET (Brunauer-Teller-Emmett) and BJH (Barrett, Joyner, and Halenda) N2 specific surface area data and meso and micropore volume.
SampleSpecific Surface Area, SSA
(m2·g−1)
Total Pore Volume,
Vtot
(cm3·g−1)
Mesopore Volume, Vmeso
(cm3·g−1)
Micropore Volume
Vmicro
(cm3·g−1)
Pore Diameter from Alpha S-Plot, dsr
(nm)
CaCO3 (GCC)5.050.01920.01840.002320.9
Table 6. Nitrite and nitrate concentrations comparing non-exposed and exposed smooth coated substrate samples.
Nitrite and Nitrate Concentrations Determined by Ion Chromatography (mg·dm−3)
SampleNitrite (NO2)Nitrate (NO3)
UK ! blank*0.02.0
UK blank repeat *0.01.8
NP !! blank *0.02.3
NP blank repeat *0.00.8
UK exposed **1.53.6
UK exposed repeat **1.34.1
NP exposed **1.04.0
NP exposed repeat **1.17.0
! UK = unbleached Kraft substrate. !! NP = recycled newsprint substrate. * Non-exposed to synthetic NO2. ** Exposed to synthetic NO2 at 10 ppm concentration for 72 h.
Table 7. Specific surface area and surface pore volume characteristics by BET nitrogen adsorption (hydroxyapatite (HAP) phosphate modifications of CaCO3).
SampleSpecific Surface Area, SSA
(m2·g−1)
Total Pore Volume,
Vtot
(cm3·g−1)
Mesopore Volume, Vmeso
(cm3·g−1)
Micropore Volume,
Vmicro
(cm3·g−1)
Pore Diameter from Alpha S-Plot, dsr
(nm)
CaCO3 (GCC)5.050.01920.01840.002320.9
HAP98.900.57380.57430.028113.4
Table 8. Sorbed NOx gas results with respect to nitrite and nitrate species for the standard GCC CaCO3 sample and the hydroxyapapatite surface converted CaCO3.
SampleNO2 (mg·dm−3)NO3 (mg·dm−3)NO2
(mg·kg−1)
Dry Material
NO3
(mg·kg−1)
Dry Material
CaCO3 exposed1.22.36.913.9
HAP (on CaCO3) exposed1.62.39.713.8
Table 9. Nitrite and nitrate formation comparison as a function of moisture level on exposure to synthetic NO2 relative to a non-exposed sample and non-pre-wetted (REGULAR) sample.
SampleNO2
(mg·kg−1filter)
NO3
(mg·kg−1filter)
NP coated exposed REGULAR36.8241.34
NP coated exposed WET137.9730.04
NP coated non-exposed BLANK14.6731.25
Table 10. Results of microbial analysis identifying contamination levels and genus/species.
SampleCultured Extract
Total Viable Count (TVC) of Aerobic Bacteria
(cfu·g−1sample)
Observed GrowthNitrite
(mg·cm−3)
OrganismScore
Uncoated NP substrate non-sterilised 1> 105yes50--
Uncoated NP substrate thermally sterilised74 × 103yes50Bacillus sp. 31.839
Uncoated NP substrate treated with H2O2> 105yes50Enterobacter kobei2.349
Coated NP substrate non-sterilised> 105yes50Bacillus cereus2.081
Coated NP substrate thermally sterilised 18 × 103yes50--
Coated NP substrate treated with H2O2> 105yes50Enterobacter kobei2.320
GCC non-sterilised 24 × 103----
MNFC non-sterilised> 105yes50Bacillus licheniformis2.057
Laboratory bacteria-free control-no0--
1 Bacteria grew as a complete thin film, so no discrete colonies could be separated. 2 Microparticle turbidity prevented observation. 3 Score below 2.0 can only be used for genus identification.
Table 11. Electron energy loss spectroscopy (EELS) analysis of filter coatings from scraped coatings taken from filter elements exposed to ambient air containing NOx. [Values for nitrogen (N) are shown in bold to emphasise the differences between the samples.]
ElementExcitation Potential (keV)Mass Proportion (%)Atom Occurrence (%)
Scraped coating powder (GCC + MNFC): non-sterilised exposed
C0.2723.2340.41
N0.392.954.4
O0.5221.2827.79
Ca3.6952.5527.4
Scraped coating powder (GCC + MNFC): thermally sterilised exposed
C0.2724.9438.13
N0.397.479.8
O0.5230.5935.12
Ca3.6936.9916.95
Scraped coating powder (GCC + MNFC): H2O2 pre-oxidised exposed
C0.2723.1438.07
N0.399.2112.99
O0.5220.9925.93
Ca3.6946.6723.01
Table 12. Descriptive statistics of NOx concentration (μg·m−3) for filtered and unfiltered ambient outdoor air.
SamplesMean ± SDMedian
(Min–Max)
SkewnessKurtosis
Filter box with H2O2 pre-oxidised samples11.6 ± 4.110.7
(5.3–29.8)
1.7105.249
Filter box with non-sterilised samples displaying NO2 → NO conversion17.1 ± 4.216.2
(11.5–38.0)
2.0797.148
Ambient outdoor NOx *36.3 ± 22.632.6
(8.1–125.5)
1.7334.021
* Concentrations before and after filtering. SD: standard deviation.
Table 13. Heavy elements (HE) content in extracted fractions.
Water Soluble Fraction,
c (mg·kg−1)
PbCdHgAsSbCu
Filter exposed0.42< DL< DL0.60< DL< DL
Blank non-exposed0.42< DL< DL0.66< DL< DL
Acid Soluble Fraction,
c (mg·kg−1)
PbCdHgAsSbCu
Filter exposed0.84< DL< DL0.48< DL< DL
Blank non-exposed0.36< DL< DL0.75< DL< DL
Total HE Content,
c (mg·kg−1)
PbCdHgAsSbCu
Filter exposed42.00< DL< DL0.51< DL72.00
Blank non-exposed54.00< DL< DL0.66< DL96.00
< DL—below detectable limit.

