Article

HYDRUS-1D Simulation of Nitrogen Dynamics in Rainfed Sweet Corn Production

1
Department of Biological and Agricultural Engineering, Universiti Putra Malaysia, Serdang 43400, Malaysia
2
Department of Agricultural Engineering, University of Agriculture Faisalabad, Faisalabad 38000, Pakistan
3
Faculty of Sustainable Agriculture, Universiti Malaysia Sabah (UMS), Kota Kinabalu 88400, Malaysia
4
Malaysian Agriculture and Research Development Institute (MARDI), Serdang 43400, Malaysia
*
Author to whom correspondence should be addressed.
Appl. Sci. 2020, 10(11), 3925; https://doi.org/10.3390/app10113925
Submission received: 24 March 2020 / Revised: 23 April 2020 / Accepted: 25 April 2020 / Published: 5 June 2020
(This article belongs to the Section Environmental Sciences)

Abstract

:
Nitrogen loss from agricultural fields results in contamination of ground and surface water resources due to leaching and runoff, respectively. Nitrogen transport dynamics vary significantly among agricultural fields of different climates, especially in the tropical climate. This study intended to evaluate the rainfall impact on nitrogen distribution and losses under tropical rain-fed conditions. The study was carried out in a sweet corn field for two growing seasons at the Malaysian Agricultural Research and Development Institute (MARDI) research field. The HYDRUS-1D numerical model was used to simulate nitrogen transport dynamics in this study. The observed nitrogen concentrations were used for calibration and validation of the model. Total nitrogen input to sweet corn was 120 kg/ha for both seasons. Nitrogen losses through surface runoff and leaching were dominating pathways. Surface runoff accounted for 35.3% and 22.2% of total nitrogen input during the first and second seasons, respectively. The leaching loss at 60 cm depth accounted for 4.0% (first season) and 18.5% (second season). The crop N uptake was 37.5% and 24.9% during the first and second seasons, respectively. Nitrate was the dominant form of N uptake by the crop that accounted for 83.6% (first season) and 78.5% (second season). The HYDRUS-1D simulation results of nitrogen concentrations and fluxes were found in good agreement with observed data. The overall results of simulation justified the HYDRUS-1D for improved fertilizer use in the tropical climate.

1. Introduction

Solute transport in agricultural fields is dynamic in nature. Nitrogen (N) pollution has become a global environmental problem with serious implications on surface and ground waters [1]. The groundwater contamination due to agricultural activity depends on the amount of N applied and its effective use by crops [2]. N is an essential nutrient that highly affects crop yield [3]. Therefore, farmers apply N-fertiliser to high-yield crops. Corn also demands large amount of N for optimal yield. Due to a lack of management guidelines, most farmers apply fertiliser based on their experience and do not consider their environmental consequences [4]. N leaching out of the root zone due to excessive application of N-fertilisers is a potential cause of water resource pollution, which has been observed in many parts of the world [5,6].
In humid regions, low recovery of fertilizer by crop results in increased leaching of soil residual N to groundwater during off-season rainfall [7]. Rainfall triggers flow processes such as surface runoff, preferential flow, and the nitrate leaching [8,9]. Excessive water application is also a major factor that controls N leaching. Therefore, along with fertiliser optimum use of water is also a prerequisite. In soil, N is present in different forms such as organic N, ammonia (NH4+-N) and nitrate (NO3-N). Due to its mobility, NO3-N contributes to groundwater pollution more than any other form [9]. In the past, many research studies have been carried out to find the effect of reduced fertiliser rate on the crop. However, the reduction in the use of fertiliser may reduce the yield as well due to which the farmers are less willing to adopt this technique. Reducing the water application could be an option, particularly in tropical regions to reduce fertiliser leaching. Therefore we considered rainfed conditions and ignored scheduled irrigation. The current study focused to evaluate the effect of rainfall on nutrient distribution in the tropical region based on intensive fieldwork.
The simulation models have been very effective in describing transport processes and the extent to which management practices affect crop yield and the environment. However, the significance of their use is multiplied when the prediction is based on local soil and climate conditions [10]. Among different available models, HYDRUS-1D [11] has been widely used for water flow and solute transport simulations, and to analyze flow and transport processes in agricultural fields. HYDRUS-1D has the flexibility of accommodating different boundary conditions as compared to other models. The model can consider the root uptake of water and nutrient simultaneously. The model is capable of simulating soil water and solute dynamics under different management practices [12,13,14,15,16,17,18,19,20,21,22,23].
The heavy rainfall events in the tropical climate cause a significant increase in solute loss. In Malaysia, the amount of rainfall may potentially fulfil the crop water requirements to ensure nitrogen availability to plant. However, the uncertainty in the duration and frequency of rainfall can affect nitrogen distribution and crop uptake. Therefore, the study was carried out to quantify nitrogen losses through surface runoff and subsurface leaching from the sweet corn field. The study objectives were: (1) to evaluate the rainfall impact on nitrogen distribution and losses under tropical rain-fed conditions in presence of shallow water table, and (2) to calibrate and validate the HYDRUS-1D model for nitrogen transport in the humid tropics.

2. Material and Methods

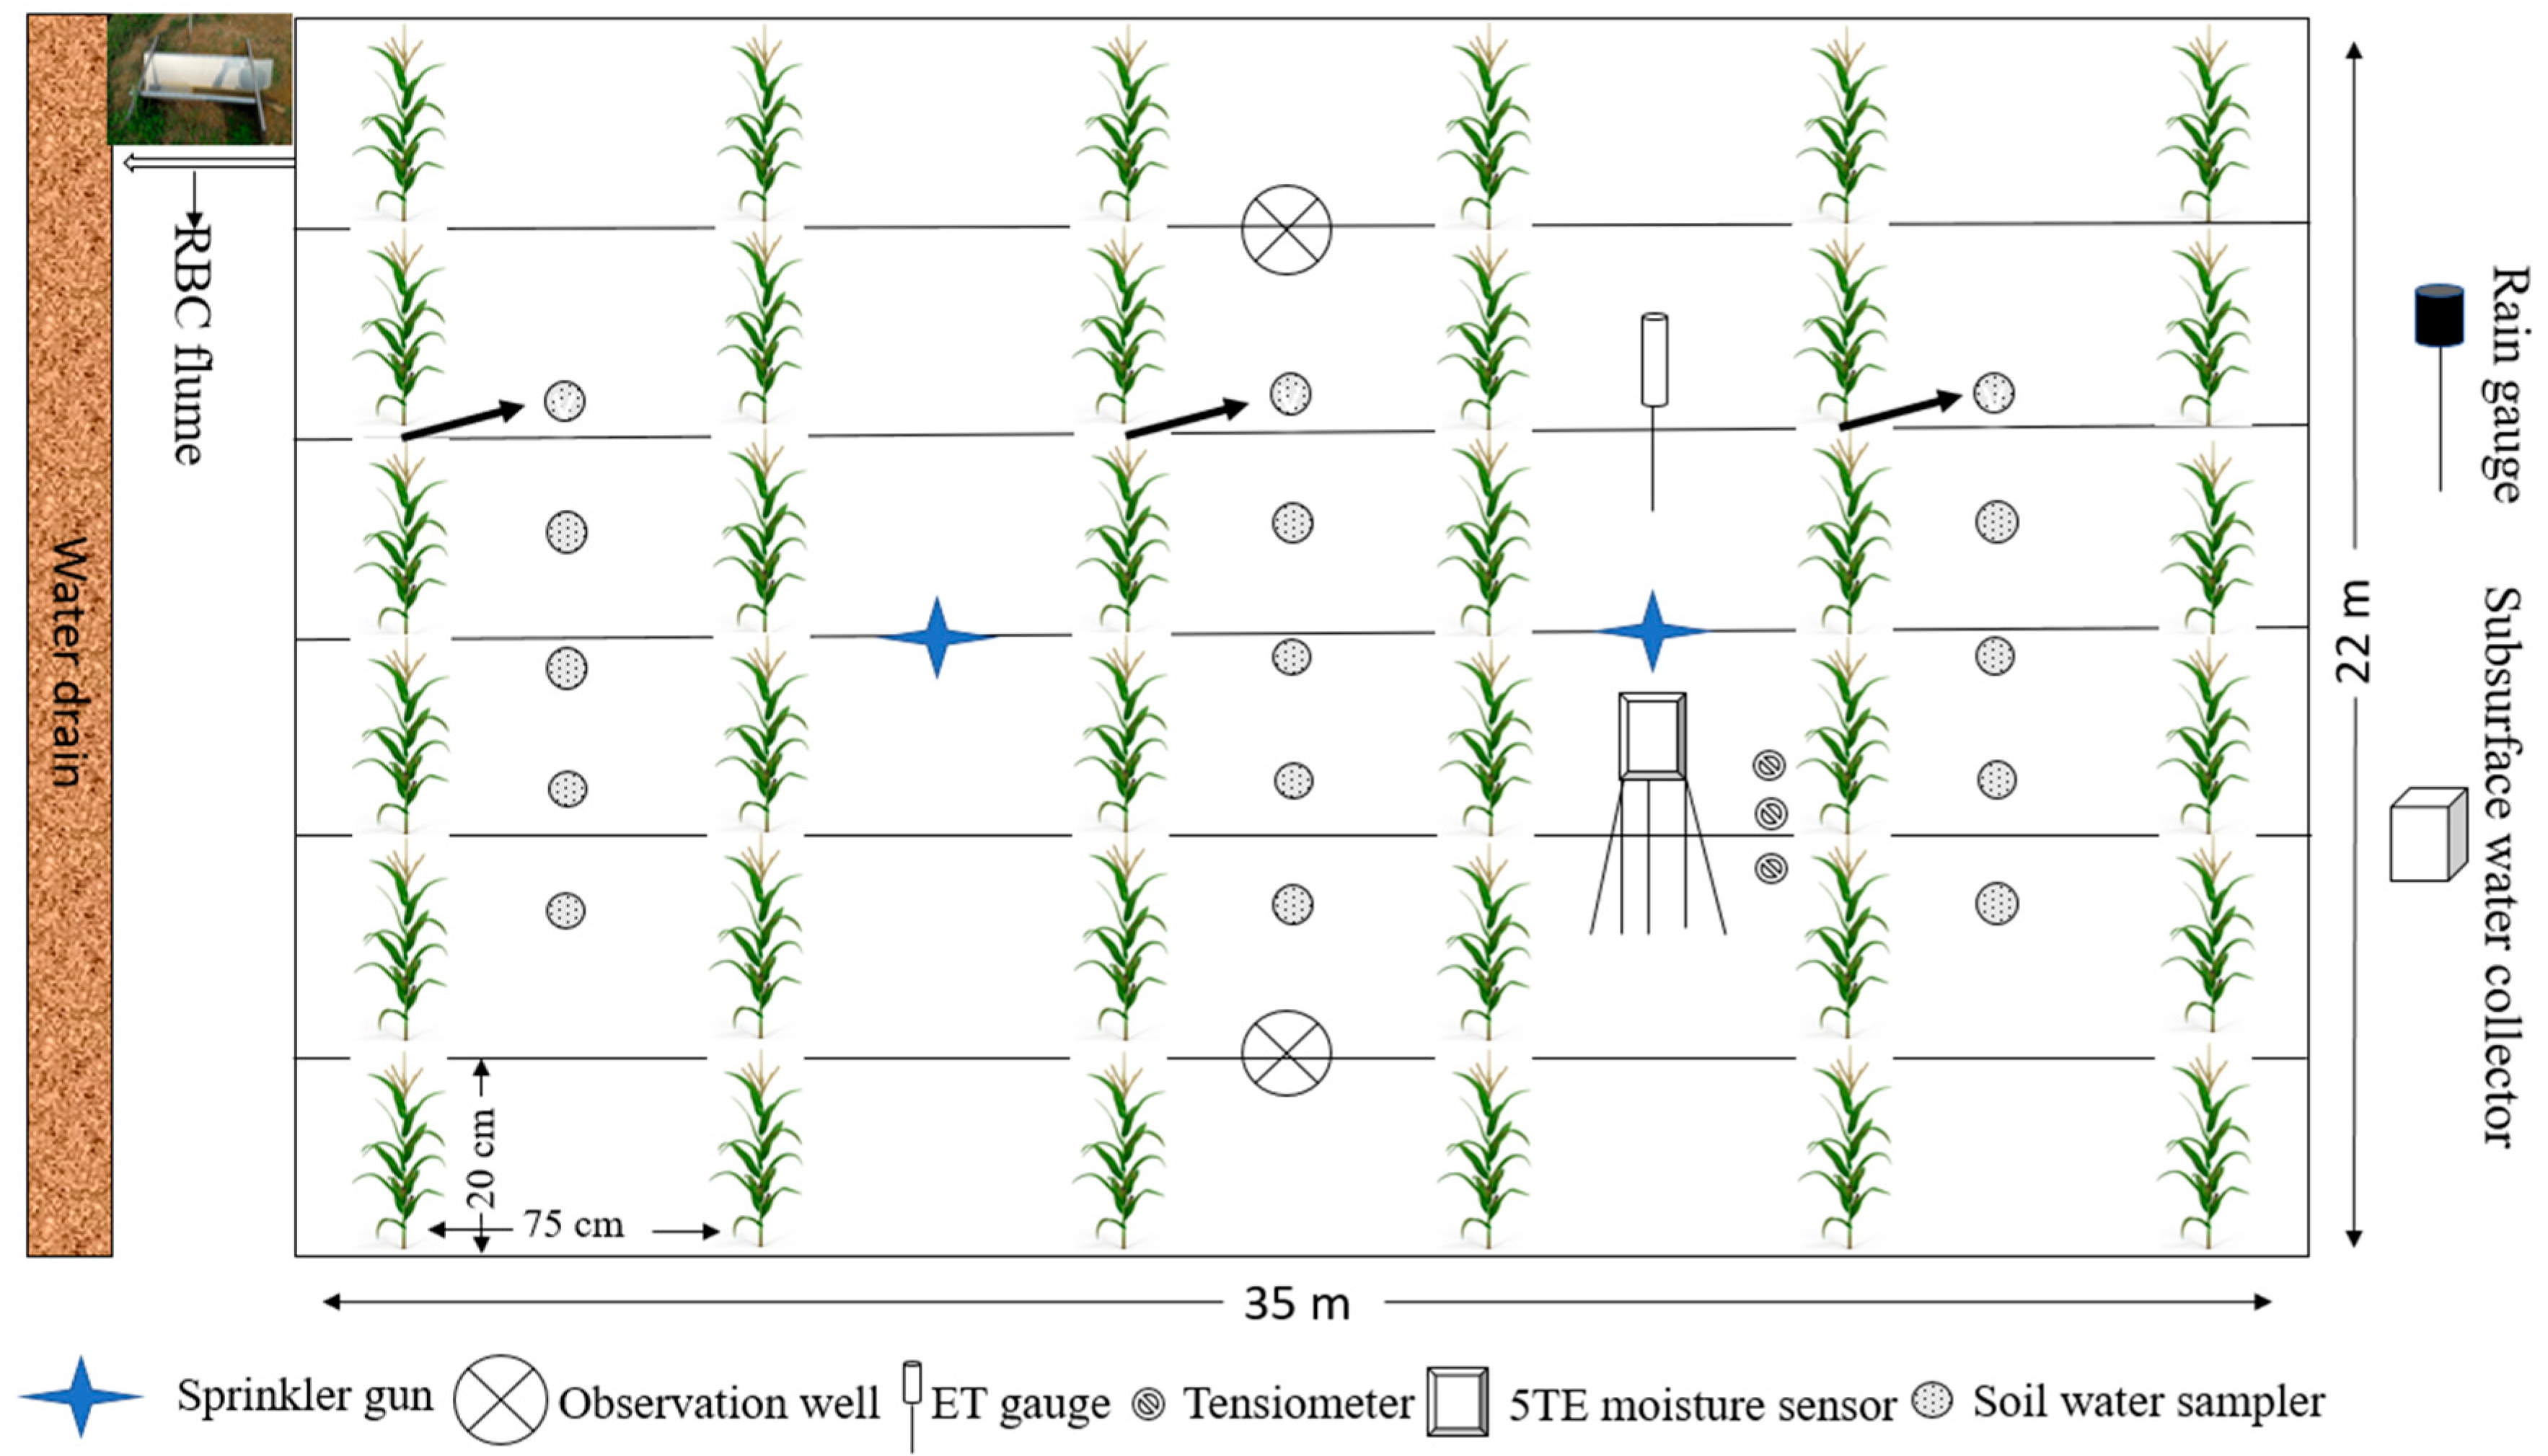
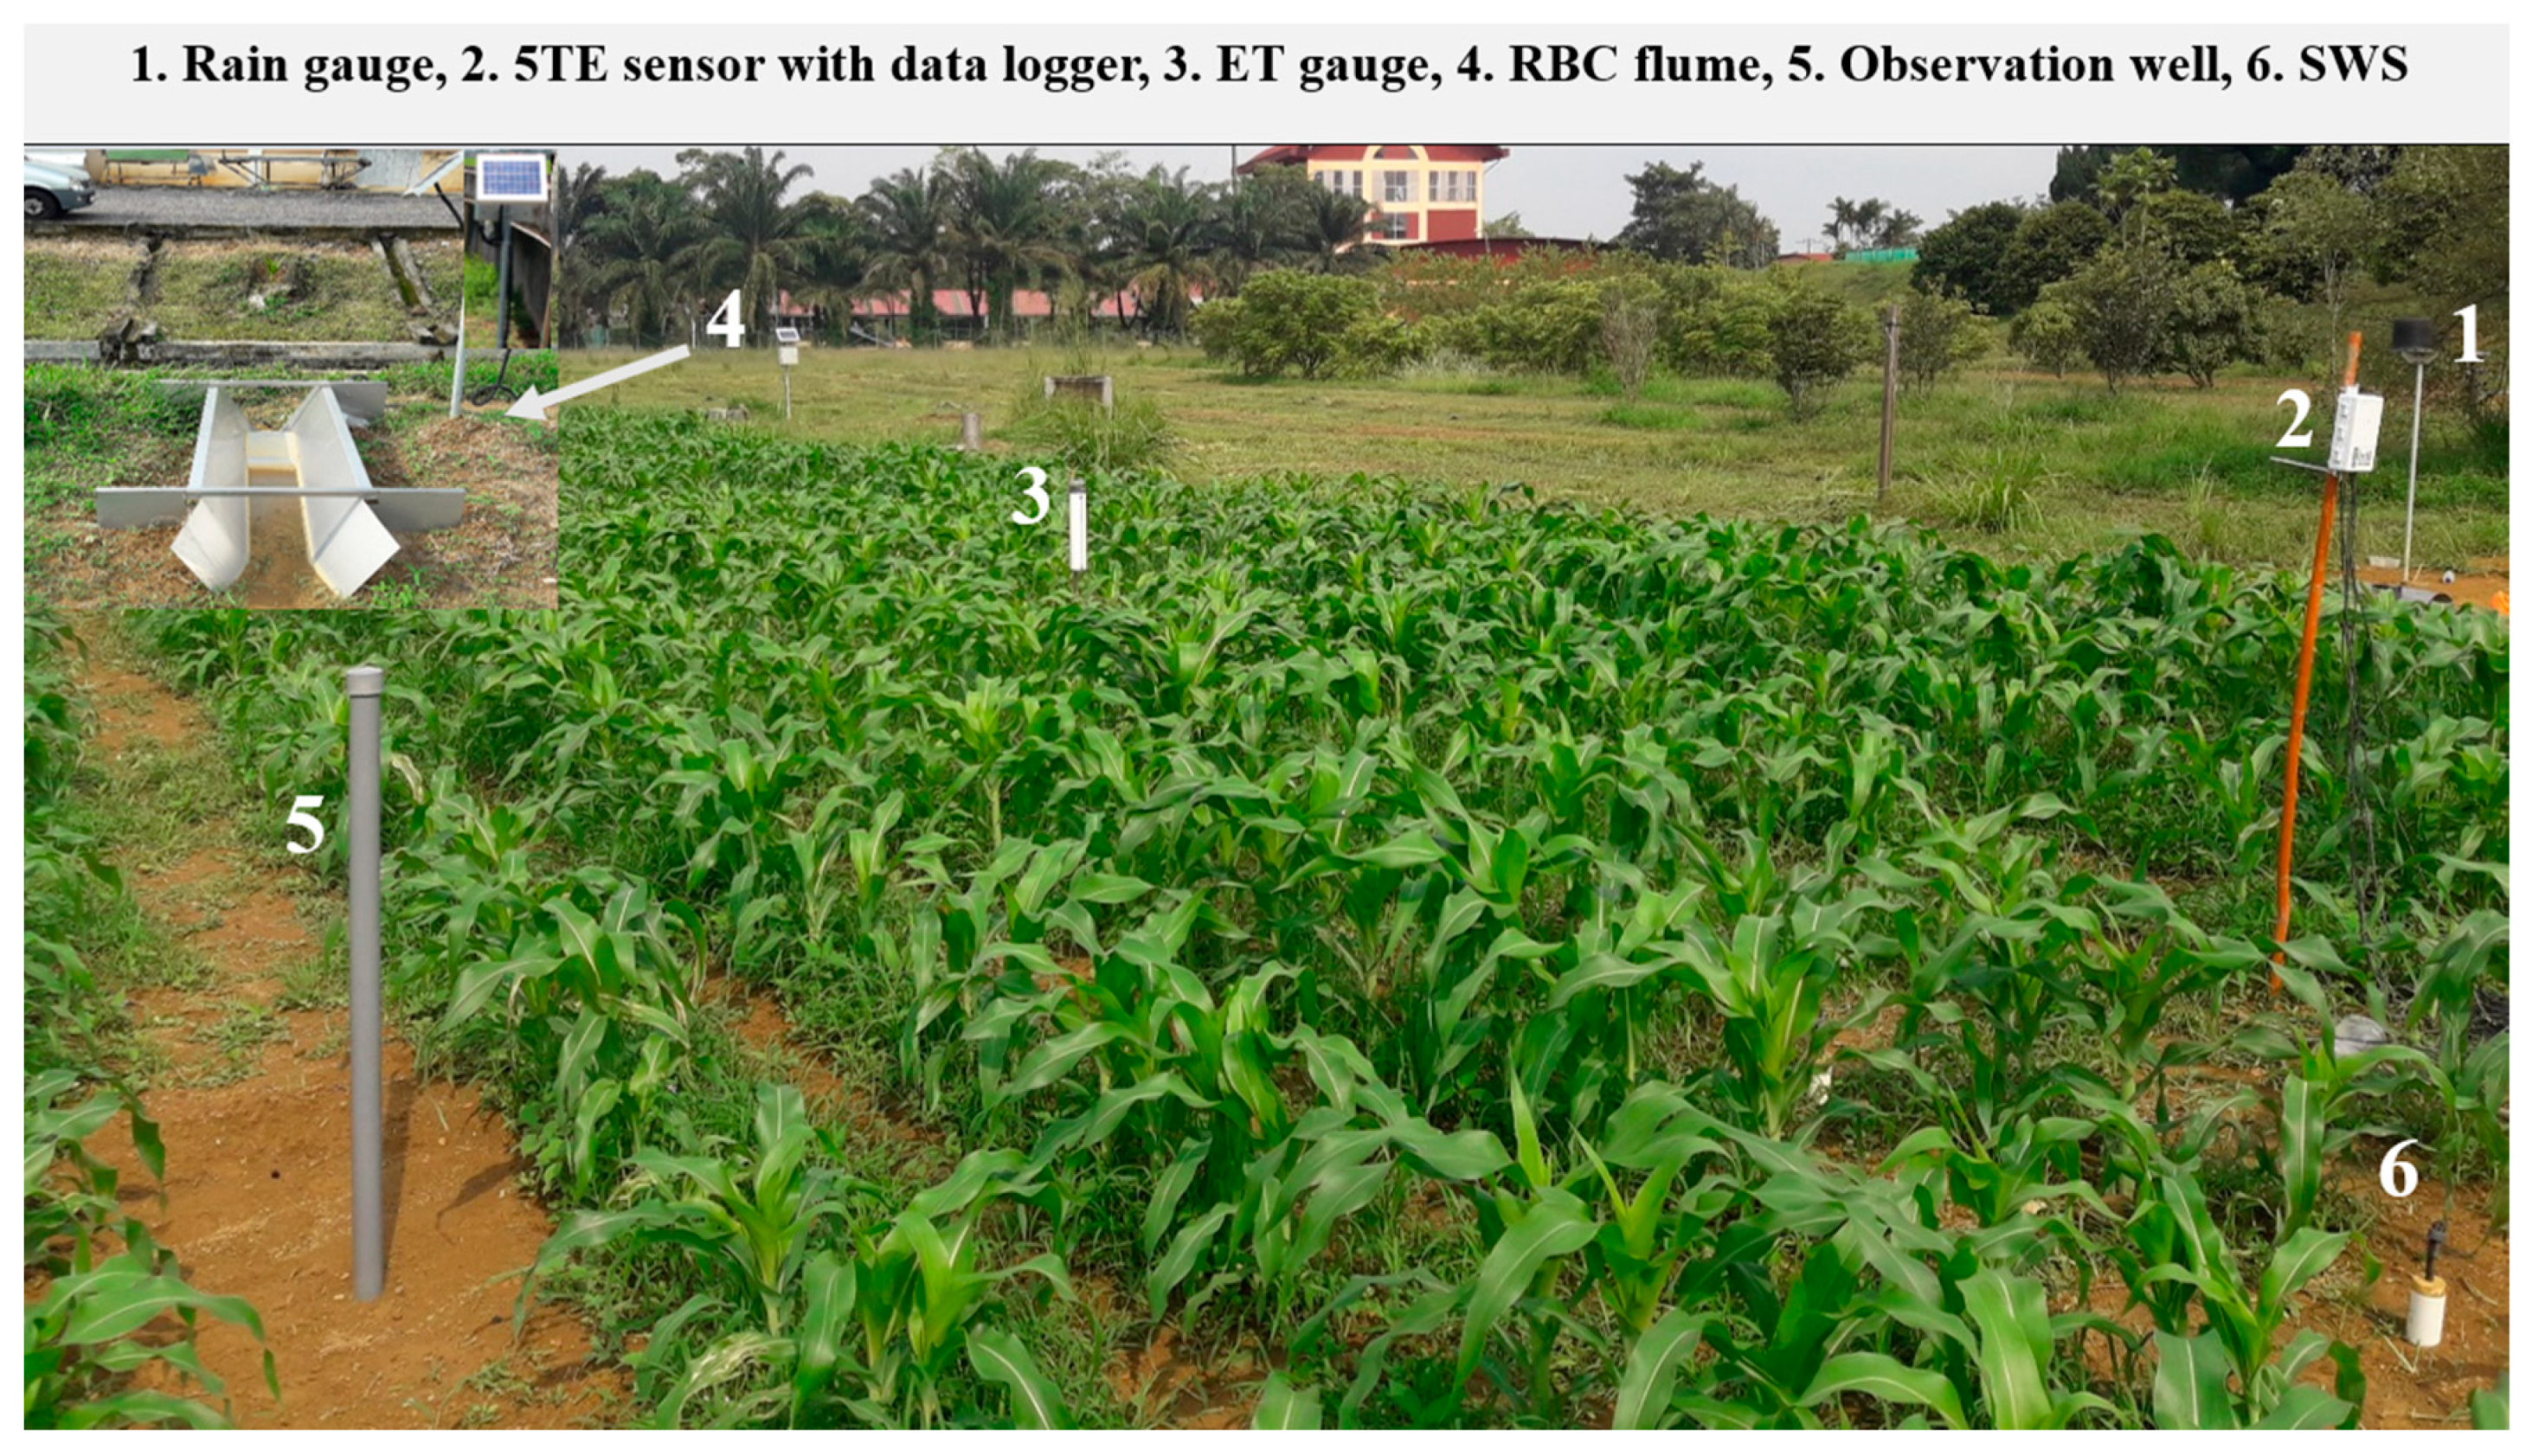
2.1. Field Experiments and Measurements

2.1.1. Site Description

The experiment site was located (2°59’ N latitude, 101°42’ E longitude) in the Selangor, Malaysia at the Malaysian Agricultural Research and Development Institute (MARDI). In 2018, the recorded total annual precipitation of the area was 3652 mm. The daily temperatures variation ranged from 21.6 °C to 36.3 °C. The mean monthly temperature during the first and the second season was 28.1 °C and 28.8 °C. Most of the rainfall occurs in the months from October to December. Indeed, it is relatively dry for February and March. The research work was carried out for two sweet corn growing seasons (February–May 2018 and September–November 2018). The soil layer was classified as clay throughout the sampling depth of 0–140 cm. The physical properties of the soil are presented in Table 1. The variety of sweet corn used for cultivation was ‘Hibridmas’.

2.1.2. Experimental Design
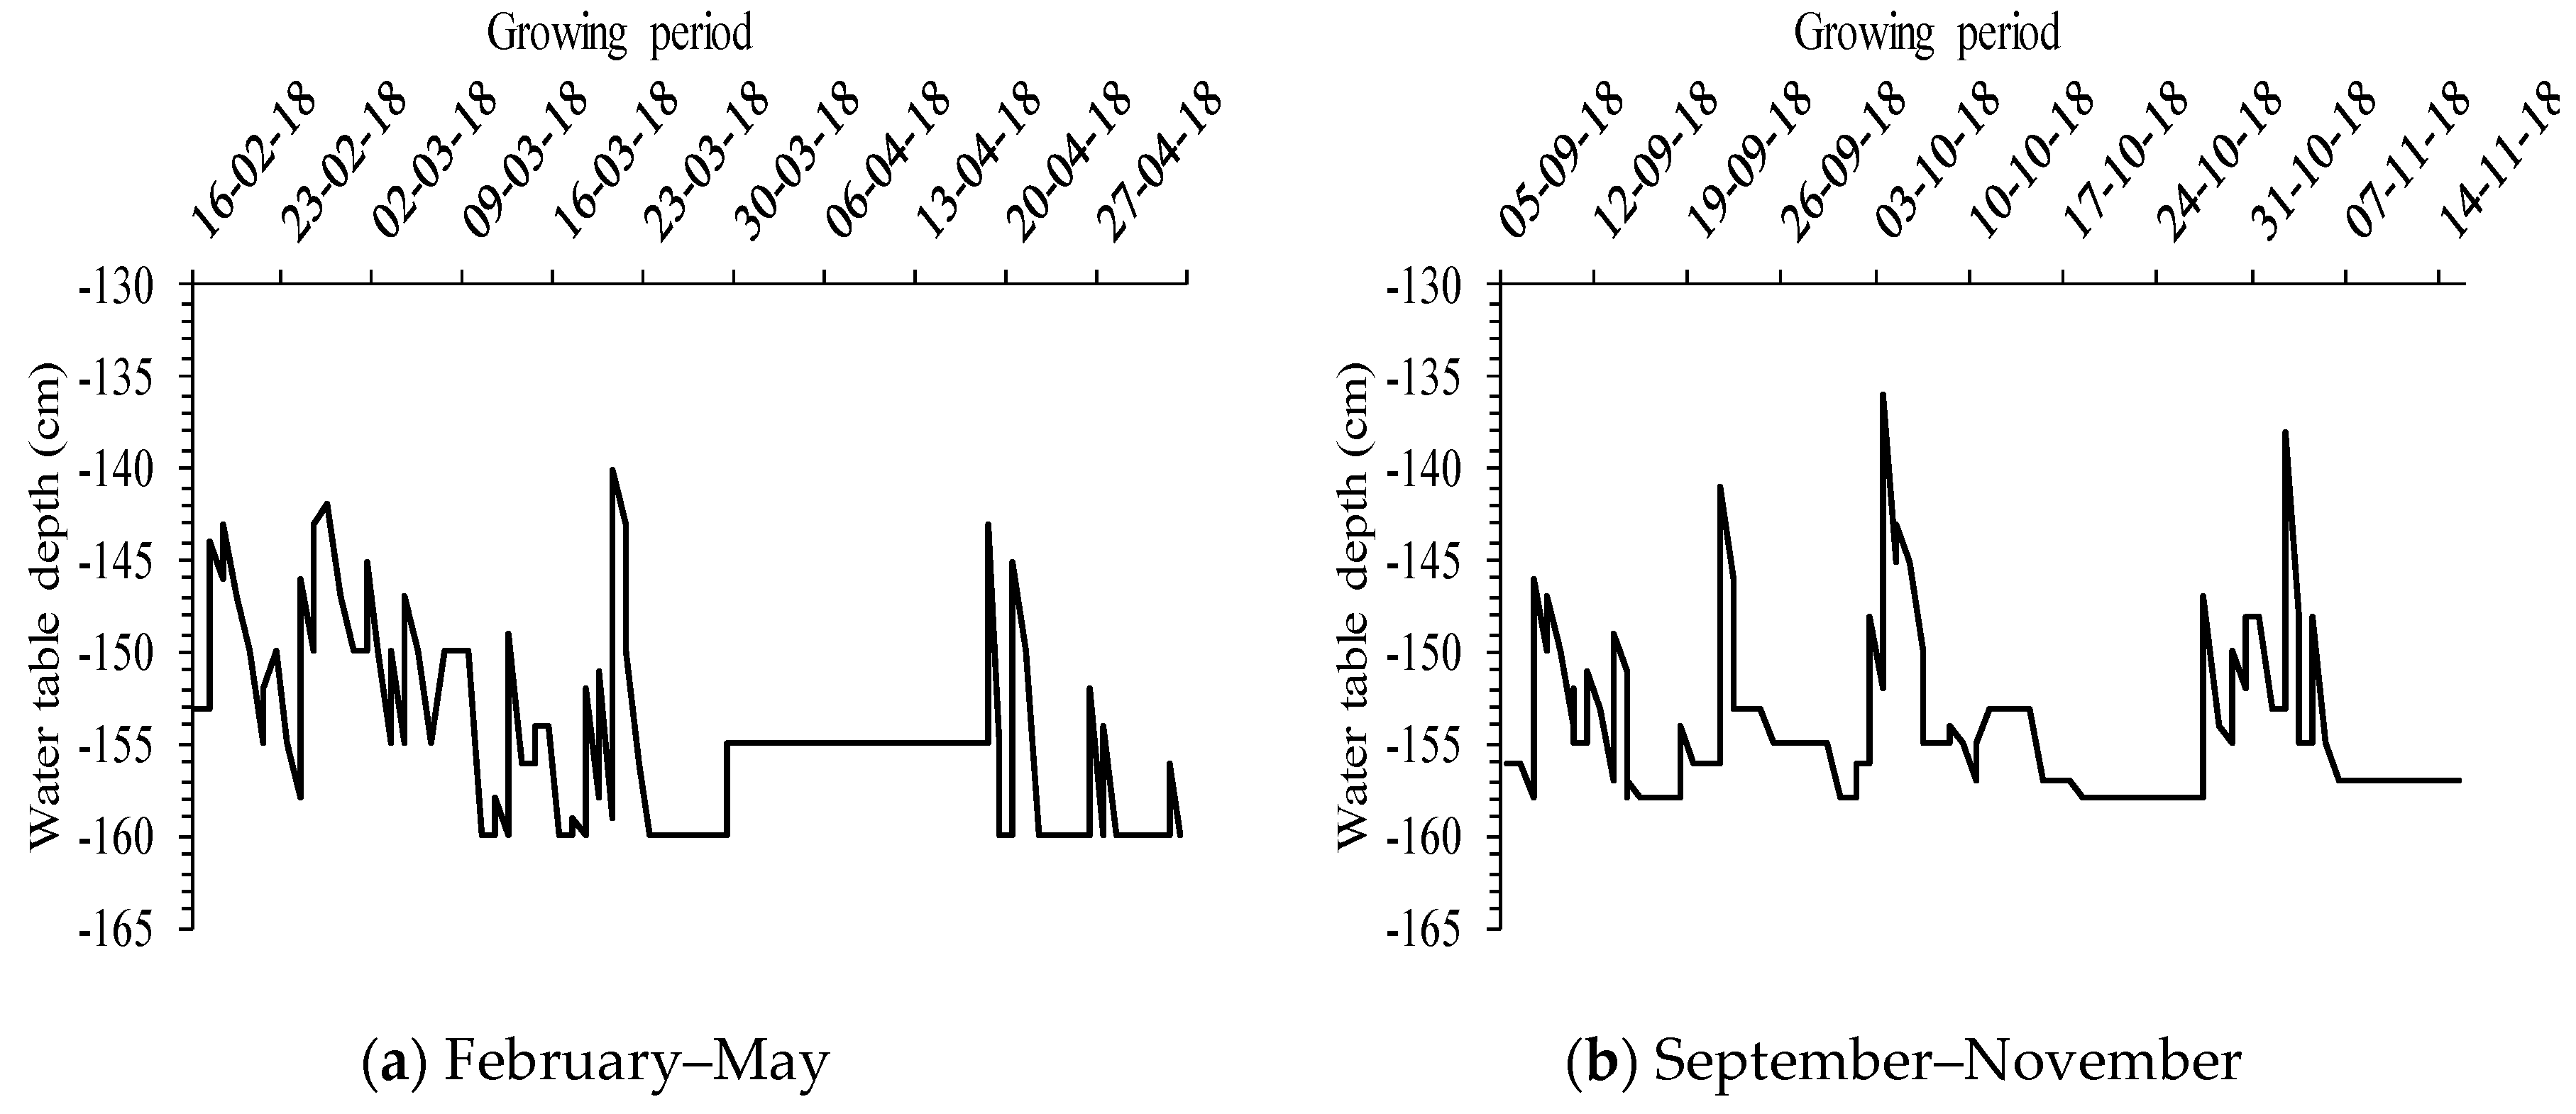
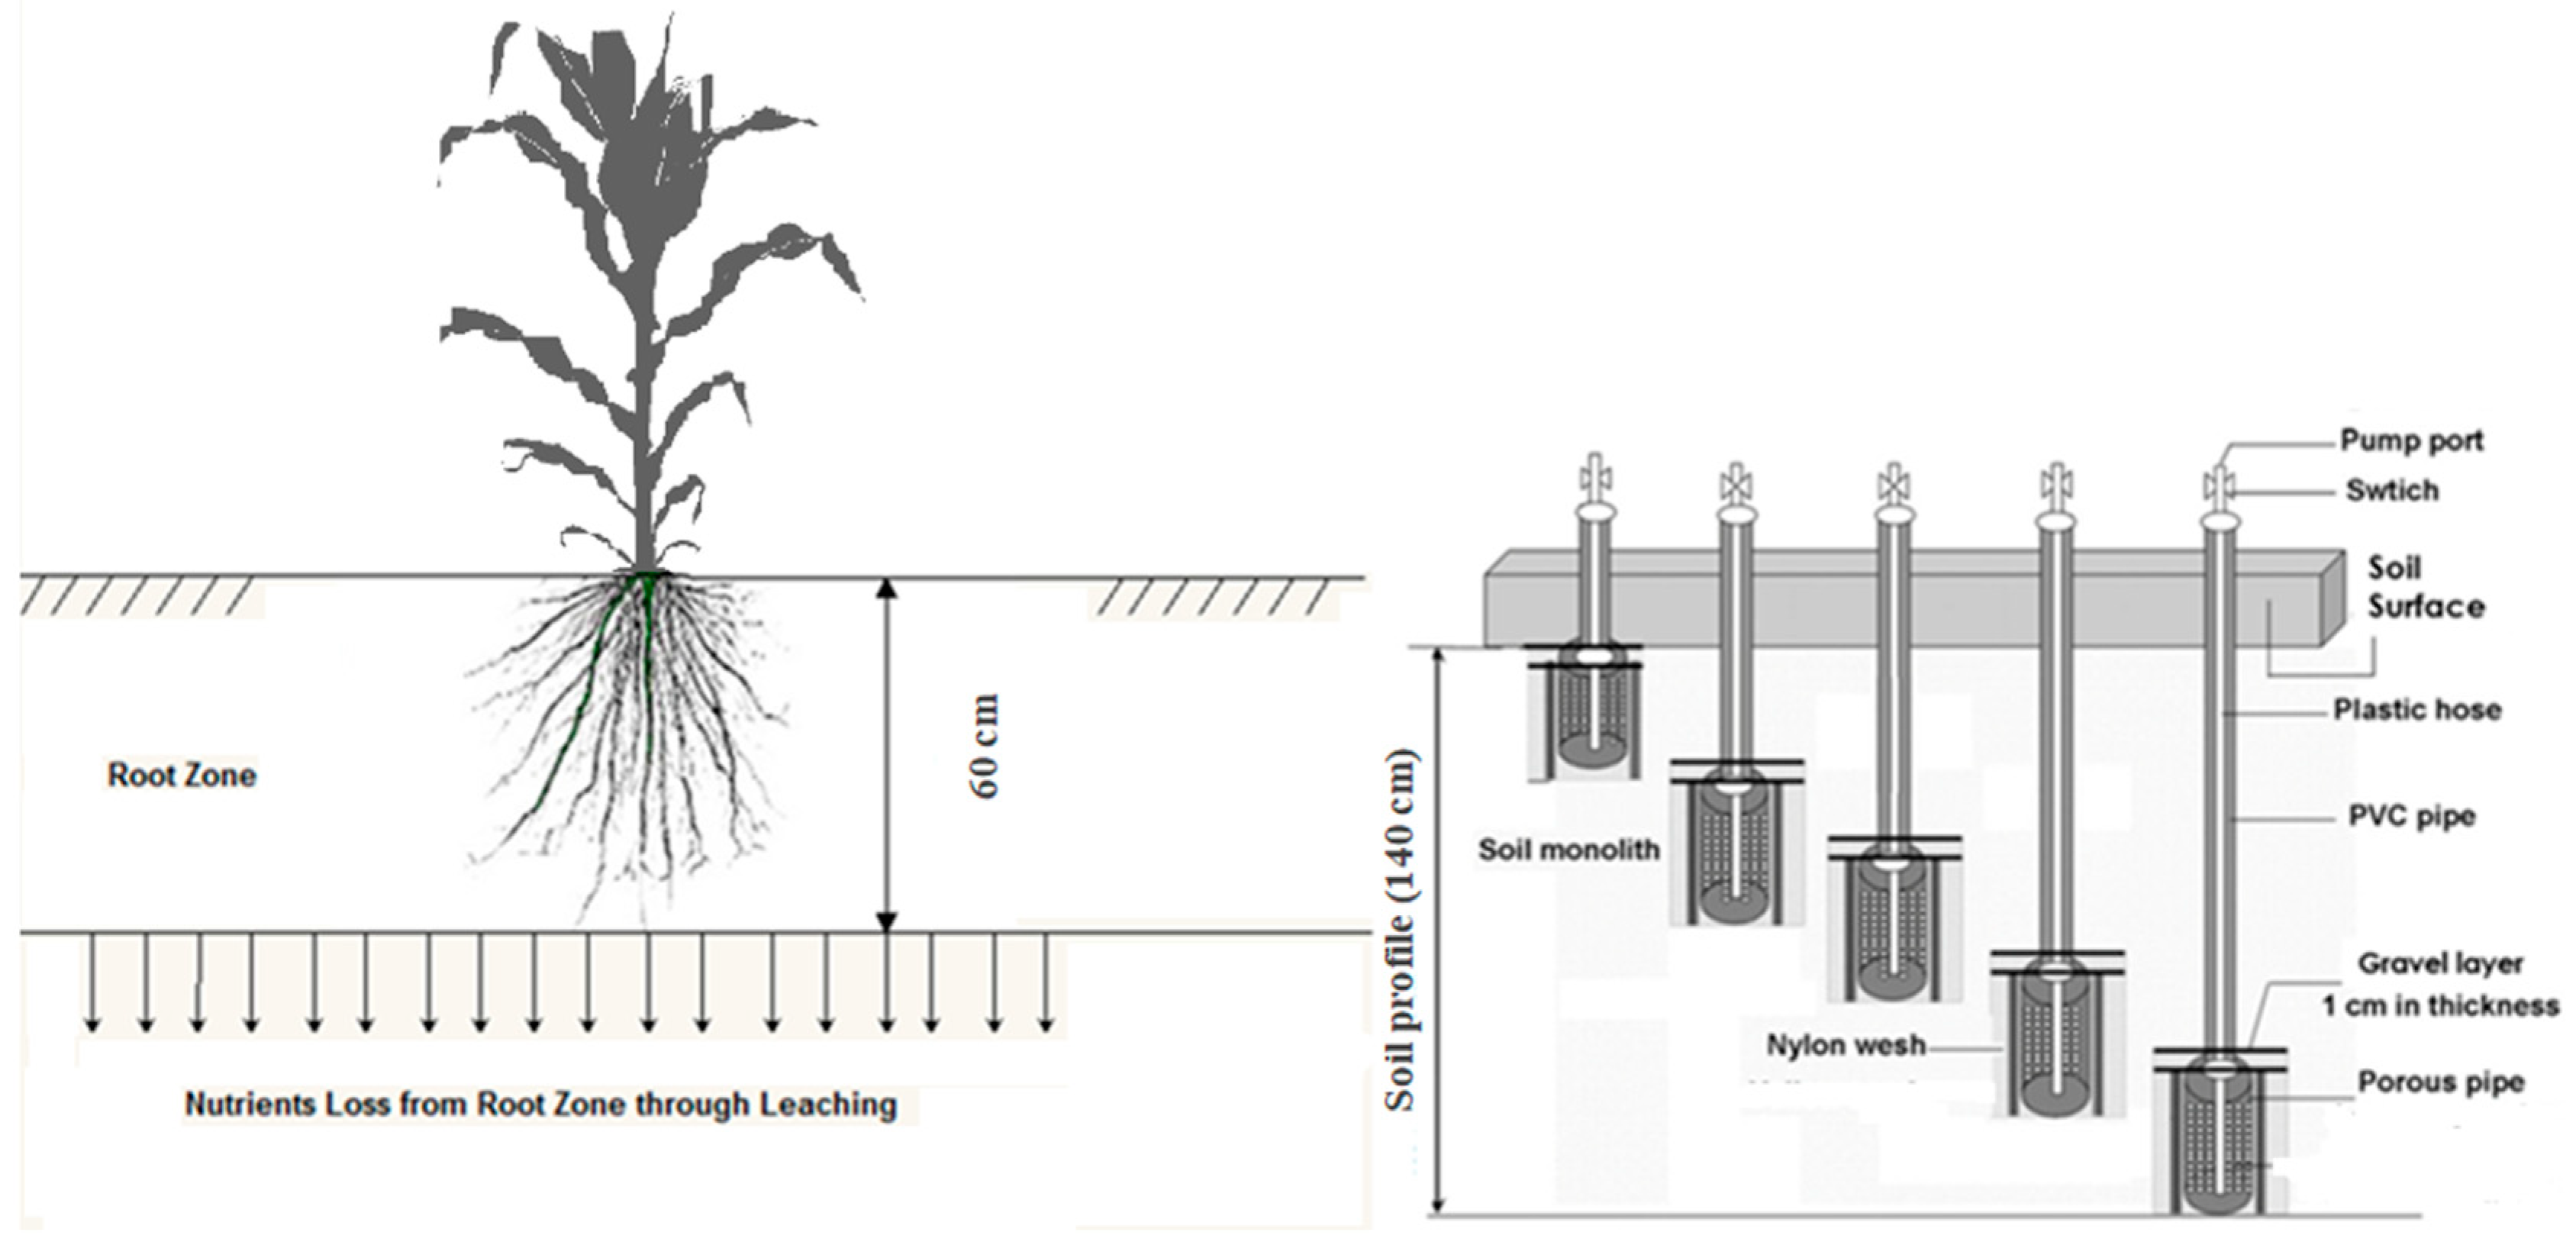
The experiment was carried out in 770 m2 (35 m × 22 m) plot in real field conditions. Sweet corn seeds ‘Hibridmas’ were cultivated during both seasons at 10 kg/ha on 16 February 2018 and 5 September 2018, respectively. The plant-plant (P × P) and row-row (R × R) space were maintained as 20 cm and 75 cm, respectively. The crop was harvested on 3 May (first season) and 15 November (second season). The sweet corn growing periods for the first and second seasons were 76 and 71 days, respectively. The total rainfall during the first and second seasons were 75.8 cm and 79.7 cm, respectively.
The fertilizer management was based on recommendations from MARDI. The amount of N applied during each season was 120 kg/ha. The fertilizer was applied in four applications. The basal fertilizer applied was a compound fertilizer (NPK green) which contains about 15% of N, phosphorus, and potassium. For the second and third applications, the fertilizer was applied in the form of Urea. The fourth application of N was applied in the form of NPK blue. The rates for second, third and fourth applications were 25, 25 and 10 kg·N·ha−1. The basal fertilizer was applied during land preparation and plowed within 5 cm of topsoil. The top dressing was applied manually along the plant rows uniformly. Details of agricultural activities are listed in Table 2.

2.1.3. Measurements

In the experimental field, rain-gauge, 5TE sensors with EM 50 data logger, ET-gauge, observation well, Parshall Flume RBC and soil water samplers were installed as shown in Figure 1 and Figure 2. Data-logging rain-gauge and ET-gauge were used to record rainfall and evapotranspiration. The water drainage as a result of runoff was rescored using Parshall Flume RBC with CR200X logger (SZ-CR200X/7070). The 5TE sensors along with EM 50 data logger were installed at 20, 40, 60, 80, and 140 cm depths to monitor soil water content. The climate data (i.e., temperature, humidity, and wind speed) were obtained from the adjacent meteorological station. The reference evapotranspiration ( E T 0 ) was computed through the Penman–Monteith equation [24] using available soil, crop, and climate data. Then, the crop evapotranspiration ( E T c ) was calculated as a product of the reference evapotranspiration ( E T 0 ) and the crop coefficient ( K c ) under normal conditions [24]. The Kc values for the early, development, mid and late stages of sweet corn were taken as 0.4, 0.8, 1.15 and 1, respectively [25]. Observation wells were installed to monitor the groundwater table. The water table fluctuated around 150 cm during rainfall as shown in Figure 3.
During the crop growing season, water samples of surface runoff were collected when rainfall events occur to predict the nutrient losses from the field. Nutrients loss due to runoff was calculated by multiplying the values of NH4+-N and NO3-N with water flux. Soil water samplers (SWS) that consist of porous ceramic cups, were used to collect soil solutions every week throughout the growing season. The SWS were installed at 20, 40, 60, 80 140 cm depths in plant rows (Figure 4) and evacuated to about 80 kPa with the help of a vacuum pump with a tensiometer to get a sample every time. Finally, the concentration of NH4+-N and NO3-N were analyzed following Standard and Industrial Research Institute of Malaysia (SIRIM) procedure at United Plantations Laboratory, Teluk Intan, Perak. The cumulative N leaching at 60 cm depth was calculated by multiplying N concentration with corresponding water fluxes at 60 cm depth and integrated to the entire growing period.
The nutrient losses were calculated from the equation given as [26].
Subsurface losses (kg·ha−1) = 0.1 × C × DP
where, C is solute concentration in (mg/L) and DP is deep percolation (cm).
For plant N uptake analysis plant samples were taken on the later stage of the crop (56 day of the plantation) and the harvest day. The straw, grain, and roots of sampled plants were oven-dried at 70 °C. After that, the samples were weighed, ground and analyzed. Total N (TN) content was determined by CNS Trumac analyzer. The Cumulative N uptake was determined by multiplying TN concentration of the straw, grain, and roots of sweet corn with their respective dry weight.

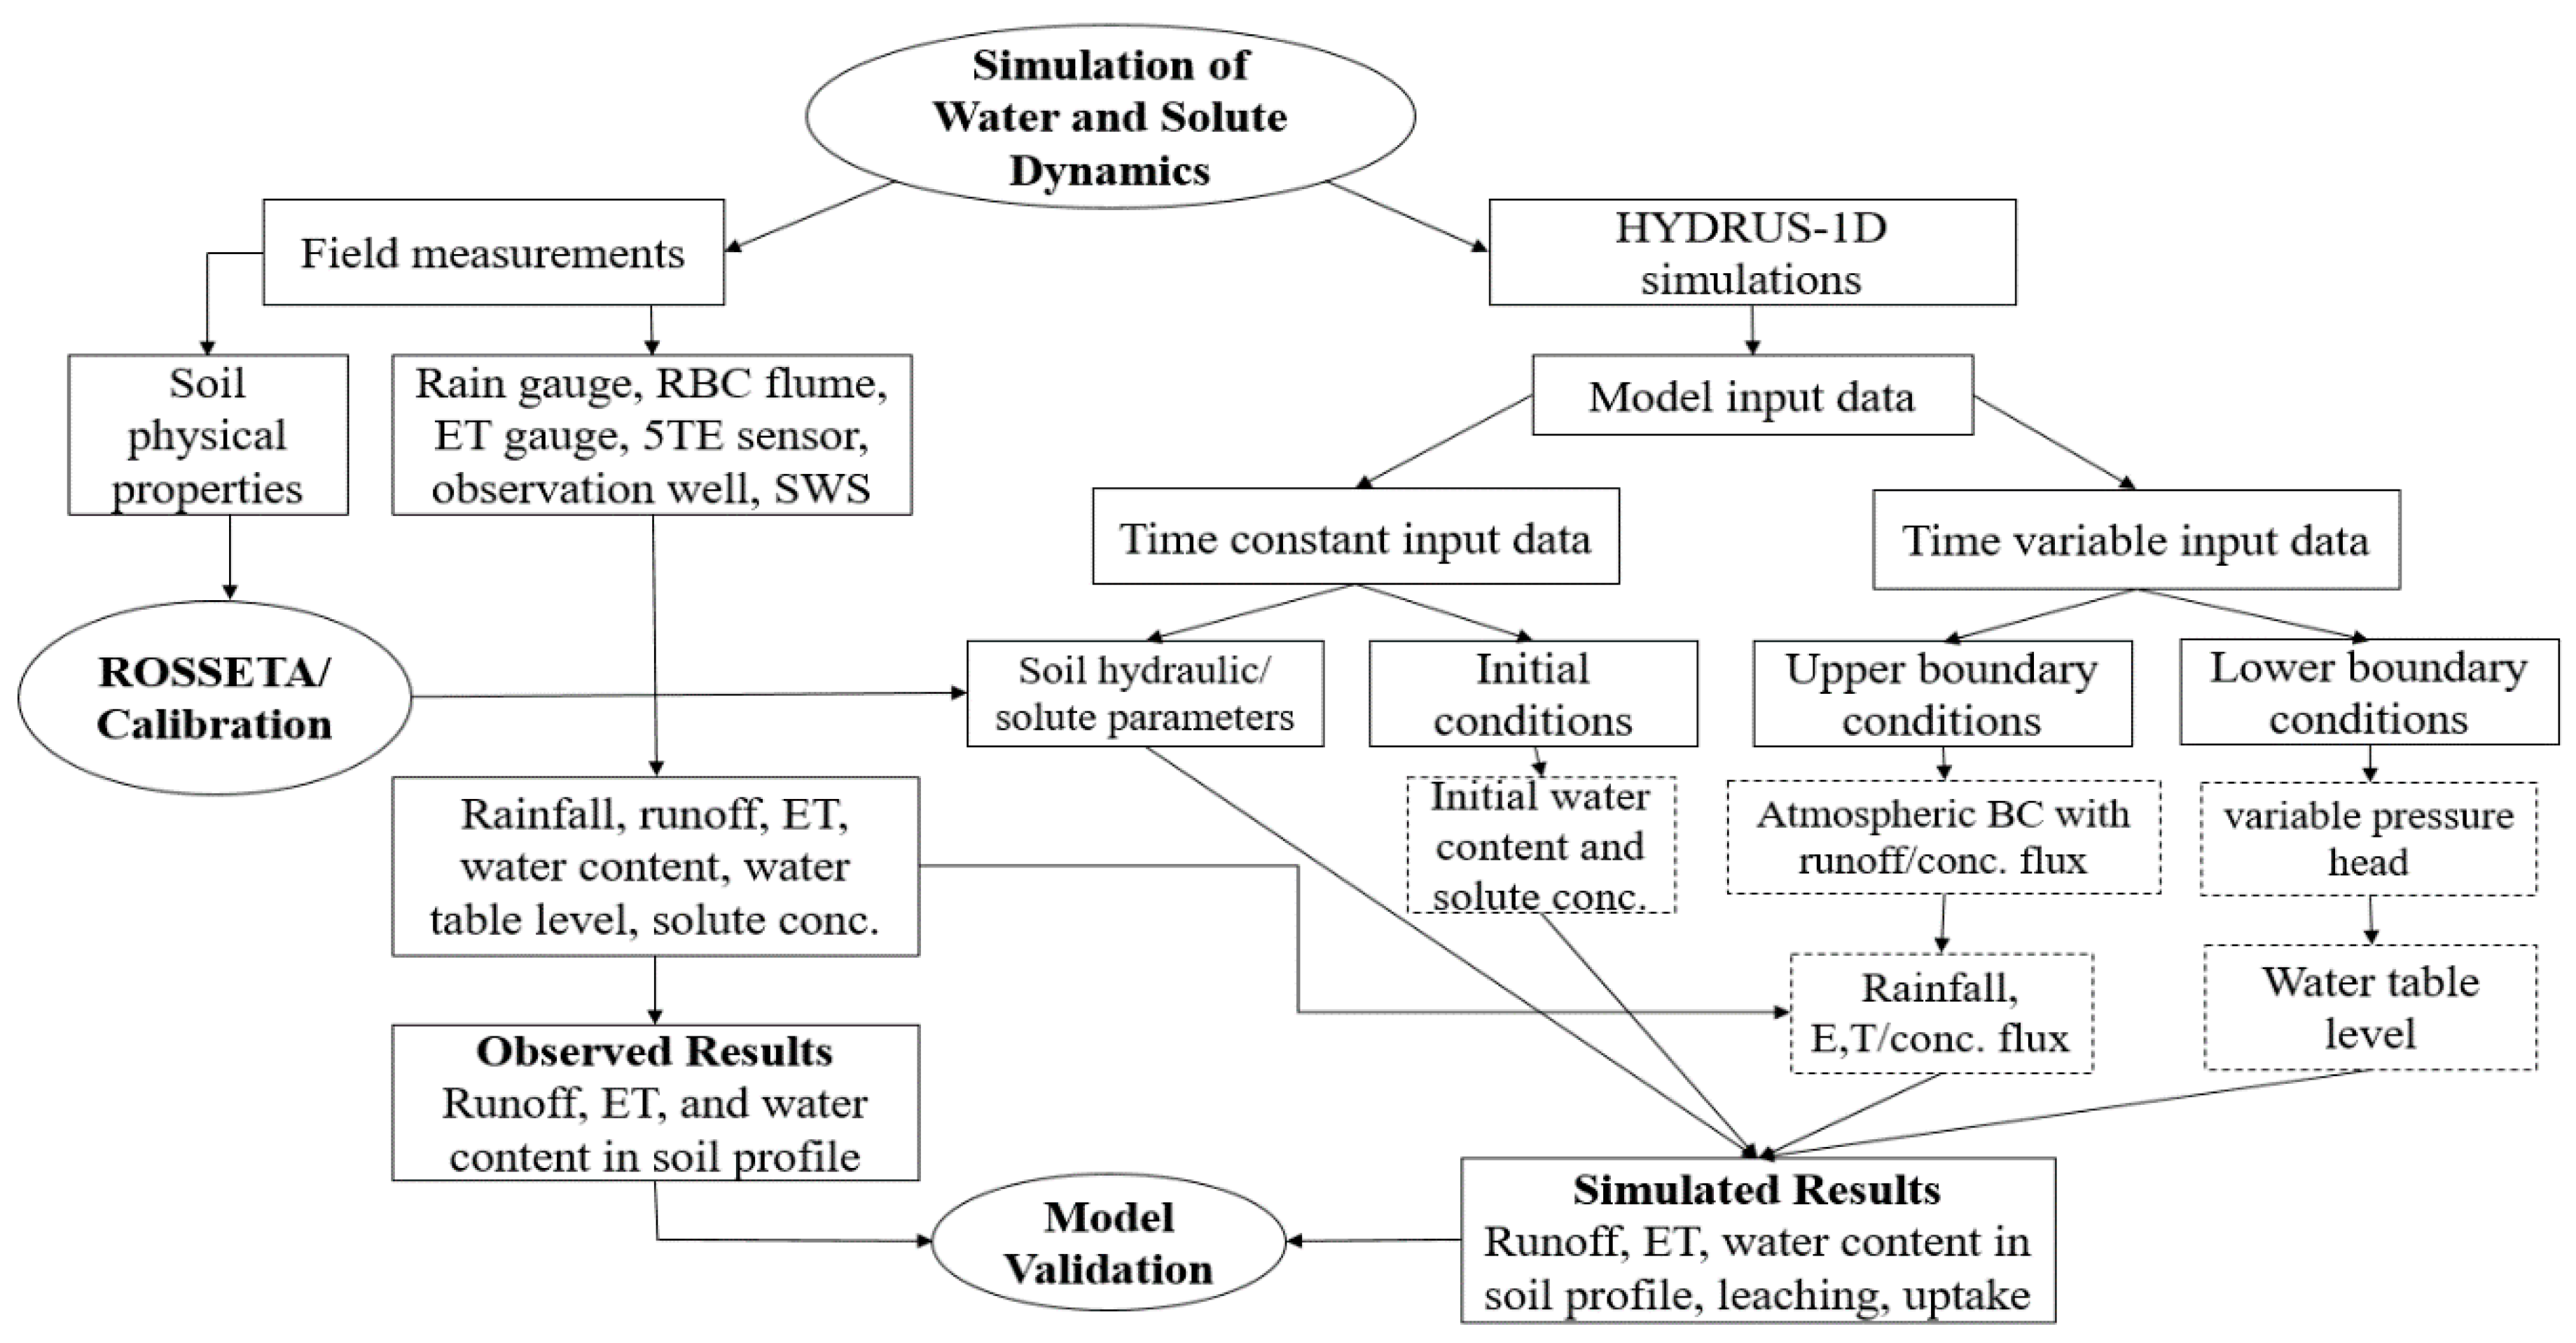
2.2. HYDRUS-ID Model

2.2.1. Model Description

The one-dimensional numerical model HYDRUS-1D [11] was used to simulate soil water and solute dynamics in the sweet corn field. The model is capable of simultaneously considering the transport of multiple solutes that are subject to first-order degradation. The governing transport equations were solved using a Galerkin-type linear finite element scheme.
The partial differential equations for one-dimensional advective-dispersive N transport for a first-order chain reaction in variably saturated media is given as [12].
Total Nitrogen (TN):
θ C 1 t = z ( θ D 1 w C 1 z ) q C 1 z μ w , 1 θ C 1
Ammonium nitrate (NH4+-N):
θ C 2 t + ρ S 2 t + a v g 2 t = z ( θ D 2 w C 2 z ) + z ( a ν D 2 g g 2 z ) q C 2 z μ w , 2 θ C 2 + μ w , 1 θ C 1 + γ s , 2 ρ r a , 2
Nitrate (NO3-N):
θ C 3 t = z ( θ D 3 w C 3 z ) q C 3 z μ w , 3 θ C 3 + μ w , 2 θ C 2 r a , 3
where, C is the solute concentration in liquid phase (mg·L−1), S is the solute concentration in the solid phase (mg·g−1), g is the solute concentration in gas phase (mg·g−1), ρ is the dry bulk density (g·cm−3), θ is the volumetric water content (cm3cm−3), q is the volumetric flux density (cm·day−1), μ w is the first-order rate constant for solute in the liquid phase (day−1), μ w is the first-order rate constant for chain reaction (day−1), γ s is a zero-order rate constant in the solid phase (day−1), D w is the dispersion coefficient for liquid phase (cm2·day−1), D g is the dispersion coefficient for gas phase (cm2·day−1), r a is the root nutrient uptake. The subscripts 1,2 and 3 represents N species urea, NH4+-N and NO3-N, respectively. A linear Equation (5) describes the adsorption isotherm relating S 2 and C 2 .
S 2 = k d , 2 C 2
where k d , 2 is the distribution coefficient for NH4+-N (L·mg−1).
The N transformation processes considered here include; hydrolysis of N species to NH4+-N, nitrification of NH4+-N to NO3-N, denitrification of NO3-N to N2/N2O, and root uptake of NH4+-N and NO3N, where; hydrolysis, nitrification, and denitrification were considered as first-order reactions [27].The denitrification process was ignored in the study. The details of the simulation process and model description are presented in the flow chart (Figure 5).

2.2.2. Solute Transport and Reaction Parameters

N species, ammonium (NH4+-N) and nitrate (NO3-N) were considered for simulations. N and NO3-N were considered to be present in the dissolved phase. While ammonium was assumed to be present in both adsorb and dissolved phases. Therefore, the distribution coefficient ( k d = 0 cm3·g−1) for N and NO3-N. For NH4+-N, k d value was taken as 1.5 cm3·g−1 [28]. The first-order decay constant μ w for a chain reaction was set to 0.38 day−1 [27]. The nitrification rate coefficient was set to 0.02. The value is in the reported range [29].

2.2.3. Initial and Boundary Conditions

For water flow, the initial conditions were defined using initial soil water content. The upper and lower boundary conditions were defined as the atmosphere boundary condition (BC) with runoff and variable pressure head, respectively. The initial conditions for solute transport were defined in terms of N concentration in soil water, calculated from basal fertiliser and initial water content assuming that fertiliser was mixed in the top 5 cm of soil. The boundary conditions were set to concentration flux BC for simulation of NH4+-N and NO3-N.

2.2.4. Root Distribution and N Uptake

The root depth was set to 60 cm. The root density was assumed to decline linearly from surface to 60 cm depth. Root depth estimation is based on field measurement. Ramos, et al. [22] made a similar assumption. According to Zhou, et al. [30] the 95% of maize roots distribute in the top 60 cm. Chen, et al. [31] considered root zone depth as 70 cm. Root uptake was assumed to be passive for both NH4+-N and NO3-N [22,27].

2.2.5. Model Evaluation

The statistical procedure was performed to evaluate the agreement between observed and simulated data. The coefficient of determination R2, modelling efficiency (EF) and root mean square error (RMSE) used for this purpose are given as:
Coefficient of determination
R 2 = { i = 1 n ( O i O ¯ ) ( P i P ¯ ) [ i = 1 n ( O i O ¯ ) 2 ] 0.5 [ i = 1 n ( P i P ¯ ) 2 ] 0.5 } 2
Root Mean Square Error
R M S E = i = 1 n ( O i P i ) 2 n
where   P i are predicted values; P ¯ is mean of predicted values; O are observed values; O ¯ is mean of observed values. The optimum value of R 2 is 1 while for R M S E it is 0.

3. Results and Discussion

3.1. Model Calibration and Validation

For the calibration and validation purposes the data sets of the first and second seasons were used, respectively. The calibration of water flow related parameters has been discussed before [32], only the calibration of N transformation parameters is discussed here. The observed NO3-N and NH4+-N concentrations at 20, 40, 60, 80, and 140 cm depths during the first season were used to calibrate the solute transport and reaction parameters. The calibrated transport and reaction parameters were then used to simulate solute flux for the second season, for model validation. The average values of the goodness of fit indicators R2 and RMSE for NO3-N, and NH4+-N are listed in Table 3. The goodness of fit indicators is within the range of values reported by different researchers [12,22,33,34].

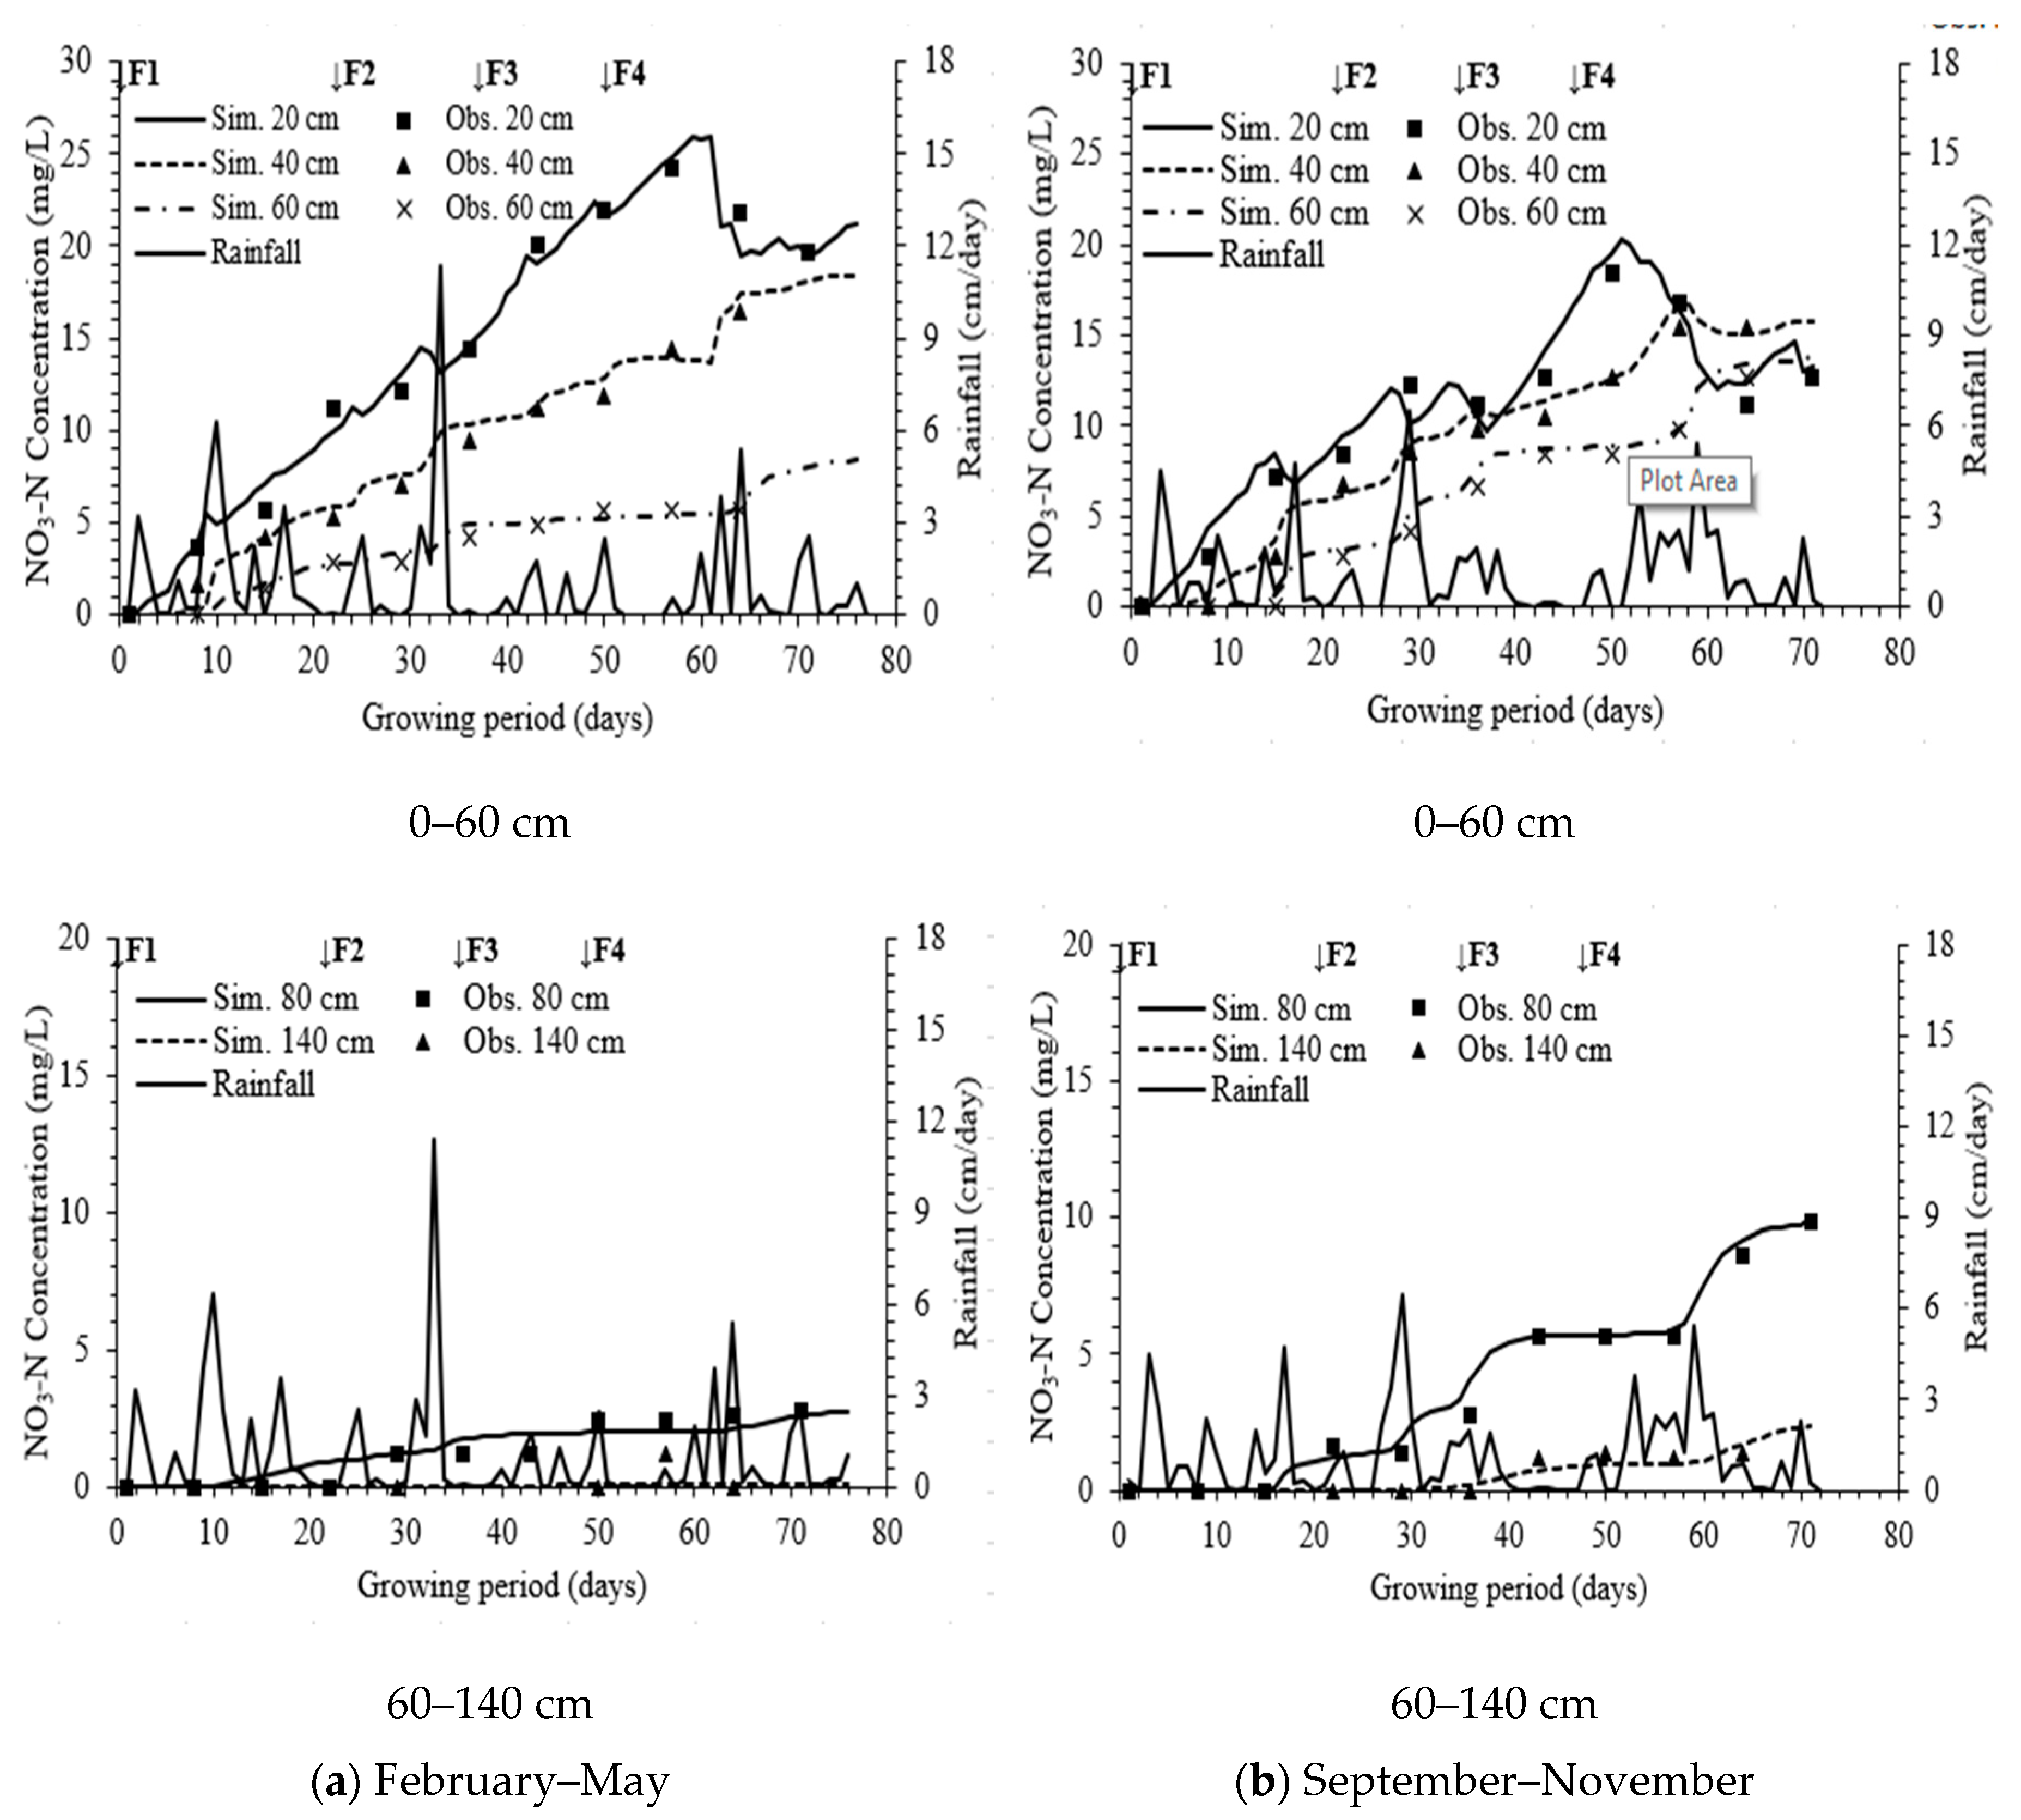
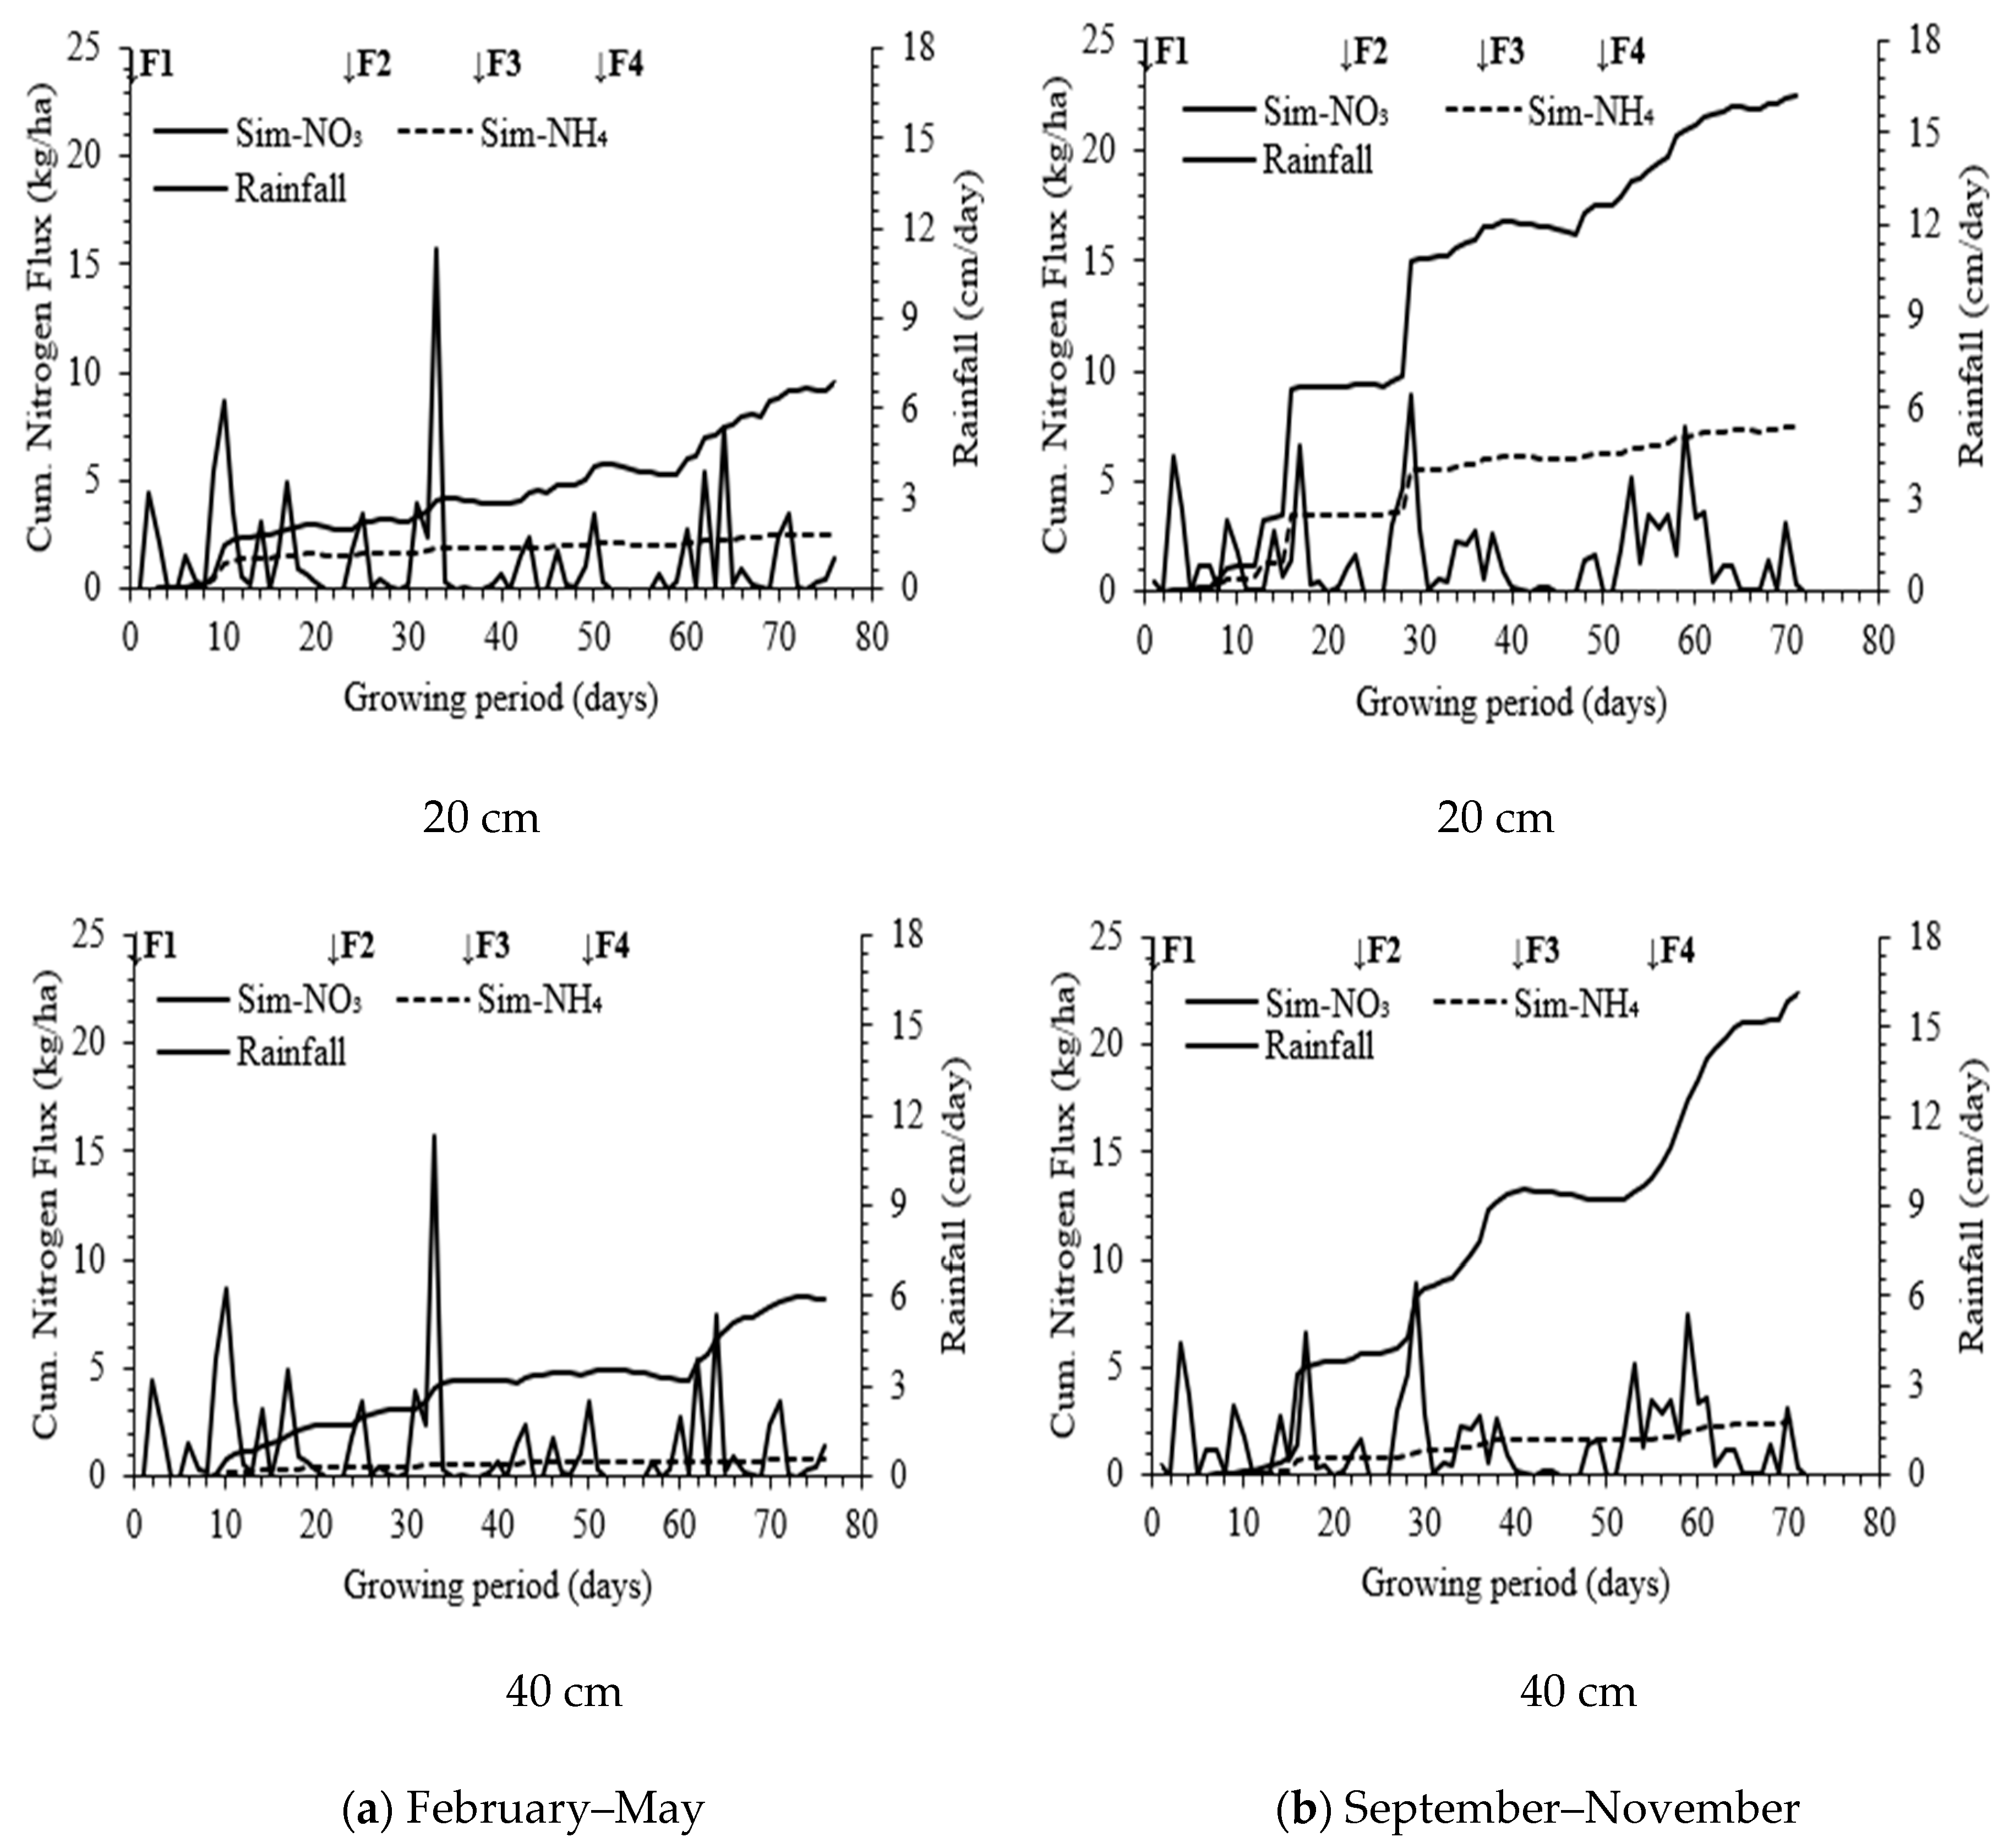
3.2. Nitrogen Concentrations in the Soil Profile

Figure 6 presents the comparison between simulated and observed concentrations of NO3-N in soil profile within the root zone (0–60 cm) during two seasons of the sweet corn. The maximum simulated NO3-N concentrations in the root zone during the first and second seasons of sweet corn were recorded as 26 mg/L and 20.2 mg/L, respectively. Whereas the maximum observed NO3-N concentrations for the first season and second season of field crop in root zone were 24.2 mg/L and 18.4 mg/L. The maximum concentrations were observed in topsoil (20 cm). The difference in maximum value between two seasons is regular rainfall events that occurred during the second season. The leaching rainwater carried the dissolved NO3-N to deeper soil depth quicker than the first season where the resident time NO3-N was higher. This reflects in high NO3-N concentrations at 60 cm depth in the second season. Relatively longer NO3-N resident time in topsoil is supported by the fact that concentrations at 20 cm tend to increase with time till the 61st day of growth while in the second season it increased till 51st day. The fertilizer application timing during the growth period was the same for both seasons. As the initial input value was defined as N concentration in a chain reaction, the minimum NO3-N concentration value for both seasons was 0 mg/L. The simulated and observed NO3-N concentrations in soil profile below the root zone (60–140 cm) are also presented in Figure 6. The NO3-N concentration at 140 cm depth is negligible during the first season as compared to the second season. Figure 7 presents the NH4+-N concentration within the root zone. The results imply that NH4+-N remained within the root zone. No concentrations of NH4+-N have been recorded below the root zone. Overall both NO3-N and NH4+-N concentrations were higher in shallower depths (root zone) due to direct contact with fertiliser applied surface.

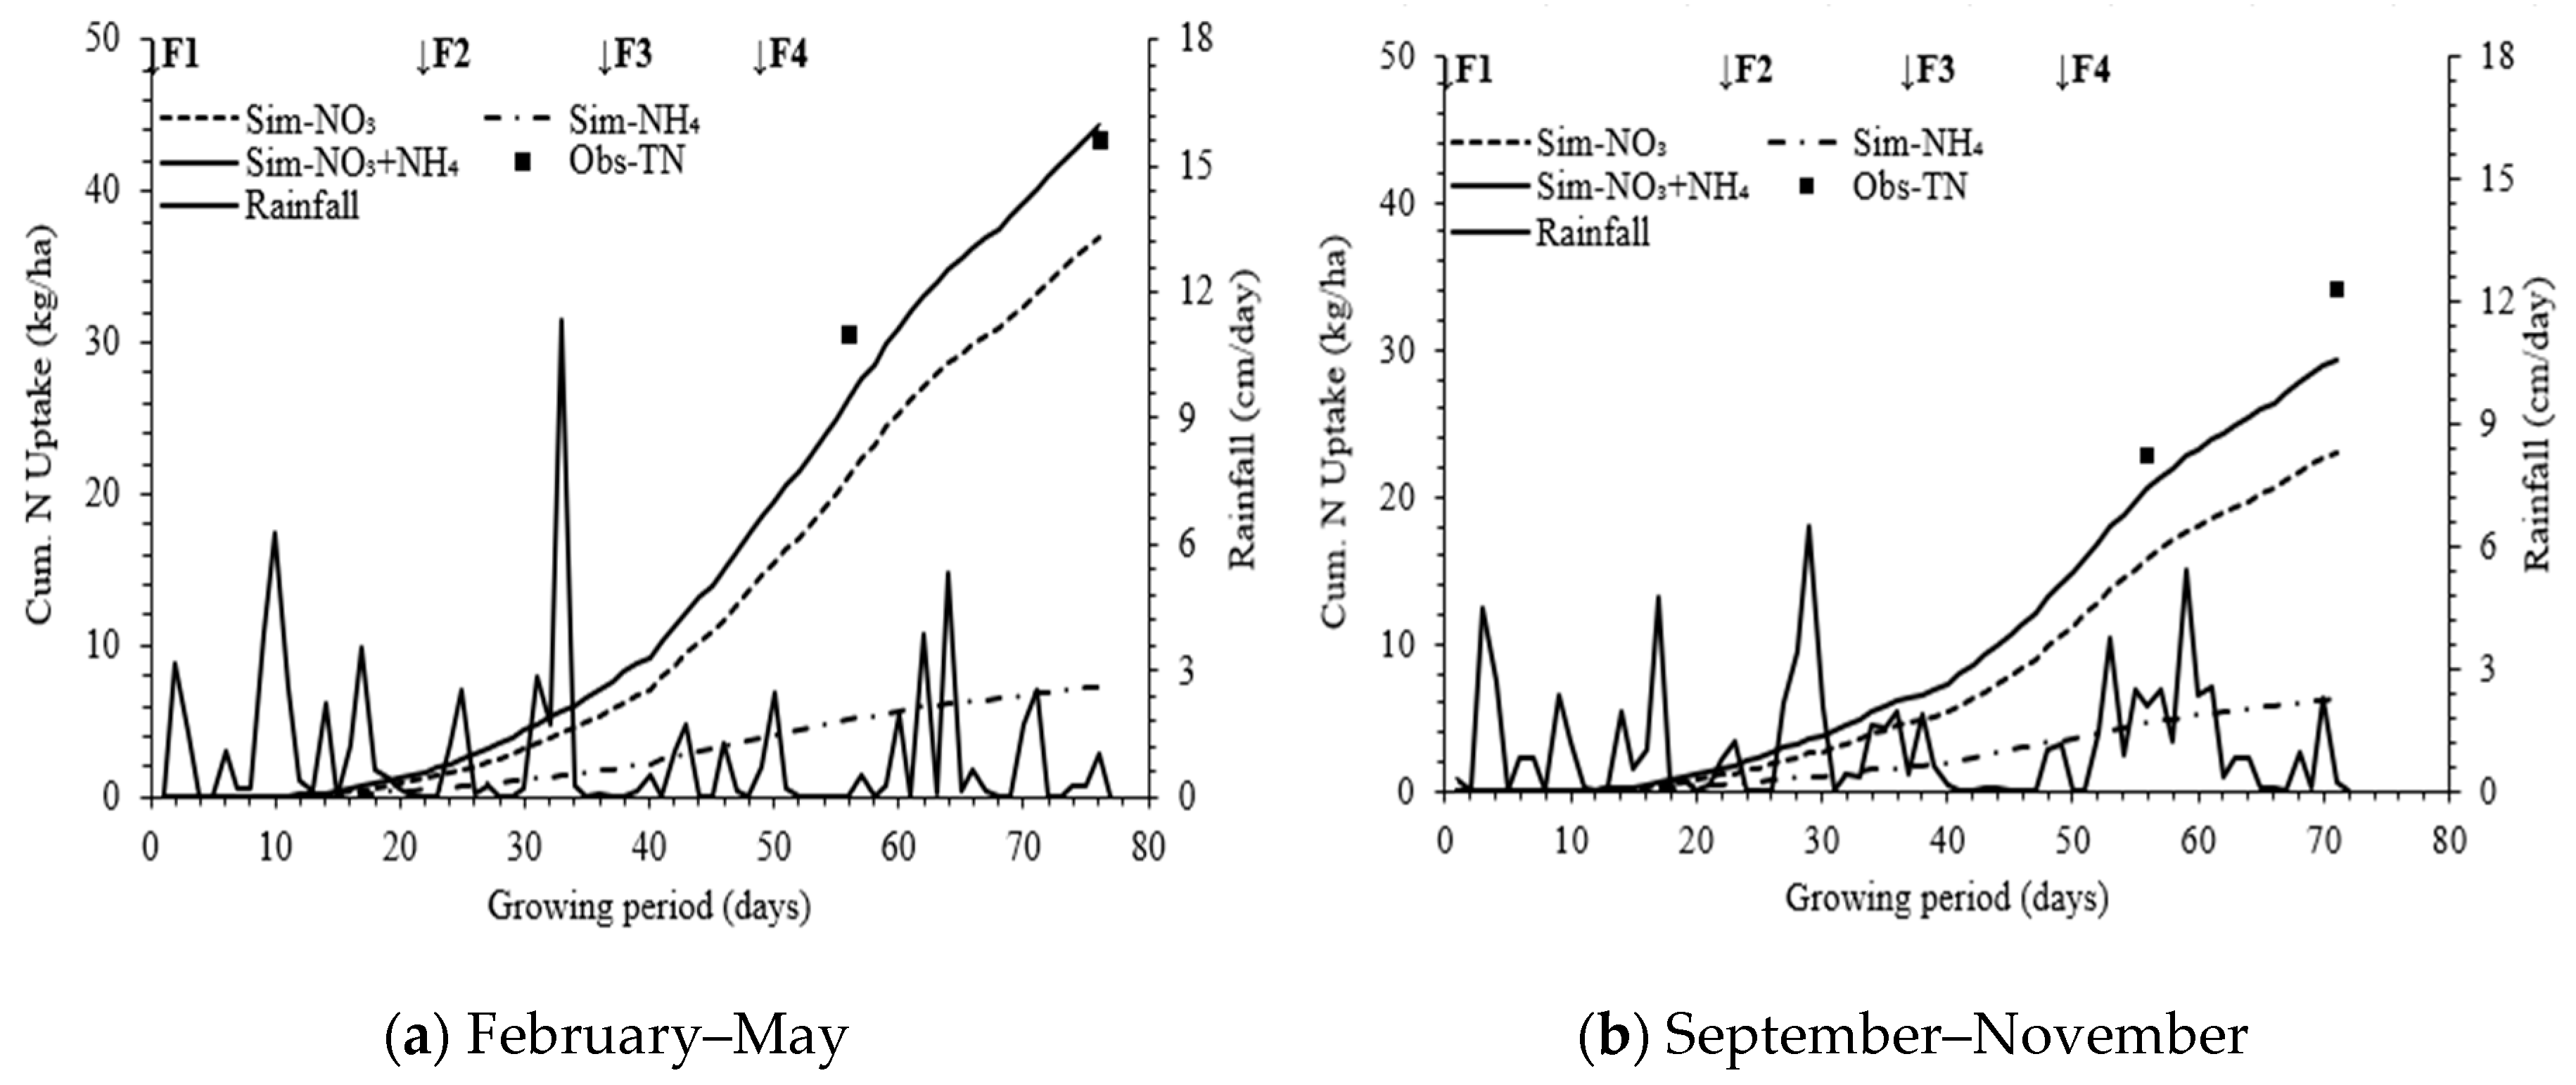
3.3. Crop Nitrogen Uptake

The cumulative nitrogen uptake during the two sweet corn seasons was slow during the initial stage of the crop (Figure 8). The N uptake values reached 1.48 kg/ha and 1.32 kg/ha on the 20th day of plantation for the first and second seasons, respectively. The N uptake increased significantly after the 30th day of plantation and finally reached 45.1 kg/ha and 29.9 kg/ha during the first and second seasons, respectively. The N uptake accounted for 37.5% (first season) and 24.9% (second season) of total nitrogen input. The difference of N uptake between seasons is relatively consecutive rainfall in the second season and shorter growing season. The larger water content caused the reduction of N uptake [35]. Fuhrmann, et al. [36] found less N uptake by corn as compared to rice. The observed N uptake values were 22.9 kg/ha and 34.1 kg/ha on 56th and 76th day (harvesting) during the first season, 22.9 kg/ha and 34.1 kg/ha on 56th and 71st day (harvesting) during the second season. On later stages, NH4+-N uptake stopped which showed that all NH4+-N has been converted to NO3-N. The NO3-N was the dominating form of N uptake by the plant that was recorded as 83.6% and 78.5% of total N uptake in first and second seasons, respectively. The NH4+-N portion of total uptake was 16.4% in the first season and 21.5% in the second season.

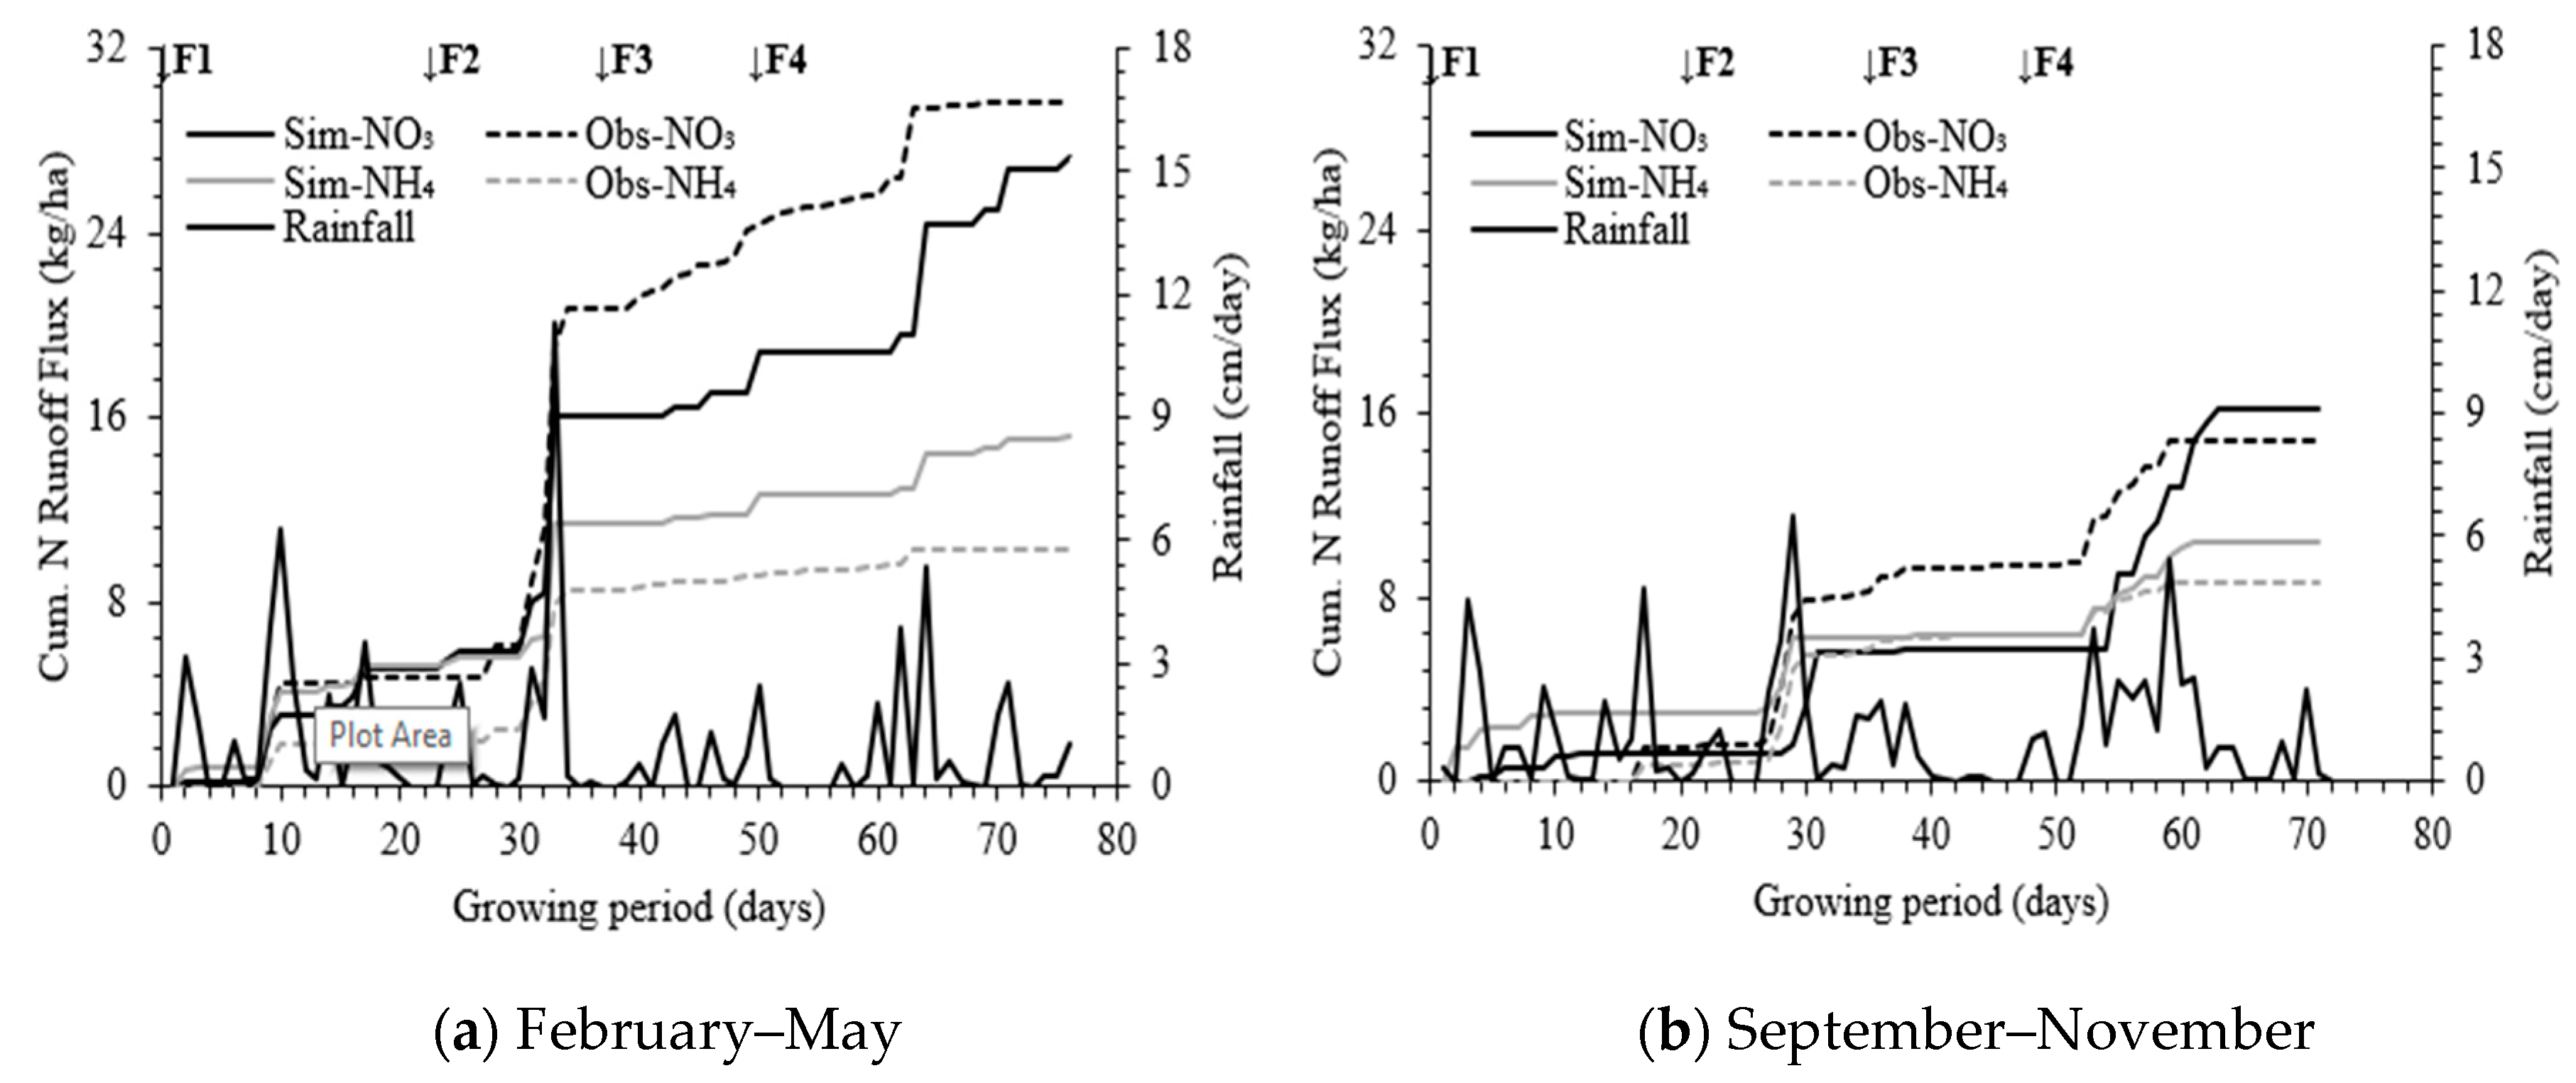
3.4. Nitrogen Loss Due to Surface Runoff

The comparison between the simulated and observed N runoff losses during two seasons is shown in Figure 9. The simulated runoff values were determined considering the N concentrations at the surface observation point that represents runoff concentration. The observed amount of NO3-N and NH4+-N lost through runoff were 29.6 kg/ha and 10.2 kg/ha, 14.8 kg/ha and 8.6 kg/ha during the first season and second seasons, respectively. The cumulative observed runoff loss was 39.8 kg/ha (first season) and 23.4 kg/ha (second season). The simulated runoff loss was 42.4 kg/ha (first season) and 26.7 kg/ha (second season). As the hydraulic conductivity of heavy textured soils is low, these high runoffs were expected under high-intensity rainfall. Few intense rainfall events during the first season caused the high N loss though the overall amount of rainfall was relatively less during the first season. The N loss due to runoff that occurred immediately after fertilizer application was significantly high as compared to subsequent runoff losses. However, the rate of loss through immediate runoff also vary among fertilizer applications and between two seasons. The variation in the rate of loss depends on the time gap between fertilizer application and rainfall occurrence and other factors that control the runoff, i.e., the antecedent moisture level, duration, and intensity of rainfall. Caiqiong and Jun [37] observed a significant increase in runoff generation chances when rainfall amount exceeded 10 mm during the study period.

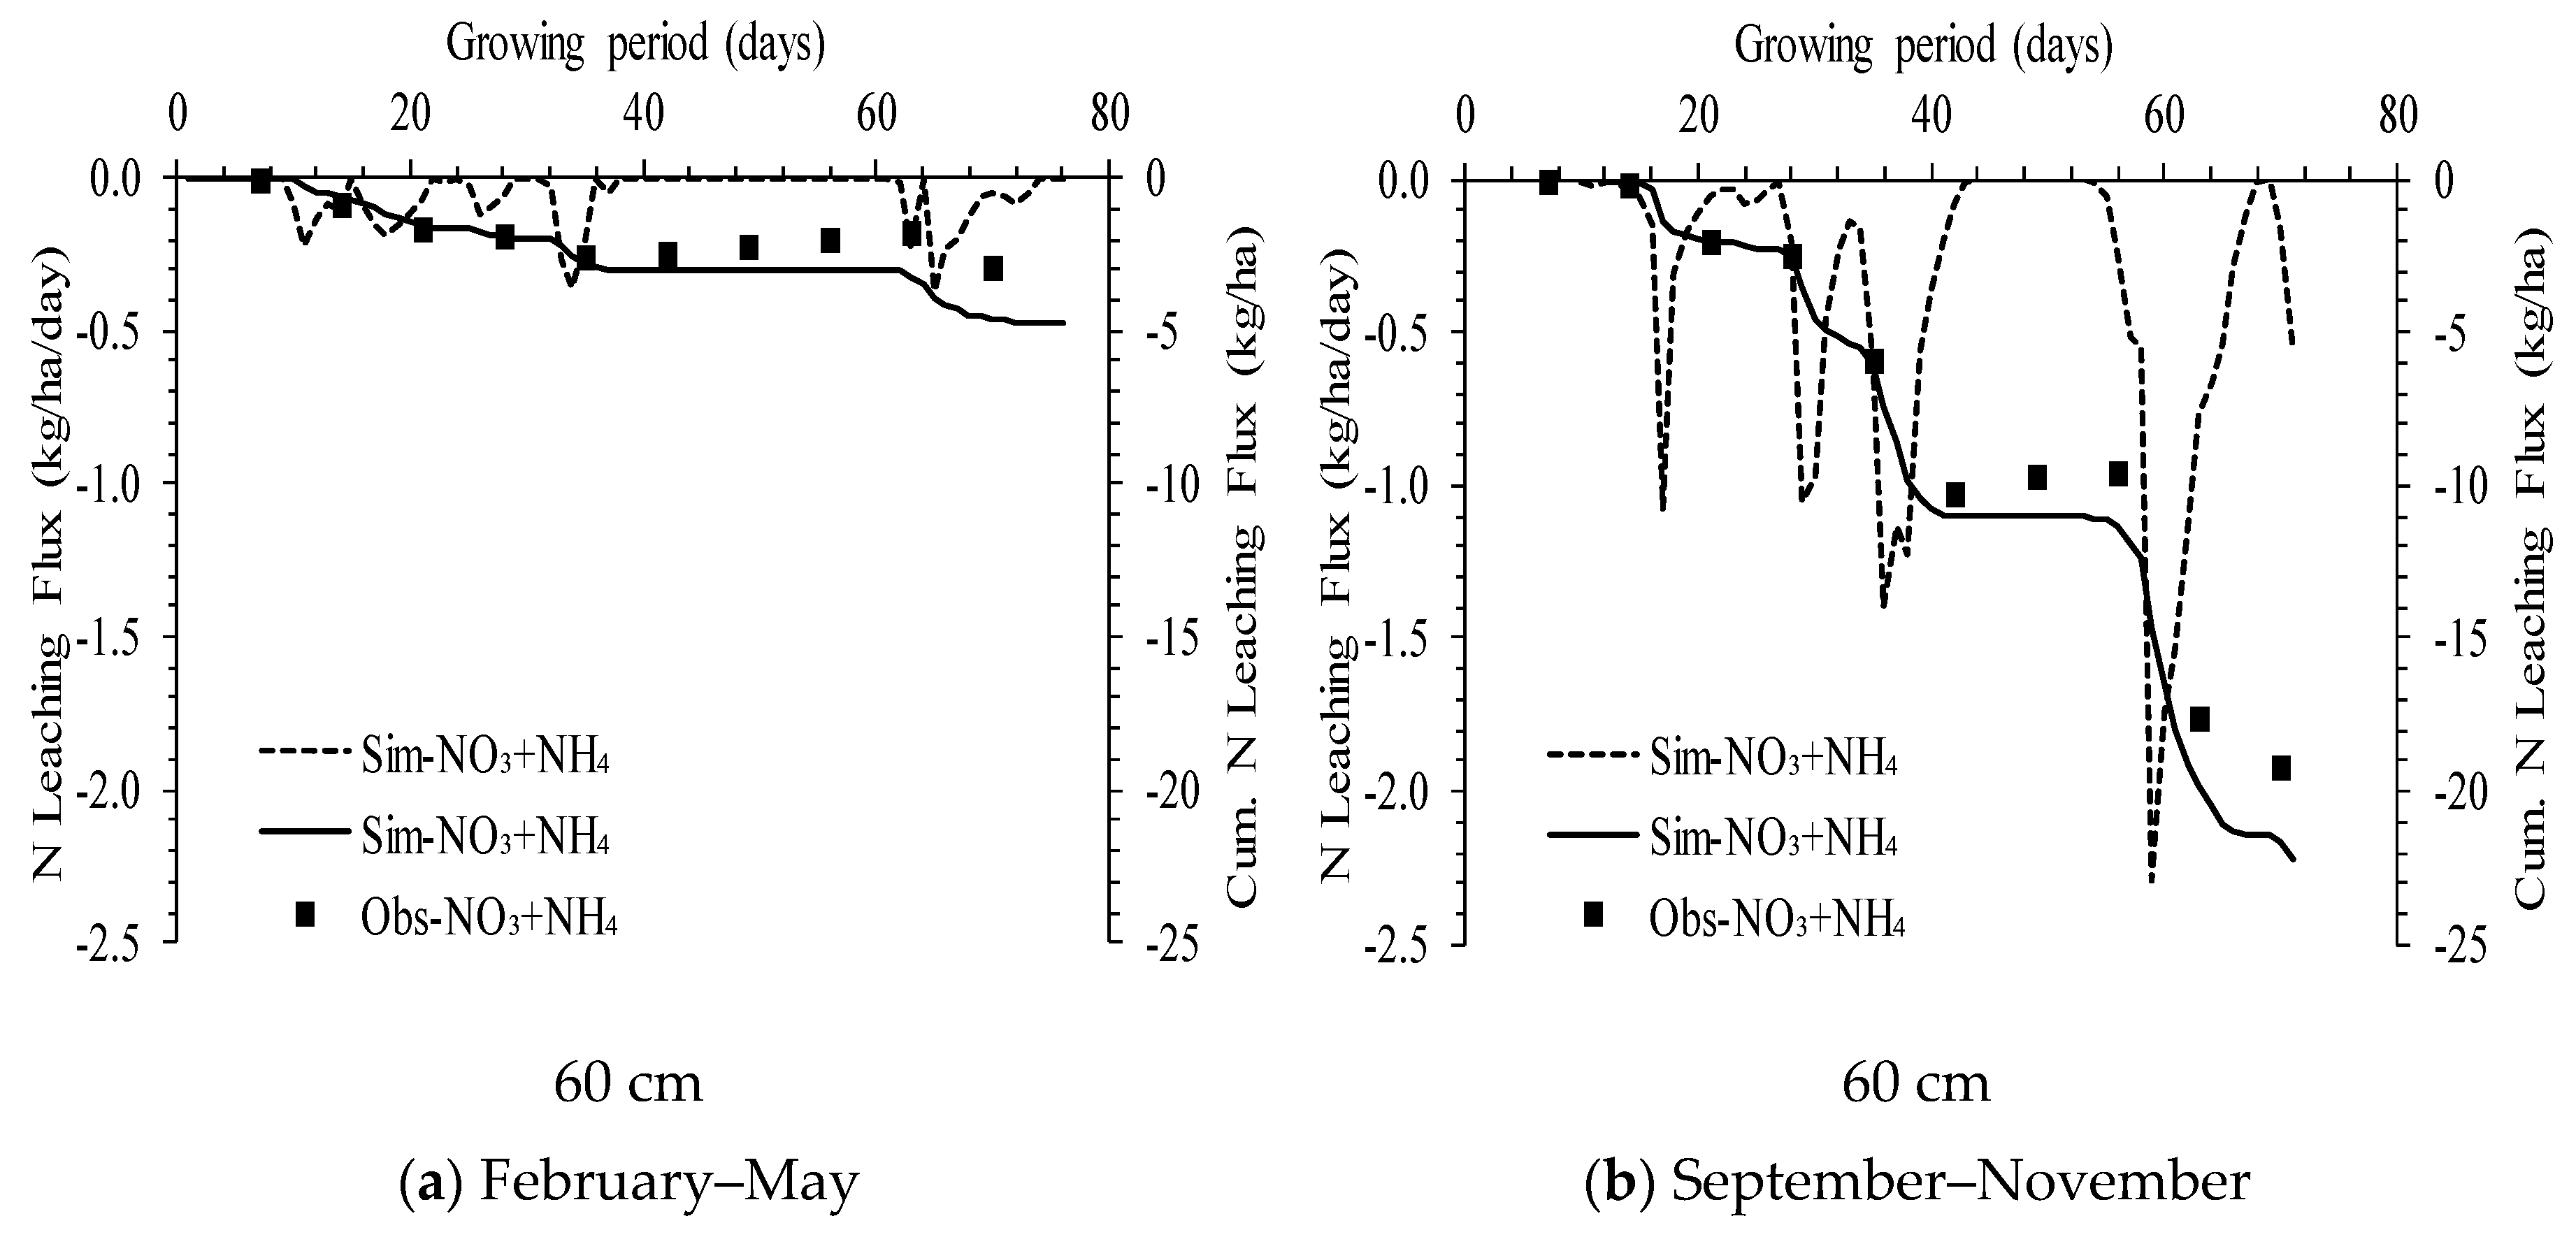
3.5. Nitrogen Leaching

The details of simulated cumulative N fluxes at 20 and 40 cm depths during the first and second seasons are presented in Figure 10. The trend of vertical fluxes shows their higher accumulation during the second season. The significant amount of N applied during the first season was lost due to runoff, leaving behind a lesser amount of N to be infiltrated in the root zone as compared to the second season. The difference in vertical flux can be also attributed to relatively frequent and low-intensity rainfall events in the second season. A significant impact of rainfall contributed to leaching [9]. The cumulative flux of NO3-N and NH4+-N continue to increase with time at 20 and 40 cm depths during both seasons. The NH4+-N flux decreased with increasing soil depth. The total NH4+-N flux at 40 cm dropped to 0.77 kg/ha and 2.55 kg/ha during the first and the second season due to various NH4+-N removal processes i.e., nitrification of NH4+-N to NO3-N and plant root uptake in form of NH4+-N. As a result of nitrification, the NO3-N concentrations in the root zone were much higher than NH4+-N. The NO3-N concentrations that remained in the root zone were vulnerable to leaching along with water flux. The higher nitrate contamination was reported for larger precipitation [38]. The drop in cumulative N leaching curves at certain points shows the small additions of N from shallow water table as results of upward water movement due to capillary rise.
Figure 11 illustrates the daily and cumulative N fluxes at 60 cm depth. As the effective root zone was set at 60 cm, the leaching fluxes have been discussed for the top 60 cm of profile depth. The results of fluxes at 60 cm have been described as a sum of NO3-N and NH4+-N as the most of the NH4+-N vertical flux occurred in the top 40 cm, the amount of NH4+-N present at 60 cm was negligible. The observed NO3-N and NH4+-N concentrations at 60 cm were in the range of 0–24.2 mg/L and 0–4.1 mg/L, 0–18 mg/L and 0–4.4 mg/L during first and second seasons, respectively. The observed concentrations justify the NO3-N as a dominant form in leaching water. The nitrogen (N) and water leaching are correlated. The comparison of N leaching between two seasons shows a similar pattern. The simulated N leaching loss accounted for 4.0% (4.8 kg/ha) and 18.5% (22.2 kg/ha) during the first and second seasons, respectively. Considering the heavy soil texture, the N leaching is significant for the second season. A study on corn under continuous furrow irrigation detected 18.3% (55 kg/ha at TNI of 300 kg/ha) of peak NO3-N leaching. However, the rates of leaching were lower for low N applications [39]. The NO3-N was again a dominating form of N leaching that was around 97% and 96% of total N leaching in first and second seasons, respectively. The NH4+-N portion in leaching was negligible. He et al. [35] reported 78% of N leaching in the form NO3-N. As the NH4+-N was either utilized or converted to NO3-N at shallower depths the NO3-N ratio in the current study is high. The difference in simulated N leaching between two seasons is quite significant. The observed N leaching results were found in good agreement to simulated results.

4. Conclusions

The HYDRUS-1D simulation model was used to evaluate rainfall effects on nitrogen distribution and losses in the presence of a shallow water table under tropical rainfed conditions. The research was carried out for two different seasons to capture the variability. Since the rainfall met the requirement of crop water, further irrigation was not applied during growing seasons. The total amount of rainfall recorded during the second season was higher than the first season, which produced more leaching losses for the second season. Increase in leaching losses also caused the reduction in N uptake for the second season. However, the few high-intensity rainfall events resulted in more runoff losses during the first season as compared to the second season. This difference in N runoff and leaching losses between two seasons shows substantial impact on N transport dynamics due to small change in rainfall amount and intensity. Similarly, the use of scheduled irrigation in Malaysia would have dramatically increased the leaching losses. The study established the leaching and runoff as a main sink of N losses from crop field and in tropical climate, these losses may increase to an alarming level. The shallow water level on this site directly raises ground water pollution by leached N.
Farmers should consider avoiding planned irrigation and restricting fertilizer use before rainfalls, particularly in tropical climates, in order to minimize the losses of runoff and leaching. HYDRUS-1D was found useful in evaluating solute transport in the sweet corn field in the tropical climate. The model will help improve the quality of the groundwater, mitigate the loss of fertilizers and thus reduce production costs.

Author Contributions

M.I. carried out the experimental investigation and prepared the manuscript, including the data analysis. M.R.K. supervised the research work and improved the manuscript. M.F.M. assisted for the field experiment, M.A.M.S., M.Y., H.C.M., and H.H.M. provided valuable comments for preparing the manuscript. All authors have read and agreed to the published version of the manuscript.

Funding

This research received no external funding.

Acknowledgments

Authors are thankful for research facilities provided by Universiti Putra Malaysia under Putra Grant (Grant No: 9557200 and 9678600). The writers are also grateful to the University of Agriculture Faisalabad and Higher Education Commission (HEC) of Pakistan for offering the PhD scholarship. The authors express their sincere gratitude to MARDI for allocating experimental field.

Conflicts of Interest

All the authors declare no conflicts of interest.

References

  1. Chandna, P.; Khurana, M.; Ladha, J.K.; Punia, M.; Mehla, R.; Gupta, R. Spatial and seasonal distribution of nitrate-N in groundwater beneath the rice–wheat cropping system of India: A geospatial analysis. Environ. Monit. Assess. 2011, 178, 545–562. [Google Scholar] [CrossRef] [PubMed]
  2. Becker, M.; Asch, F.; Maskey, S.; Pande, K.; Shah, S.; Shrestha, S. Effects of transition season management on soil N dynamics and system N balances in rice–wheat rotations of Nepal. Field Crop Res. 2007, 103, 98–108. [Google Scholar] [CrossRef]
  3. Wienhold, B.J.; Trooien, T.P.; Reichman, G.A. Yield and nitrogen use efficiency of irrigated corn in the northern Great Plains. Agron. J. 1995, 87, 842–846. [Google Scholar] [CrossRef] [Green Version]
  4. Wei, Y.; Chen, D.; Hu, K.; Willett, I.R.; Langford, J. Policy incentives for reducing nitrate leaching from intensive agriculture in desert oases of Alxa, Inner Mongolia, China. Agric. Water Manag. 2009, 96, 1114–1119. [Google Scholar] [CrossRef]
  5. Karandish, F.; Darzi-Naftchali, A.; Asgari, A. Application of machine-learning models for diagnosing health hazard of nitrate toxicity in shallow aquifers. Paddy Water Environ. 2017, 15, 201–215. [Google Scholar] [CrossRef]
  6. Zhu, J.; Li, X.; Christie, P.; Li, J. Environmental implications of low nitrogen use efficiency in excessively fertilized hot pepper (Capsicum frutescens L.) cropping systems. Agric. Ecosyst. Environ. 2005, 111, 70–80. [Google Scholar] [CrossRef] [Green Version]
  7. Tamini, T.; Mermoud, A. Water and nitrate dynamics under irrigated onion in a semi-arid area. Irrig. Drain. J. Int. Comm. Irrig. Drain. 2002, 51, 77–86. [Google Scholar] [CrossRef]
  8. McGrath, G.; Hinz, C.; Sivapalan, M. Assessing the impact of regional rainfall variability on rapid pesticide leaching potential. J. Contam. Hydrol. 2010, 113, 56–65. [Google Scholar] [CrossRef] [PubMed]
  9. Wang, H.; Ju, X.; Wei, Y.; Li, B.; Zhao, L.; Hu, K. Simulation of bromide and nitrate leaching under heavy rainfall and high-intensity irrigation rates in North China Plain. Agric. Water Manag. 2010, 97, 1646–1654. [Google Scholar] [CrossRef]
  10. Santos, D.V.; Sousa, P.L.; Smith, R.E. Model simulation of water and nitrate movement in a level-basin under fertigation treatments. Agric. Water Manag. 1997, 32, 293–306. [Google Scholar] [CrossRef]
  11. Šimůnek, J.; van Genuchten, M.T.; Šejna, M. Development and Applications of the HYDRUS and STANMOD Software Packages and Related Codes. Vadose Zone J. 2008, 7, 587–600. [Google Scholar] [CrossRef] [Green Version]
  12. Li, Y.; Šimůnek, J.; Zhang, Z.; Jing, L.; Ni, L. Evaluation of nitrogen balance in a direct-seeded-rice field experiment using Hydrus-1D. Agric. Water Manag. 2015, 148, 213–222. [Google Scholar] [CrossRef] [Green Version]
  13. Karandish, F.; Šimůnek, J. Two-dimensional modeling of nitrogen and water dynamics for various N-managed water-saving irrigation strategies using HYDRUS. Agric. Water Manag. 2017, 193, 174–190. [Google Scholar] [CrossRef] [Green Version]
  14. He, K.; Yang, Y.; Yang, Y.; Chen, S.; Hu, Q.; Liu, X.; Gao, F. HYDRUS simulation of sustainable brackish water irrigation in a winter wheat-summer maize rotation system in the North China Plain. Water 2017, 9, 536. [Google Scholar] [CrossRef] [Green Version]
  15. Ren, D.; Xu, X.; Hao, Y.; Huang, G. Modeling and assessing field irrigation water use in a canal system of Hetao, upper Yellow River basin: Application to maize, sunflower and watermelon. J. Hydrol. 2016, 532, 122–139. [Google Scholar] [CrossRef]
  16. Li, Y.; Šimůnek, J.; Jing, L.; Zhang, Z.; Ni, L. Evaluation of water movement and water losses in a direct-seeded-rice field experiment using Hydrus-1D. Agric. Water Manag. 2014, 142, 38–46. [Google Scholar] [CrossRef] [Green Version]
  17. Gabiri, G.; Burghof, S.; Diekkrüger, B.; Leemhuis, C.; Steinbach, S.; Näschen, K. Modeling spatial soilwater dynamics in a tropical floodplain, East Africa. Water 2018, 10, 191. [Google Scholar] [CrossRef] [Green Version]
  18. Silva Ursulino, B.; Maria Gico Lima Montenegro, S.; Paiva Coutinho, A.; Hugo Rabelo Coelho, V.; Cezar dos Santos Araújo, D.; Cláudia Villar Gusmão, A.; Martins dos Santos Neto, S.; Lassabatere, L.; Angulo-Jaramillo, R. Modelling soil water dynamics from soil hydraulic parameters estimated by an alternative method in a tropical experimental basin. Water 2019, 11, 1007. [Google Scholar] [CrossRef] [Green Version]
  19. Martello, M.; Dal Ferro, N.; Bortolini, L.; Morari, F. Effect of incident rainfall redistribution by maize canopy on soil moisture at the crop row scale. Water 2015, 7, 2254–2271. [Google Scholar] [CrossRef] [Green Version]
  20. Hou, L.; Zhou, Y.; Bao, H.; Wenninger, J. Simulation of maize (Zea mays L.) water use with the HYDRUS-1D model in the semi-arid Hailiutu River catchment, Northwest China. Hydrol. Sci. J. 2017, 62, 93–103. [Google Scholar]
  21. Negm, A.; Capodici, F.; Ciraolo, G.; Maltese, A.; Provenzano, G.; Rallo, G. Assessing the Performance of Thermal Inertia and Hydrus Models to Estimate Surface Soil Water Content. Appl. Sci. 2017, 7, 975. [Google Scholar] [CrossRef] [Green Version]
  22. Ramos, T.; Šimunek, J.; Gonçalves, M.; Martins, J.; Prazeres, A.; Castanheira, N.L.; Pereira, L.S. Field evaluation of a multicomponent solute transport model in soils irrigated with saline waters. J. Hydrol. 2011, 407, 129–144. [Google Scholar] [CrossRef]
  23. Ramos, T.B.; Darouich, H.; Šimůnek, J.; Gonçalves, M.C.; Martins, J.C. Soil salinization in very high-density olive orchards grown in southern Portugal: Current risks and possible trends. Agric. Water Manag. 2019, 217, 265–281. [Google Scholar] [CrossRef] [Green Version]
  24. Allen, R.G.; Pereira, L.S.; Raes, D.; Smith, M. FAO Irrigation and Drainage Paper No. 56. Crop Evapotranspiration (guidelines for computing crop water requirements). Irrig. Drain. 1998, 300, 300. [Google Scholar]
  25. Brouwer, C.; Heibloem, M. Irrigation Water Management: Irrigation Water Needs Training Manual; Food and Agriculture Organization: Rome, Italy, 1986; Volume 3, Available online: http://www.fao.org/tempref/agl/AGLW/fwm/Manual3.pdf (accessed on 14 March 2001).
  26. Ali, M. Pollution of water resources from agricultural fields and its control. In Practices of Irrigation & On-Farm Water Management: Volume 2; Springer: New York, NY, USA, 2011; pp. 241–269. [Google Scholar]
  27. Hanson, B.R.; Šimůnek, J.; Hopmans, J.W. Evaluation of urea-ammonium-nitrate fertigation with drip irrigation using numerical modeling. Agric. Water Manag. 2006, 86, 102–113. [Google Scholar] [CrossRef]
  28. Selim, H.; Iskandar, I. Modeling nitrogen transport and transformations in soils: 1. Theoretical considerations 1. Soil Sci. 1981, 131, 233–241. [Google Scholar] [CrossRef]
  29. Lotse, E.; Jabro, J.; Simmons, K.; Baker, D. Simulation of nitrogen dynamics and leaching from arable soils. J. Contam. Hydrol. 1992, 10, 183–196. [Google Scholar] [CrossRef]
  30. Zhou, S.-L.; Wu, Y.-C.; Wang, Z.-M.; Lu, L.-Q.; Wang, R.-Z. The nitrate leached below maize root zone is available for deep-rooted wheat in winter wheat–summer maize rotation in the North China Plain. Environ. Pollut. 2008, 152, 723–730. [Google Scholar] [CrossRef]
  31. Chen, B.; Liu, E.; Mei, X.; Yan, C.; Garré, S. Modelling soil water dynamic in rain-fed spring maize field with plastic mulching. Agric. Water Manag. 2018, 198, 19–27. [Google Scholar] [CrossRef]
  32. Iqbal, M.; Kamal, M.R.; Che Man, H.; Wayayok, A. HYDRUS-1D Simulation of Soil Water Dynamics for Sweet Corn under Tropical Rainfed Condition. Appl. Sci. 2020, 10, 1219. [Google Scholar] [CrossRef] [Green Version]
  33. Mo’allim, A.; Kamal, M.; Muhammed, H.; Mohd Soom, M.; Mohamed Zawawi, M.; Wayayok, A.; Che Man, H. Assessment of Nutrient Leaching in Flooded Paddy Rice Field Experiment Using Hydrus-1D. Water 2018, 10, 785. [Google Scholar] [CrossRef] [Green Version]
  34. Hu, K.; Li, B.; Chen, D.; Zhang, Y.; Edis, R. Simulation of nitrate leaching under irrigated maize on sandy soil in desert oasis in Inner Mongolia, China. Agric. Water Manag. 2008, 95, 1180–1188. [Google Scholar] [CrossRef]
  35. He, Y.; Lehndorff, E.; Amelung, W.; Wassmann, R.; Alberto, M.C.; von Unold, G.; Siemens, J. Drainage and leaching losses of nitrogen and dissolved organic carbon after introducing maize into a continuous paddy-rice crop rotation. Agric. Ecosyst. Environ. 2017, 249, 91–100. [Google Scholar] [CrossRef]
  36. Fuhrmann, I.; He, Y.; Lehndorff, E.; Brüggemann, N.; Amelung, W.; Wassmann, R.; Siemens, J. Nitrogen fertilizer fate after introducing maize and upland-rice into continuous paddy rice cropping systems. Agric. Ecosyst. Environ. 2018, 258, 162–171. [Google Scholar] [CrossRef]
  37. Caiqiong, Y.; Jun, F. Application of HYDRUS-1D model to provide antecedent soil water contents for analysis of runoff and soil erosion from a slope on the Loess Plateau. Catena 2016, 139, 1–8. [Google Scholar] [CrossRef]
  38. Wu, J.; Ding, J.; Lu, J. Nitrate Transport Characteristics in the Soil and Groundwater. Procedia Eng. 2016, 157, 246–254. [Google Scholar] [CrossRef] [Green Version]
  39. Tafteh, A.; Sepaskhah, A.R. Application of HYDRUS-1D model for simulating water and nitrate leaching from continuous and alternate furrow irrigated rapeseed and maize fields. Agric. Water Manag. 2012, 113, 19–29. [Google Scholar] [CrossRef]
Figure 1. Field layout of equipment installed for investigation of water and Nitrogen (N) balance components.
Applsci 10 03925 g001
Figure 2. A view of the installation of different equipment in the field.
Applsci 10 03925 g002
Figure 3. Comparison of observed water table fluctuation during the (a) first season and (b) second season of 2018.
Applsci 10 03925 g003
Figure 4. The layout of soil water samplers installed at 20, 40, 60, 80, and 140 cm depth.
Applsci 10 03925 g004
Figure 5. Flow chart presenting model simulation process and calculation of water and N balance components.
Applsci 10 03925 g005
Figure 6. Comparison of simulated (Sim.) and observed (Obs.) NO3-N concentrations during the (a) first season and (b) second season.
Applsci 10 03925 g006
Figure 7. Comparison of simulated (Sim.) and observed (Obs.) NH4+-N concentrations during the (a) first season and (b) second season.
Applsci 10 03925 g007
Figure 8. Comparison of simulated (Sim.) and observed (Obs.) cumulative nitrogen uptake during the (a) first season and (b) second season.
Applsci 10 03925 g008
Figure 9. Comparison of simulated (Sim.) and observed (Obs.) cumulative N runoff fluxes during the (a) first season and (b) second season.
Applsci 10 03925 g009
Figure 10. Comparison of simulated (Sim.) cumulative N fluxes at 20 and 40 cm depth during the (a) first season and (b) second season.
Applsci 10 03925 g010
Figure 11. Simulated (Sim.) N leaching fluxes, cumulative N fluxes and observed (Obs.) cumulative N fluxes at 60 cm depth during the (a) first season and (b) second season.
Applsci 10 03925 g011
Table 1. Physical properties of the soil in the experimental field at Malaysian Agricultural Research and Development Institute (MARDI).
Depth (cm)Clay %Silt %Sand %Textural ClassBulk Density (g cm−3)Conductivity Ks (cm d−1)
0–2065.369.7924.84Clay1.3612.86
20–4053.2815.2431.45Clay1.3912.43
40–6058.6613.1228.23Clay1.3112.78
60–8070.2020.2209.58Clay1.2218.11
80–14071.7418.0310.23Clay1.2417.56
Table 2. Details of agricultural activities in the experimental field at MARDI during two sweet corn growing seasons.
First Season (2018)Second Season (2018)Agricultural Activities
16 February5 SeptemberBasal fertilizer application
(60 kg N·ha−1) NPK 15:15:15; Sowing of sweet corn
(10 kg of seed·ha−1)
10 March26 SeptemberSecond fertilizer application
(25 kg N·ha−1)
24 March10 OctoberThird fertilizer application
(25 kg N·ha−1)
5 April21 OctoberFourth fertilizer application
(10 kg N·ha−1)
3 May15 NovemberHarvesting
Table 3. Statistical analysis of the comparison between observed and simulated N contents.
SeasonSoluteR2RMSE (mg·L−1)
1NO3-N0.990.62
NH4+-N0.970.26
2NO3-N0.990.46
NH4+-N0.950.28

