Article

Boosting of Denoising Effect with Fusion Strategy

School of Information Engineering, Nanchang University, Nanchang 330031, China
*
Author to whom correspondence should be addressed.
Appl. Sci. 2020, 10(11), 3857; https://doi.org/10.3390/app10113857
Submission received: 19 April 2020 / Revised: 23 May 2020 / Accepted: 29 May 2020 / Published: 1 June 2020
(This article belongs to the Section Computing and Artificial Intelligence)

Abstract

:
Image denoising, a fundamental step in image processing, has been widely studied for several decades. Denoising methods can be classified as internal or external depending on whether they exploit the internal prior or the external noisy-clean image priors to reconstruct a latent image. Typically, these two kinds of methods have their respective merits and demerits. Using a single denoising model to improve existing methods remains a challenge. In this paper, we propose a method for boosting the denoising effect via the image fusion strategy. This study aims to boost the performance of two typical denoising methods, the nonlocally centralized sparse representation (NCSR) and residual learning of deep CNN (DnCNN). These two methods have complementary strengths and can be chosen to represent internal and external denoising methods, respectively. The boosting process is formulated as an adaptive weight-based image fusion problem by preserving the details for the initial denoised images output by the NCSR and the DnCNN. Specifically, we design two kinds of weights to adaptively reflect the influence of the pixel intensity changes and the global gradient of the initial denoised images. A linear combination of these two kinds of weights determines the final weight. The initial denoised images are integrated into the fusion framework to achieve our denoising results. Extensive experiments show that the proposed method significantly outperforms the NCSR and the DnCNN both quantitatively and visually when they are considered as individual methods; similarly, it outperforms several other state-of-the-art denoising methods.

1. Introduction

Digital images are often corrupted by noise during the acquisition or transmission of the images [1], rendering these images unsuitable for vision applications such as remote sensing and object recognition. Therefore, image denoising is a fundamental preprocessing step that aims at suppressing noise and reproducing the latent high quality image with fine image edges, textures, and rich details. A corrupted noisy image can be generally described as:
y = x + v
where the column vector x denotes the original clean image, and the v denotes the additive noise. There are many possible solutions for x of a noisy image y because the noise v is unknown. This is a fact that encourages scholars to continue seeking for new methods to achieve better denoising results. Various image denoising studies assume v to be additive white gaussian noise (AWGN). Considering that AWGN is stationary and uncorrelated among pixels, we made the same assumption for this study.
Denoising methods can be classified into two types [2], internal methods and external ones. The internal methods denoise an image patch using other noisy image patches within the noisy image, whereas the external methods denoise a patch using externally clean image patches. In the past several years, the internal sparsity and the self-similarity of images were usually utilized to achieve better denoising performance. Non-local Means (NLM), proposed by Baudes et al. [3,4], is the first filter that utilizes the non-local self-similarity in images. NLM obtains a denoised patch by first finding similar patches and obtaining their weighted average. Because searching for similar patches in various noise levels may be computationally impractical, typically, only a small neighborhood of the patch is considered for searching possible matches. BM3D [5], a characteristic benchmark method, builds on the strategy of NLM by grouping similar patches together, and suggests a two-step denoising algorithm. First, the input image is roughly denoised. Then, the denoising is refined by collecting similar patches to accomplish a collaborative filtering in the transform domain. This two-step process contributes to the effectiveness of the BM3D, making it a benchmark denoising algorithm. The nuclear norm minimization (NNM) method was proposed in [6] for video denoising; nevertheless, it was greatly restricted by its capability and flexibility in handling many practical denoising problems. In [7], Gu et al. presented weighted nuclear norm minimization (WNNM). This was a low rank image denoising approach based on non-local self-similarity; however, it suppressed the low rank parts and shrank the reconstructed data. The K-SVD [8] denoising utilizes the sparse and redundant representations of an over-complete learned dictionary to produce a high-quality denoised image. Such a dictionary was initially learned from a large number of clean images. Later, it was directly learned from the noisy image patches [9]. Motivated by the idea of similar image patches sharing similar subdictionaries, Chatterjee et al. [10] proposed the K-LLD. Instead of learning a single over-complete dictionary for an entire image, K-LLD first performs a clustering step based on the patches using the local weight function presented in [11]. Then, it separately finds the most optimal dictionary for each cluster to denoise the patches from each cluster. Similarly, the authors of learned simultaneous sparse coding (LSSC) [12,13] exploit self-similarities of image patches combined with sparse coding to further improve the performance of image denoising methods based on dictionary learning using a single dictionary. Taking advantage of the noise properties of local patches and different channels, a scheme called trilateral weight sparse coding (TWSC) was proposed in [14]. In this model, the noise statistics and sparsity priors of images are adaptively characterized by two weight matrices. Based on the idea of nonlocal similarity and sparse representation of image patches, Dong et al. introduced the nonlocally centralized sparse representation (NCSR) model [15] and the concept of sparse coding noise, thereby changing the objective of image denoising to suppressing the sparse coding noise. K-means clustering is applied to cluster the patches obtained from the given image into K clusters; then, a PCA sub-dictionary is adaptively learned for each cluster, leading to a more stable sparse representation. It is a fact that NCSR is efficient in capturing image details and adaptively representing them with a sparse description. However, since each image patch is considered as an independent unit of the sparse representation in the dictionary learning and sparse coding stages, ignoring the relationships among the patches can result in inaccurate sparse coding coefficients.
There was a major leap in denoising performance with the revival of neural networks, which are trained on large collections of external noisy–clean image priors. Zoran and Weiss [16] presented gaussian mixture models (GMMs) using a gaussian mixture prior learned from a database of clean natural image patches to reproduce the latent image. PG prior based denoising (PGPD), a method developed based on GMMs, was proposed in [17] to exploit the non-local self-similarity of clean natural images. A convolutional neural network (CNN) for denoising was proposed in [18], where a five-layer convolutional network was specifically designed to synthesize training samples from abundantly available clean natural images. Subsequently, fully connected denoising auto-encoders [19] were suggested for image denoising. Nevertheless, the early CNN-based methods and the auto-encoders cannot compete with the benchmark BM3D [5] method. In [20], the plain multi-layer perceptron method is used to tackle image denoising with a multi-layer perceptron trained using training examples. This achieves a performance that is comparable with that of the BM3D method. Schmidt and Roth introduced the cascade of shrinkage fields (CSF) [21], which combines a random field-based model and half-quadratic optimization into a single learning framework to efficiently perform the denoising. Chen et al. [22,23] further presented the trainable nonlinear reaction diffusion (TNRD) method for image denoising problems. It learns the parameters from training data through a gradient descent inference approach. Both the CSF and TNRD show promise in narrowing the gap between denoising performance and computational efficiency. However, the specified forms of the priors adopted by these methods are limited with regard to capturing all the features related to image structure. Inspired by combining learning-based approaches with the traditional methods, Yang et al. [24] defined a network known as the BM3D-Net by unrolling the computational pipeline of the classical BM3D algorithm into a CNN structure. It achieves competitive denoising results and significantly outperforms the traditional BM3D method. With regard to the development of deep CNNs, some prevalent deep CNN-based approaches are favorably compared to many other state-of-the-art methods both quantitatively and visually (e.g., recursively branched deconvolutional network (RBDN) [25], fast and flexible denoising convolutional neural network (FFDNet) [26], and residual learning of deep CNN (DnCNN) [27]). Santhanam et al. [25] developed the RBDN for denoising as well as general image-to-image regression. Proposed by Zhang et al. in [26], by inputting an adjustable noise level map, the FFDNet is able to achieve visually convincing results on the trade-off between detail preservation and noise reduction with a single network model. Rather than outputting the denoised image x directly, in the case of the DnCNN, a residual mapping v ^ is employed to estimate the noise existent in the input image, and the denoising result is x = y v ^ . Taking advantage of batch normalization [28] and residual learning [29], the DnCNN can handle several prevailing denoising tasks with high efficiency and performance.
Various image denoising algorithms have produced highly promising results; however, the experimental results and bound calculations in [30] showed that there is still room for improvement for a wide range of denoising tasks. Some image patches inherently require external denoising; however, external image patch prior-based methods do not make good use of the internal self-similarity. Further improvement of the existing methods or the development of a more effective one using a single denoising model remains a valid challenge. Therefore, we are interested in combining both internal and external information to achieve better denoising results. To this end, we choose NCSR and DnCNN as the initial denoisers by considering their performance and complementary strengths. NCSR, a powerful internal denoising method that combines nonlocal similarity and sparse representation, demonstrates exceptionally high performance in terms of denoising regular and repeated images. The DnCNN possesses an external prior modeling capacity with a deep architecture. This is better for denoising irregular and smooth regions and is complementary to the internal prior employed by the NCSR. In other words, the combination of NCSR and DnCNN can strongly explore both the internal and external information of a given region in the initially denoised images.
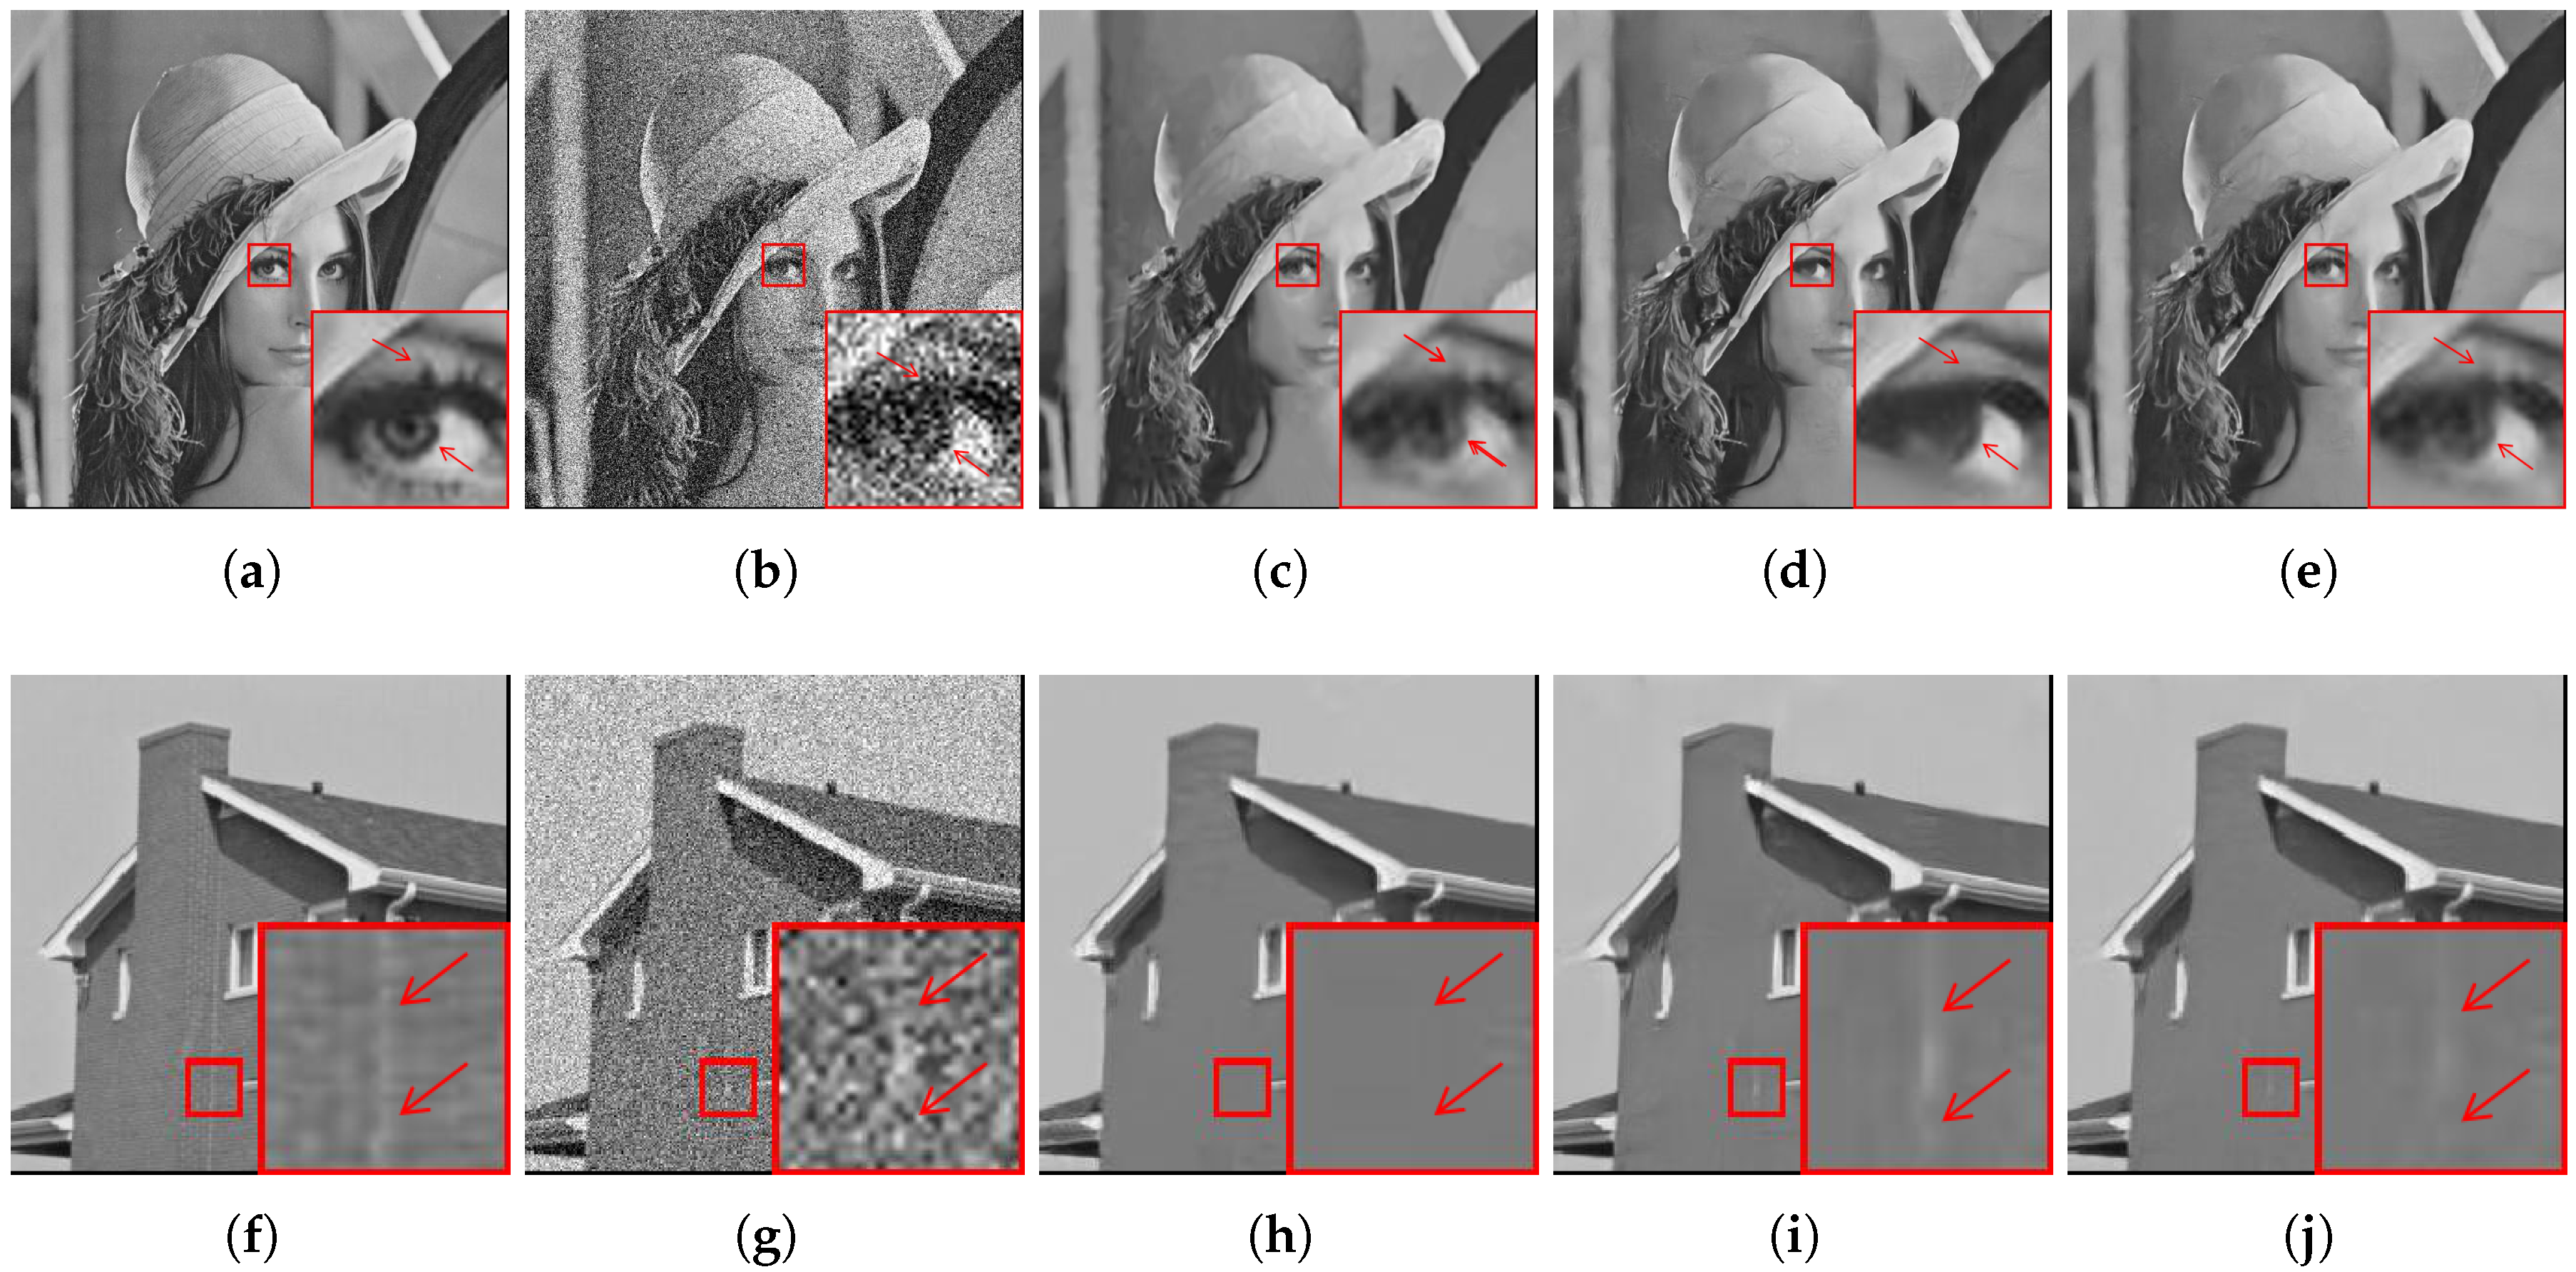
In this study, we introduce a denoising effect boosting method based on an image fusion strategy. The objective is to further improve performance by fusing images that are originally denoised by NCSR and DnCNN. These methods have complementary strengths and can be chosen to represent the internal and external denoising methods. Note that, the proposed denoising effect boosting method is simpler than the deep learning-based one introduced in [31]. In the latter method, a CNN is leveraged to iteratively learn the denoising model in each stage in the deep boosting method; this requires massive images for training to achieve an appropriate final result. In contrast, our method boosts the denoising effect using the image fusion strategy. Without using any training samples, we compute the weight map along each image pixel to fuse two initially denoised images for an enhanced denoising effect. In summary, the novelty of our method lies in three aspects. First, our method combines complementary information from images denoised using two state-of-the-art methods via a fusion strategy. Second, the strategy is excellent in terms of the preservation of details via a simple fusion structure. Third, it does not involve a computationally expensive training step. The DnCNN model used in this study was trained by its original developers, and the parameters are set using the source code of the model. Furthermore, NCSR is based on the nonlocal self-similarity and sparse representation of image patches, which need not be learned from external samples. Therefore, our method does not involve any loop iterations for processing images. The effectiveness of the proposed denoising booster can be seen in Figure 1, where some test images and the corresponding denoised images are shown. The proposed booster performs well with regard to the preservation of the image details. In the L e n a image, the NCSR can recover the eyelashes; however, it produces artifacts on the eyeball. Though DnCNN produces less artifacts, it tends to create an over-smooth region, with the eyelashes being almost invisible. However, by combining the strengths of these two methods, our method can preserve more details without generating many artifacts in the same region. We can also observe that the line in the H o u s e image has a gray intensity in the result obtained using the NCSR. Nevertheless, it becomes brighter after boosting is performed by combining the denoising performance of the DnCNN with that of the NCSR.
The boosting process is formulated as an adaptive weight-based image fusion problem to enhance the contrast and preserve the image details of the initially denoised images. Specifically, unlike many existing conventional pixel-wise image fusion methods that employ one weight to reflect the pixel value in the image sequence, our method applies a weight map to adaptively reflect the relative pixel intensity and the global gradient of the initially denoised images obtained using the NCSR and the DnCNN, respectively. Taking the overall brightness and neighboring pixels into consideration, two kinds of weights are designed as follows:
  • The relative pixel intensity based weight is designed to reflect the importance of the processed pixel value relative to the neighboring pixel intensity and the overall brightness.
  • The global gradient based weight is designed to reflect the importance of the regions with largely variational pixel values and to suppress the saturated pixels in the initial denoised images.
A linear combination of these two kinds of weights determines the final weight. Two initially denoised images are incorporated into the fusion framework, and the boosting method can significantly combine the complementary strengths of the two aforementioned methods to achieve better denoising results. Several extensive experimental results demonstrate that the proposed method visually and quantitatively outperforms many other state-of-the-art denoising methods. The key contributions of this study are summarized as follows:
  • Optimal combination. We introduce a denoising effect boosting method to improve the denoising performance of a single method, NCSR or DnCNN. Each denoiser has its own characteristics. The NCSR performs well on images with abundant texture regions and repeated patterns. Owing to the strategies of residual learning [29] and batch normalization [28], the DnCNN is better for denoising irregular and smooth regions. A linear combination of NCSR and DnCNN is better than either of the individual methods as well as a number of other state-of-the-art denoising methods. To the best of our knowledge, the proposed denoising effect boosting method is the first of its kind in image denoising.
  • Weight design. We introduce two adaptive weights to reflect the relative pixel intensity and global gradient. One is to emphasize the processed pixel value according to the surrounding pixel intensities and the overall brightness. The other is to emphasize the areas where pixel values vary significantly and to suppress saturated pixels in the initial denoised images. Therefore, the weight design is powerful in preserving image details and enhancing the contrast when denoising.
In Section 2, we first review two denoising methods, NCSR and DnCNN, and highlight their contributions to our study. In Section 3, we describe the proposed method in detail and present the proposed adaptive combination algorithm. In Section 4, the experimental results obtained using the proposed method are compared with those of other state-of-the-art methods. In Section 5, we discuss the results in detail. Finally, we conclude the study and discuss the directions for future research in Section 6.

2. Related Work

2.1. Nonlocally Centralized Sparse Representation (NCSR) for Image Denoising

The NCSR algorithm involves decomposing a noisy image into a set of overlapping patches, learning the sub-dictionaries to sparsely code the image patches, making an estimate of the sparse coding vectors, and combining the estimated patches to form the denoised image. It can be equivalently introduced as below.
Using the notation employed in [9], for an image x R N , we denote x i = R i x as an image patch of size n × n at pixel i; furthermore, R i represents a matrix for extracting the patch x i from x. For a given dictionary D R n × M , n M , x i can be sparsely coded as x i D α x , i by solving an l 1 -minimization problem written as:
min α i i = 1 P ( x i D α i 2 2 + λ α i 1 ) ,
where α i represents the sparse coding coefficient of x i , P is the sum of sparse codes for image x, and λ is the regularization parameter. The redundant patch-based representation is obtained by overlapping the image patches. This aims at suppressing the boundary artifacts. The entire image x is denoted by a set of sparse codes { a x , i } . A straightforward least-square solution to reconstruct x from { a x , i } is
x i = 1 N R i T R i 1 i = 1 N ( R i T D α x , i ) .
For the convenience of expression, let
x Φ α x = i = 1 N R i T R i 1 i = 1 N ( R i T D α x , i ) ,
here, α x is the concatenation of all the sparse codes. As mentioned in the model of the noisy image in Equation (1), the sparsity coding denoising model to recover x from y is obtained by solving a minimization problem:
α y = a r g min α ( x i D α 2 2 + λ α 1 ) .
Then, the image x is estimated as x ^ = D α y . x ^ is an estimate obtained by averaging each of the reconstructed patches in x i . The reconstruction of x from y in NCSR algorithm is defined as the following minimization problem:
α y = a r g min α x i D α 2 2 + λ i α i β i p ,
where the regularization parameter λ balances the centralized sparsity and the fidelity terms for better performance. This should be adaptively determined. β i represents the nonlocal estimate of the unknown sparse code α i . α i β i p is the only regularization term in the aforementioned model. In the case of p = 1 , the estimated β i can be computed from the nonlocal redundancy of natural images, and this is why the model is called the nonlocally centralized sparse representation (NCSR).
An iterative shrinkage strategy is employed to calculate β i in Equation (6). Let Ω i be denote a set of patches similar to patch x i and α i , q be the sparse codes of patch x i , q within set Ω i . Thereafter, β i can be computed as:
β i = q Ω i w i , q α i , q ,
where w i , q is the corresponding weight and it is set inversely proportional to the distance between patches x i and x i , q :
w i , q = 1 W e x p ( ( x i x i , q 2 2 ) / h ) ,
where x i = D α i and x i = D α i , q , respectively. h is a pre-determined scalar, and W is a normalization factor. Specifically, with the nonlocal estimate β i taking full advantage of the nonlocal redundancy of images, the NCSR algorithm naturally integrates the nonlocal self-similarity prior into the sparse representation framework and shows a promising performance in terms of denoising natural images with many repetitive structures.

2.2. Residual Learning of Deep CNN-Based Image Denoising Method (DnCNN)

The DnCNN method has been successfully used in image denoising mainly because of the following three reasons [27]. First, it has a very deep architecture that can increase its own capacity and flexibility. Second, some advances in training CNN-based models have been achieved; these include the rectified linear unit (ReLU) [32], the tradeoff between depth and width [33,34], gradient-based optimization algorithms [35,36,37] parameter initialization [38], batch normalization [28], and residual learning [29]. Third, the DnCNN can efficiently perform parallel calculations on modern powerful GPUs; thus, it has the potential to exhibit an improved run-time performance.
The input of the DnCNN is the mentioned noisy observation in Equation (1). Three types of network layers are introduced in the DnCNN denoiser; the architecture is illustrated in Figure 2, where “Conv” stands for convolution, “BN” stands for batch normalization, and “ReLU” stands for the rectified linear unit. After removing all pooling layers, the size of the convolution filters is 3 × 3 . For a certain noise level in Gaussian denoising, it is more appropriate to set the size of the receptive field of the DnCNN denoiser to 35 × 35 with a corresponding depth of 17. Some explanations of the architecture of the DnCNN denoiser are given below:
  • Conv+ReLU: In the first layer, 64 feature maps are generated by 64 filters with the size of 3 × 3 × c ; subsequently, rectified linear units (ReLU, max(0, ·)) are utilized for nonlinearity. c denotes the number of image channels; for a gray image, c = 1 , and for a color image, c = 3 .
  • Conv+BN+ReLU: 64 filters of size 3 × 3 × 64 are used, and batch normalization is added for layers 2 ( D 1 ) between the convolution and ReLU. Here, D represents the depth of the DnCNN.
  • Conv: In the last layer, there are c filters with the size of 3 × 3 × 64 that are used to reconstruct the final residual image.
With regard to model training, DnCNN adopts the residual learning strategy and trains a residual mapping R ( y ) v to predict the residual image; furthermore, it uses batch normalization [28] to accelerate training and reduce the internal covariate shift [28]. Then, the output is obtained using x = y R ( y ) . It has been pointed out in [27] that integrating residual learning and batch normalization is particularly helpful for fast and stable training as well as better denoising performance.

3. Combination of the NCSR and the DnCNN

In this section, we present an image fusion algorithm to optimize the denoising performance of NCSR and DnCNN using two adaptive weights that reflect the relative pixel intensity and the global gradient, respectively.

3.1. Fusion of Images Denoised by NCSR and DnCNN

The proposed denoising effect boosting method is a linear combination of NCSR and DnCNN. That is, we apply two denoisers D 1 and D 2 to yield two denoised images x ^ 1 = D 1 ( y ) and x ^ 2 = D 2 ( y ) . We compute the desired image x ^ by retaining only the “optimal” parts in images x ^ 1 and x ^ 2 . This process is guided by the relative pixel intensity and the global gradient, which are consolidated into a scalar-valued weight map. The final image x ^ is obtained by fusing x ^ 1 and x ^ 2 using weighted blending. The processes involved in the proposed method are shown in Figure 3.
To optimally fuse the initial denoised images, we compute a weight map for the n-th input image as
W n ( i , j ) = W 1 , n ( i , j ) p 1 × W 2 , n ( i , j ) p 2 n = 1 2 W 1 , n ( i , j ) p 1 × W 2 , n ( i , j ) p 2 + ϵ
where ( i , j ) represents the image pixels, and ϵ denotes a very small positive value (e.g., 10 2 ) to avoid the denominator being zero. The parameters p 1 , p 2 > 0 are set to determine the extent to which each weight should be emphasized. The number 2 indicates that there are two input images that are denoised by NCSR and DnCNN, respectively. W 1 , n ( i , j ) and W 2 , n ( i , j ) are two adaptive weights designed to reflect the relative pixel intensity and the global gradient of an input image. A detailed introduction to the two weights will be given in the following subsections.
Using the weight obtained in Equation (9), the resulting denoised image x ^ can be obtained via a weighted sum of the initial denoised images:
x ^ ( i , j ) = n = 1 2 W n ( i , j ) x ^ n ( i , j ) ,
where x ^ n is the input image denoised by NCSR or DnCNN and x ^ n ( i , j ) is the image pixel intensity. In this study, the pixel intensity is normalized to the range of [ 0 , 1 ] . Unfortunately, applying only Equation (10) will yield an image with several artifacts. This is because the values of the weights are usually noisy and discontinuous. Therefore, we apply Equation (10) in multiple resolutions using a pyramidal image decomposition, described in [39], to avoid sharp weight map transitions. The fusion is carried out in each pyramid separately. Specifically, we set the decomposition level l to 7 based on [39]. For level l, L x ^ n ( i , j ) l is the Laplacian pyramid of image x ^ n ( i , j ) and G W n ( i , j ) l is the Gaussian pyramid of the weight map W n ( i , j ) . Note that the value of x ^ n ( i , j ) determines the value of W n ( i , j ) . Then, we blend the pixel intensities in different pyramid levels in Equation (11):
L x ^ ( i , j ) l = n = 1 2 L x ^ n ( i , j ) l G W n ( i , j ) l ,
The fused pyramid L x ^ n ( i , j ) l is collapsed to obtain the resulting denoised image x ^ . The pyramid approach can weaken the local unnatural transition by dispersing the gray-level mutations of the whole image, which are caused by the differences in the denoising effects.

3.2. Pixel Intensity Based Weight Design ( W 1 , n ( i , j ) )

In this section, we introduce a weight design W 1 , n ( i , j ) that reflects the pixel intensity. A fundamental aspect of the image fusion algorithm is to design W n ( i , j ) , which reflects the importance of the corresponding pixel; furthermore, it needs to reflect the influence of luminance changes, i.e., to emphasize bright regions and vice versa. Mertens et al. [39] presented an image quality measure known as well-exposedness to design a weight in this regard:
W n ( i , j ) = e x p ( x ^ n ( i , j ) 0 . 5 ) 2 2 λ 2 ,
where λ equals 0 . 2 . Similar to several intuitive weight designs, the measure uses a Gauss curve and provides weights to each pixel intensity x ^ n ( i , j ) based on the proximity of the intensity value to 0 . 5 . It also can be observed that the n-th image is the only variable used in this function. Based on this, we present our observations regarding the weight design. First, a weight design that employs Equation (12) cannot assign a large weight to a well-denoised pixel with an intensity value far from 0 . 5 , in bright or dark regions. Therefore, it cannot well emphasize a bright pixel that is well-denoised in an overall dark image or a well-denoised dark pixel in an overall bright image. Hence, we propose a weight design that is relative to the overall image brightness. The proposed weight design assigns a relatively large weight to a dark pixel in a bright image and vice versa. We define m n as the mean of the pixel intensities of the n-th initial denoised image, and the weight should emphasize the pixel intensities close to 1 m n . In the same form as that of Equation (12), this can be written as e x p ( ( x ^ n ( i , j ) ( 1 m n ) ) 2 ) . In addition, we note that several well-denoised pixels should be considered when the brightness of the input initial denoised images m n and m n + 1 has a large difference. Therefore, we assign a large λ n when the brightness of the two images differs substantially. Finally, the first weight W 1 , n ( i , j ) that reflects the relative pixel intensity can be represented as
W 1 , n ( i , j ) = e x p ( x ^ n ( i , j ) ( 1 m n ) ) 2 2 λ n 2 ,
where λ n controls the weight as λ n = 2 α ( m n + 1 m n ) based on the difference between the two input images. From Equation (13), it can be seen that when the input image is bright ( m n is close to 1), dark pixels ( x ^ n ( i , j ) with a relatively low value) will be assigned a larger weight and vice versa. Moreover, a large weight is assigned when there is a large difference in the mean brightness of the two input initial denoised images.

3.3. Global Gradient Based Weight Design ( W 2 , n ( i , j ) )

The image gradient has been widely studied because it conveys rich information regarding image edges and structures. To explore the complementary information provided by the gradient of the image pixels, and further understand how to design an efficient weight function, we study the gradient between the pixel intensity and its frequency. In this subsection, we will discuss how image gradient information can be exploited to compute the weight map for the initial denoised images.
In a bright image, the pixels values in bright regions are saturated close to 1, whereas they have a small gradient in the dark regions. The opposite relation holds in the case of a dark image. Some methods assign large weights to pixels with large gradient values [39,40,41]. However, the pixel gradient value is small in smooth regions regardless of the degree of luminance; thus, emphasizing only the pixel values in regions with large gradients will fail to stress the pixels with a small gradient that are in well-denoised regions.
In this regard, we design another weight that is based on the gradient of the pixel intensity and its frequency to emphasize the well-denoised regions regardless of their local contrast. As the proposed gradient is not a local one (that is, relative to surrounding pixels) but relative to other remote pixels in a similar frequency range, we refer to the proposed gradient as the global gradient. The global gradient of a dark image is large because many saturated pixel intensities are close to zero. Therefore, we posit that an image pixel is in a well-denoised region when it is in a region with a small global gradient. In other words, pixel values are relatively scarce in this region; thus, the pixels have a large variation in value compared to that of the surrounding pixels. In contrast with dark images, bright images show smaller global gradients at lower pixel values. This also indicates that the pixels with a smaller global gradient are in well-denoised or high-variation regions. Therefore, we give a pixel a larger weight when it has a smaller global gradient. Considering these observations, we design the second weight:
W 2 , n ( i , j ) = G n ( x ^ n ( i , j ) ) 1 n = 1 2 G n ( x ^ n ( i , j ) ) 1 + ϵ ,
where G n ( x ^ n ( i , j ) ) is the global gradient for pixel intensity x ^ n ( i , j ) .

4. Experiments

We have conducted extensive experiments to validate the effectiveness of our approach and compared it to recently proposed powerful denoising methods. In this section, we first discuss the datasets and the experimental setup. Then, we evaluate the proposed image fusion denoising method and its competing methods on the test images.

4.1. Datasets and Experimental Setup

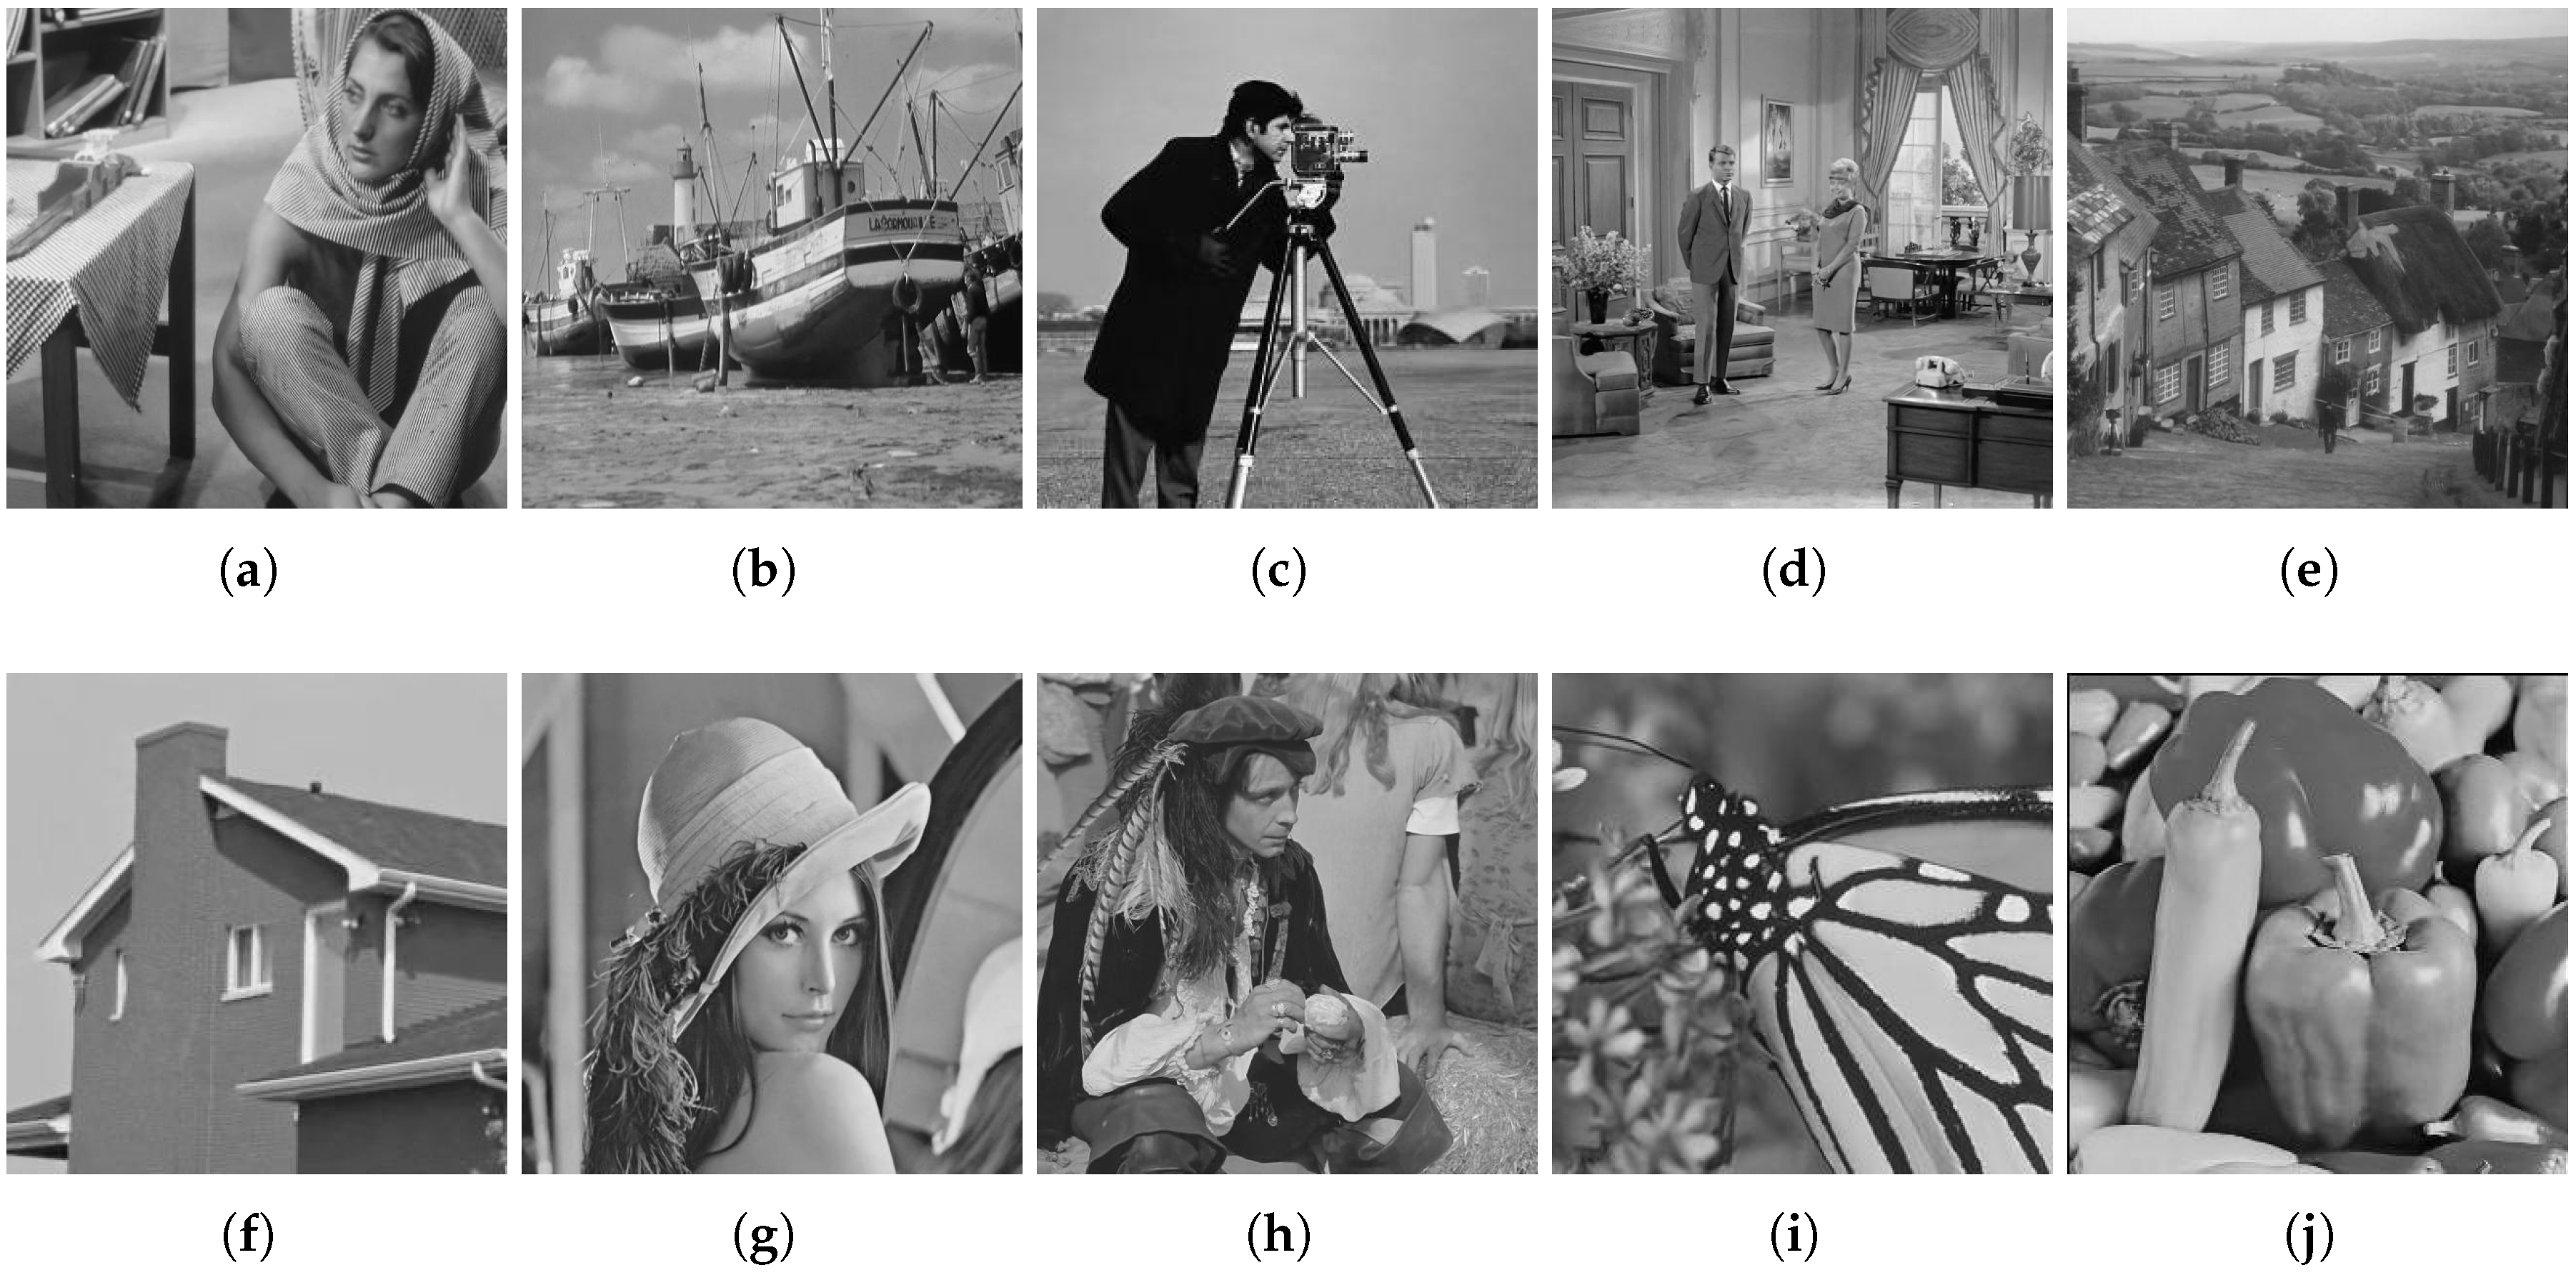
Referring to the two widely used test datasets and the ESPL synthetic image database [42], we derived our test images to evaluate the denoising performance of the proposed method and that of several competing methods. The first datasets contains ten natural images that are commonly used to study image denoising, including four images with a size of 256 × 256 ( C a m e r a m a n , H o u s e , M o n a r c h and P e p p e r s ), and six images with a size of 512 × 512 ( B a r b a r a , B o a t , C o u p l e , H i l l , L e n a , and M a n ), as shown in Figure 4. The second one is a set of 50 natural images selected from the Berkeley segmentation dataset (BSD) [43]. The third dataset contains 25 high quality synthetic color images obtained from the Internet, which generally comprised 1920 × 1080 pixels. The images are primarily selected from some popular animation movies and video games. All of the images contain both repetitive patterns and irregular textures. Some examples can be seen in Figure 5.
We compare the denoising performance of our proposed method with that of seven state-of-the-art and representative denoising methods, including BM3D [5], NCSR [15], WNNM [7], PGPD [17], DnCNN [27], TWSC [14], and FFDNet [26]. The denoising results of all the competing algorithms are generated using the source codes released by their original authors, and we use the default parameters. To quantitatively evaluate the visual quality of the images denoised via the different methods, the assessing index peak signal to noise ratio (PSNR) is used. This is defined as follows:
P S N R = 255 2 1 M N i = 1 M j = 1 N ( μ i , j x i , j ) 2 ( dB )
where μ i , j and x i , j represent the pixel values of the restored image and the original image respectively, and the size of the input image is M × N . We also calculated the structural similarity index measurement (SSIM) [44], the feature similarity index measurement (FSIM) [45], the visual information fidelity (VIF) [46] and the information content weighting SSIM (IW-SSIM) [47] of the competing methods. These metrics provide quality measurements closer to the characteristics of human vision, enabling further evaluation of the denoising performance. For all these aforementioned indexes, larger values indicate that the denoised images will appear more similar to their original ones in terms of human vision. The basic parameter setting is as follows: the number of images N is two and the pixel intensity I n ( x , y ) is normalized to the range of [0, 1]. We conducted experiments to determine the best PSNR value with respect to changes in α in the range of [0.25, 1.25]. The experimental results show that a larger α leads to a higher PSNR. However, it is a comparatively minor improvement. For the stability and robustness of the experimental results, α is set to the middle value 0.75. The exponents p 1 and p 2 in Equation (9) determine which of the two weights has a greater influence on the final weight map. As these two weights play the same role in our weight combination, we set p 1 = p 2 = 1 to consider the two weights as equally important. We carried out our experiments in MATLAB (R2018a) environment using a PC with a 4.00 GHz Intel Core i7-6700K CPU, 16 GB of RAM, and an Nvidia Quadro M4000 GPU.

4.2. Quantitative Comparison with Other State-of-the-Art Algorithms

In this subsection, we first elucidate the testing of the proposed method and its competing methods on ten commonly used test images. AWGN, with the noise levels σ = 10, 20, 30, 40, 50, and 60, is added to these test images. The highest values obtained for each noise level are highlighted in bold in each of the tables. Table 1 lists the PSNR values for the test images B o a t , C o u p l e , M a n , M o n a r c h , and P e p p e r s for the noise level σ = 10, 30, and 50. It can be observed that the best PSNR values are obtained by our method for all these images. From the average PSNR values shown in Table 2, the following observations can be made. First, the proposed method surpasses the NCSR, PGPD, and BM3D by a substantial margin, and it also outperforms WNNM, DnCNN, TWSC, and FFDNet by an average of approximately 0.31∼0.53 dB for a wide range of noise levels. Second, the proposed method has higher PSNR values than BM3D, NCSR, PGPD, WNNM, DnCNN, and TWSC, and it is only slightly inferior to the FFDNet when the noise level σ is set to 60. However, it gradually outperforms the FFDNet when σ < 60 , and the proposed method performs exceptionally with regard to low-noise-level denoising.
Table 3 presents the average SSIM and FSIM values obtained for eight methods under six different noise levels. It can be seen that the proposed method and FFDNet have a comparable performance with regard to the SSIM. Particularly, in terms of the FSIM, the best result is achieved by our method. This validates the excellent denoising performance of the proposed method, which considers both local structural preservation and global luminance consistency.
Table 4 lists the average VIF and IW-SSIM values obtained for the competing methods, for various denoising tasks carried out at six different noise levels. The proposed method outperforms TWSC, PGPD, and BM3D by a substantial margin. It demonstrates a noticeable denoising effect in low-noise-level denoising tasks; particularly, in terms of VIF, when the noise level is set to 40 and 50, our method surpasses the benchmark method BM3D by 0.085 and 0.060, respectively. Regarding images with a low noise level, many details are intact in the final image obtained using our method; thus, our method is able to eliminate the inaccuracy and uncertainty in denoised images obtained using the individual methods, thereby preserving the image details to the maximum extent.
To further demonstrate the general applicability of our method, we employed 50 images from the BSD dataset. The PSNR performance of the eight competing denoising methods is reported in Table 5. An overall impression, obtained from Table 5, is that the proposed method achieves the highest PSNR in all cases. In the case of low noise levels ( σ = 10 ), the improvement is strikingly noticeable (e.g., an average improvement of 1.14 dB over the second-best method, FFDNet). Subsequently, even as the noise level increases to 50 and 60, the improvements exhibited by the proposed method over the PSNR of FFDNet are notable, with the average values of 0.13 dB and 0.03 dB, respectively. It is also observed that the proposed method outperforms the benchmark BM3D method by 0.65 dB∼1.33 dB. Such a gain in the PSNR is remarkable because only a few methods can exceed the PSNR of the BM3D method by an average of more than 0.3 dB [48,49]. In addition, we calculated the metrics VIF and IW-SSIM to further assess the performance of our method. From Table 6, it is clear that the result obtained using the proposed boosting method is more pleasing than the denoised image obtained using either DnCNN or NCSR. A majority of the best metric values are also achieved by our method.
In addition to considering traditional datasets, we also evaluated the performance of our method on synthetic images. The PSNR results are reported in Table 7. The experiments conducted at low ( σ = 10 ) and high ( σ = 50 ) noise levels show that the proposed method outperforms all of the 7 comparable methods. Moreover, in terms of the average PSNR results, our method is the best among all the competitors. The proposed boosting method is able to boost the PSNR value by an approximate average of 0.68 and 0.17 compared to NCSR and DnCNN, respectively. The experimental results demonstrate that the proposed method can achieve a state-of-the-art denoising performance in different datasets. Thus, our method possesses a high generalizability and applicability.

4.3. Comparison of Statistical Significance with Other State-of-the-Art Algorithms

Although the proposed method demonstrates performance improvements over the performance of the existing methods considered in this study (see Table 1, Table 2, Table 3, Table 4, Table 5, Table 6 and Table 7), these improvements may not be statistically relevant. Therefore, we performed a two-way analysis of variance (ANOVA) (and multiple subsequent comparison tests [50]) on the PSNR results shown in Table 2 to determine the statistical significance of the results obtained using the proposed method. The corresponding results are tabulated in Table 8. ANOVA is a statistical analysis method that allows us to interpret and analyze observations made from several populations. It decomposes the observed results into contributions from different sources; then, it determines whether there is a significant difference between the sources of variation or not. Furthermore, it gives a value indicating the amount of variation. In our experiments, a criterion based on the p-value obtained using the results of the ANOVA is used to evaluate the statistical significance. From Table 8, it can be seen that the p-values of the paired ANOVA test for evaluating the difference between our method and the comparison methods are all less than 0.05. This demonstrates that the results obtained using the proposed boosting method are statistically significant.

4.4. Visual Comparison with Other State-of-the-Art Algorithms

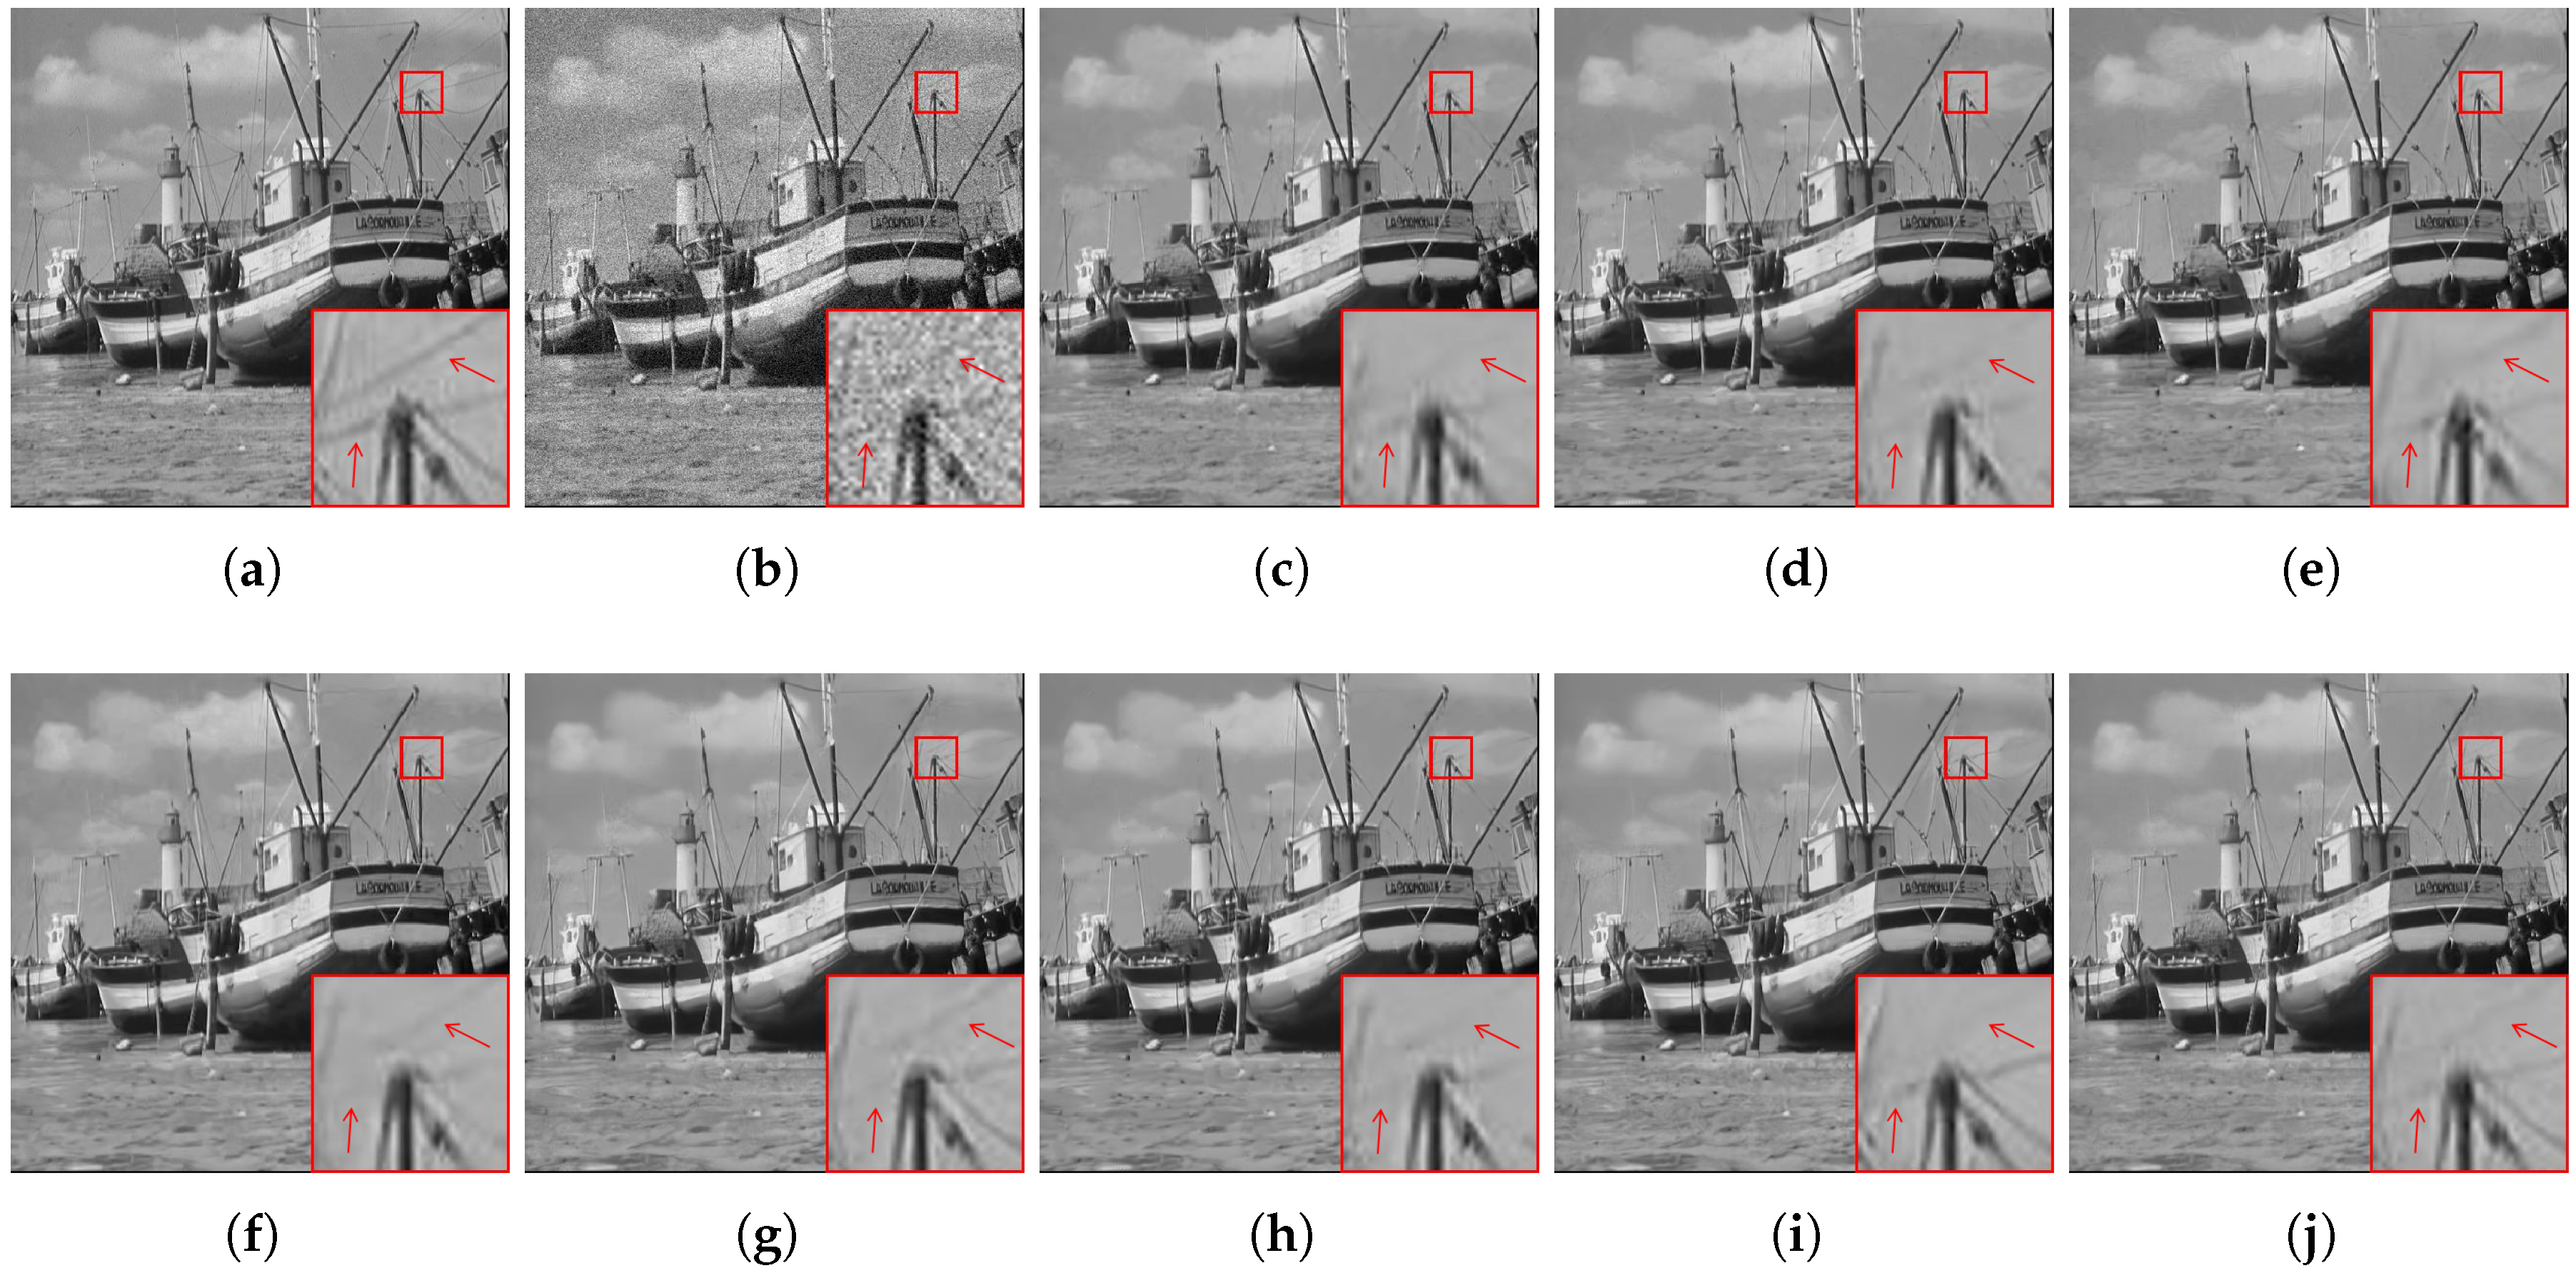
As the ultimate judges of image quality are human subjects, visual quality is also critical in evaluating a denoising method. Therefore, we focus on the visual comparison of the images denoised by the eight competing methods in this study. The results of the experiment at the noise level σ = 20 for the test image B o a t , shown in Figure 6, illustrate that the proposed method can preserve the contrast and structural details almost entirely. Comparing our method with other methods, it can be observed that the results of the NCSR and PGPD have lost several image details, whereas BM3D, WNNM, DnCNN, and TWSC produced over-smoothed results in the highlighted red window. Furthermore, FFDNet tends to generate several artifacts on the sign of the boat, where the proposed method obtains a smooth result. Particularly, the proposed method can recover well the thin masts of the boat. These masts are almost absent in the recovered images obtained by other methods.
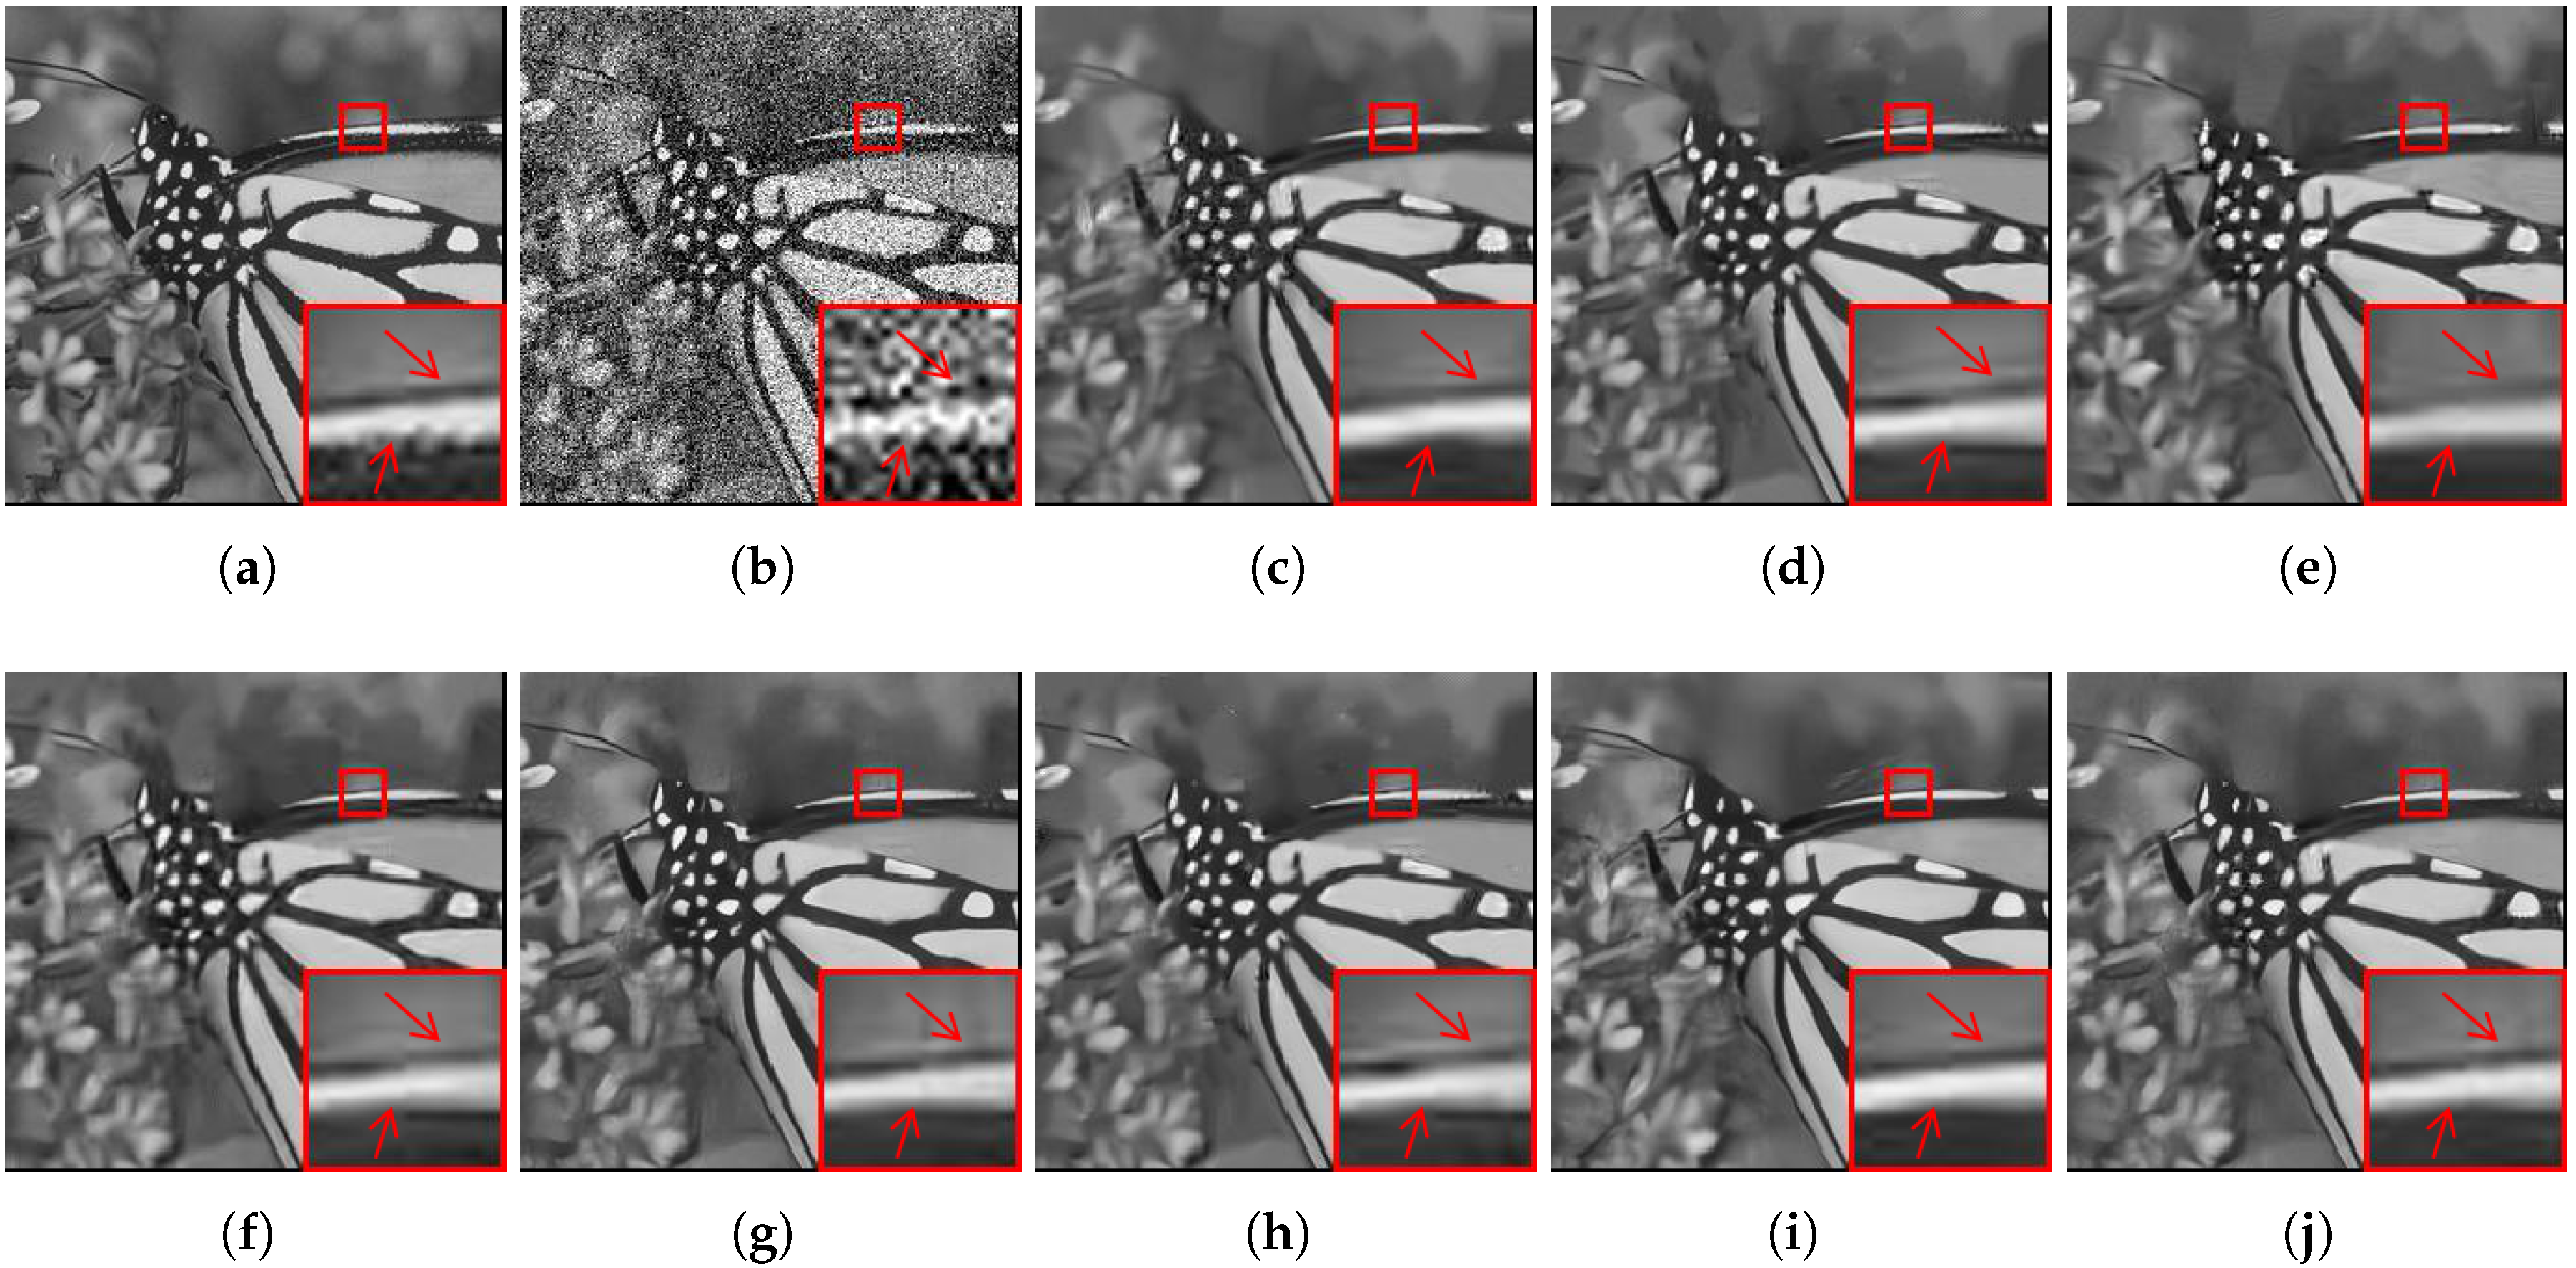
Subsequently, we increased the noise level to 50. It can be observed from Figure 7 that PGPD, BM3D, NCSR, and FFDNet tend to smooth the edges and textures, which leads to image blurring. Although DnCNN, TWSC, and WNNM better balance the contrast, they generate substantial artifacts on the flower in the image M o n a r c h . In contrast, the proposed method can well reconstruct the vein-like patterns in the butterfly’s wing that are shown in the magnified view; furthermore, the proposed method better preserves the edge structures of the test image. Overall, the proposed method produces denoised images of the best visual quality while maintaining high PSNR indices.
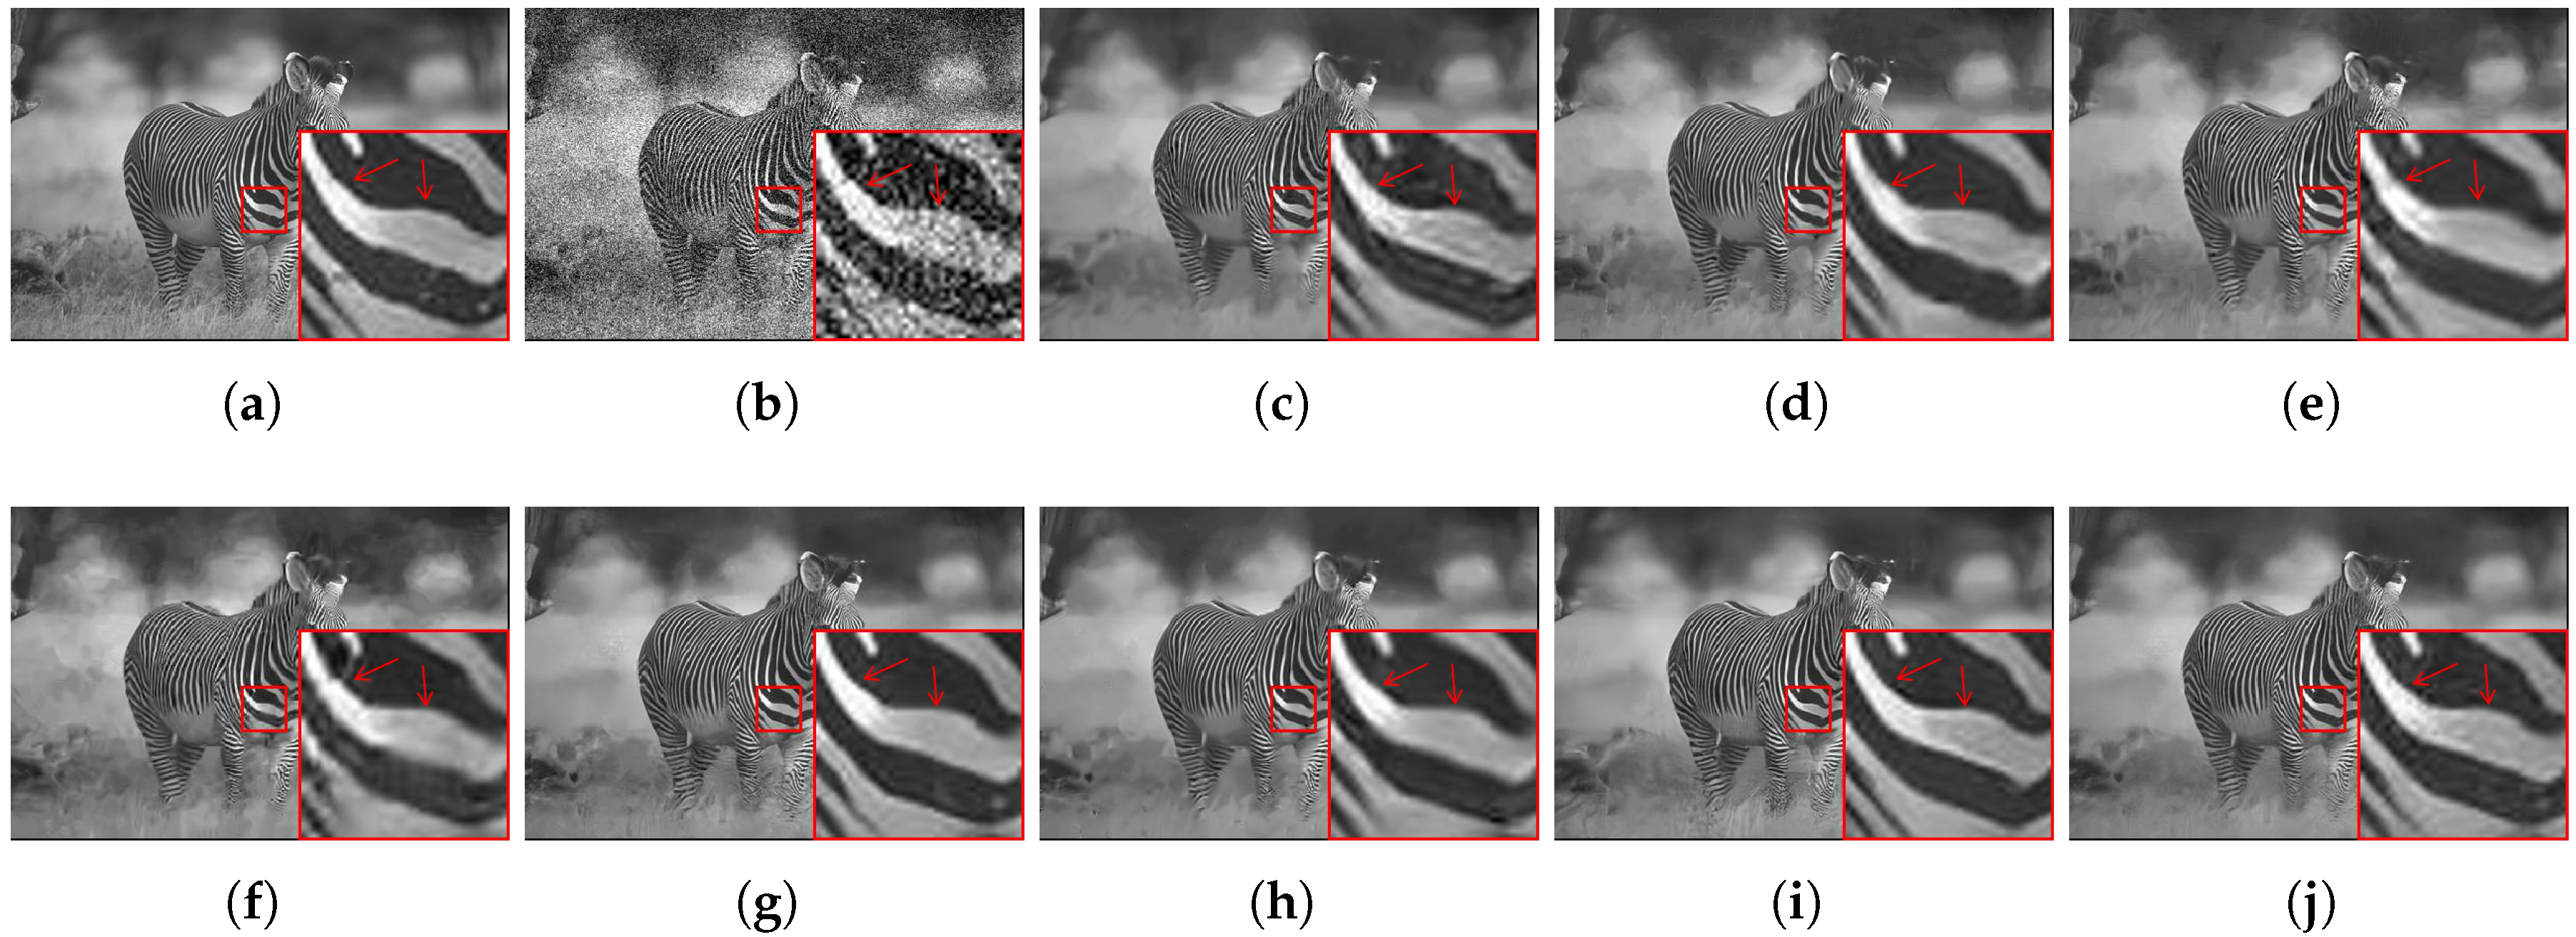
In addition, we test our method on the BSD dataset. It is clear from the results that the proposed method exhibits a visual performance that is superior to that of the other denoising methods. Visual comparisons of the results obtained using the various denoising methods are shown in Figure 8. It can be seen that NCSR generates substantial artifacts between the zebra’s stripes, and DnCNN balances the contrast well; nevertheless, it tends to distort the lines and generate blurred edges. It is not surprising that our method can preserve much more sharp edges and fine details because it is a combination of NCSR and DnCNN via the proposed fusion strategy, which is highly promising.
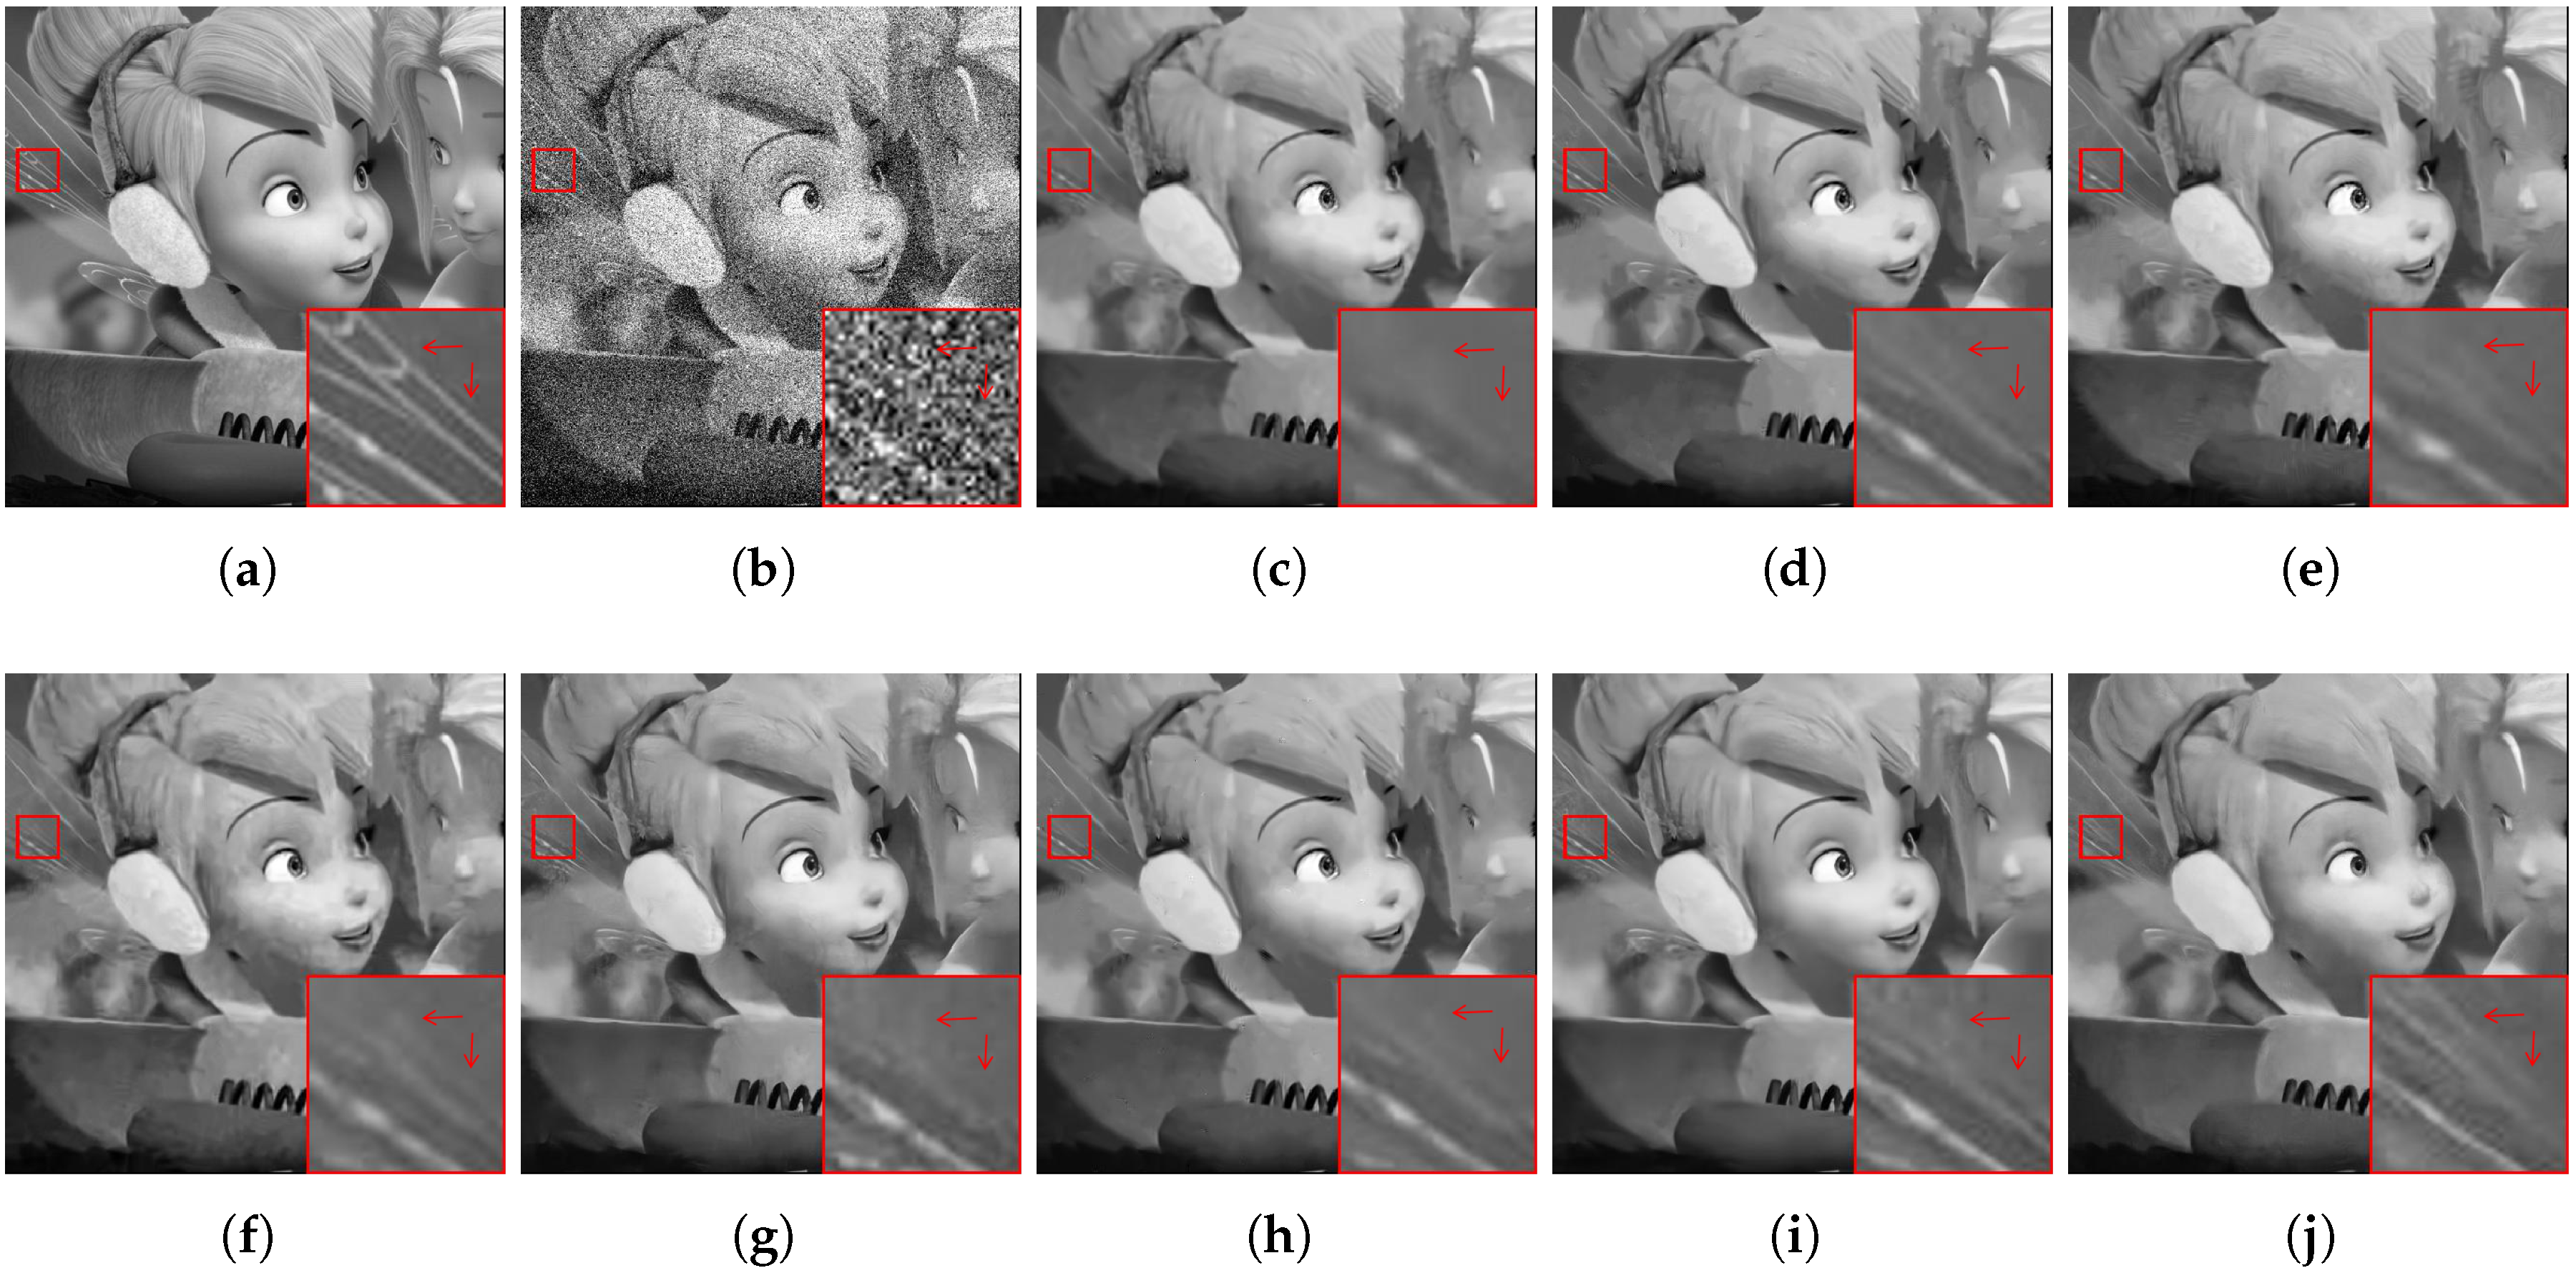
For visual comparison, Figure 9 shows the denoised images, corresponding to an image in the ESPL synthetic image database, that were obtained using the various methods evaluated in this study. A magnified view is also provided for each image for better visual comparison. It can be seen that a number of noise pixels have not been removed in the images denoised by NCSR, PGPD, BM3D, and TWSC; moreover, details have been extensively lost in the lower right corner of the image. Regarding the denoised image obtained using FFDNet, many undesirable bright pixels are generated on the wings of the cartoon girl. Furthermore, WNNM and DnCNN produce over-smoothed textures and edges. By comparison, the result obtained using the proposed method retains the information in the original image to the greatest extent and suppresses almost all the noise, even at a high noise level. One of the reasons for this is that our weight map can incorporate the well-denoised pixels into the final result.

5. Discussion

There are two important indicators of denoising performance: the denoising effect and computational complexity. Unfortunately, a high denoising performance is often obtained at the cost of computational complexity; therefore, the development of denoising methods is a spiraling process. The current denoising models must seek a reasonable trade-off between denoising performance and run time. This encourages researchers to continue to focus attention on improving the current state-of-the-art models. The computation time of our method comprises the fusion time of the initially denoised images and the running time of NCSR and DnCNN; therefore, it is longer than the running time of the single denoiser. However, unlike several deep learning-based boosting methods, the fusion step in the proposed method does not involve the training stage, which is time-consuming. The fusion times of our method for processing six images selected from the ten commonly used test images employed in this study, with sizes of 256 × 256 and 512 × 512 , are listed in Table 9. We evaluate the fusion time by denoising the ten images with noise levels of 10, 30, and 60. It can be seen that the fusion process takes very little time; therefore, the computational complexity mainly depends on the two algorithms to be fused. Our goal is to introduce a novel method for boosting the denoising effect using an image fusion strategy. With the evolution of the denoising methods to be fused, the efficiency of our method will increase. The proposed method allows the combination of the initial denoised images generated by any two image denoisers; thus, one can train two complementary algorithms that are different from the ones employed in this study and use our method to boost the denoising effect. In summary, the proposed method achieves optimal results at a reasonable computational cost; furthermore, it allows for an effective performance/complexity trade-off in the future.
Whereas image denoising algorithms have produced highly promising results over the past decade, it is worth mentioning that it has become increasingly difficult for several denoising methods to achieve even minor performance improvements. According to Levin et al. [49], when compared over the BSD dataset, for σ = 50 , the predicted maximal possible improvement (over the performance of BM3D) for external denoising tasks is bounded by 0.7 dB. However, the proposed method exceeds the performance of BM3D by 0.77 dB, as shown in Table 5, which is a substantial improvement. Through the image fusion strategy, our method offers a solution to further improve individual internal or external denoising algorithms. The fused image can provide a visually better output image that contains more information. Therefore, it is worth achieving a more specific and accurate result using our method at the reasonable computational cost. In fact, there are abundant real-world applications (e.g., machine vision, remote sensing, and medical diagnoses) that can benefit from the proposed method. Specifically, in digital medical treatment, the detailed features in images may be ignored by the NCSR algorithm, which is based on the non-local self-similarity of images; however, such features can be preserved by the external denoising method DnCNN. Thus, the proposed method can output better and more comprehensive images by combing the complementary information of the medical images denoised by the two methods, thereby providing more accurate data for clinical diagnosis and treatment. This will be crucial for feature extraction from images of lesions, three-dimensional reconstruction and multi-source medical image fusion, and other technologies that assist in diagnosis. Thus, the proposed method could be of immense value with regard to providing an alternative for boosting the denoising effect.
The boosting algorithm developed in this study can be interpreted as an algorithm for the fusion of two initially denoised images. Thus, it is not limited to the noise models of algorithms such as AWGN, and can be adapted to other types of noise if it is allowed by the constituent denoising algorithms. In addition, a good discrimination between noise and image texture information can significantly improve the noise reduction effect, which is also the goal of many traditional denoising algorithms. Currently, researchers are continuing to improve the performance of the state-of-the-art denoising methods. In the future, we will determine complementary algorithms with better performances to deal with various denoising tasks by using our fusion strategy.
6. Conclusions and Future Studies

In this study, a denoising effect boosting method based on an image fusion strategy has been presented to combine two image denoising methods (i.e., NCSR and DnCNN) for a better denoising performance. It is based on two weight designs. The first weight design measures the importance of the pixel values according to the overall luminance, and it increases the weight when the neighboring pixel intensity changes largely. The second weight design reflects the importance of the regions with substantial variations in pixel values and suppresses the saturated pixels in the initial denoised images. By integrating the images denoised via NCSR and DnCNN into an optimally fused image, the final denoised output is produced. The experimental results confirm that the proposed method exhibits substantial quantitative improvements over the other state-of-the-art methods, in addition to producing high-quality fused denoised images with much better image structures and less visual artifacts.
The proposed method is based on a general image fusion strategy. This indicates that it is not limited to image denoising problems. In future research, it is reasonable to extend the proposed boosting method to image de-blurring or image super-resolution problems. Future work could also involve choosing more efficient complementary algorithms or parallel implementations to further improve the computational efficiency of the proposed method. There is no single method that always performs better than others in complex imaging scenarios. Our method offers a solution to integrate individual methods that have complementary strengths into a stronger combined method. We also expect that a number of computer vision applications can benefit from the proposed denoising effect boosting method.

Author Contributions

Conceptualization, F.Y. and S.X.; methodology, S.X.; investigation, F.Y. and S.X.; writing—original draft preparation, F.Y.; software, C.L.; validation, F.Y. and C.L.; writing—review and editing, F.Y. and S.X.; resources, F.Y. and S.X.; supervision, S.X.; project administration, S.X. All authors have read and agreed to the published version of the manuscript.

Funding

This work was supported by the National Natural Science Foundation of China under Grants 61662044 and 61163023, and in part by Jiangxi Provincial Natural Science Foundation under Grant 20171BAB202017.

Acknowledgments

The authors would like to thank the anonymous reviewers and AE for their constructive comments and suggestions, which improve the quality of the paper.

Conflicts of Interest

The authors declare no conflict of interest.

References

  1. Healey, G.E.; Kondepudy, R. Radiometric CCD camera calibration and noise estimation. IEEE Trans. Pattern Anal. Mach. Intell. 1994, 16, 267–276. [Google Scholar] [CrossRef] [Green Version]
  2. Mosseri, I.; Zontak, M.; Irani, M. Combining the power of internal and external denoising. In Proceedings of the 2013 IEEE International Conference on Computational Photography (ICCP), Cambridge, MA, USA, 19–21 April 2013; IEEE: Piscataway, NJ, USA, 2013; pp. 1–9. [Google Scholar]
  3. Buades, A.; Coll, B.; Morel, J.M. A non-local algorithm for image denoising. In Proceedings of the 2005 IEEE Computer Society Conference on Computer Vision and Pattern Recognition, CVPR 2005, San Diego, CA, USA, 20–26 June 2005. [Google Scholar]
  4. Buades, A.; Coll, B.; Morel, J.M. A review of image denoising algorithms, with a new one. Multiscale Model. Simul. 2005, 4, 490–530. [Google Scholar] [CrossRef]
  5. Dabov, K.; Foi, A.; Katkovnik, V.; Egiazarian, K. Image denoising by sparse 3-D transform-domain collaborative filtering. IEEE Trans. Image Process. 2007, 16, 2080–2095. [Google Scholar] [CrossRef] [PubMed]
  6. Ji, H.; Liu, C.; Shen, Z.; Xu, Y. Robust video denoising using low rank matrix completion. In Proceedings of the 2010 IEEE Computer Society Conference on Computer Vision and Pattern Recognition, San Francisco, CA, USA, 13–18 June 2010; IEEE: Piscataway, NJ, USA, 2010; pp. 1791–1798. [Google Scholar]
  7. Gu, S.; Zhang, L.; Zuo, W.; Feng, X. Weighted nuclear norm minimization with application to image denoising. In Proceedings of the IEEE Conference on Computer Vision and Pattern Recognition, Columbus, OH, USA, 23–28 June 2014; pp. 2862–2869. [Google Scholar]
  8. Aharon, M.; Elad, M.; Bruckstein, A. K-SVD: An algorithm for designing overcomplete dictionaries for sparse representation. IEEE Trans. Signal Process. 2006, 54, 4311–4322. [Google Scholar] [CrossRef]
  9. Elad, M.; Aharon, M. Image denoising via learned dictionaries and sparse representation. In Proceedings of the 2006 IEEE Computer Society Conference on Computer Vision and Pattern Recognition (CVPR’06), New York, NY, USA, 17–22 June 2006; IEEE: Piscataway, NJ, USA, 2006; Volume 1, pp. 895–900. [Google Scholar]
  10. Chatterjee, P.; Milanfar, P. Clustering-Based Denoising With Locally Learned Dictionaries. IEEE Trans. Image Process. 2009, 18, 1438–1451. [Google Scholar] [CrossRef]
  11. Takeda, H.; Farsiu, S.; Milanfar, P. Kernel regression for image processing and reconstruction. IEEE Trans. Image Process. 2007, 16, 349–366. [Google Scholar] [CrossRef] [Green Version]
  12. Mairal, J.; Elad, M.; Sapiro, G. Sparse representation for color image restoration. IEEE Trans. Image Process. 2007, 17, 53–69. [Google Scholar] [CrossRef] [Green Version]
  13. Mairal, J.; Bach, F.; Ponce, J.; Sapiro, G.; Zisserman, A. Non-local sparse models for image restoration. In Proceedings of the 2009 IEEE 12th International Conference on Computer Vision, Kyoto, Japan, 27 September–4 October 2009; IEEE: Piscataway, NJ, USA, 2009; pp. 2272–2279. [Google Scholar]
  14. Xu, J.; Zhang, L.; Zhang, D. A trilateral weighted sparse coding scheme for real-world image denoising. In Proceedings of the 15th European Conference on Computer Vision (ECCV), Munich, Germany, 8–14 September 2018; pp. 20–36. [Google Scholar]
  15. Dong, W.; Zhang, L.; Shi, G.; Li, X. Nonlocally centralized sparse representation for image restoration. IEEE Trans. Image Process. 2012, 22, 1620–1630. [Google Scholar] [CrossRef] [Green Version]
  16. Zoran, D.; Weiss, Y. From Learning Models of Natural Image Patches to Whole Image Restoration. In Proceedings of the IEEE International Conference on Computer Vision, ICCV 2011, Barcelona, Spain, 6–13 November 2011. [Google Scholar]
  17. Xu, J.; Zhang, L.; Zuo, W.; Zhang, D.; Feng, X. Patch group based nonlocal self-similarity prior learning for image denoising. In Proceedings of the IEEE International Conference on Computer Vision, Santiago, Chile, 11–18 December 2015; pp. 244–252. [Google Scholar]
  18. Jain, V.; Seung, S. Natural image denoising with convolutional networks. In Proceedings of the Advances in Neural Information Processing Systems, Vancouver, BC, Canada, 8–11 December 2008; pp. 769–776. [Google Scholar]
  19. Xie, J.; Xu, L.; Chen, E. Image denoising and inpainting with deep neural networks. In Proceedings of the Advances in Neural Information Processing Systems, Lake Tahoe, NV, USA, 3–6 December 2012; pp. 341–349. Available online: http://staff.ustc.edu.cn/~linlixu/papers/nips12.pdf (accessed on 25 March 2020).
  20. Burger, H.C.; Schuler, C.J.; Harmeling, S. Image denoising: Can plain neural networks compete with BM3D? In Proceedings of the 2012 IEEE Conference on Computer Vision and Pattern Recognition, Providence, RI, USA, 16–21 June 2012; IEEE: Piscataway, NJ, USA, 2012; pp. 2392–2399. [Google Scholar]
  21. Schmidt, U.; Roth, S. Shrinkage fields for effective image restoration. In Proceedings of the IEEE Conference on Computer Vision and Pattern Recognition, Columbus, OH, USA, 23–28 June 2014; pp. 2774–2781. [Google Scholar]
  22. Chen, Y.; Yu, W.; Pock, T. On learning optimized reaction diffusion processes for effective image restoration. In Proceedings of the IEEE Conference on Computer Vision and Pattern Recognition, Boston, MA, USA, 7–12 June 2015; pp. 5261–5269. [Google Scholar]
  23. Chen, Y.; Pock, T. Trainable nonlinear reaction diffusion: A flexible framework for fast and effective image restoration. IEEE Trans. Pattern Anal. Mach. Intell. 2016, 39, 1256–1272. [Google Scholar] [CrossRef] [Green Version]
  24. Yang, D.; Sun, J. BM3D-Net: A convolutional neural network for transform-domain collaborative filtering. IEEE Signal Process. Lett. 2017, 25, 55–59. [Google Scholar] [CrossRef]
  25. Santhanam, V.; Morariu, V.I.; Davis, L.S. Generalized deep image to image regression. In Proceedings of the IEEE Conference on Computer Vision and Pattern Recognition, Honolulu, HI, USA, 21–26 July 2017; pp. 5609–5619. [Google Scholar]
  26. Zhang, K.; Zuo, W.; Zhang, L. FFDNet: Toward a fast and flexible solution for CNN-based image denoising. IEEE Trans. Image Process. 2018, 27, 4608–4622. [Google Scholar] [CrossRef] [PubMed] [Green Version]
  27. Zhang, K.; Zuo, W.; Chen, Y.; Meng, D.; Zhang, L. Beyond a gaussian denoiser: Residual learning of deep cnn for image denoising. IEEE Trans. Image Process. 2017, 26, 3142–3155. [Google Scholar] [CrossRef] [PubMed] [Green Version]
  28. Ioffe, S.; Szegedy, C. Batch normalization: Accelerating deep network training by reducing internal covariate shift. arXiv 2015, arXiv:1502.03167. [Google Scholar]
  29. He, K.; Zhang, X.; Ren, S.; Sun, J. Deep residual learning for image recognition. In Proceedings of the IEEE Conference on Computer Vision and Pattern Recognition, Las Vegas, NV, USA, 27–30 June 2016; pp. 770–778. [Google Scholar]
  30. Chatterjee, P.; Milanfar, P. Is denoising dead? IEEE Trans. Image Process. 2009, 19, 895–911. [Google Scholar] [CrossRef]
  31. Chen, C.; Xiong, Z.; Tian, X.; Wu, F. Deep Boosting for Image Denoising. In Proceedings of the European Conference on Computer Vision, Munich, Germany, 8–14 September 2018. [Google Scholar]
  32. Krizhevsky, A.; Sutskever, I.; Hinton, G.E. Imagenet classification with deep convolutional neural networks. In Proceedings of the Advances in Neural Information Processing Systems, Lake Tahoe, NV, USA, 3–6 December 2012; pp. 1097–1105. Available online: https://papers.nips.cc/paper/4824-imagenetclassification-with-deep-convolutional-neural-networks.pdf (accessed on 20 March 2020).
  33. Simonyan, K.; Zisserman, A. Very deep convolutional networks for large-scale image recognition. arXiv 2014, arXiv:1409.1556. [Google Scholar]
  34. Szegedy, C.; Liu, W.; Jia, Y.; Sermanet, P.; Reed, S.; Anguelov, D.; Erhan, D.; Vanhoucke, V.; Rabinovich, A. Going deeper with convolutions. In Proceedings of the IEEE Conference on Computer Vision and Pattern Recognition, Boston, MA, USA, 7–12 June 2015; pp. 1–9. [Google Scholar]
  35. Duchi, J.; Hazan, E.; Singer, Y. Adaptive subgradient methods for online learning and stochastic optimization. J. Mach. Learn. Res. 2011, 12, 2121–2159. [Google Scholar]
  36. Zeiler, M.D. Adadelta: An adaptive learning rate method. arXiv 2012, arXiv:1212.5701. [Google Scholar]
  37. Kingma, D.P.; Ba, J. Adam: A method for stochastic optimization. arXiv 2014, arXiv:1412.6980. [Google Scholar]
  38. He, K.; Zhang, X.; Ren, S.; Sun, J. Delving deep into rectifiers: Surpassing human-level performance on imagenet classification. In Proceedings of the IEEE International Conference on Computer Vision, Santiago, Chile, 11–18 December 2015; pp. 1026–1034. [Google Scholar]
  39. Mertens, T.; Kautz, J.; Reeth, F.V. Exposure Fusion: A Simple and Practical Alternative to High Dynamic Range Photography. Comput. Graph. Forum 2008, 28, 161–171. [Google Scholar] [CrossRef]
  40. Raman, S.; Chaudhuri, S. Bilateral Filter Based Compositing for Variable Exposure Photography. In Proceedings of the Eurographics (Short Papers), Munich, Germany, 30 March–3 April 2009; pp. 1–4. Available online: https://www.ee.iitb.ac.in/student/~shanmuga/EG09.pdf (accessed on 20 March 2020).
  41. Zhang, W.; Cham, W.K. Gradient-directed multiexposure composition. IEEE Trans. Image Process. 2011, 21, 2318–2323. [Google Scholar] [CrossRef]
  42. Kundu, D.; Evans, B.L. Spatial domain synthetic scene statistics. In Proceedings of the Conference on Signals, Pacific Grove, CA, USA, 8–11 November 2015. [Google Scholar]
  43. Arbelaez, P.; Maire, M.; Fowlkes, C.; Malik, J. Contour detection and hierarchical image segmentation. IEEE Trans. Pattern Anal. Mach. Intell. 2010, 33, 898–916. [Google Scholar] [CrossRef] [PubMed] [Green Version]
  44. Wang, Z.; Bovik, A.C.; Sheikh, H.R.; Simoncelli, E.P. Image quality assessment: From error visibility to structural similarity. IEEE Trans. Image Process. 2004, 13, 600–612. [Google Scholar] [CrossRef] [Green Version]
  45. Zhang, L.; Zhang, L.; Mou, X.; Zhang, D. FSIM: A feature similarity index for image quality assessment. IEEE Trans. Image Process. 2011, 20, 2378–2386. [Google Scholar] [CrossRef] [PubMed] [Green Version]
  46. Sheikh, H.R.; Bovik, A.C. Image information and visual quality. IEEE Trans. Image Process. 2006, 15, 430–444. [Google Scholar] [CrossRef]
  47. Wang, Z.; Li, Q. Information Content Weighting for Perceptual Image Quality Assessment. IEEE Trans. Image Process. Publ. IEEE Signal Process. Soc. 2011, 20, 1185–1198. [Google Scholar]
  48. Levin, A.; Nadler, B. Natural image denoising: Optimality and inherent bounds. In Proceedings of the CVPR 2011, Colorado Springs, CO, USA, 20–25 June 2011; IEEE: Piscataway, NJ, USA, 2011; pp. 2833–2840. [Google Scholar]
  49. Levin, A.; Nadler, B.; Durand, F.; Freeman, W.T. Patch complexity, finite pixel correlations and optimal denoising. In Proceedings of the European Conference on Computer Vision, Florence, Italy, 7–13 October 2012; Springer: Berlin/Heidelberg, Germany, 2012; pp. 73–86. [Google Scholar]
  50. Saville, D.J. Multiple comparison procedures: The practical solution. Am. Stat. 1990, 44, 174–180. [Google Scholar]
Figure 1. Examples showing the effectiveness of the proposed booster in improving NCSR and DnCNN. (a) Original image. (b) Noisy image. (c) Input image denoised by NCSR, PSNR = 29.11 dB. (d) Input image denoised by DnCNN, PSNR = 29.50 dB. (e) Our final denoised result, PSNR = 30 . 04 dB. (f) Original image. (g) Corrupted image. (h) Input image denoised by NCSR, PSNR = 32.13 dB. (i) Input image denoised by DnCNN, PSNR = 32.26 dB. (j) Our final denoised result, PSNR = 33 . 29 dB.
Applsci 10 03857 g001
Figure 2. The architecture of DnCNN network.
Applsci 10 03857 g002
Figure 3. Overall framework of the proposed method.
Applsci 10 03857 g003
Figure 4. Ten commonly used testing images. (a) Barbara. (b) Boat. (c) Cameraman. (d) Couple. (e) Hill. (f) House. (g) Lena. (h) Man. (i) Monarch. (j) Peppers.
Applsci 10 03857 g004
Figure 5. (ad) The 4 imagesin the ESPL database.
Applsci 10 03857 g005
Figure 6. Comparison of denoising results of the competing methods for image B o a t with noise level σ = 20 . (a) Original image. (b) Noisy image. (c) NCSR, PSNR = 31.02 dB. (d) WNNM, PSNR = 31.31 dB. (e) PGPD, PSNR = 31.06 dB. (f) BM3D, PSNR = 31.21 dB. (g) DnCNN, PSNR = 31.44 dB. (h) TWSC, PSNR = 31.29 dB. (i) FFDNet, PSNR = 31.43 dB. (j) Proposed, PSNR = 31 . 76 dB.
Applsci 10 03857 g006
Figure 7. Comparison of denoising results of the competing methods for image M o n a r c h with noise level σ = 50 . (a) Original image. (b) Noisy image. (c) NCSR, PSNR = 25.69 dB. (d) WNNM, PSNR = 26.22 dB. (e) PGPD, PSNR = 25.97 dB. (f) BM3D, PSNR = 25.64 dB. (g) DnCNN, PSNR = 26.65 dB. (h) TWSC, PSNR = 26.16 dB. (i) FFDNet, PSNR = 26.65 dB. (j) Proposed, PSNR = 26 . 77 dB.
Applsci 10 03857 g007
Figure 8. Comparison of denoising results of the competing methods for the test image with noise level σ = 40 . (a) Original image. (b) Noisy image. (c) NCSR, PSNR = 26.73 dB. (d) WNNM, PSNR = 27.46 dB. (e) PGPD, PSNR = 27.03 dB. (f) BM3D, PSNR = 26.55 dB. (g) DnCNN, PSNR = 27.85 dB. (h) TWSC, PSNR = 27.44 dB. (i) FFDNet, PSNR = 27.82 dB. (j) Proposed, PSNR = 28 . 35 dB.
Applsci 10 03857 g008
Figure 9. Comparison of denoising results of the competing methods for image selected from the ESPL synthetic image database with noise level σ = 50 . (a) Original image. (b) Noisy image. (c) NCSR, PSNR = 29.21 dB. (d) WNNM, PSNR = 29.76 dB. (e) PGPD, PSNR = 29.56 dB. (f) BM3D, PSNR = 29.39 dB. (g) DnCNN, PSNR = 29.94 dB. (h) TWSC, PSNR = 29.59 dB. (i) FFDNet, PSNR = 30.32 dB. (j) Proposed, PSNR = 30 . 62 dB.
Applsci 10 03857 g009
Table 1. Comparison of denoising results in terms of PSNR (dB) for five selected test images.
ImagesNoise LevelNCSRWNNMPGPDBM3DDnCNNTWSCFFDNetProposed
1034.6234.7734.4434.6534.6534.6934.68 35 . 90
Boat3029.0229.3729.1529.2429.6229.3929.64 29 . 94
5026.6226.9926.9126.8027.3526.9927.41 27 . 59
1034.3734.4434.3734.4334.5234.3834.54 34 . 88
Couple3028.6129.0328.8428.9429.3529.0229.43 29 . 67
5026.1426.5726.6026.3926.9626.5327.04 27 . 19
1034.2034.3134.1134.2034.3634.2434.41 35 . 20
Man3028.7728.9928.7928.8829.3228.9529.33 29 . 65
5026.6426.9026.8626.8027.2426.8827.26 27 . 47
1034.0734.2734.0533.8833.9934.0534.11 36 . 07
Monarch3028.2928.7928.4728.2228.9728.5729.00 29 . 08
5025.6926.2226.0225.6426.6526.1626.65 26 . 77
1034.9035.0534.8234.9834.9434.8834.85 36 . 40
Peppers3029.1229.4829.3729.2629.9229.4229.79 30 . 20
5026.5827.0526.8926.7427.3626.8827.41 27 . 59
Table 2. Average PSNRs (dB) of the competing methods evaluated on commonly used test images with noise level σ = 10, 20, 30, 40, 50 and 60.
NCSRWNNMPGPDBM3DDnCNNTWSCFFDNetProposed
σ = 10 34.8334.9534.7234.8434.7834.8534.85 35 . 71
σ = 20 31.3831.5931.3331.4231.6431.5631.70 31 . 92
σ = 30 29.4229.7929.4829.5629.8429.7329.92 30 . 22
σ = 40 28.0628.4628.2528.0928.5828.4228.67 28 . 96
σ = 50 27.0227.5027.2927.1627.5827.3827.69 27 . 91
σ = 60 26.0726.6726.4126.3826.2526.51 26 . 92 26.90
Table 3. Average SSIM/FSIM values obtained for the competing methods evaluated on commonly used test images with noise level σ = 10, 20, 30, 40, 50 and 60.
σ = 10 σ = 20 σ = 30 σ = 40 σ = 50 σ = 60
NCSR0.931/0.9720.875/0.9430.833/0.9190.796/0.8950.767/0.8790.742/0.860
WNNM0.931/0.9720.877/0.9440.839/0.9230.802/0.9020.778/0.8850.752/0.871
PGPD0.927/0.9720.870/0.9440.829/0.9220.797/0.9030.769/0.8870.741/0.874
BM3D0.931/0.9720.876/0.9460.834/0.9240.795/0.9030.767/0.8880.743/0.874
DnCNN0.931/0.9710.883/0.9460.844/0.9260.811/0.9080.782/0.8920.717/0.879
TWSC0.931/0.9720.879/0.9480.838/0.9220.804/0.9000.773/0.8810.745/0.864
FFDNet0.933/0.973 0 . 885 /0.948 0 . 848 /0.928 0 . 817 /0.910 0 . 790 /0.894 0 . 767 /0.881
proposed 0 . 936 / 0 . 976 0.883/ 0 . 951 0.847/ 0 . 932 0.815/ 0 . 913 0.788/ 0 . 897 0.750/ 0 . 888
Table 4. Average VIF/IW-SSIM values obtained for the competing methods evaluated on commonly used test images with noise level σ = 10, 20, 30, 40, 50 and 60.
σ = 10 σ = 20 σ = 30 σ = 40 σ = 50 σ = 60
NCSR0.637/0.9830.494/0.9590.413/0.9340.376/0.9100.343/0.8860.313/0.860
WNNM0.644/0.9830.492/0.9610.415/0.9400.358/0.9160.330/0.8970.299/0.875
PGPD0.622/0.9820.475/0.9590.403/0.9370.353/0.9140.320/0.8910.280/0.871
BM3D0.638/0.9830.481/0.9610.395/0.9380.325/0.9120.308/0.8920.280/0.871
DnCNN0.634/0.9840.484/0.9630.401/0.9430.346/0.9210.308/0.9000.221/0.871
TWSC0.578/0.9840.416/0.9360.333/0.9410.280/0.9180.242/0.8940.212/0.871
FFDNet0.636/0.9840.492/0.9640.417/0.9450.366/0.9240.333/0.904 0 . 309 /0.866
proposed 0 . 679 / 0 . 986 0 . 529 / 0 . 967 0 . 454 / 0 . 948 0 . 410 / 0 . 929 0 . 368 / 0 . 908 0.282/ 0 . 885
Table 5. Average PSNRs (dB) of the competing methods obtained for 50 images selected from the BSD dataset with noise level σ = 10, 20, 30, 40, 50 and 60.
NCSRWNNMPGPDBM3DDnCNNTWSCFFDNetProposed
σ = 10 33.4233.5333.3133.4233.4833.5433.61 34 . 75
σ = 20 29.5629.7229.5129.5429.7030.0030.02 30 . 30
σ = 30 27.6027.8027.5827.5927.7428.1228.15 28 . 38
σ = 40 26.2626.5326.3626.2526.4626.8826.92 27 . 08
σ = 50 25.3525.6325.4725.3925.5225.9826.03 26 . 16
σ = 60 24.6024.9124.8024.7224.7924.8625.34 25 . 37
Table 6. Average VIF/IW-SSIM values of the competing methods obtained for 50 images selected from the BSD dataset with noise level σ = 10, 20, 30, 40, 50 and 60.
σ = 10 σ = 20 σ = 30 σ = 40 σ = 50 σ = 60
NCSR0.605/0.9800.447/0.9450.363/0.9090.325/0.8710.292/0.837 0 . 264 /0.803
WNNM0.606/0.9810.438/0.9480.356/0.9140.304/0.8790.274/0.8480.247/0.816
PGPD0.594/0.9790.430/0.9450.351/0.9100.303/0.8760.271/0.8420.233/0.817
BM3D0.602/0.9810.433/0.9470.346/0.9120.285/0.8770.270/0.8440.241/0.815
DnCNN0.602/0.9820.437/0.9530.353/0.9220.303/0.8900.268/0.8600.187/0.830
TWSC0.558/0.9810.371/0.9490.278/0.9140.222/0.8780.184/0.8430.157/0.810
FFDNet0.603/0.9820.441/0.9540.361/0.9240.314/0.8940.282/0.8640.257/0.837
proposed 0 . 659 / 0 . 985 0 . 497 / 0 . 958 0 . 412 / 0 . 929 0 . 365 / 0 . 898 0 . 324 / 0 . 868 0.245/ 0 . 844
Table 7. Average PSNRs (dB) of the competing methods for images in the ESPL synthetic image database with noise level σ = 10, 30 and 50.
NCSRWNNMPGPDBM3DDnCNNTWSCFFDNetProposed
σ = 10 36.1436.3336.0336.3736.3736.3036.47 36 . 52
σ = 30 30.5930.9130.7330.7231.2330.92 31 . 38 31.02
σ = 50 28.2128.5328.4528.3028.8828.4429.08 29 . 45
Average31.6531.9231.7431.8032.1631.8932.31 32 . 33
Table 8. Multiple comparisons for Two-Way ANOVA of the average PSNRs (dB) of the commonly used test images.
Comparison MethodNCSRWNNMPGPDBM3DDnCNNTWSCFFDNet
p-value0.0000000.0000180.0000000.0000000.0000030.0000010.003448
Table 9. Fusion time (s) of the proposed method for processing the six selected images with sizes of 256 × 256 and 512 × 512 with noise level σ = 10, 30, and 60.
CameramanCoupleHouseLenaMonarchPeppersAverage
σ = 10 0.2530.6140.2550.5400.2700.2570.365
σ = 30 0.2600.5300.2570.5390.2570.2650.351
σ = 60 0.2600.5310.2590.5310.2890.2740.357