1. Introduction
The global incidence of gastric cancer and its subsequent mortality are high [
1,
2]. Furthermore, the incidence of gastric cancer increases with age and is expected to further increase with increasing life expectancy worldwide [
3]. Gastric cancer is assessed using X-rays or endoscopy. Endoscopic examination is especially important for the early detection of gastric cancer because of its high sensitivity [
4]. However, the number of possible daily endoscopic examinations is limited, as they must be performed by a specialist. Diagnoses can differ depending on the experience and the technique of the specialist; therefore, it is an important responsibility of the specialist. Furthermore, morphological changes in early gastric cancer are sometimes obscure; hence, there are also concerns about missing the early detection of gastric cancer. The miss rate of gastric cancer according to the endoscopic examination was 22.2%, even when two experts were involved in an endoscopic unit [
5]. Similar studies have shown that gastric cancer is overlooked at a certain rate during endoscopy [
6,
7,
8,
9]. Although endoscopic examination is an excellent tool for detecting gastric cancer, the aforementioned challenges remain. We believe that it is possible to overcome these challenges using computers.
Computer-aided diagnosis (CAD) is an effective method in this regard, as it involves the quantification and the analyses of imaging data by a computer. The results can be used by physicians as a diagnostic support tool. This method also overcomes the differences in diagnoses attributable to the differing skills and experiences of specialists. Many CAD schemes have introduced a deep learning approach [
10,
11,
12,
13,
14,
15,
16,
17,
18]. In a study involving gastric endoscopic images, Sakai et al. developed a patch-based classification algorithm using a convolutional neural network (CNN) to detect gastric cancer in endoscopic images [
16]. The result of the evaluation showed that the accuracy of the trained CNN was 87.6%. Yoon et al. also developed an automated detection and depth estimation method for gastric cancer using a CNN [
17]. They introduced the activation map using gradient-weighted class activation mapping to visualize the attention of the CNN. They revealed that the CNN focuses on the gastric cancer region correctly in detection.
Hirasawa et al. [
18] proposed an automated detection method for gastric cancer using a single-shot multi-box detector (SSD) for object detection and reported a sensitivity of 92.2% and a positive predictive value of 30.6%. The SSD discretizes the output space of bounding boxes into a set of default boxes over different aspect ratios and scales per feature map location. At the prediction stage, the network generates scores for the presence of each object category in each default box and enables adjustments to the box to better match the object shape. However, the high false-positive rate remains unaddressed. Furthermore, physicians cannot understand the invasive regions of gastric cancer from the bounding box provided by the previous method. To overcome these challenges, we focus on segmentation to correctly recognize and extract objects from images.
In this regard, several common segmentation techniques have been proposed. Long et al. proposed a fully convolutional neural network (FCN) [
19]. An FCN replaces the fully connected layer of a CNN with an up-sampling layer. Each pixel is labeled with the class of the enclosing object. This segmentation method is called “semantic segmentation.” Ronneberger et al. proposed U-Net as a semantic segmentation technology for biomedical images [
20]. U-Net has an encoder layer that performs down-sampling while extracting features from an image and a decoder layer that up-samples an image. A bypass connection is provided between the encoder and the decoder layers. This structure enables the segmentation of an object without dropping the resolution of an image. Because the above semantic segmentation methods process the entire image, there are challenges regarding the processing time. Furthermore, individual objects in an image cannot be identified. To solve the problem of semantic segmentation, He et al., researchers of Facebook, developed Mask R-CNN, which can segment an object region while detecting individual objects in an image [
21]. They won the Best Paper Award at the 16th International Conference on Computer Vision (ICCV) 2017. In the Mask R-CNN, the actual region is labeled in the mask layer after detecting an object in an image as a bounding box. Because the class name and the class probability can be obtained together with the bounding box, the reliability of detection can be enhanced. In addition, as the segmentation only needs to be performed inside the bounding box, the processing time can be reduced. In this study, we developed a method to automatically detect and segment gastric cancer regions from endoscopic images using Mask R-CNN as a diagnostic support method.
2. Materials and Methods
2.1. Method Outline
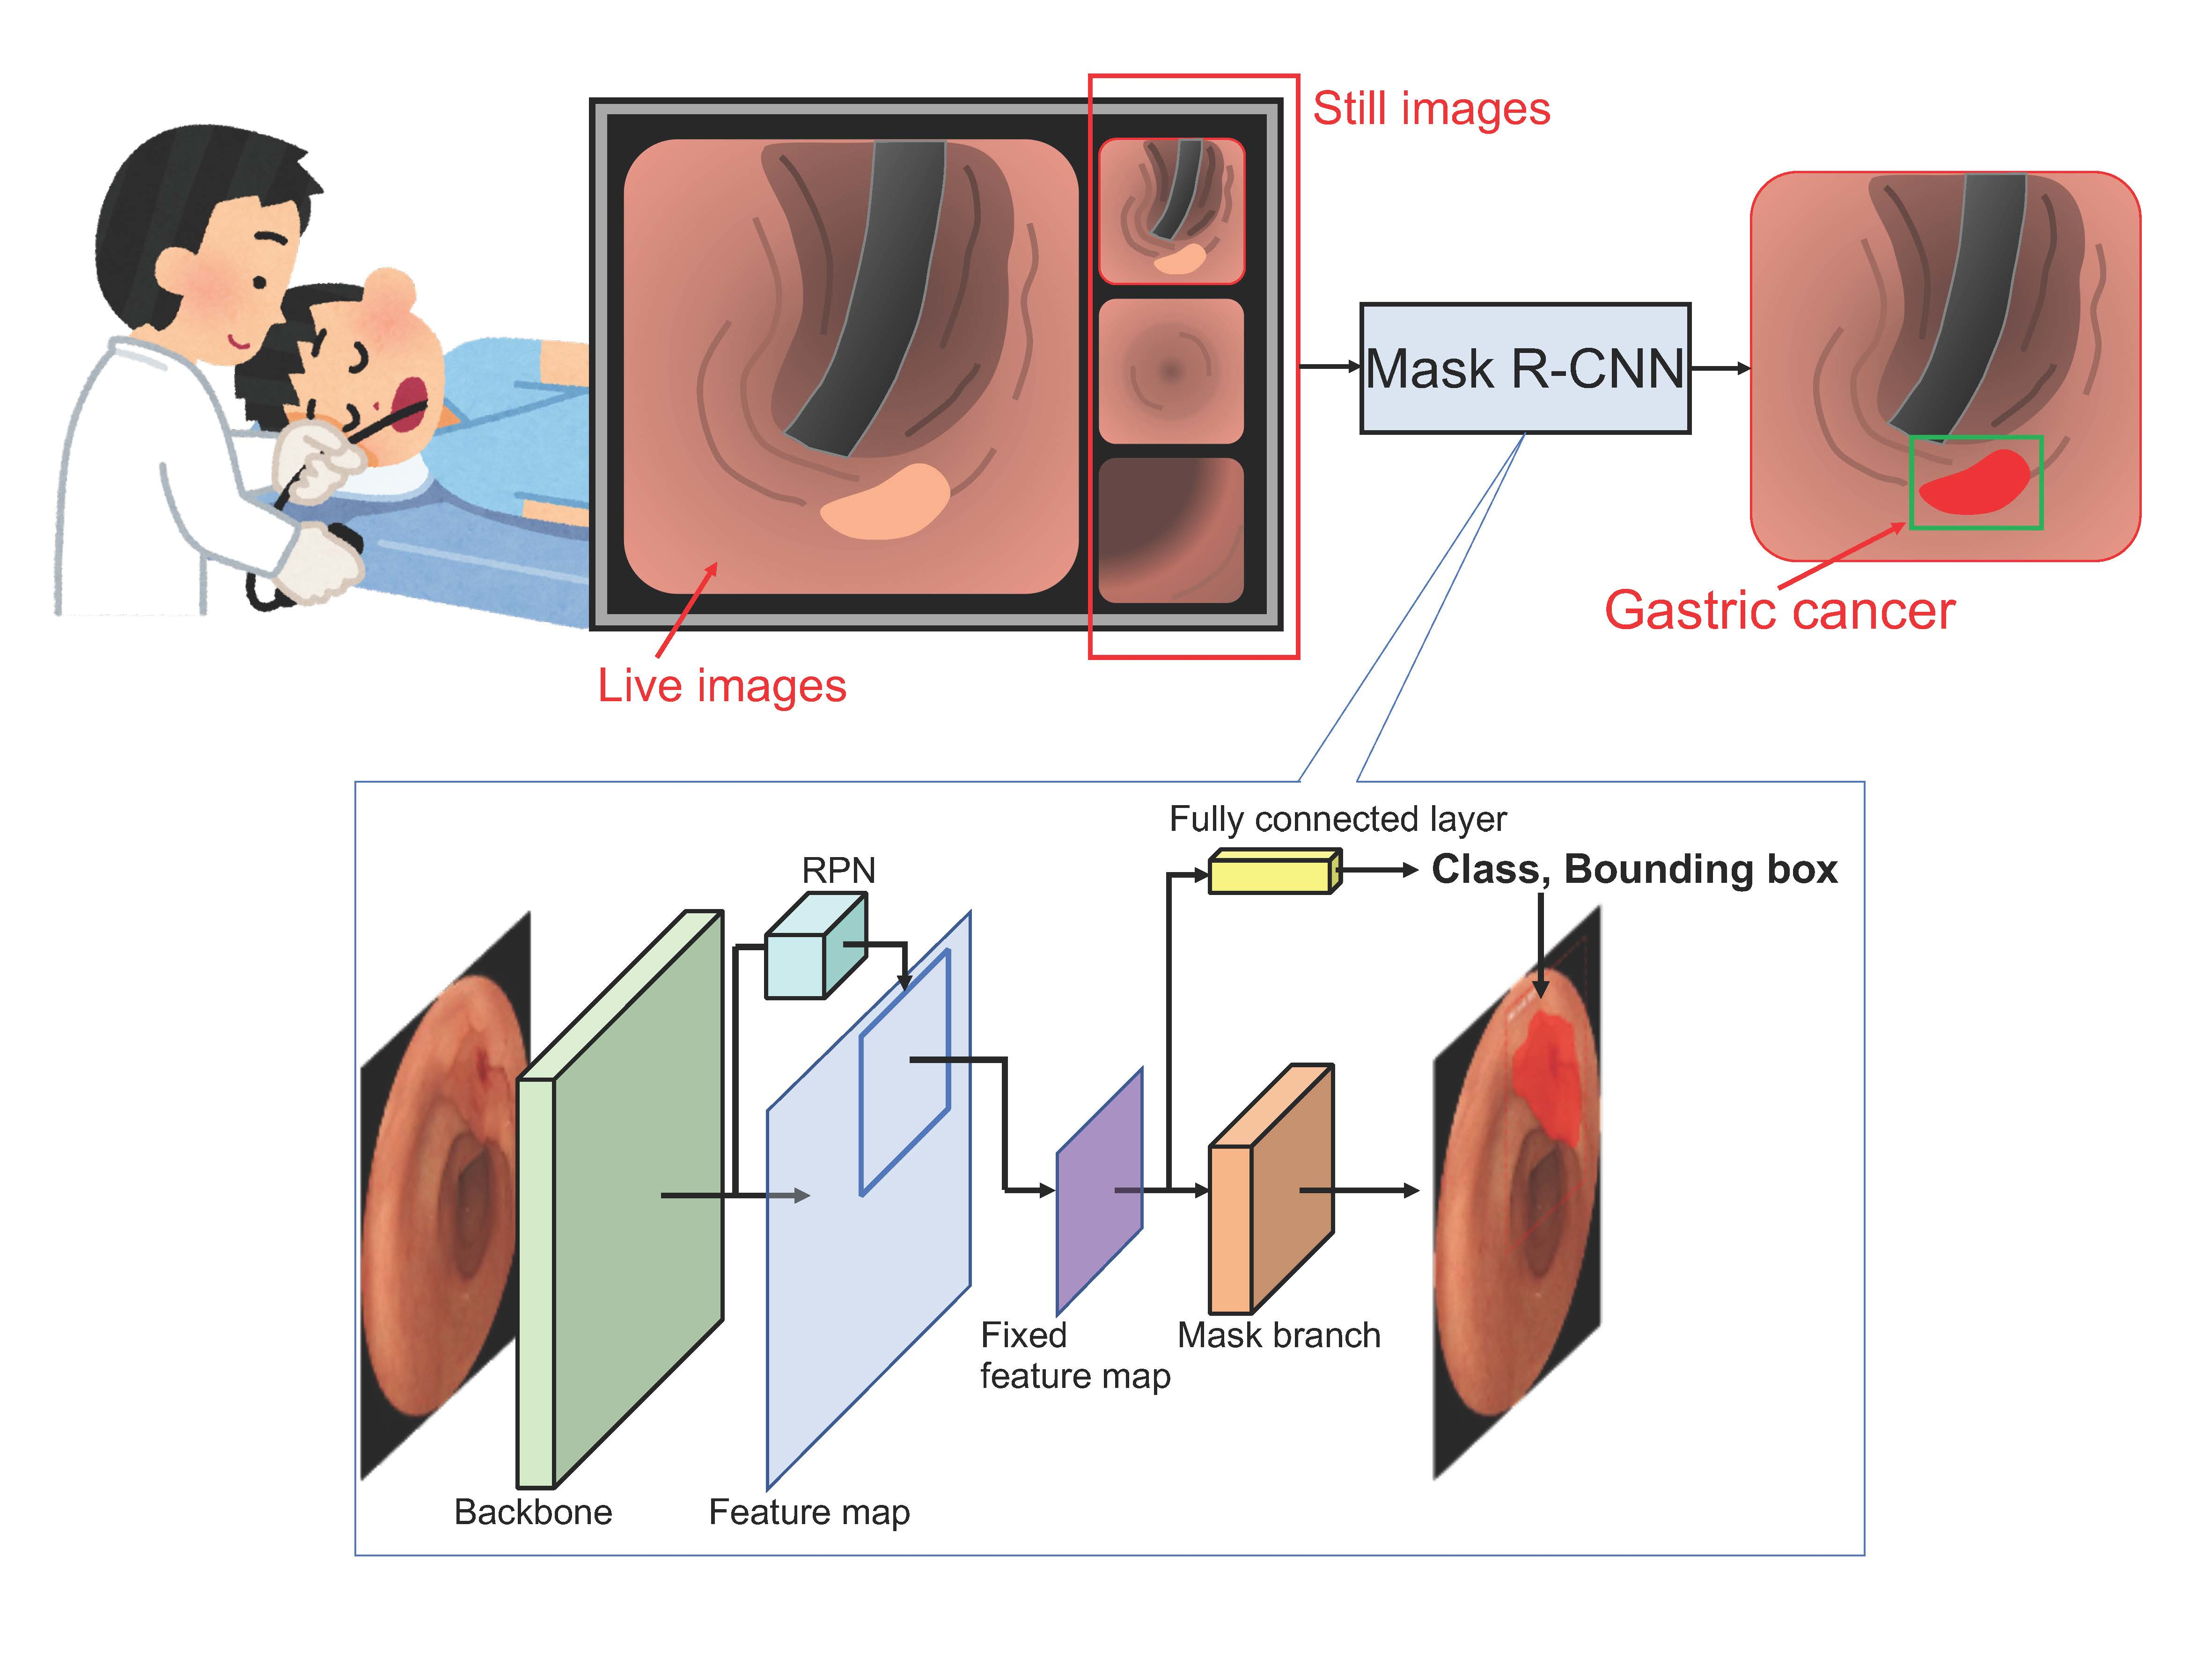
In endoscopy, a physician collects still images at important locations while observing the patient’s esophagus, stomach, and duodenum in order. In this study, we developed a method to perform automated detection and extraction of the gastric cancer region using Mask R-CNN (
Figure 1). This study was approved by an institutional review board, and patients’ informed consent was obtained under the condition that all data were anonymized (No. HM17-226).
2.2. Image Dataset
To develop an automated detection method using Mask R-CNN, we collected 42 healthy subjects (1208 images) and 93 cases (94 lesions, 533 images) of gastric cancer for preoperative examinations between 16 July 2013 and 30 August 2017 in Fujita Health University Hospital. When a lesion was found using endoscopy, the lesion was photographed from various directions. Additionally, two lesions were found in one patient. As a result, an average of 5.66 images were collected per lesion.
Table 1 shows the characteristics of gastric cancer patients and lesions according to the Japanese classification of gastric carcinoma [
22].
For healthy subjects, we reassessed the cases diagnosed as without any abnormality by the endoscopists and characterized a case as “healthy” when there was no specific lesion, such as a polyp or tumor, and a regular arrangement of collecting venules was observed in the amucosa [
23]. We reassessed the cases diagnosed as chronic gastritis by the endoscopists and characterized them as “gastritis” when there was no specific lesion, such as a polyp or tumor, and with atrophy C-1 or severe grade of Kimura-Takemoto classification for chronic gastric mucosa atrophy [
24].
Images were obtained using upper endoscopes (GIF-290Z, GIF-HQ290, GIF-XP290N, GIF-260Z; Olympus Medical Systems, Co., Ltd., Tokyo, Japan; and EG-L600ZW7; Fujifilm Corp., Tokyo, Japan) and standard endoscopic video systems (EVIS LUCERA CV-260/CLV-260, EVIS LUCERA ELITE CV-290/ CLV-290SL; Olympus Medical Systems; and VP-4450HD/LL-4450; Fujifilm Corp.).
The size of the images ranged from 640 × 480 to 1440 × 1080 pixels; these were standard white-light images stored in JPEG format. Because the image matrix size differed depending on the case, all the images were downsampled to 256 × 256 pixels. They were then trimmed in the shape of a circle (
Figure 2). The circular view can easily increase the number of images by rotation, as described below. Subsequently, the ground truth was specified by a single expert endoscopist (TS) and board-certified by the Japan Gastroenterological Endoscopy Society. The ground truth was presented as a label image. All label images were created using the original Python program.
Generally, the training of deep learning requires a large amount of data, as a small dataset may cause overfitting. To prevent this, we augmented the training dataset using image processing [
25]. Because the endoscopic images are direction-invariant, augmentation operations such as image rotation and flipping were also performed. In-house software was used for automatic data augmentation. Here, the rotation angles were set to 10° and 6°, respectively, to adjust the bias in the number of images of healthy subjects and gastric cancer patients.
2.3. Network Architecture
Figure 2 shows the structure of Mask R-CNN [
21] used in this study. Mask R-CNN is a deep learning technique aimed at finding the object location as a bounding box and segmenting the object region. In the figure, the backbone network extracts features from the entire image by CNN and creates a feature map. A region proposal network (RPN) identifies the candidate regions to be detected from the feature map. The candidate area in the feature map is then extracted, and a fixed-size feature map is created. Based on this map, the bounding boxes and the probability of the lesion are obtained by the fully connected layer. At the same time, the mask branch performs segmentation within the bounding box.
In the backbone, we introduced ResNet-50 [
26] as a CNN model; the mask layer is composed of seven convolutional layers of FCN. We implemented these architectures using the Mask R-CNN software library by Matterport [
27].
2.4. Evaluation Metrics
We evaluated the detection and the segmentation accuracy of our proposed method. First, we defined the criteria for evaluation as follows.
The detection sensitivity was considered correct when an overlap was observed between the gastric cancer area obtained by this method and the ground truth created by a gastrointestinal specialist. In many lesions, the presence thereof is often confirmed in a plurality of images. Some of them include subtle patterns that are difficult to identify. Therefore, a method of simply counting the number of images of detected gastric cancer (image-based sensitivity) and a method of judging that one lesion was correctly detected if it was detected in at least one image (lesion-based sensitivity) were introduced. For false positives (FPs), the average number of FPs per image was calculated by counting the number of regions detected in images and dividing it by the total number of images in healthy subjects.
The invasive region of gastric cancer can be obtained using the proposed method. The Dice index (Di) and the Jaccard index (Ji) were calculated using the following formulas to evaluate the similarity between the detected region and the ground truth created by a gastrointestinal specialist.
where A indicates the ground truth region and B indicates the detected region of gastric cancer.
These evaluations were conducted using a cross-validation method [
28]. This method evaluates the model by dividing the original dataset into k subsets (k-fold cross-validation). Among the k subsets, one subset was used as the test data, and the remaining k-1 subsets were used as training data. The cross-validation process was repeated k times. Each of the k subsets was used once as the test data. The model accuracy was obtained by summarizing the test results. In this study, we employed a five-fold cross-validation (k = 5). During this process, 42 healthy subjects and 95 gastric cancer cases were randomly divided into five groups. Here, images from the same case were divided to ensure that they were not present in both the training and test data.
To compare the segmentation ability of this method with the performance of other segmentation methods, we also performed gastric cancer region extraction using U-Net. Various studies have shown that U-Net has excellent performance in medical image segmentation [
17]. We introduced a U-Net model with five encoder and decoder layers, as described in the original paper.
Statement of Ethics: This study was approved by the Ethical Review Committee of Fujita Health University (HM17-226) and carried out in accordance with the World Medical Association’s Declaration of Helsinki. Patients’ informed consent was obtained in the form of opt-out in the endoscopic center of Fujita Health University Hospital, and all data were anonymized.
3. Results
First,
Figure 3 shows the detection results—successful detections, FPs, and false negatives—by the proposed method.
Figure 4 shows the free-response receiver operator characteristics (FROC) curve using the number of FPs per image, image-based sensitivity, and lesion-based sensitivity. The image-based and lesion-based detection sensitivities calculated from this curve were 0.76 (404/533) and 0.96 (90/94), respectively. Based on a previous study [
18], we calculated the sensitivity by tumor size and depth, as shown in
Table 2. The sizes of the neoplasms were calculated from the resected specimen (the major axis). In addition, the number of FPs per image and FPs per patient were 0.105 (127/1208) and 3.02 (127/42), respectively.
Regarding the segmentation accuracy of the invasive region of gastric cancer, the histogram of the Dice index is shown in
Figure 5. Based on this histogram, the average Dice index was 72.0%. As a result of extracting the gastric cancer region using U-Net, the average Dice and Jaccard coefficients were 57% and 43%, respectively.
The detection speed was 0.1 sec per image using AMD Ryzen 9 3900X (12 core) as the central processing unit (CPU) and NVIDIA TITAN RTX as the graphics processing unit (GPU).
4. Discussion
As shown in
Figure 3, the proposed method correctly detected early gastric cancer lesions, and the shape of the segmented gastric cancer region was also similar to that of the ground truth. FPs were detected in the shadowed areas caused by endoscopic illumination. Regarding false negatives, lesions with subtle changes in pattern or lesions on the side of the image were not often detected.
Figure 4 shows that the FROC curve of the lesion-based evaluation was better than that of the image-based evaluation. In the case of endoscopy, the number of images collected in one examination varied. During the image-based evaluation, cases with a large number of images were biased. However, in the lesion-based evaluation, the variation in the number of images due to the case could be ignored. In FROC curve (b), if the occurrence of FPs was allowed, the detection sensitivity was 97.9% with 0.4 FPs per image. Furthermore, if it was necessary to balance the detection sensitivity and the number of FPs, it was possible to select a parameter that had a detection sensitivity of 95.0% with 0.1 FPs per image. It can be said that these results are sufficiently favorable.
The accuracy of the segmentation area was better with Mask R-CNN than with U-Net. Mask R-CNN first conducted rough detection of an object and performed segmentation inside it. The training of segmentation could be performed only around the gastric cancer region, and it can be inferred that the segmentation was more accurate.
The FPs were classified into four categories: (a) lesion of the pyloric ring included images (33.9%), (b) gastric angle included images (11.8%), (c) non-pathological small structures or changes such as bubbles, water, scratches, and redness (25.2%), and d) others (29.1%). To reduce FPs, we will develop a classification algorithm for the abovementioned objects in the future.
Although an accurate comparison is not possible because a different database was used, the proposed method using Mask R-CNN had a better detection sensitivity than those in previous studies using an SSD [
14]. In addition, SSD detects lesions with a bounding box, whereas the proposed method can obtain the bounding box and the segmentation results simultaneously. The average value of Di calculated in the detected region was 72%, which indicates that the proposed method can accurately segment the invasive region of gastric cancer. Regarding FPs, this study is intended for use as a diagnostic support tool during endoscopy. Therefore, an FP that the physician can easily recognize is acceptable. We believe that the current number of FPs has reached a sufficient level.
Regarding the limitations of this method, training and evaluation of the proposed method were carried out using the data collected at a single facility only. We plan to evaluate the performance using images collected at other facilities. Furthermore, we used preoperative examination images in this study because it was important that the ground truth be accurate. However, in the future, we would like to use image data such as screening endoscopic images and movies.
5. Conclusions
We developed a method for automated detection and segmentation of gastric cancer lesions in endoscopic images using Mask R-CNN. Through the evaluation, we obtained sufficient detection sensitivity with fewer FPs. Furthermore, the accuracy of segmentation in the gastric cancer region was favorable. These results indicate that the proposed method may be useful as a support tool for endoscopic examination.
Author Contributions
Conceptualization, T.S., A.T., N.O., K.S., and H.F.; Data Curation, T.S., and H.Y.; Methodology, A.T.; Software, A.T.; Validation, T.S., A.T., and H.Y.; Investigation, T.S., A.T., and H.Y.; Writing—Original Draft Preparation, T.S. and A.T.; Writing—Review and Editing, N.O., K.S., and H.F.; Visualization, A.T.; Project Administration, T.S. and A.T. All authors have read and agreed to the published version of the manuscript.
Acknowledgments
We are grateful to Mr. Kazuma Enomoto of Fujita Health University for creating the label images and conducting preliminary experiments.
Conflicts of Interest
The authors declare no conflict of interest..
References
- Fitzmaurice, C.; Akinyemiju, T.F.; Al Lami, F.H.; Alam, T.; Alizadeh-Navaei, R.; Allen, C.; Alsharif, U.; Alvis-Guzman, N.; Amini, E.; Anderson, B.O.; et al. Global, regional, and national cancer incidence, mortality, years of life lost, years lived with disability, and disability-adjusted life-years for 29 cancer groups, 1990 to 2016: A systematic analysis for the global burden of disease study global burden of disease cancer collaboration. JAMA Oncol. 2018, 4, 1553–1568. [Google Scholar] [PubMed]
- Karger Publishers. GLOBOCAN 2012: Estimated Cancer Incidence, Mortality, and Prevalence Worldwide in 2012. Available online: http://globocan.iarc.fr/Pages/fact_sheets_cancer.aspx (accessed on 30 April 2020).
- Kegler, S.R.; Baldwin, G.T.; Rudd, R.A.; Ballesteros, M.F. Increases in United States life expectancy through reductions in injury-related death. Popul. Health Metr. 2017, 15, 32. [Google Scholar] [CrossRef] [PubMed]
- Tashiro, A.; Sano, M.; Kinameri, K.; Fujita, K.; Takeuchi, Y. Comparing mass screening techniques for gastric cancer in Japan. World J. Gastroenterol. 2006, 12, 4873–4874. [Google Scholar] [PubMed]
- Toyoizumi, H.; Kaise, M.; Arakawa, H.; Yonezawa, J.; Yoshida, Y.; Kato, M.; Yoshimura, N.; Goda, K.; Tajiri, H. Ultrathin endoscopy versus high-resolution endoscopy for diagnosing superficial gastric neoplasia. Gastrointest. Endosc. 2009, 70, 240–245. [Google Scholar] [CrossRef] [PubMed]
- Menon, S.; Trudgill, N. How commonly is upper gastrointestinal cancer missed at endoscopy? A meta-analysis. Endosc. Int. open. 2014, 2, E46–E50. [Google Scholar] [CrossRef]
- Voutilainen, M.E.; Juhola, M.T. Evaluation of the diagnostic accuracy of gastroscopy to detect gastric tumours: Clinicopathological features and prognosis of patients with gastric cancer missed on endoscopy. Eur. J. Gastroenterol. Hepatol. 2005, 17, 1345–1349. [Google Scholar] [CrossRef]
- Hosokawa, O.; Hattori, M.; Douden, K.; Hayashi, H.; Ohta, K.; Kaizaki, Y. Difference in accuracy between gastroscopy and colonoscopy for detection of cancer. Hepatogastroenterology 2007, 54, 442–444. [Google Scholar]
- Yalamarthi, S.; Witherspoon, P.; McCole, D.; Auld, C.D. Missed diagnoses in patients with upper gastrointestinal cancers. Endoscopy 2004, 36, 874–879. [Google Scholar] [CrossRef]
- Zhou, X.; Takayama, R.; Wang, S.; Hara, T.; Fujita, H. Deep learning of the sectional appearances of 3D CT images for anatomical structure segmentation based on an FCN voting method. Med. Phys. 2017, 44, 5221–5233. [Google Scholar] [CrossRef]
- Gletsos, M.; Mougiakakou, S.G.; Matsopoulos, G.K.; Nikita, K.S.; Nikita, A.S.; Kelekis, D. A computer-aided diagnostic system to characterize CT focal liver lesions: Design and optimization of a neural network classifier. IEEE Trans. Inf. Technol. Biomed. 2003, 7, 153–162. [Google Scholar] [CrossRef]
- Teramoto, A.; Tsukamoto, T.; Yamada, A.; Kiriyama, Y.; Imaizumi, K.; Saito, K.; Fujita, H. Deep learning approach to classification of lung cytological images: Two-step training using actual and synthesized images by progressive growing of generative adversarial networks. PLoS ONE 2020, 15, 0229951. [Google Scholar] [CrossRef] [PubMed]
- Wang, S.; Sun, J.; Mehmood, I.; Pan, C.; Chen, Y.; Zhang, Y.D. Cerebral micro-bleeding identification based on a nine-layer convolutional neural network with stochastic pooling. Concurr. Comput. 2020, 32, 1–16. [Google Scholar] [CrossRef]
- Wang, S.; Muhammad, K.; Hong, J.; Sangaiah, A.K.; Zhang, Y.D. Alcoholism identification via convolutional neural network based on parametric ReLU, dropout, and batch normalization. Neural Comput. Appl. 2020, 32, 665–680. [Google Scholar] [CrossRef]
- Jia, X.; Meng, M.Q. A deep convolutional neural network for bleeding detection in wireless capsule endoscopy images. In Proceedings of the 2016 38th Annual International Conference of the IEEE Engineering in Medicine and Biology Society (EMBC), Orlando, FL, USA, 16–20 August 2016; pp. 639–642. [Google Scholar]
- Sakai, Y.; Takemoto, S.; Hori, K.; Nishimura, M.; Ikematsu, H.; Yano, T.; Yokota, H. Automatic detection of early gastric cancer in endoscopic images using a transferring convolutional neural network. In Proceedings of the 40th International Conference of the IEEE Engineering in Medicine and Biology Society, Honolulu, HI, USA, 17–21 July 2018; pp. 4138–4141. [Google Scholar]
- Yoon, H.J.; Kim, S.; Kim, J.-H.; Keum, J.-S.; Oh, S.-I.; Jo, J.; Chun, J.; Youn, Y.H.; Park, H.; Kwon, I.G.; et al. A lesion-based convolutional neural network improves endoscopic detection and depth prediction of early gastric cancer. J. Clin. Med. 2019, 8, 1310. [Google Scholar] [CrossRef] [PubMed]
- Hirasawa, T.; Aoyama, K.; Tanimoto, T.; Ishihara, S.; Shichijo, S.; Ozawa, T.; Ohnishi, T.; Fujishiro, M.; Matsuo, K.; Fujisaki, J.; et al. Application of artificial intelligence using a convolutional neural network for detecting gastric cancer in endoscopic images. Gastric Cancer 2018, 21, 653–660. [Google Scholar] [CrossRef]
- Long, J.; Shelhamer, E.; Darrell, T. Fully convolutional networks for semantic segmentation. In Proceedings of the 2015 IEEE Conference on Computer Vision and Pattern Recognition (CVPR), Boston, MA, USA, 7–12 June 2015; pp. 3431–3440. [Google Scholar]
- Ronneberger, O.; Fischer, P.; Brox, T. U-Net: Convolutional networks for biomedical image segmentation. Lect. Notes Comput. Sci. 2015, 9351, 234–241. [Google Scholar]
- He, K.; Gkioxari, G.; Dollár, P.; Girshick, R. Mask R-CNN. IEEE Trans. Pattern Anal. Mach. Intell. 2020, 42, 386–397. [Google Scholar] [CrossRef]
- Japanese Gastric Cancer Association. Japanese classification of gastric carcinoma: 3rd English edition. Gastric Cancer 2011, 14, 101–112. [Google Scholar] [CrossRef]
- Yagi, K.; Nakamura, A.; Sekine, A. Characteristic endoscopic and magnified endoscopic findings in the normal stomach without Helicobacter Pylori infection. J. Gastroenterol. Hepatol. 2002, 17, 39–45. [Google Scholar] [CrossRef]
- Kimura, K. An endoscopic recognition of the atrophic border and its significance in chronic gastritis. Endoscopy 1969, 13, 87–97. [Google Scholar] [CrossRef]
- Teramoto, A.; Yamada, A.; Kiriyama, Y.; Tsukamoto, T.; Yan, K.; Zhang, L.; Imaizumi, K.; Saito, K.; Fujita, H. Automated classification of benign and malignant cells from lung cytological images using deep convolutional neural network. Inform. Med. Unlocked 2019, 16, 100205. [Google Scholar] [CrossRef]
- He, K.; Zhang, X.; Ren, S.; Sun, J. Deep residual learning for image recognition. In Proceedings of the 2016 IEEE Conference on Computer Vision and Pattern Recognition (CVPR), Las Vegas, NV, USA, 27–30 June 2016; pp. 770–778. [Google Scholar]
- Abdulla, W. Mask R-CNN for Object Detection and Instance Segmentation on Keras and TensorFlow. GitHub Repos. 2017. Available online: https://github.com/matterport/Mask_RCNN (accessed on 10 May 2020).
- Efron, B. Estimating the error rate of a prediction rule: Improvement on cross-validation. J. Am. Stat. Assoc. 1983, 78, 316–331. [Google Scholar] [CrossRef]
© 2020 by the authors. Licensee MDPI, Basel, Switzerland. This article is an open access article distributed under the terms and conditions of the Creative Commons Attribution (CC BY) license (http://creativecommons.org/licenses/by/4.0/).

 ,
, 


