Abstract
Endoscopic imaging is an indispensable tool for visual inspection of surfaces in hard-to-access places. The conventional optical endoscope only enables imaging the regions that lie close to the focal plane, and therefore improving the depth of field (DOF) of an endoscopic system has recently attracted much attention. Here, we propose and demonstrate a simple, cost-effective, and easily available industrial endoscopic system, which is composed of a rigid tube and group of optical lenses. The outer diameter of the designed endoscopic modality presented in this article is 3 mm. By employing the wavefront coding technique, the DOF of newly-designed endoscope was extended to 2.7 mm in the proof-of-concept experiment, which is an increase of almost 10 times compared to the initial counterpart.
1. Introduction
Endoscopic systems are commonly employed to observe inside of the body’s cavities, thereby providing a wealth of information about the inner structure. It is an elongated optical device used to observe otherwise inaccessible areas in either a non-invasive or minimally invasive manner. In general, endoscopes can be grouped into three main categories; namely, rigid endoscopes, flexible endoscopes and capsule endoscopes, which have the versatility to meet the most challenging applications [1]. For the rigid scope, a rod lens system is positioned in the distal end of the endoscope, and optical properties still surpass those of the fiber optics or digital images created by flexible scopes [2].
Depth of field (DOF), referring to the range of distance over which a subject appears in-focus, is a key design criteria for endoscopic system [3]. It varies mainly relying on aperture and focusing distance, and viewing distance can also influence the DOF [4,5]. Although a large DOF demands an objective lens with a small aperture, a limited value of objective distance inevitably confines the DOF in a small range, especially for group of endoscopes that aim at inspecting inner wall of component. For a small DOF, such an endoscope is incapable of providing high axial resolution and high optical sectioning ability [6,7]. In addition, feature of extended DOF is particularly useful for diagnosing the series of industrial components with various dimensions. Therefore, development of extended DOF and small-diameter endoscopic modality, with the capabilities of simultaneously capturing information from multiple planes in a single picture, is extremely desirable in modern industrial and scientific areas.
DOF can be enlarged by recording a rapid sequence of images with different focal length settings of the objective; however, such light field technique suffers from an acquisition speed limitation and a remarkable drop-off in resolution [8]. Adding electrically tunable-focus lenses with liquid crystal is an alternative to extend the DOF of an endoscopic imaging system; however, a number of drawbacks, such as slow response time and only working for polarized light, still exist in the current system [9,10]. The intrinsic contradiction between small objective distance and limited DOF is able to be avoided in wave-front coding approach, which establishes on the manipulation of point spread function (PSF) engineering in combination with post-digital processing procedure [11,12]. This proposal employs a separable phase mask placed in the aperture of an imaging system that makes the image relatively insensitive to the defocus or axial depth [13,14].
In this article, we discuss the principle of extending DOF through wavefront coding and its implementation as a new optical endoscopic modality with a narrow tube and high-order phase mask. The remainder of this paper is structured as follows. Section 2 illustrates the conceptual theory and design principles of our proposal in detail. Section 3 describes an optical endoscopic model and its simulation results, which significantly verify the validity of the proposed system. Restoring the raw images acquired from the system to increase the spatial resolution in large DOF is carried out and presented in Section 4. In Section 5, simulated results of imaging from original system and proposed system with extended DOF are presented. Finally, we summarize and conclude our work in Section 6.
2. Principle and Concept
In this section, we show the fundamental theory of wavefront coding that enables the DOFs of incoherent optical imaging systems to be extended [11,15]. This approach involves a phase plate to create blurred images that are almost invariant to defocus. On the basis of Fourier optics theory, wavefront coding technology combines the ambiguity function, from the radar field to optical transfer functions, and the method of stationary phase, normally used to estimate oscillatory integrals.
The generalized pupil function takes the form
where
In Equation (1), represents defocus aberration, and denotes the modulation factor.
Being the impulse response of a focused optical system, the point spread function (PSF) of the optical imaging system can be calculated by a 2D Fourier transform of the pupil, which is in the form
where c is the constant. As a complex-valued function of spatial frequency, the optical transfer function (OTF) is defined as the Fourier transform of the point spread function
In addition, the OTF can be seen as a combination of two real-valued functions—modulation transfer function (MTF) and phase transfer function (PTF), which can be defined as
where and are the modulus and phase of the OTF, respectively.
According to the theory of Hopkins, the defocus aberration of an standard optical system is represented by the
where D, , f, , represent the diameter of the lens aperture, focus length, object distance and image distance, respectively. k and stand for the wave number and traditional defocus aberration constant, respectively.
The OTF of an optical imaging system can be written as a properly scaled autocorrelation of the pupil function
where u, v represent the normalized spatial frequency, respectively.
For the sake of clarity, our following discussion is 1-D. The 1D OTF with defocus aberration can be rewritten as
Meanwhile, the normalized MTF is in the form
3. Design and Simulation
3.1. Initial Optical Endoscope
Schematic diagram of our designed optical endoscopic model is shown in Figure 1. The proposed system mainly consists of a front-side objective lens group, a rod lens group, a back-end objective lens group, a piece of protective glass and an image sensor. An objective lens system having a first and a second lens element that are separated by a gap where a ray bundle is reflected by 90. The rod lenses are used to connect to the independent sensor for imaging and extend the optical tube with sufficient length. The purpose of the objective lens is to cause light to converge on a single point and transmit light back to the image sensor. The protective glass keeps the image sensor safe and enables the sensor to operate at peak performance. The 1/3” image sensor, being composed of 1280 × 960 pixels with 3.75 m pitch, is employed to register the incident light. The entire endoscopic lens system has a relatively small number of lens elements, and the aberrations of spherical, chromatic, coma and distortion are favorably corrected. Detailed information of the presented optical endoscope is listed in Table 1.

Figure 1.
Designed model of optical endoscope. The length and diameter of optical endoscope are 90 mm and 3 mm, respectively. The effective focal length (), the diameter of entrance pupil (), the diameter of aperture stop () and objective distance () are 3.21 mm, 0.35 mm, 0.836 mm and 2 mm, respectively. The phase mask will be placed at the aperture stop when aiming at extending the depth of field (DOF).

Table 1.
Detailed information of the optical endoscope.
The DOF of this system can be approximated to be [16]
where the effective focal length is mm, the diameter of entrance pupil is mm and the objective distance is mm. denotes the maximum diameter of spot on the image senor, which is fixed at 7.5 m in the current situation. Therefore, the calculated value of original DOF is about 53 m.
MTF, measuring the ability of the endoscopic system to transfer various levels of detail from object to image, is firstly calculated by the productive mathematical software Matlab. Figure 2 shows the MTF curves in different objective distance that are computed by Equation (8). The MTF curve has the best performance when the objective distance value satisfies the designed focus value. In addition, MTF curve seriously declines when the objective distance deviating from the best value, and also decreases to zero at certain frequencies. The MTF value going to zero at some special spatial frequencies implies this system completely loses the imaging information.
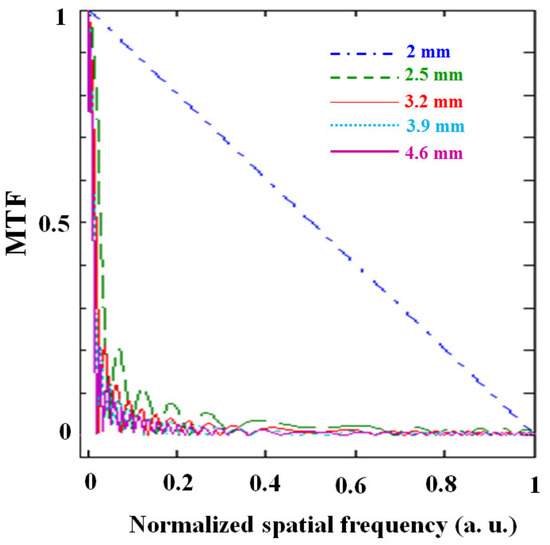
Figure 2.
Calculated modulation transfer function (MTF) curves of initial optical endoscope (from Equation (9)) varied with object distances. The blue dotted-dashed line, green dashed line, red thin line, blue dotted line and purple thick line represent the object distances of 2 mm, 2.5 mm, 3.2 mm, 3.9 mm and 4.6 mm. The normalization factor, also referred as maximum spatial frequency, depends on the diameter of Airy disk of the optical system, which can be defined as . According to the parameters of diameter of entrance pupil = 0.836 mm, objective distance = 2 mm and m, the calculated normalization factor is 146 lp/mm.
Simulations were then performed using a commercial simulation tool Zemax to characterize the designed system. The simulated MTF curves in tangential and sagittal directions were drawn with various objective distances, which are shown in Figure 3a,b, respectively. The cut-off spatial frequency obviously decreases when the objective distance is away from the designed value, which is in accordance with the results shown in Figure 2. Furthermore, the larger objective distance and the more zero points will appear. The light ray distributions on an observation surface, referred to as spot diagrams, are depicted in the situations of different objective distances and FOVs (see Figure 4). The minimum radius of the spot appears at the objective distance of 2.1 mm, being closed to the best focus value. The greater spot is acquired with larger objective distance, which means the system has a large amount of defocus. Taking into account all of these results, we may reach the conclusion that the performance of the initial optical endoscope is sensitive to the objective distance.
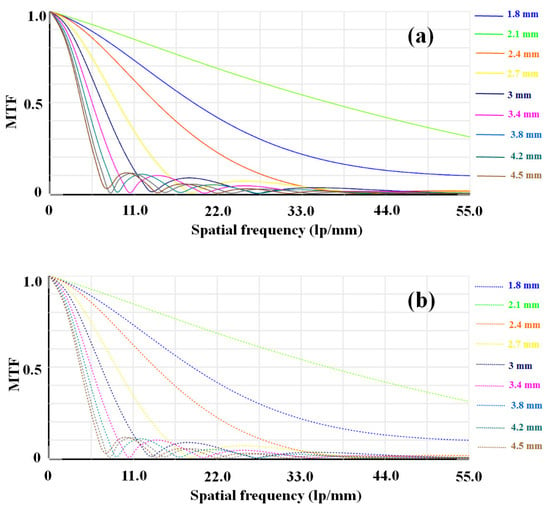
Figure 3.
Simulated MTF curves of initial optical endoscope varied with object distances. (a) Tangential direction. (b) Sagittal direction. The blue line, green line, orange line, yellow line, mazarine line, purple line, cyan line, aquamarine line and gray line represent the object distances of 1.8 mm, 2.1 mm, 2.4 mm, 2.7 mm, 3 mm, 3.4 mm, 3.8 mm, 4.2 mm and 4.5 mm, respectively.
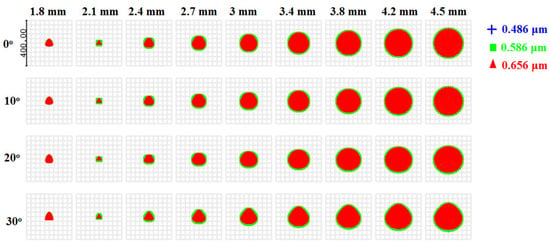
Figure 4.
Spot diagrams of initial optical endoscope, varied by different object distances and FOVs. Each column stands for the same object distance (e.g., 1.8 mm), and each line stands for the same FOV (e.g., 0). The blue cross, green square and red triangle represent the 0.486 m, 0.586 m and 0.656 m incident light.
3.2. Optical Endoscope with Phase Mask
Wavefront coding is normally used to enhance the DOF of the optical endoscope by making the imaging the system insensitive to defocus aberrations. A wavefront coding optical element is a phase mask, placed at the plane of aperture stop, that introduces a spatially varying optical path length [17,18]. The phase mask is ordinarily fabricated by exposure of a photoresist over-coated mask plate to an electron beam to form a specific pattern. The manufacture accuracy of mask plate height is approximately 1 nm.
The equation for the surface of used phase mask can be written as
where A, B and C represent the structural parameters, and R stands for the radius of the phase mask.
An effective way to optimize the structure of phase mask follows the principle that preserves consistency of MTFs with various defocus distances. Considering the multi-configuration method, the evaluation function can be given by
where represents the with defocus value at different horizontal spatial frequency and vertical spatial frequency , and represents the with different horizontal spatial frequency and vertical spatial frequency at the focal plane. After selecting 100 different defocus values between and maximum defocus value, each difference between and is calculated and recorded. After the optimization by above criteria in Zemax, the parameters of mm, A = −0.00579, B = 0.033274 and C = 0.13038 are obtained. The structure of the proposed phase mask is depicted in Figure 5.
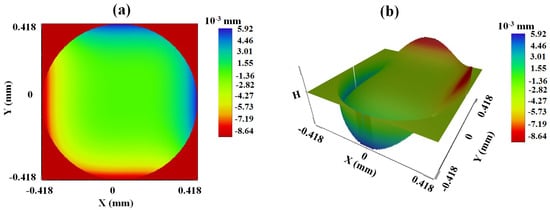
Figure 5.
Structure of the proposed phase mask. (a) 2D map. (b) 3D map.
Under the manipulation of phase mask, the light ray, propagating between the optical lenses, has been modified from focusing state at a special point (Figure 6a) to defocusing state in a certain range (Figure 6b). The phase mask is constructed to avoid the presence of zeros in the corresponding MTF curves and calculus errors in the recovery procedure. Figure 7 exhibits the MTF curves calculated by Equation (9) in Matlab software, and the curves almost overlap when varying the objective distances. Most importantly, the zero points appearing in the initial system vanished with the help of the phase mask, which indicates all the spatial information is reserved in the wavefront coding system.
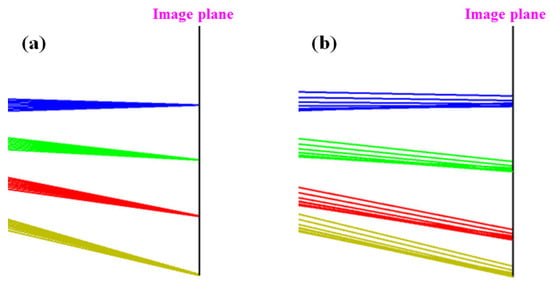
Figure 6.
Light ray propagated in the initial optical endoscope (a) and optical endoscope with phase mask (b).
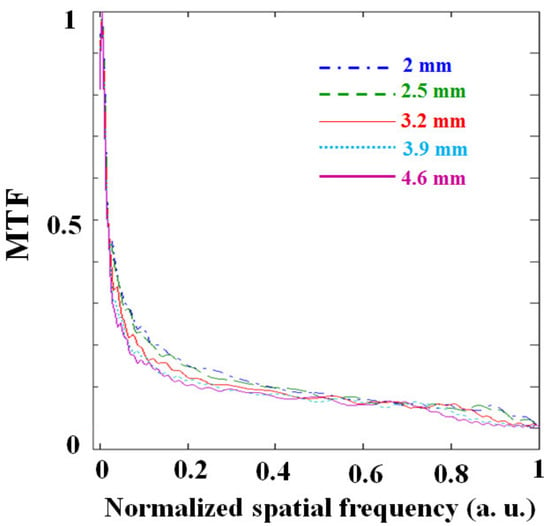
Figure 7.
Calculated MTF curves of optical endoscope with phase mask (from Equations (9) and (11)), varied with object distances. The blue dotted-dashed line, green dashed line, red thin line, blue dotted line and purple thick line represent the object distances of 2 mm, 2.5 mm, 3.2 mm, 3.9 mm and 4.6 mm. The normalization factor, also referred as maximum spatial frequency, depends on the diameter of Airy disk of the optical system, which can be defined as . According to the parameters of diameter of entrance pupil = 0.836 mm, objective distance = 2 mm and m, the calculated normalization factor is 146 lp/mm.
The simulated results of MTF curves acquired by Zemax both in tangential and sagittal directions are shown in Figure 8a,b, respectively. All the curves stay invariant with objective distance ranging from 1.8 to 4.5 mm. The spot diagrams with wavefront coding technique in various objective distances and FOVs are described in Figure 9, which reflects a comprehensive view of how an image forms on the image sensor. We find that all the spots on the image sensor keep same style and size. The features of MTFs and spot diagrams in the new system bring a lot of benefits to acquiring and restoring the high-quality images with extended DOF.
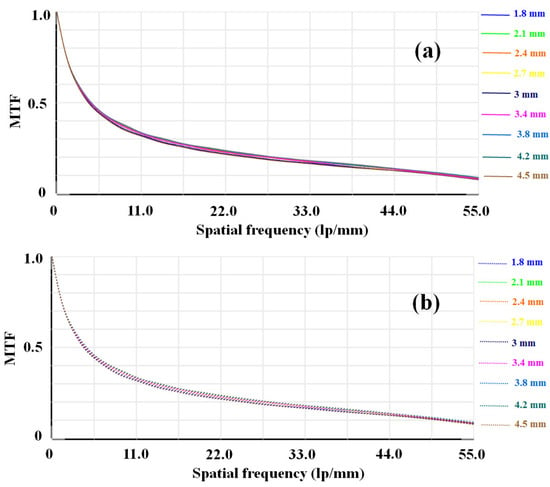
Figure 8.
Simulated MTF curves of optical endoscope with phase mask, varied with object distances. (a) Tangential direction. (b) Sagittal direction. The blue line, green line, orange line, yellow line, mazarine line, purple line, cyan line, aquamarine line and gray line represent the object distances of 1.8 mm, 2.1 mm, 2.4 mm, 2.7 mm, 3 mm, 3.4 mm, 3.8 mm, 4.2 mm and 4.5 mm, respectively.
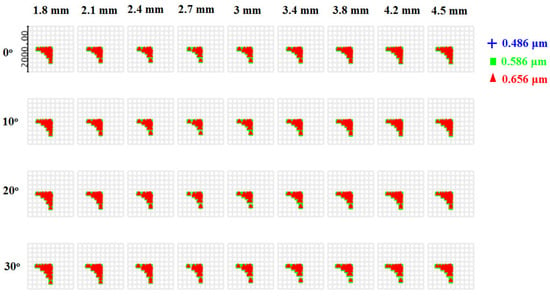
Figure 9.
Spot diagrams of the optical endoscope with phase mask, varied by different object distances and FOVs. Each column stands for the same object distance (e.g., 1.8 mm), and each line stands for the same FOV (e.g., 0). The blue cross, green square and red triangle represent the 0.486 m, 0.586 m and 0.656 m incident light.
4. Restoration Algorithm with Tikhonov Regularization
The proposed optical endoscopic modality is a hybrid imaging system, and therefore, optics and processing should be considered jointly and designed together. In this section, our basic assumption is wavefront coding being a linear blurring process. Problems like that require the determination of the unknown input to a linear system from the known output. For instance, image reconstruction from projections is a linear inverse problem. Our work is using one of the most popular regularization methods—Tikhonov regularization—to restore the encoded image [19,20].
The discretization of a linear inverse problem typically gives rise to a linear system of equations
where represents the blurred image and is the unknown true image to be estimated. is a very ill-conditioned matrix.
Tikhonov regularization replaces the linear system by the regularized system
where is the transpose of the matrix . is a positive constant that determines the amount of regulation; namely, regularization parameter. is the identity operator.
Assuming the value of is fixed, Equation (14) will have a unique solution, which is given by
where is the transpose of the matrix .
We note that the solution satisfies the minimization problem
In the Tikhonov regularization equation, we normally choose as zero and P as an identity matrix, which provides a standard Tikhonov regulation form as
With the purpose of solving Equation (14), the matrix can be decomposed by singular value decomposition (SVD) as follows
is a diagonal matrix with the singular values, which satisfies:
In addition, the matrices U and V are comprised of left and right singular vectors and , respectively.
On the basis of SVD method, we can solve the Equation (15) as
represents the Tikhonov filter factor, which is in the form
More importantly, obtaining the appropriate value of the regularization parameter plays a crucial role in Tikhonov algorithm. In this calculation, we utilize the L-curve method to determine the suitable regularization parameter . The L-curve is a log–log plot of the norm of the regularized solution versus the corresponding residual norm for each of a set of regularization parameter values. The best regularization parameter should lie a the corner of the L.
It is useful to have formulas for the norm of the filter solution
and the norm of the residual
In the Tikhonov method, the norm of the solution is a monotonically non-increasing function of while the residual norm is monotonically nondecreasing. With Tikhonov regularization, a suitable, accurate and fast algorithm is used to obtain the restored sharp image in a relative long objective distance.
5. Results
As a proof of concept, we perform optical endoscopic imaging at various objective distances, and further compare the acquired pictures without and with phase mask. A 1951 USAF resolution test chart is used as the target to verify the performance of optical endoscope. We compare the imaging results without and with phase mask, and record the spatial resolutions in the range of objective distance from 1.8 to 4.5 mm. It should be emphasized that the procedure of testing the quality of image is repeatable.
In Figure 10, the image captured by designed objective distance is clear, and the images with larger objective distances appear lower resolution and suffer from severe blurs. On the contrary, the images are always clear and the spatial resolution stays invariant in different objective distances (see Figure 11), with the assistance of the phase mask and an appropriate recovery algorithm. From what has been shown above, it is not difficult to draw the conclusion that the DOF of optical endoscopic modality with phase mask has been enlarged to at least 2.7 mm, which has been largely improved compared to the theoretical value of DOF.
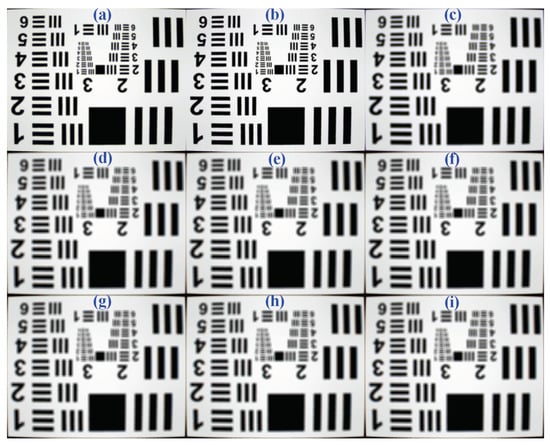
Figure 10.
Imaging results of initial optical endoscope in different objective distances. (a) 1.8 mm. (b) 2.1 mm. (c) 2.4 mm. (d) 2.7 mm. (e) 3 mm. (f) 3.4 mm. (g) 3.8 mm. (h) 4.2 mm. (i) 4.5 mm.
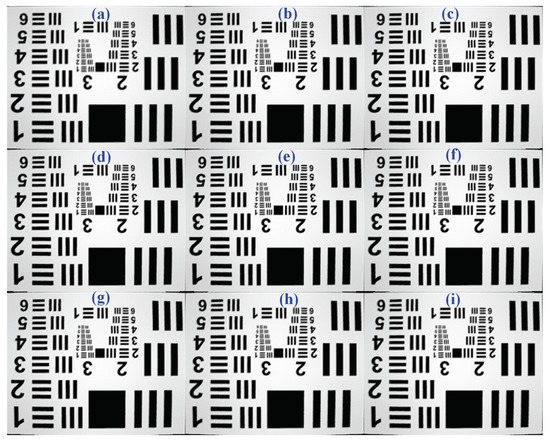
Figure 11.
Imaging results of wavefront-coded optical endoscope in different objective distances. (a) 1.8 mm. (b) 2.1 mm. (c) 2.4 mm. (d) 2.7 mm. (e) 3 mm. (f) 3.4 mm. (g) 3.8 mm. (h) 4.2 mm. (i) 4.5 mm.
In addition, the Imatest software, focused on image quality, is used to test the accurate spatial resolutions of captured pictures in our imaging system. It ensured that we could acquire consistent testing results throughout the whole experiment. As shown in Figure 12, the spatial resolution of pictures collected by original optical model drops rapidly to 3.58 lp/mm, when the objective distance is away from the designed value. Meanwhile, the resolution of pictures from optical model with phase mask stays at 14.3 lp/mm, in which objective distance ranges from 1.8 to 4.5 mm. Therefore, we may reasonably reach the conclusion that the DOF has been extended from to 0.3 mm to 2.7 mm with the usage of wavefront coding technique.
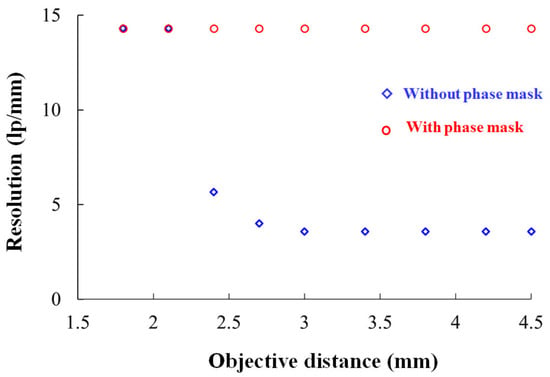
Figure 12.
Compared resolution of captured pictures between the optical endoscope without and with phase mask.
6. Conclusions and Outlook
Nowadays, the optical endoscope is a widespread and versatile diagnostics and inspection tool in massive industrial fields. In particular, the small-diameter endoscope for performing visual examinations of the interiors of cavities or tubes is highly attractive, which possibly provides more information regarding the small components. However, the common optical endoscopic modality always operates with a small DOF, thereby being unable to capture sharp long range images and limited in usefulness in practical applications. Here we describe such a miniature endoscope only 3 mm in diameter that integrates group lens, a phase mask and an image sensor, which is expected to enlarge the DOF from 3 mm to 2.7 mm without sacrificing the spatial resolution.
Moving forward, by coding a stream of light with a phase mask and then decoding it with a special algorithm, wavefront coding produces perfectly focused images with an astounding DOF in optical system. The distinct advantages of enhancing the DOF of an optical endoscope using wavefront coding include high-resolution, low-cost and light weight, although it always induces a small reduction in signal-to-noise ratio at the best focus value. Beyond that, the wavefront coding technology also holds great potential for correcting the intrinsic optical aberrations that typically occur in standard endoscopes [21].
Author Contributions
Conceptualization, L.Y. and J.W.; Data curation, M.C. and S.Z.; Formal analysis, M.C. and T.Y.; Funding acquisition, J.W. and L.Y.; Investigation, L.Y., M.C. and J.W.; Methodology, L.Y.; Project administration, H.X.; Resources, J.W. and M.Z.; Writing—original draft, L.Y.; Writing—review & editing, H.X. All authors have read and agreed to the published version of the manuscript.
Funding
This work was partially supported by the National Key R&D Program of China (Grant No. 2018YFF0212105 and 2018YFF01013203).
Conflicts of Interest
The authors declare no conflict of interest.
References
- Stellingwerff, M.; Breen, J. Applications of optical and digital endoscopy. In Proceedings of the 2nd EAEA-Conference, Vienna, Austria, 30 August–1 September 1995; pp. 55–68. [Google Scholar]
- Garcia, M.; Gruev, V. Optical characterization of rigid endoscopes and polarization calibration methods. Opt. Express 2017, 25, 15713–15728. [Google Scholar] [CrossRef] [PubMed]
- Born, M.; Wolf, E. Principles of Optics: Electromagnetic Theory of Propagation, Interference and Diffraction of Light; Cambridge University Press: Cambridge, UK, 1999. [Google Scholar]
- Ando, H. Phase shifting apodizers of three or more portions. Jpn. J. Appl. Phys. 1992, 31, 557. [Google Scholar] [CrossRef]
- Welford, W.T. Use of annular aperture to increase focal depth. J. Opt. Soc. Am. A 1960, 50, 749. [Google Scholar] [CrossRef]
- Shain, W.J.; Vickers, N.A.; Goldberg, B.B.; Bifano, T.; Mertz, J. Extended depth-of-field microscopy with a high-speed deformable mirror. Opt. Lett. 2017, 42, 995–998. [Google Scholar] [CrossRef] [PubMed]
- Liu, S.; Hua, H. Extended depth-of-field microscopic imaging with a variable focus microscope objective. Opt. Express 2011, 19, 353–362. [Google Scholar] [CrossRef] [PubMed]
- Theriault, G.; Koninck, Y.D.; McCarthy, N. Extended depth of field microscopy for rapid volumetric two-photon imaging. Opt. Express 2013, 21, 10095–10104. [Google Scholar] [CrossRef] [PubMed]
- Wang, Y.; Shen, X.; Lin, Y.; Javidi, B. Extended depth-of-field 3D endoscopy with synthetic aperture integral imaging using an electrically tunable focal-length liquid-crystal lens. Opt. Lett. 2015, 40, 3564. [Google Scholar] [CrossRef] [PubMed]
- Shen, X.; Wang, Y.; Chen, H.; Xiao, X.; Lin, Y.; Javidi, B. Extended depth-of-focus 3D micro integral imaging display using a bifocal liquid crystal lens. Opt. Lett. 2015, 40, 538. [Google Scholar] [CrossRef] [PubMed]
- Dowski, E.R.; Cathey, W.T. Extended depth of field through wave-front coding. Appl. Opt. 1995, 34, 1859. [Google Scholar] [CrossRef] [PubMed]
- Zammit, P.; Harvey, A.R.; Carles, G. Extended depth-of-field imaging and ranging in a snapshot. Optica 2014, 1, 209. [Google Scholar] [CrossRef]
- Castro, A.; Ojeda-Castaneda, J. Asymmetric phase masks for extended depth of field. Appl. Opt. 2004, 43, 3474. [Google Scholar] [CrossRef] [PubMed]
- Xie, H.B.; He, L.R.; Yang, L.; Mao, C.S.; Zhao, M.; Li, J.L.; Yang, T. An extended depth-of-field imaging system with a non-rotationally symmetric phase mask. Rev. Sci. Instrum. 2018, 89, 103101. [Google Scholar] [CrossRef] [PubMed]
- Ben-Elizer, E.; Zalevsky, Z.; Marom, E.; Konforti, N. All-optical extended depth of field imaging sytem. J. Opt. A Pure Appl. Opt. 2003, 5, S164–S169. [Google Scholar] [CrossRef]
- Lipson, A.; Lipson, S.G.; Lipson, H. Optical Physics; Cambridge University Press: Cambridge, UK, 2010. [Google Scholar]
- Zhou, F.; Ye, R.; Li, G.; Zhang, H.; Wang, D. Optimized circularly symmetric phase mask to extend the depth of focus. J. Opt. Soc. Am. A 2009, 26, 1889. [Google Scholar] [CrossRef] [PubMed]
- Zhao, H.; Li, Y. Performance of an improved logarithmic phase mask with optimized parameters in a wavefront-coding system. Appl. Opt. 2010, 49, 229. [Google Scholar] [CrossRef] [PubMed]
- Gockenbach, M. Linear Inverse Problems and Tikhonov Regularization; The Mathematical Association of America: Washington, DC, USA, 2016. [Google Scholar]
- Calvetti, D.; Morigi, S.; Reichel, L.; Sgallari, F. Tikhonov regularization and the L-curve for large discrete ill-posed problems. J. Comput. Appl. Math. 2000, 123, 423. [Google Scholar] [CrossRef]
- Wach, H.B.; Dowski, E.R.; Cathey, W.T. Control of chromatic focal shift through wave-front coding. Appl. Opt. 1998, 37, 5359–5367. [Google Scholar] [CrossRef] [PubMed]
© 2020 by the authors. Licensee MDPI, Basel, Switzerland. This article is an open access article distributed under the terms and conditions of the Creative Commons Attribution (CC BY) license (http://creativecommons.org/licenses/by/4.0/).