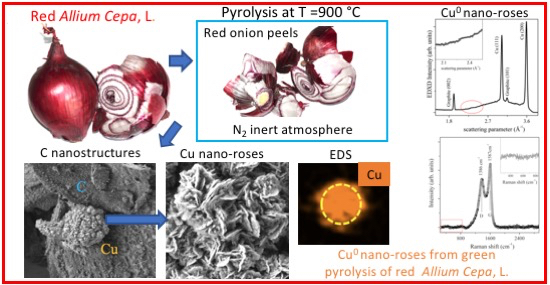
Cu Nano-Roses Self-Assembly from Allium cepa, L., Pyrolysis by Green Synthesis of C Nanostructures


 ,
,  ,
,
Abstract
Featured Applications
Abstract

1. Introduction
2. Materials and Methods
2.1. Sample Preparation
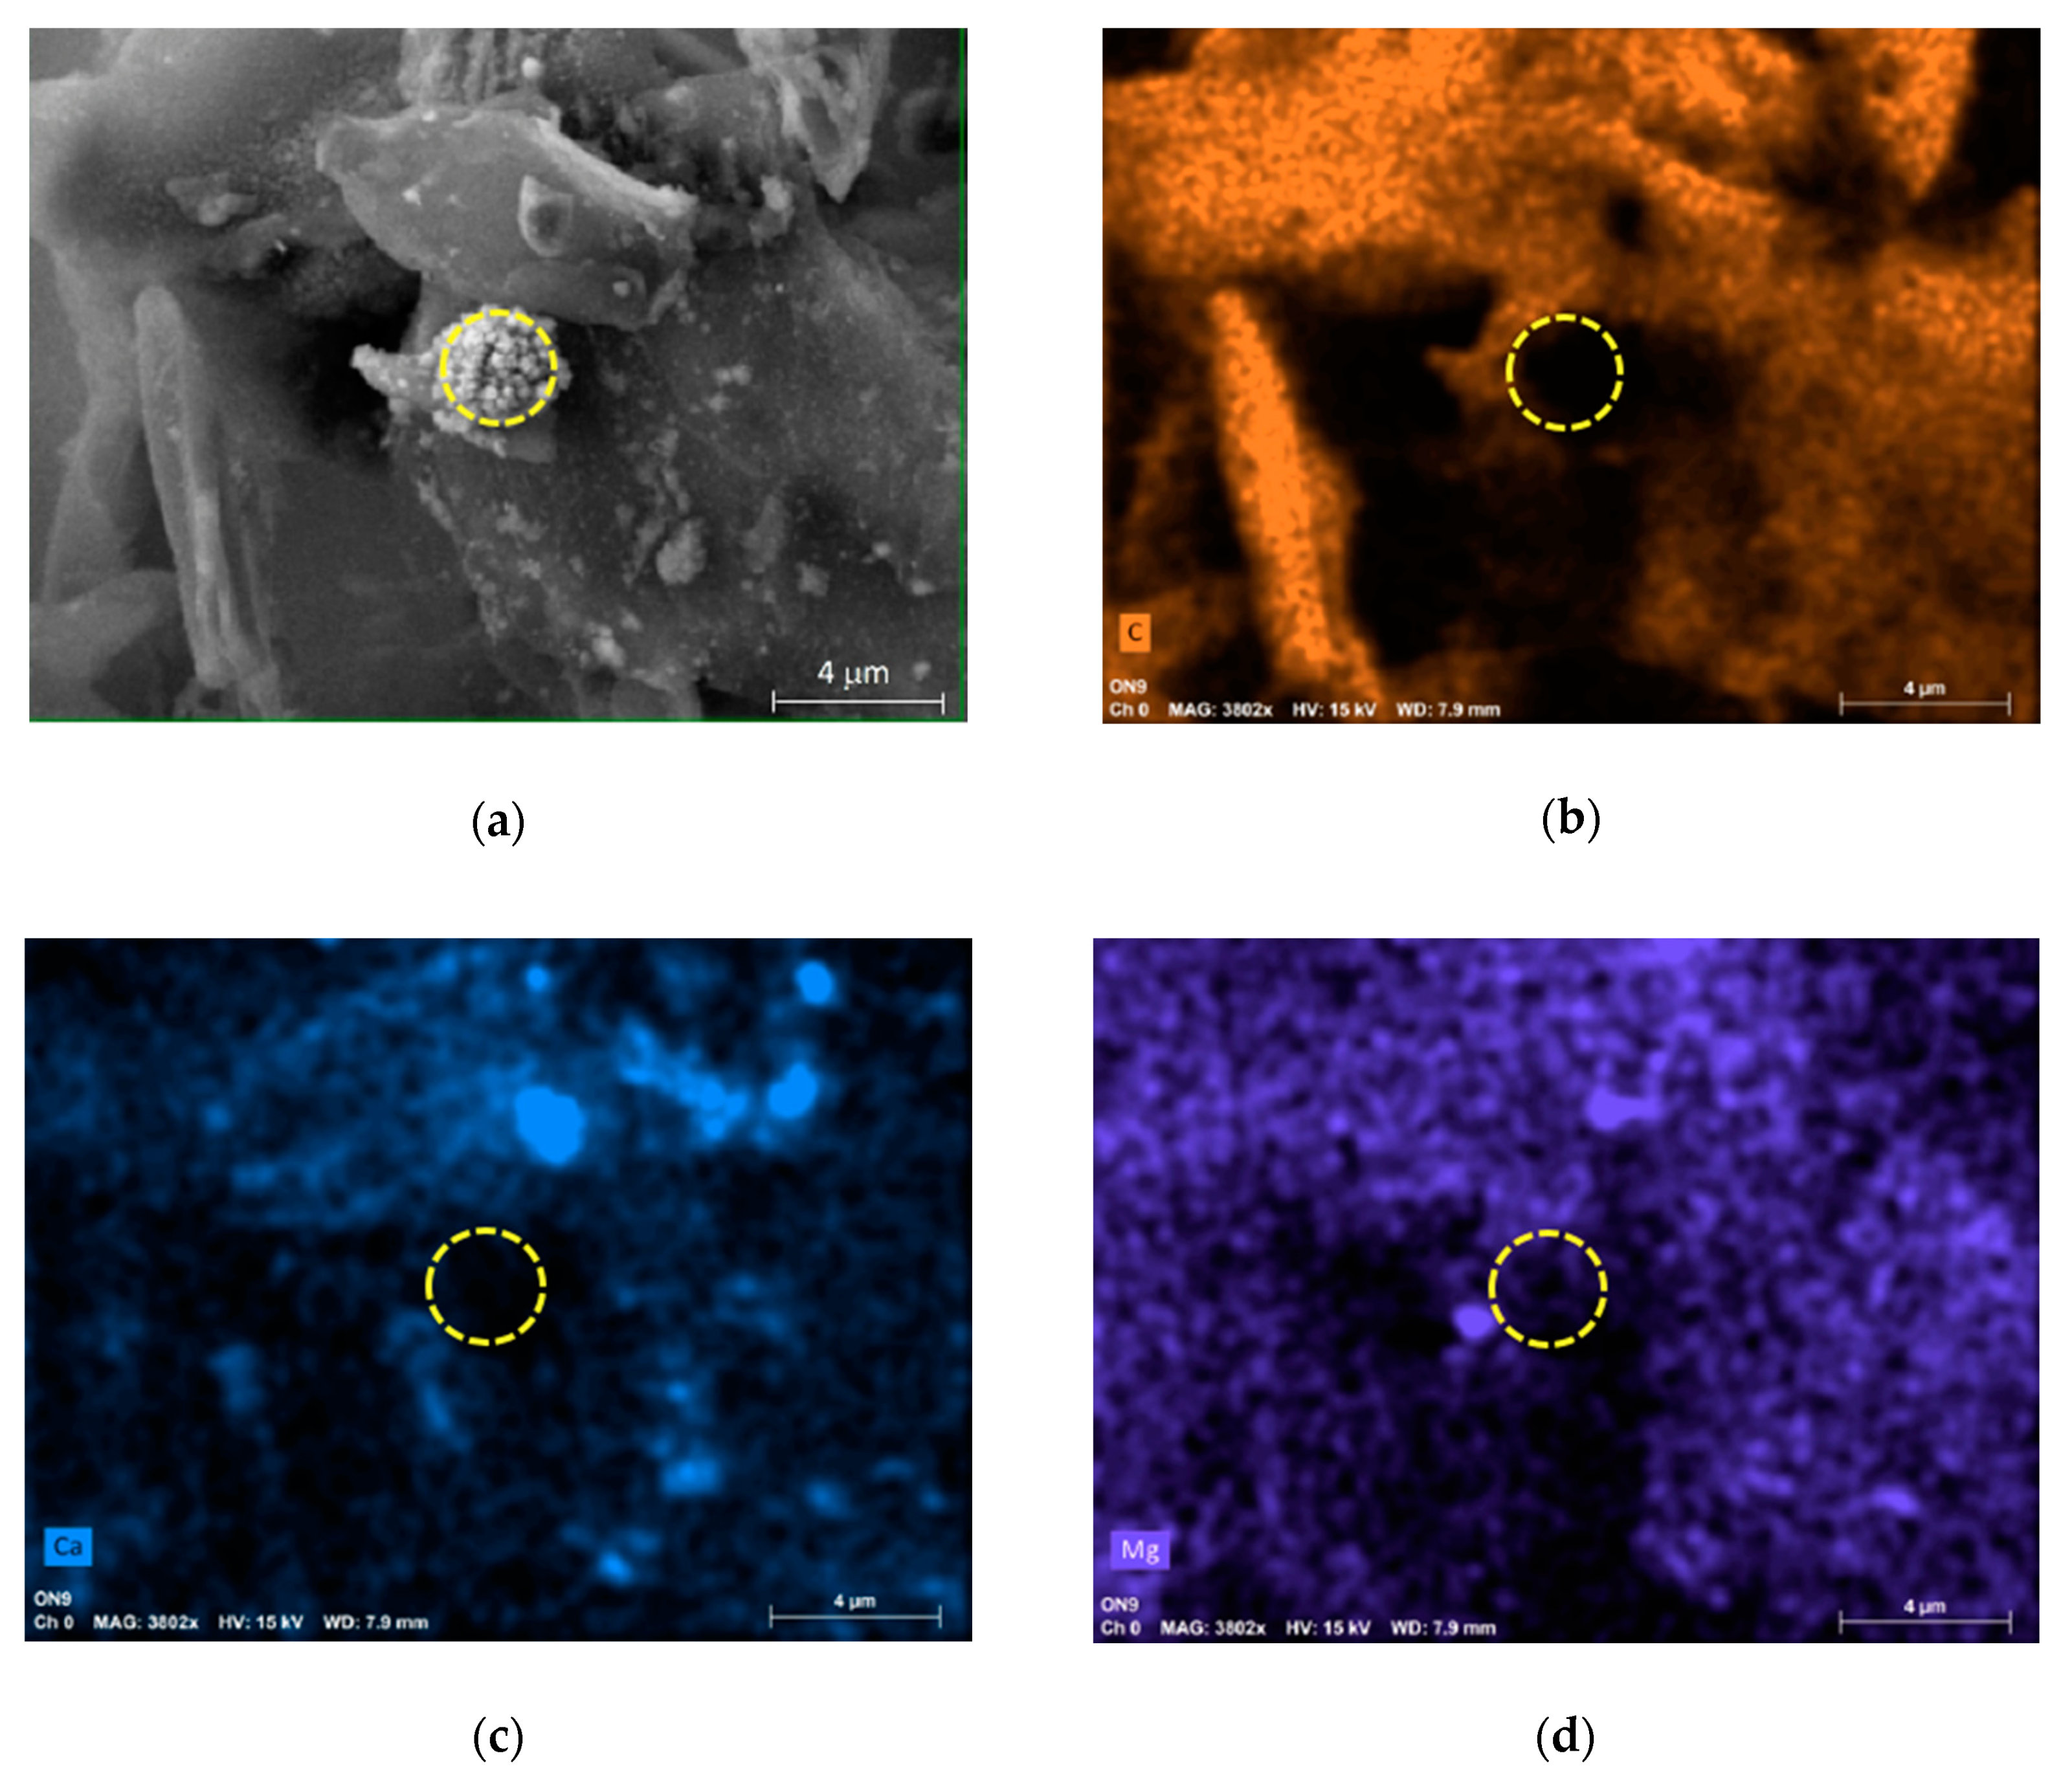
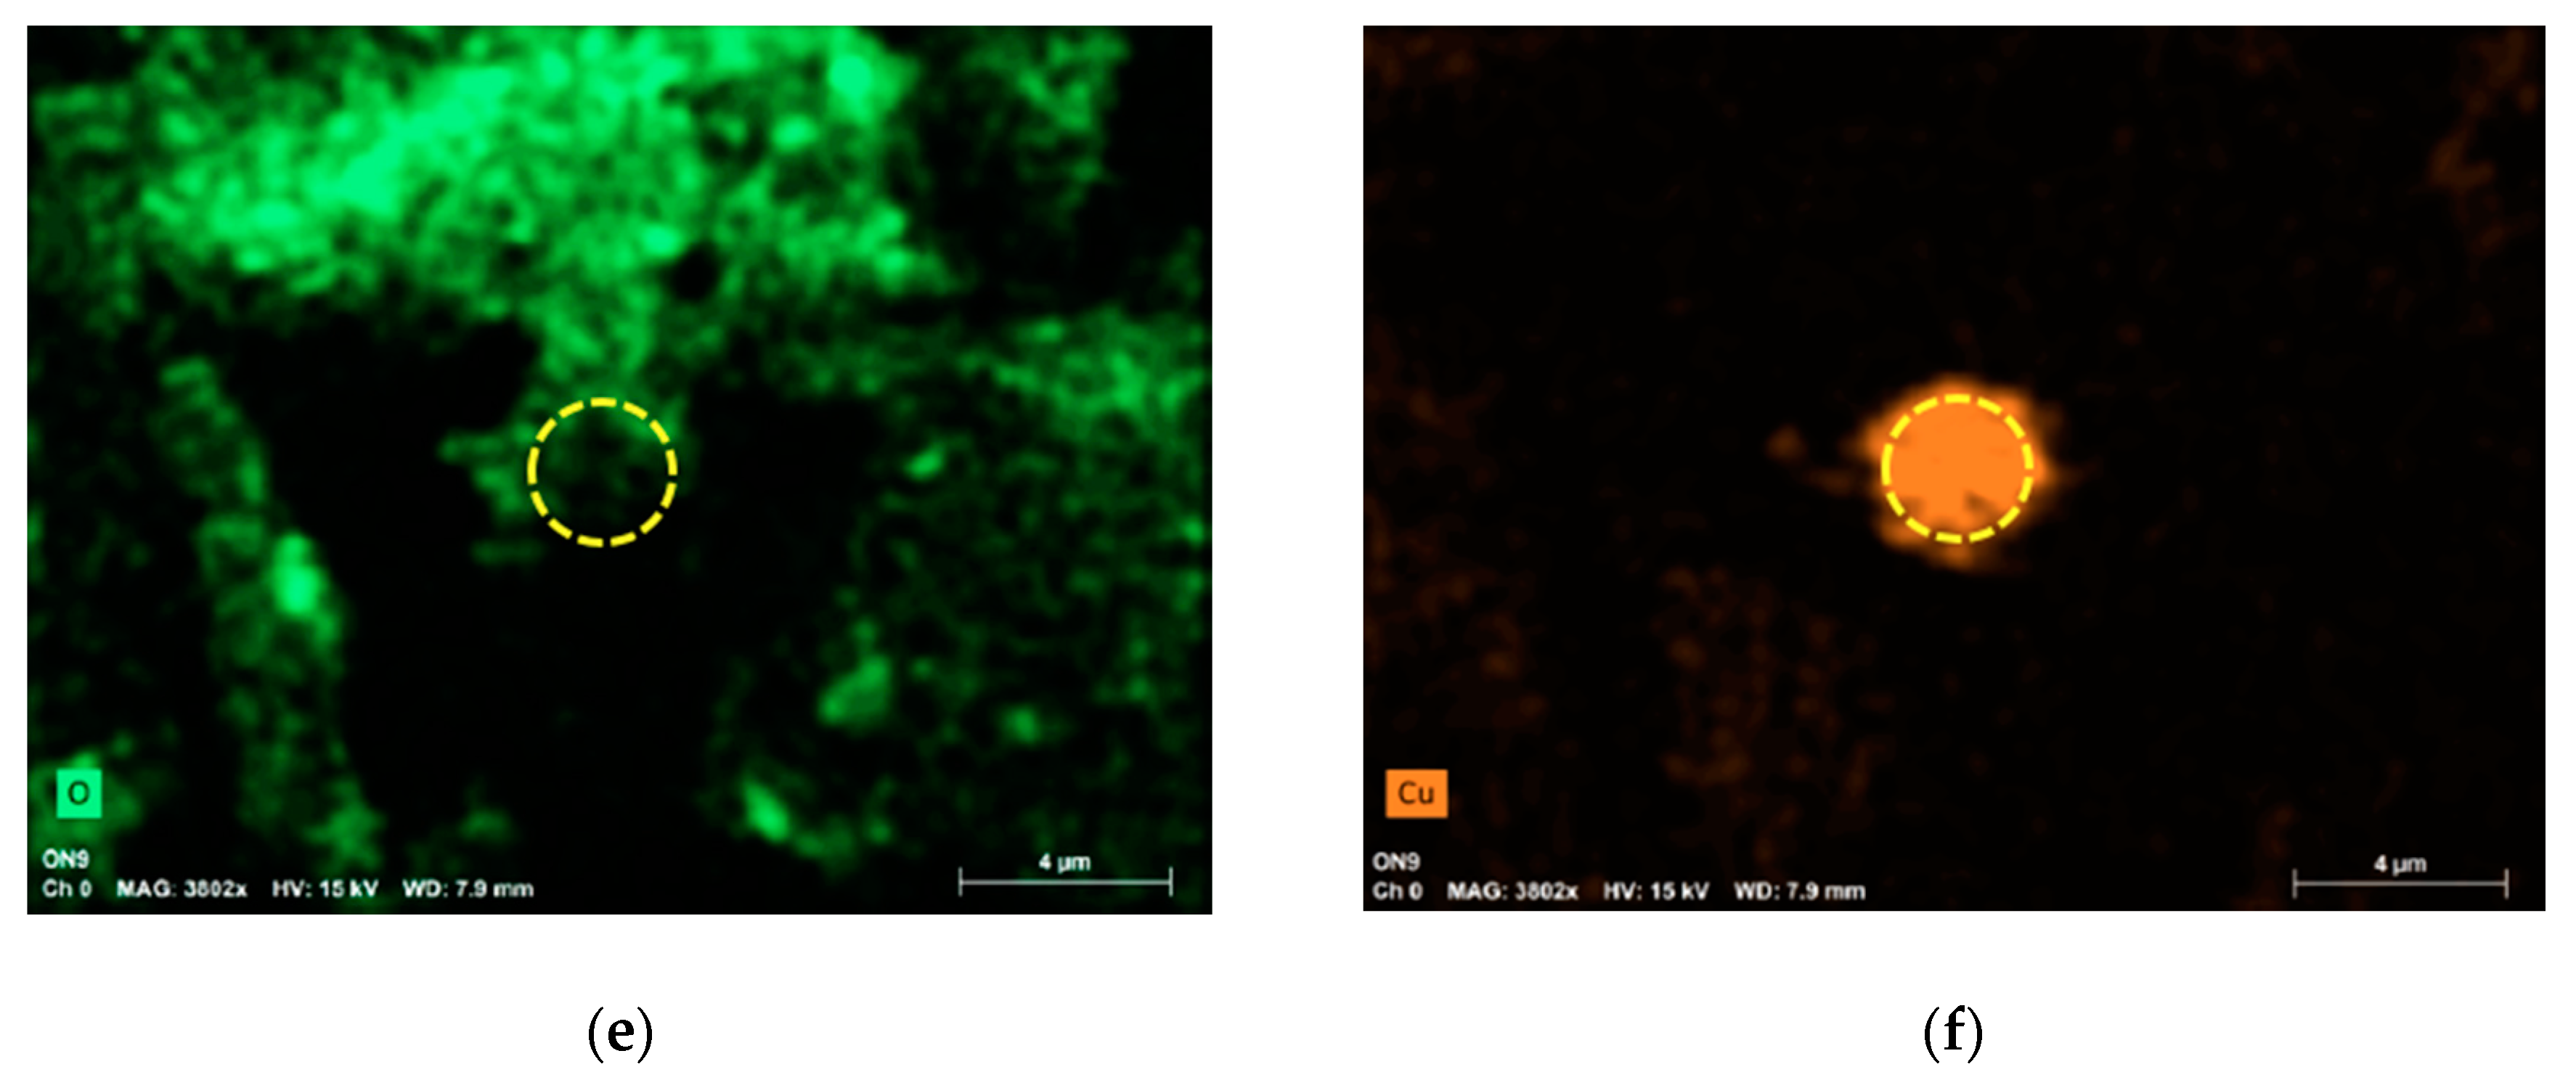
2.2. SEM Measurements
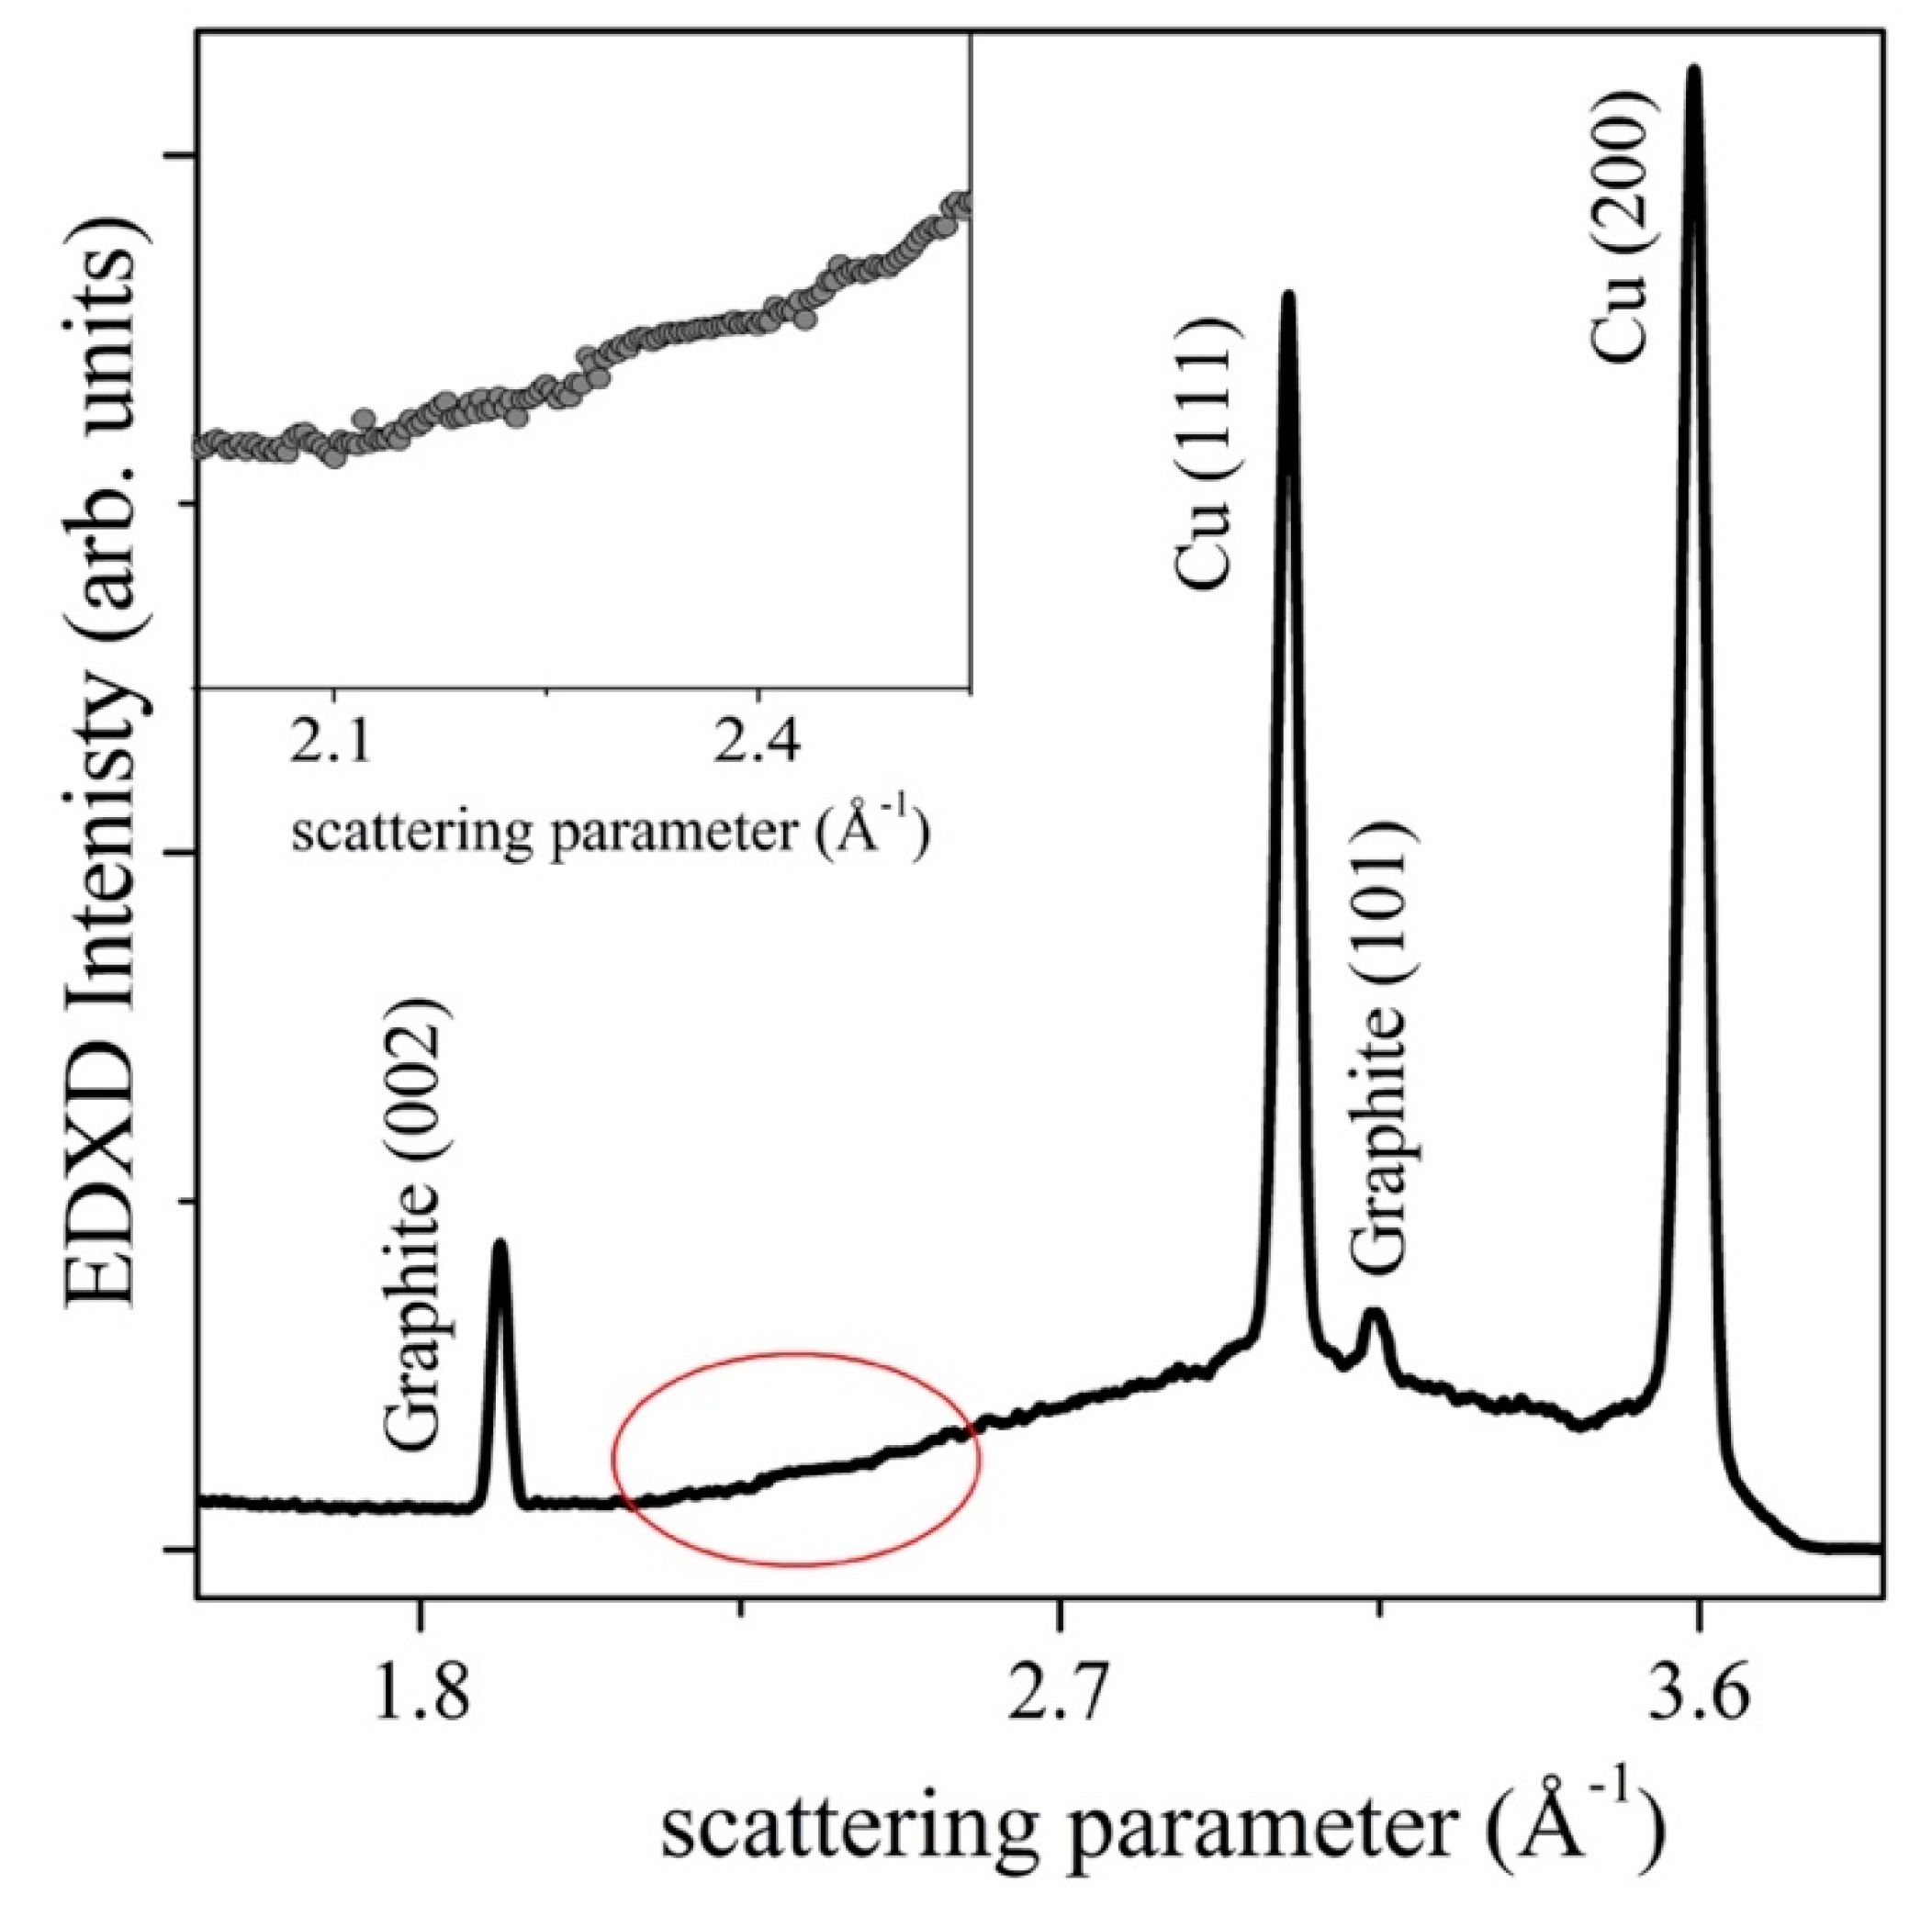
2.3. Energy Dispersive XRD Measurements
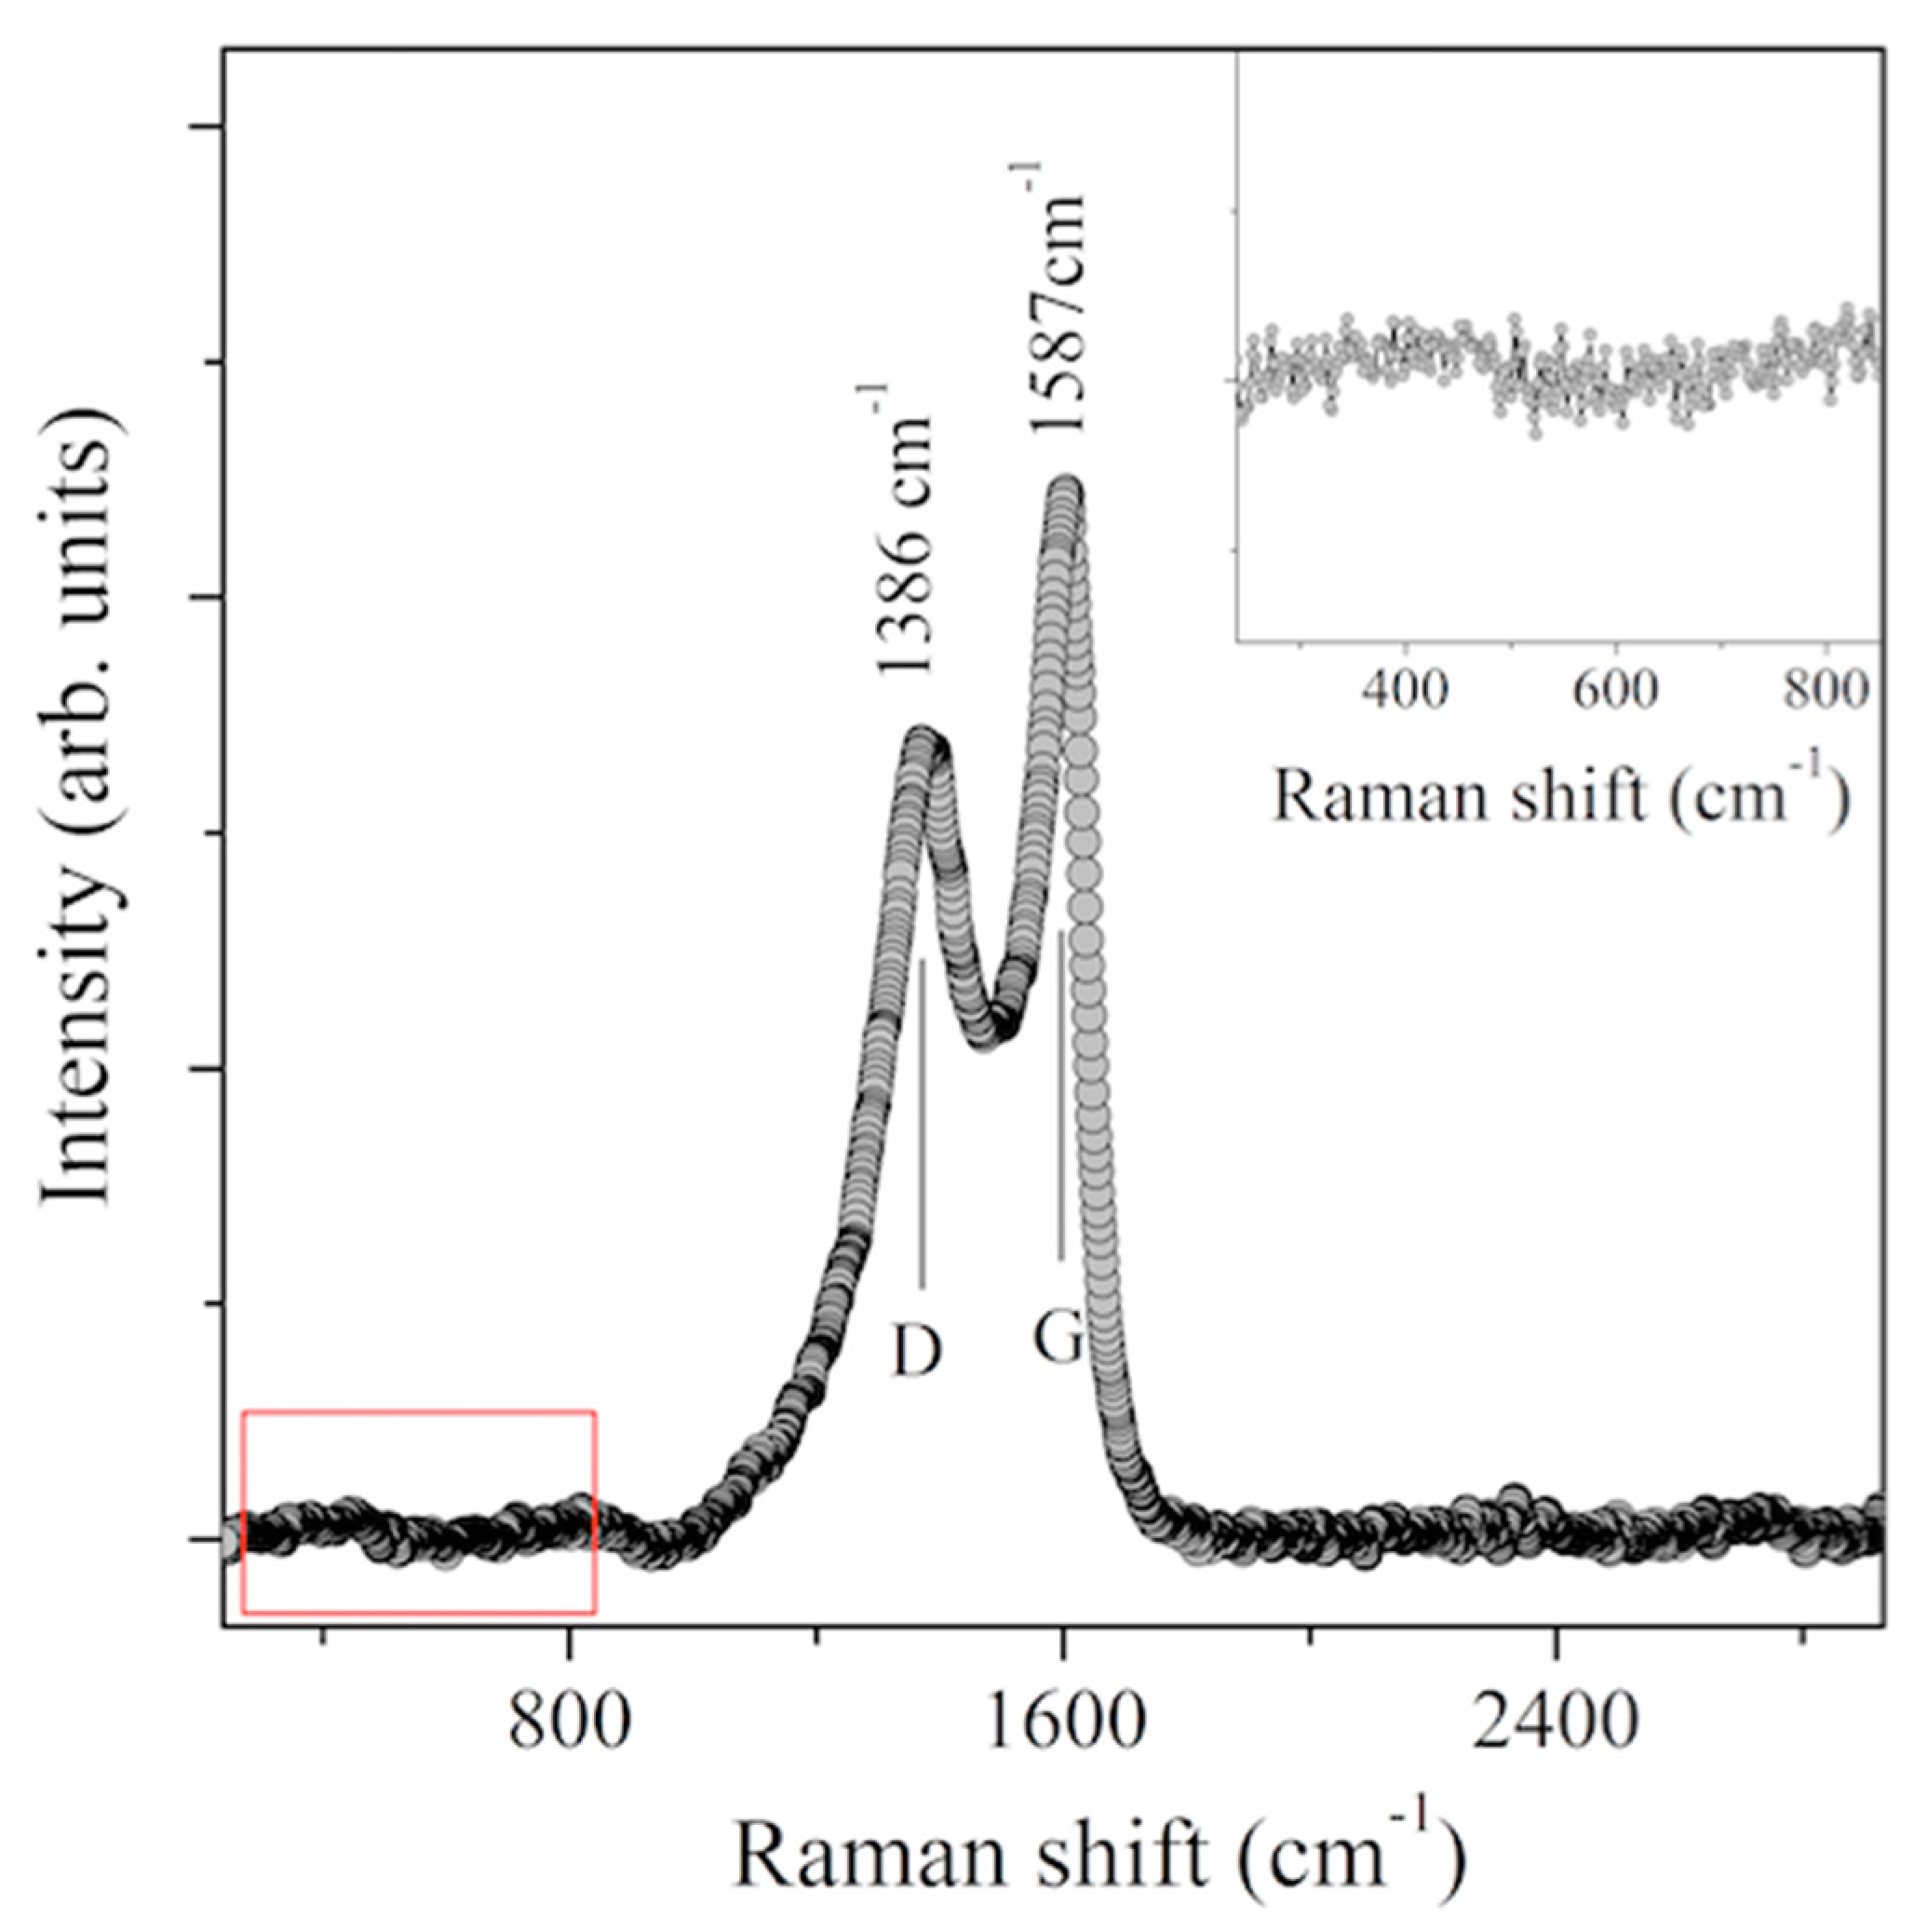
2.4. Raman Spectroscopy
3. Results and Discussion
4. Conclusions
Author Contributions
Funding
Acknowledgments
Conflicts of Interest
References
- Barth, J.V.; Costantini, G.; Kern, K. Engineering atomic and molecular nanostructures at surfaces. Naure 2005, 437, 671–679. [Google Scholar] [CrossRef] [PubMed]
- Novoselov, K.S.; Geim, A.K.; Morozov, S.V.; Jiang, D.; Zhang, Y.; Dubonos, S.V.; Grigorieva, I.V.; Firsov, A.A. Electric Field Effect in Atomically, Thin Carbon Films. Science 2004, 306, 666–669. [Google Scholar] [CrossRef] [PubMed]
- Vogt, P.; De Padova, P.; Quaresima, C.; Avila, J.; Frantzeskakis, E.; Asensio, M.C.; Resta, A.; Ealet, B.; Le Lay, G. Silicene: Compelling Experimental Evidence for Graphenelike Two-Dimensional Silicon. Phys. Rev. Lett. 2012, 108, 155501. [Google Scholar] [CrossRef] [PubMed]
- Ezawa, M.; Salomon, E.; De Padova, P.; Solonenko, D.; Vogt, P.; Dávila, M.E.; Molle, A.; Angot, T.; Le Lay, G. Fundamental and functionalities of silicene, germanene and stanine. La Rivista del Nuovo Cimento 2018, 41, 175–224. [Google Scholar]
- Li, X.; Ta, L.; Chen, Z.; Fang, H.; Li, X.; Wang, X.; Xu, J.-B.; Zhu, H. Graphene and related two-dimensional materials: Structure-property relationships for electronics and optoelectronics. Appl. Phys. Rev. 2017, 4, 021306. [Google Scholar] [CrossRef]
- Bhimanapati, G.R.; Lin, Z.; Meunier, V.; Jung, J.; Cha, J.; Das, S.; Xiao, D.; Son, Y.; Strano, M.S.; Cooper, V.R.; et al. Recent Advances in Two-Dimensional Materials beyond Graphene. ACS Nano 2015, 9, 11509–11539. [Google Scholar] [CrossRef]
- Geim, A.K.; Grigorieva, I.V. Van der Waals heterostructures. Nature 2013, 499, 419–425. [Google Scholar] [CrossRef]
- Samadi, M.; Sarikhani, N.; Zirak, M.; Zhang, H.; Zhang, H.-L.; Moshfegh, A.Z. Group 6 transition metal dichalcogenide nanomaterials: Synthesis, applications and future perspectives. Nanoscale Horiz. 2018, 3, 90–204. [Google Scholar] [CrossRef]
- Lee, M.M.; Teuscher, J.; Miyasaka, T.; Murakami, T.N.; Snaith, H.J. Efficient hybrid solar cells based on meso-superstructured organometal halide perovskites. Science 2012, 338, 643–647. [Google Scholar] [CrossRef]
- Ham, S.; Choi, Y.-J.; Lee, J.-W.; Park, N.-G.; Kim, D. Impact of Excess CH3NH3I on Free Carrier Dynamics in High-Performance Nonstoichiometric Perovskites, Efficient Hybrid Solar Cells Based on Meso-Superstructured Organometal Halide Perovskites. J. Phys. Chem. 2017, 121, 3143–3148. [Google Scholar]
- Liu, Y.; Ai, K.; Lu, L. Polydopamine and Its Derivative Materials: Synthesis and Promising Applications in Energy, Environmental, and Biomedical Fields. Chem. Rev. 2014, 114, 5057–5115. [Google Scholar] [CrossRef] [PubMed]
- De Padova, P.; Quaresima, C.; Perfetti, P.; Olivieri, B.; Leandri, C.; Aufray, B.; Le Lay, G. Growth of straight, atomically perfect, highly metallic silicon nanowires with chiral asymmetry. Nano Lett. 2008, 8, 271–275. [Google Scholar] [CrossRef] [PubMed]
- De Padova, P.; Perfetti, P.; Olivieri, B.; Quaresima, C.; Ottaviani, C.; Le Lay, G. 1D graphene-like silicon systems: Silicene nano-ribbons. J. Phys. Condens. Matt. 2012, 24, 223001. [Google Scholar] [CrossRef] [PubMed]
- De Padova, P.; Kubo, O.; Olivieri, B.; Quaresima, C.; Nakayama, T.; Aono, M.; Le Lay, G. Multilayer Silicene nanoribbons. Nano Lett. 2012, 12, 5500–5503. [Google Scholar] [CrossRef] [PubMed]
- Ertl, G. Reactions at Surfaces: From Atoms to Complexity (Nobel Lecture). Angew. Chem. Int. Ed. 2008, 47, 3524–3535. [Google Scholar] [CrossRef]
- Hoffmann, R. Small but Strong Lessons from Chemistry for Nanoscience. Angew. Chem. Int. Ed. 2013, 52, 93–103. [Google Scholar] [CrossRef]
- Poreddy, R.; Engelbrektb, C.; Riisager, A. Copper oxide as efficient catalyst for oxidative dehydrogenation of alcohols with air. Catal. Sci. Technol. 2015, 5, 2467–2477. [Google Scholar] [CrossRef]
- Kidowaki, H.; Oku, T.; Akiyama, T.; Suzuki, A.; Jeyadevan, B.; Cuya, J. Fabrication and Characterization of CuO-based Solar Cells. J. Mat. Sci. Res. 2012, 1, 138–143. [Google Scholar] [CrossRef]
- Al-Mayalee, K.H.; Saadi, N.; Badradeen, E.; Watanabe, F.; Karabaca, T. Optical and Photoconductive Response of CuO Nanostructures Grown by a Simple Hot-Water Treatment Method. J. Phys. Chem. C 2018, 122, 23312–23320. [Google Scholar] [CrossRef]
- Hsieh, C.-T.; Chen, J.-M.; Lin, H.-H.; Shih, H.-C. Field emission from various CuO nanostructures. Appl. Phys. Lett. 2003, 83, 338–3385. [Google Scholar] [CrossRef]
- Liu, J.; Huang, X.; Li, Y.; Sulieman, K.M.; Heb, X.; Sun, F. Hierarchical nanostructures of cupric oxide on a copper substrate: Controllable morphology and wettability. J. Mater. Chem. 2006, 16, 4427–4434. [Google Scholar] [CrossRef]
- Zhang, W.; Ding, S.; Yang, Z.; Liu, A.; Qian, Y.; Tang, S.; Yang, S. Growth of novel nanostructured copper oxide (CuO) films on copper foil. J. Crys. Growth 2006, 291, 479–484. [Google Scholar] [CrossRef]
- Liu, Y.; Chu, Y.; Zhuo, Y.; Li, M.; Li, L.; Dong, L. Anion-Controlled Construction of CuO Honeycombs and Flowerlike Assemblies on Copper Foils. Growth Des. 2007, 7, 467–470. [Google Scholar] [CrossRef]
- Song, M.-J.; Hwang, S.W.; Whang, D. Non-enzymatic electrochemical CuO nanoflowers sensor for hydrogen peroxide detection. Talanta 2010, 80, 1648–1652. [Google Scholar] [CrossRef]
- Gao, P.; Liu, D. Facile synthesis of copper oxide nanostructures and their application in non-enzymatic hydrogen peroxide sensing. Sens. Actuators B 2015, 208, 346–354. [Google Scholar] [CrossRef]
- Xu, J.F.; Ji, W.; Shen, Z.X.; Li, W.S.; Tang, S.H.X.; Ye, R.; Jia, D.Z.; Xin, X.Q. Raman Spectra of CuO Nanocrystals. J. Raman Spectrosc. 1999, 30, 413–415. [Google Scholar] [CrossRef]
- Phuruangrat, A.; Thoonchalong, P.; Thongtem, S.; Thongtem, T. Synthesis of CuS with different morphologies by refluxing method: Nanoparticles in clusters and nanoflakes in spongelike clusters. Chalcog. Lett. 2012, 9, 421–426. [Google Scholar]
- Phuruangrat, A.; Thongtem, T.; Thongtem, S. Characterization of copper sulfide hexananoplates, and nanoparticles synthesized by a sonochemical method. Chalcog. Lett. 2011, 8, 291–295. [Google Scholar]
- Thongtem, T.; Phuruangrat, A.; Thongtem, S. Characterization of copper sulfide nanostructured spheres and nanotubes synthesized by microwave-assisted solvothermal method. Mat. Lett. 2010, 64, 136–139. [Google Scholar] [CrossRef]
- Thongtem, T.; Phuruangrat, A.; Thongtem, S. Formation of CuS with flower-like, hollow spherical, and tubular structures using the solvothermal-microwave process. Curr. Appl. Phys. 2009, 9, 195–200. [Google Scholar] [CrossRef]
- Wang, Z.; Zhang, X.; Zhang, Y.; Li, M.; Qin, C.; Bakenov, Z. Chemical Dealloying Synthesis of CuS Nanowire-on-Nanoplate Network as Anode Materials for Li-Ion Batteries. Metals 2018, 8, 252. [Google Scholar] [CrossRef]
- Ge, J.; Lei, J.; Zare, R.N. Protein–inorganic hybrid nanoflowers. Nat. Nanotechnol. 2012, 7, 429–432. [Google Scholar] [CrossRef] [PubMed]
- Kroto, H.W.; Heat, J.R.; O’Brien, S.C.; Curl, R.F.; Smalley, R.E. C60: Buckminsterfullerene. Nature 1985, 318, 162–163. [Google Scholar] [CrossRef]
- Taylor, R.; Hare, J.P.; Abdul-Sada, A.K.; Kroto, H.W. Isolation, Separation and Characterisation of the Fullerenes C60 and C70: The Third Form of Carbon. J. Chem. Soc. Chem. Commun. 1990, 1423–1425. [Google Scholar] [CrossRef]
- Ettl, R.; Chao, I.; Diederich, F.; Whetten, R.L. Isolation of C76, a chiral (D2) allotrope of carbon. Nature 1991, 353, 149–153. [Google Scholar] [CrossRef]
- Sun, G.; Kertesz, M. Theoretical 13C NMR Spectra of IPR Isomers of Fullerenes C60, C70, C72, C74, C76, and C78 Studied by Density Functional Theory. J. Phys. Chem. A 2000, 104, 7398–7403. [Google Scholar] [CrossRef]
- Dekker, C. Carbon nanotubes as molecular quantum wires. Phys. Today 1999, 52, 22–28. [Google Scholar] [CrossRef]
- Geim, A.K.; Novoselov, K.S. The rise of graphene. Nat. Mater. 2007, 6, 183–191. [Google Scholar] [CrossRef]
- Kharisu, C.S.; Koki, I.B.; Ikram, R.; Low, K.H. Elemental variations and safety assessment of commercial onions (Allium cepa) by inductively coupled plasma-mass spectrometry and chemometrics. Int. Food Res. J. 2019, 26, 1717–1724. [Google Scholar]
- Supriya, S.; Sriram, G.; Ngaini, Z.; Kavitha, C.; Kurkuri, M.; De Padova, I.P.; Hegde, G. The Role of Temperature on Physical–Chemical Properties of Green Synthesized Porous Carbon Nanoparticles. Waste Biomass Valor. 2019. [Google Scholar] [CrossRef]
- Linnaei, C. Species Plantarum; Holmiae Impensis Laurentii Salvii: Uppsala, Sweden; Paris, France, 1753; Volume Tomus I, pp. 300–301. [Google Scholar]
- Paci, B.; Generosi, A.; Rossi Albertini, V.; Agostinelli, E.; Varvaro, G.; Fiorani, D. Structural and Morphological Characterization by Energy Dispersive X-ray Diffractometry and Reflectometry Measurements of Cr/Pt Bilayer Films. Chem. Mater. 2004, 16, 292–298. [Google Scholar] [CrossRef]
- Li, Z.; Ma, Z.; Wen, Y.; Ren, Y.; Wei, Z.; Xing, X.; Sun, H.; Zhang, Y.-W.; Song, W. Copper Nanoflower Assembled by Sub-2 nm Rough Nanowires for Efficient Oxygen Reduction Reaction: High Stability and Poison Resistance and Density Functional Calculations. ACS Appl. Mater. Interfaces 2018, 10, 26233–26240. [Google Scholar] [CrossRef] [PubMed]
- Suber, L.; Plunkett, W.R. Formation mechanism of silver nanoparticle 1D microstructures and their hierarchical assembly into 3D superstructures. Nanoscale 2010, 2, 128–133. [Google Scholar] [CrossRef] [PubMed]
- Takéuchi, Y.; Kudoh, Y.; Sato, G. The crystal structure of covellite CuS under high pressure Up to 33 kbar. Zeitschrift für Kristallographie 1985, 173, 119–128. [Google Scholar] [CrossRef]
- Tuinstra, F.; Koenig, J.L. Raman Spectrum of Graphite. J. Chem. Phys. 1970, 53, 1126–1130. [Google Scholar] [CrossRef]
- Puech, P.; Kandara, M.; Paredes, G.; Moulin, L.; Elsa Weiss-Hortala, E.; Kundu, A.; Ratel-Ramond, N.; Plewa, J.-M.; Pellenq, R.; Monthioux, M. Analyzing the Raman Spectra of Graphenic Carbon Materials from Kerogens to Nanotubes: What Type of Information Can Be Extracted from Defect Bands? C 2019, 5, 69. [Google Scholar] [CrossRef]
- Ferrari, A.C.; Meyer, J.C.; Scardaci, V.; Casiraghi, C.; Lazzeri, M.; Mauri, F.; Piscanec, S.; Jiang, D.; Novoselov, K.S.; Roth, S.; et al. Raman Spectrum of Graphene and Graphene Layers. Phys. Rev. Lett. 2006, 97, 187401. [Google Scholar] [CrossRef]


© 2020 by the authors. Licensee MDPI, Basel, Switzerland. This article is an open access article distributed under the terms and conditions of the Creative Commons Attribution (CC BY) license (http://creativecommons.org/licenses/by/4.0/).
Share and Cite
De Padova, P.; Generosi, A.; Paci, B.; Olivieri, B.; Ottaviani, C.; Quaresima, C.; Suber, L.; Di Pietrantonio, F.; Della Ventura, G.; Pilloni, L.; et al. Cu Nano-Roses Self-Assembly from Allium cepa, L., Pyrolysis by Green Synthesis of C Nanostructures. Appl. Sci. 2020, 10, 3819. https://doi.org/10.3390/app10113819
De Padova P, Generosi A, Paci B, Olivieri B, Ottaviani C, Quaresima C, Suber L, Di Pietrantonio F, Della Ventura G, Pilloni L, et al. Cu Nano-Roses Self-Assembly from Allium cepa, L., Pyrolysis by Green Synthesis of C Nanostructures. Applied Sciences. 2020; 10(11):3819. https://doi.org/10.3390/app10113819
Chicago/Turabian StyleDe Padova, Paola, Amanda Generosi, Barbara Paci, Bruno Olivieri, Carlo Ottaviani, Claudio Quaresima, Lorenza Suber, Fabio Di Pietrantonio, Giancarlo Della Ventura, Luciano Pilloni, and et al. 2020. "Cu Nano-Roses Self-Assembly from Allium cepa, L., Pyrolysis by Green Synthesis of C Nanostructures" Applied Sciences 10, no. 11: 3819. https://doi.org/10.3390/app10113819
APA StyleDe Padova, P., Generosi, A., Paci, B., Olivieri, B., Ottaviani, C., Quaresima, C., Suber, L., Di Pietrantonio, F., Della Ventura, G., Pilloni, L., Supriya, S., & Hegde, G. (2020). Cu Nano-Roses Self-Assembly from Allium cepa, L., Pyrolysis by Green Synthesis of C Nanostructures. Applied Sciences, 10(11), 3819. https://doi.org/10.3390/app10113819