Article

Noise Suppression of Microseismic Signals via Adaptive Variational Mode Decomposition and Akaike Information Criterion

State Key Laboratory of Hydraulics and Mountain River Engineering, College of Water Resource and Hydropower, Sichuan University, Chengdu 610065, China
*
Author to whom correspondence should be addressed.
Appl. Sci. 2020, 10(11), 3790; https://doi.org/10.3390/app10113790
Submission received: 13 May 2020 / Revised: 23 May 2020 / Accepted: 25 May 2020 / Published: 29 May 2020
(This article belongs to the Section Civil Engineering)

Abstract

:

Featured Application

This method can adaptively denoise various microseismic signals collected in the geotechnical engineering and improve the signal quality.

Abstract

Microseismic (MS) signals recorded by sensors are often mixed with various noise, which produce some interference to the further analysis of the collected data. One problem of many existing noise suppression methods is to deal with noisy signals in a unified strategy, which results in low-frequency noise in the non-microseismic section remaining. Based on this, we have developed a novel MS denoising method combining variational mode decomposition (VMD) and Akaike information criterion (AIC). The method first applied VMD to decompose a signal into several limited-bandwidth intrinsic mode functions and adaptively determined the effective components by the difference of correlation coefficient. After reconstructing, the improved AIC method was used to determine the location of the valuable waveform, and the residual fluctuations in other positions were further removed. A synthetic wavelet signal and some synthetic MS signals with different signal-to-noise ratios (SNRs) were used to test its denoising effect with ensemble empirical mode decomposition (EEMD), complete ensemble empirical mode decomposition (CEEMD), and the VMD method. The experimental results depicted that the SNRs of the proposed method were obviously larger than that of other methods, and the waveform and spectrum became cleaner based on VMD. The processing results of the MS signal of Shuangjiangkou Hydropower Station also illustrated its good denoising ability and robust performance to signals with different characteristics.

1. Introduction

Brittle failure of rock masses triggered by engineering activities and natural changes results in the energy release with the spreading of a seismic wave, which is called a microseismic (MS) event [1]. To better understand the relationship between rock fracturing and production activities, MS monitoring, a real-time monitoring technique, has been widely applied in various rock engineering projects, such as mining engineering [2], underground caverns [3,4], slope stability [5,6], oil and gas extraction [7,8], etc. The technique utilizes multiple sensors installed in the monitoring borehole to record MS signals for the exploration of internal development characteristics of rock rupture.
However, due to the complex construction environment and geological conditions, the collected signal is often contaminated by random background noise. Due to the complicated causes, its frequency and amplitude are distributed across the whole period. The existence of noise in time serials will interfere subsequent analysis, such as the automatic recognition of signal types [9], and the inversion and location of seismic events [10]. Therefore, it is crucial to extract the MS signal from various kinds of noise for obtaining reasonable analysis results.
To effectively improve the quality of the collected signal, numerous classical algorithms have been introduced and further developed for better suitability to engineering conditions, such as t-x prediction filtering [11], wavelet transform (WT) [12,13,14], singular value decomposition (SVD) [15,16], empirical mode decomposition (EMD) [17,18,19,20], mathematical morphology [21], shearlet transform [22,23], compressed sensing [24], machine learning [25,26,27], and the short time Fourier transform [28]. Oropeza and Sacchi [29] took advantage of a rank reduction algorithm called multichannel singular spectrum analysis (MSSA) to alleviate the influence of random noise in seismic records. For reducing low-frequency noise, Li et al. [21] introduced the mathematical morphology theory to MS signals, but the selection of structural elements in this method requires some experience. By dividing the MS data matrix into many small blocks, Lv [16] used SVD to quickly reconstruct multi-channel seismic data. Zhang and van der Baan [25] constructed the unsupervised nonparametric machine learning model by obtaining a reasonable dictionary from the noisy data, thereby recovering the missing seismic traces. Due to more excellent localization ability than Fourier transform, WT was also introduced to transform a signal into multiple wavelet coefficients through the mother wavelet [30]. For further improving the resolution in time-frequency domain, Mousavi et al. [13] proposed applying synchrosqueezed continuous wavelet transform (SS-CWT) to detect small events buried in the nonstationary noise. The test results showed that a larger part of noise was eliminated from small-amplitude MS signal in contrast to conventional denoising methods. By adjusting the parameters of the hybrid block thresholding (BT) to the inferred signal property, Mousavi and Langston [12] combined BT with the continuous wavelet transform to improve the quality of the real seismic signal.
In addition to the above methods, another dominant algorithm to suppress noise is the EMD method. It is a recursive approach proposed by Huang Norden et al. [31], which can adaptively decompose a nonstationary signal into a group of intrinsic mode functions (IMFs). It is not necessary to preset the basic function of EMD and the decomposition procedure is completely automatic, both of which are different from the well-known WT. Battista et al. [17] successfully applied it to remove cable interference from seismic data, and Bekara and Van der Baan [18] proposed a f-x EMD method to suppress the random and coherent noise in complex geologic sections. However, EMD has the problem of mode mixing, that different time scales are contained in a mode function, which blurs the distinction between effective components and random noise. To eliminate the problem, Wu and Huang [32] developed ensemble empirical mode decomposition (EEMD), applying noise-assisted technology to compensate for the absent frequency. As the mean of white noise is zero, the amplitude of the signal has hardly changed after multiple iterations. Based on the promising characteristics, Han and van der Baan [33] developed a new seismic denoising method combining EEMD with adaptive thresholding. For less energy leakage caused by the extra noise, Torres et al. [34] proposed a novel noise-supplement method called complete ensemble empirical mode decomposition (CEEMD). By adding a set of positive and negative white noise to the signal, its decomposition result is the average of the added signals. Han and van der Baan [20] applied it to acquire a higher spectral-spatial resolution than WT. The problem of mode aliasing has been alleviated in these methods by altering the distribution of extreme points, but is never solved.
Dragomiretskiy and Zosso [35] developed a new recursive method, called variational mode decomposition (VMD), as an alternative of EMD-based methods. It can achieve adaptive separation between frequency bands of nonstationary time series through iterative optimization. Different from the EMD-based methods, it has a sufficient mathematic foundation, and its mode has a specific physical meaning, which is assumed into a frequency component mostly compacted around a certain center frequency. Besides, there is no modal aliasing existing in its non-linear components. However, MS signals, unlike voice signals or current signals covering the entire time window, usually account for only a part of the monitoring period due to their own uniqueness. Except for the interval where the effective signal exists, the sample points at other locations have little contribution to the post-analysis of MS events. The VMD algorithm, despite its outstanding performance, processes the noisy signal in the entire time window like most of the above algorithms. It can only separate the high-frequency noise from the effective signal by choosing appropriate components. However, it does not play an important role in residual fluctuations at non-signal positions because of their similarity in wave characteristics. To overcome the shortcoming, Akaike information criterion (AIC) is introduced to determine the location of the effective signal in the time window. The quality of MS signal can be further improved by being processed in sections.
The purpose of this paper is to develop a new method combining VMD and AIC to suppress random noise in MS signals. In the following section, we first introduce the theoretical background of VMD and AIC, and give the basic criterion of choosing valuable modes. Next, the proposed method is applied to a simple synthetic example and 11 synthetic MS signals with different SNRs to compare its performance with EEMD, CEEMD and VMD. Finally, we denoise 40 noisy signals collected in Shuangjiangkou Hydropower Station by these methods.

2. Theory

2.1. Variational Mode Decomposition

The VMD algorithm is a new-developed non-recursive method that converts the problem of signal decomposition into a variational problem. Through continuous iterative search, the optimal solution to the variational problem is finally determined, which is regarded as modes of a signal. Modes in the method are assumed into an ensemble of IMFs with a certain center frequency and limited bandwidth. For the best decomposition result, the variational problem can be described as minimizing the sum of the estimated modal bandwidths and its constrained condition is that the sum of modes is equal to the original signal, just as follows [35]:
min { u k } , { ω k } { k t [ ( δ ( t ) + j π t ) * u k ( t ) ] e j ω k t 2 2 }
s . t   k u k = x
where u k ( t ) is the k-th variational modal component, x is the original noisy signal, ω k is the center frequency of the k-th component, * denotes convolution, and δ ( t ) is the Dirac distribution. To get the corresponding solution, the Lagrangian multiplier λ and a quadratic penalty term α are introduced to render the problem unconstrained. The augmented Lagrangian function L is expressed as follows:
L ( u k , w k , λ ) = α k t [ ( δ ( t ) + j π t ) u k ( t ) ] × e j w k t 2 2 + x ( t ) k u k ( t ) 2 2 + λ ( t ) , x ( t ) k u k ( t )
The optimal solution of the original variational problem is considered as the saddle point of the augmented Lagrangian function. By alternate direction method of multipliers (ADMM), the mode u k ( t ) in the time domain and the center frequency ω k of the estimated mode can be given by the following equation:
u ^ k n + 1 ( ω ) = f ^ ( ω ) i < k u ^ i n + 1 ( ω ) i > k u ^ i n ( ω ) + λ ^ n ( ω ) 2 1 + 2 α ( ω ω k n ) 2
u ^ k ( t ) = [ i f f t ( u ^ k ( ω ) ) ]
ω k n + 1 = 0 ω | u ^ k n + 1 ( ω ) | 2 d ω 0 | u ^ k n + 1 ( ω ) | 2 d ω
where u ^ k ( ω ) , f ^ ( ω ) , and λ ^ ( ω ) are the Fourier transforms of u k ( t ) , f ( t ) , and λ ( t ) , respectively, i f f t ( · ) denotes the inverse Fourier transforms of modes u ^ k ( ω ) , and ( · ) means obtaining the real part of the filtered analysis signal.

2.2. Akaike Information Criterion

AIC selector of seismic signals applies the AIC theory to the autoregressive model (AR) to accurately pick up the first arrival position of the effective signal in the time window. For a signal at time t, its mathematical expression of AR can be expressed as [36]:
x t = m = 1 M a m i x [ t m ] + e t i
where a m i is the m-th autocorrelation coefficient, M is the selected window length, and e t i is the error predicted by the model, which follows the Gaussian distribution with an average value of zero. By dividing the entire time series into noise and signal segments, we derive the approximate likelihood function L of the error:
L ( x , k , M , a j i , σ i 2 ) = i = 1 2 ( ( 2 π σ i 2 ) n / 2 · exp ( 1 2 σ i 2 m = 1 M a m i x [ j m ] ) 2 )
By finding the maximum likelihood estimate of the variance σ i 2 , the maximum value of the function can be solved:
log ( L ) = 1 2 ( K M ) log ( σ 1 2 max ) 1 2 ( N K + M ) log ( σ 2 2 max ) + C
where (KM) is the window length of noise, and N is the total time window length, σ 1 2 and σ 2 2 indicate the variance of noise and signal, respectively, and C is a constant. Then maximum likelihood estimation of the AIC value can be calculated:
A I C ( K ) = ( K M ) log ( σ 1 2 max ) + ( n K + M ) log ( σ 2 2 max ) 2 C
In order to obtain the best AIC value, it is necessary to determine the appropriate position to minimize the error variance of the noise and the signal. Due to too many parameters and complex calculations, Maeda [37] improved the calculation method of the AIC function and got the following equation:
A I C ( k w ) = k w log ( var ( x ( 1 , k w ) ) ) + ( n w k w ) log ( var ( x ( k w + 1 , n w ) ) )
where k w , sliding along the time axis, represents the position of the window boundary. The position where the minimum value of AIC appears is the boundary between two adjacent time windows with different characteristics. There will be some errors in positioning a certain point of the microseism if only considering the entire waveform. Therefore, it is necessary to improve the AIC algorithm to better adapt to the characteristics of MS signals.

2.3. The Adaptive VMD-AIC Method

The result of VMD is a collection of oscillation components from high to low frequency. For obtaining a good noise reduction effect, it is necessary to choose the appropriate sub-signals, which are the basis of reconstruction. The Pearson correlation coefficient (CC) is introduced to determine the boundary position of the noise sub-signal and the valuable sub-signal, which is defined as follows [38,39]:
C C ( j ) = E ( x t I M F t ( j ) ) E ( x t ) E ( I M F t ( j ) ) E ( x t 2 ) E ( x t ) 2 E ( I M F t ( j ) 2 ) E ( I M F t ( j ) ) 2
where E is the mathematical expectation, I M F t ( j ) is the j-th sub-signal, and C C ( j ) is the j-th correlation coefficient. It is an indicator to measure the relevance of different data sets. The decomposed IMF components have different correlations with the original signal. The dominant MS component usually has a large CC value, while the disordered noise component corresponds to a small CC value. In the transition component from noise to signal, there will be a sudden increase in the value of CC, which is used to distinguish the above two types of components.
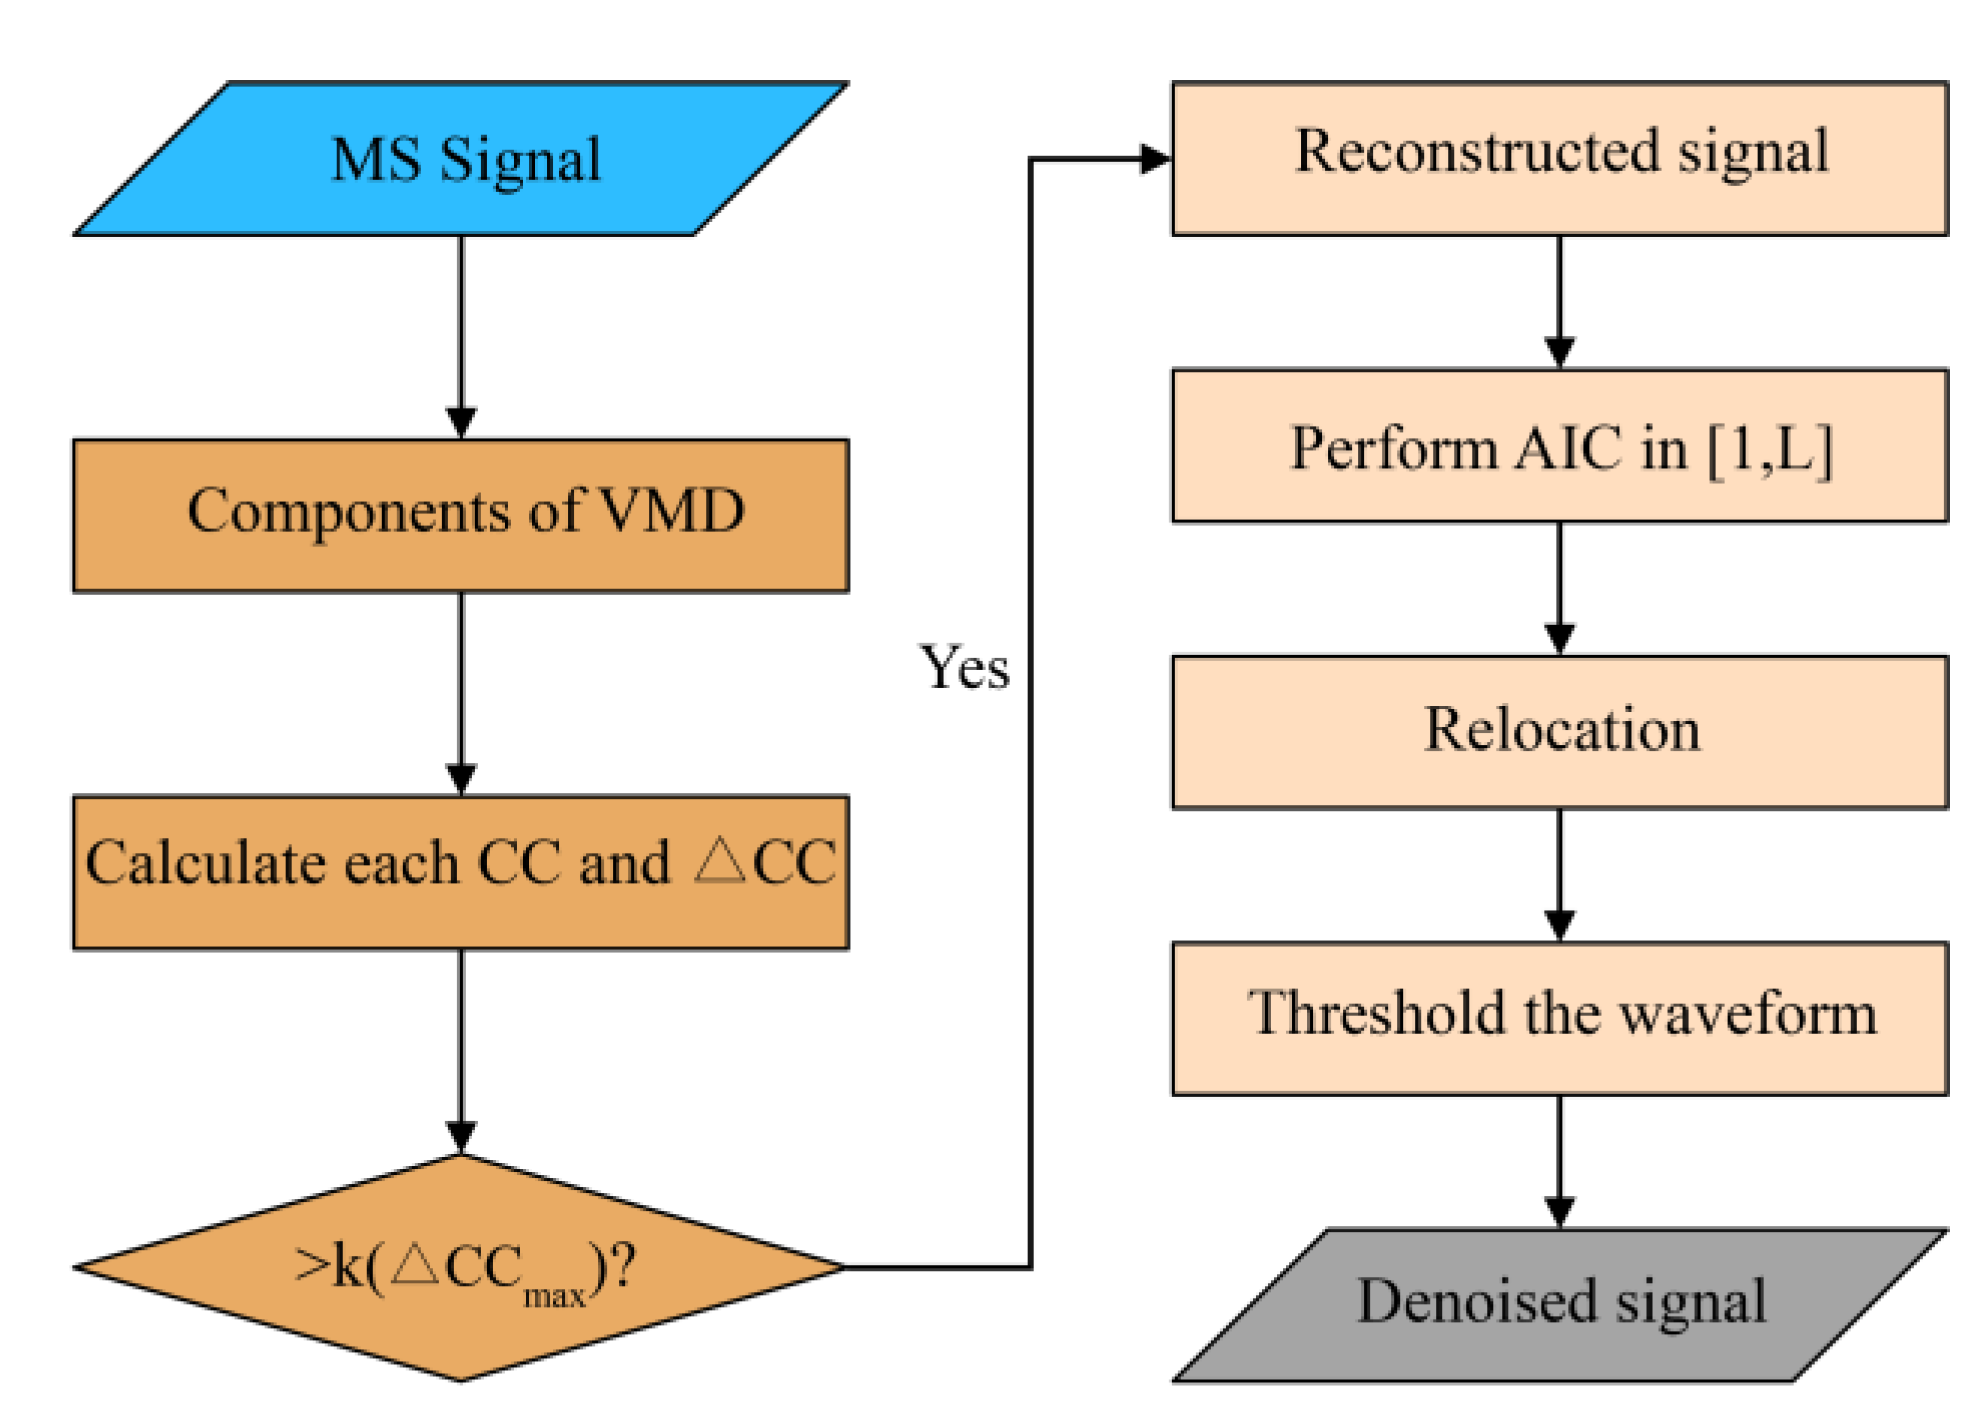
A typical noisy MS signal can be roughly divided into three parts: the front noise segment, the middle MS signal segment, and the rear noise segment, just as shown in Figure 1. Only the middle MS part, reflecting the rock fracture and stress level, is what the researchers need. If the noise in the front and rear sections are removed, the MS characteristics can be further highlighted. After removing the high-frequency noise component through the correlation coefficient, we use the AIC method to determine the distribution interval of the MS waveform. The first arrival position of the MS waveform is relatively accurately determined because of its obvious fluctuation. We only need to make adjustments in a small range on the basis of initial positioning to get a more exact starting position. The end position of MS is not so prominent due to its low amplitude and its mixing with noise. Therefore, it is necessary to reuse AIC on the rear section separately to obtain a better positioning result. After locating, those data points that are considered to be noise are thresholded to zero while leaving the rest unchanged. The multiple window denoising method combining VMD and AIC is processed by scheme in Figure 2, and the detailed implementation steps are as follows:
Step 1: Perform VMD on the MS signal to obtain K variational mode components.
Step 2: Calculate CC of each component and its difference between its neighbors, △CC.
Step 3: Determine the boundary component with the largest △CC and select the components after the boundary component to reconstruct the signal.
Step 4: Calculate the AIC value of the entire time window of the reconstructed signal and determine the first start position S1 and the first end position E1 of the AIC minimum values before and after the maximum value of the waveform, respectively.
Step 5: In the interval section [S1 − (R − S1)/4, S1 + (R − S1)/4], the AIC method is applied again to obtain a more accurate starting position S, where R is the position where the maximum value is located.
Step 6: In the rear noise section [E1 − (R − S1)/4, L], apply the AIC method to determine the corrected minimum position E2, where L is the time window length.
Step 7: Threshold the waveform in window [1, S] and [E2, L] to zero, and obtain the processed signal.

3. Synthetic Examples

3.1. Synthetic Wavelet Example

To test the noise attenuation performance of the presented method, a synthetic example based on Ricker wavelet is introduced to simulate a seismic wave:
f ( t ) = ( 1 2 π 2 f p 2 t 2 ) e π 2 f p 2 t 2
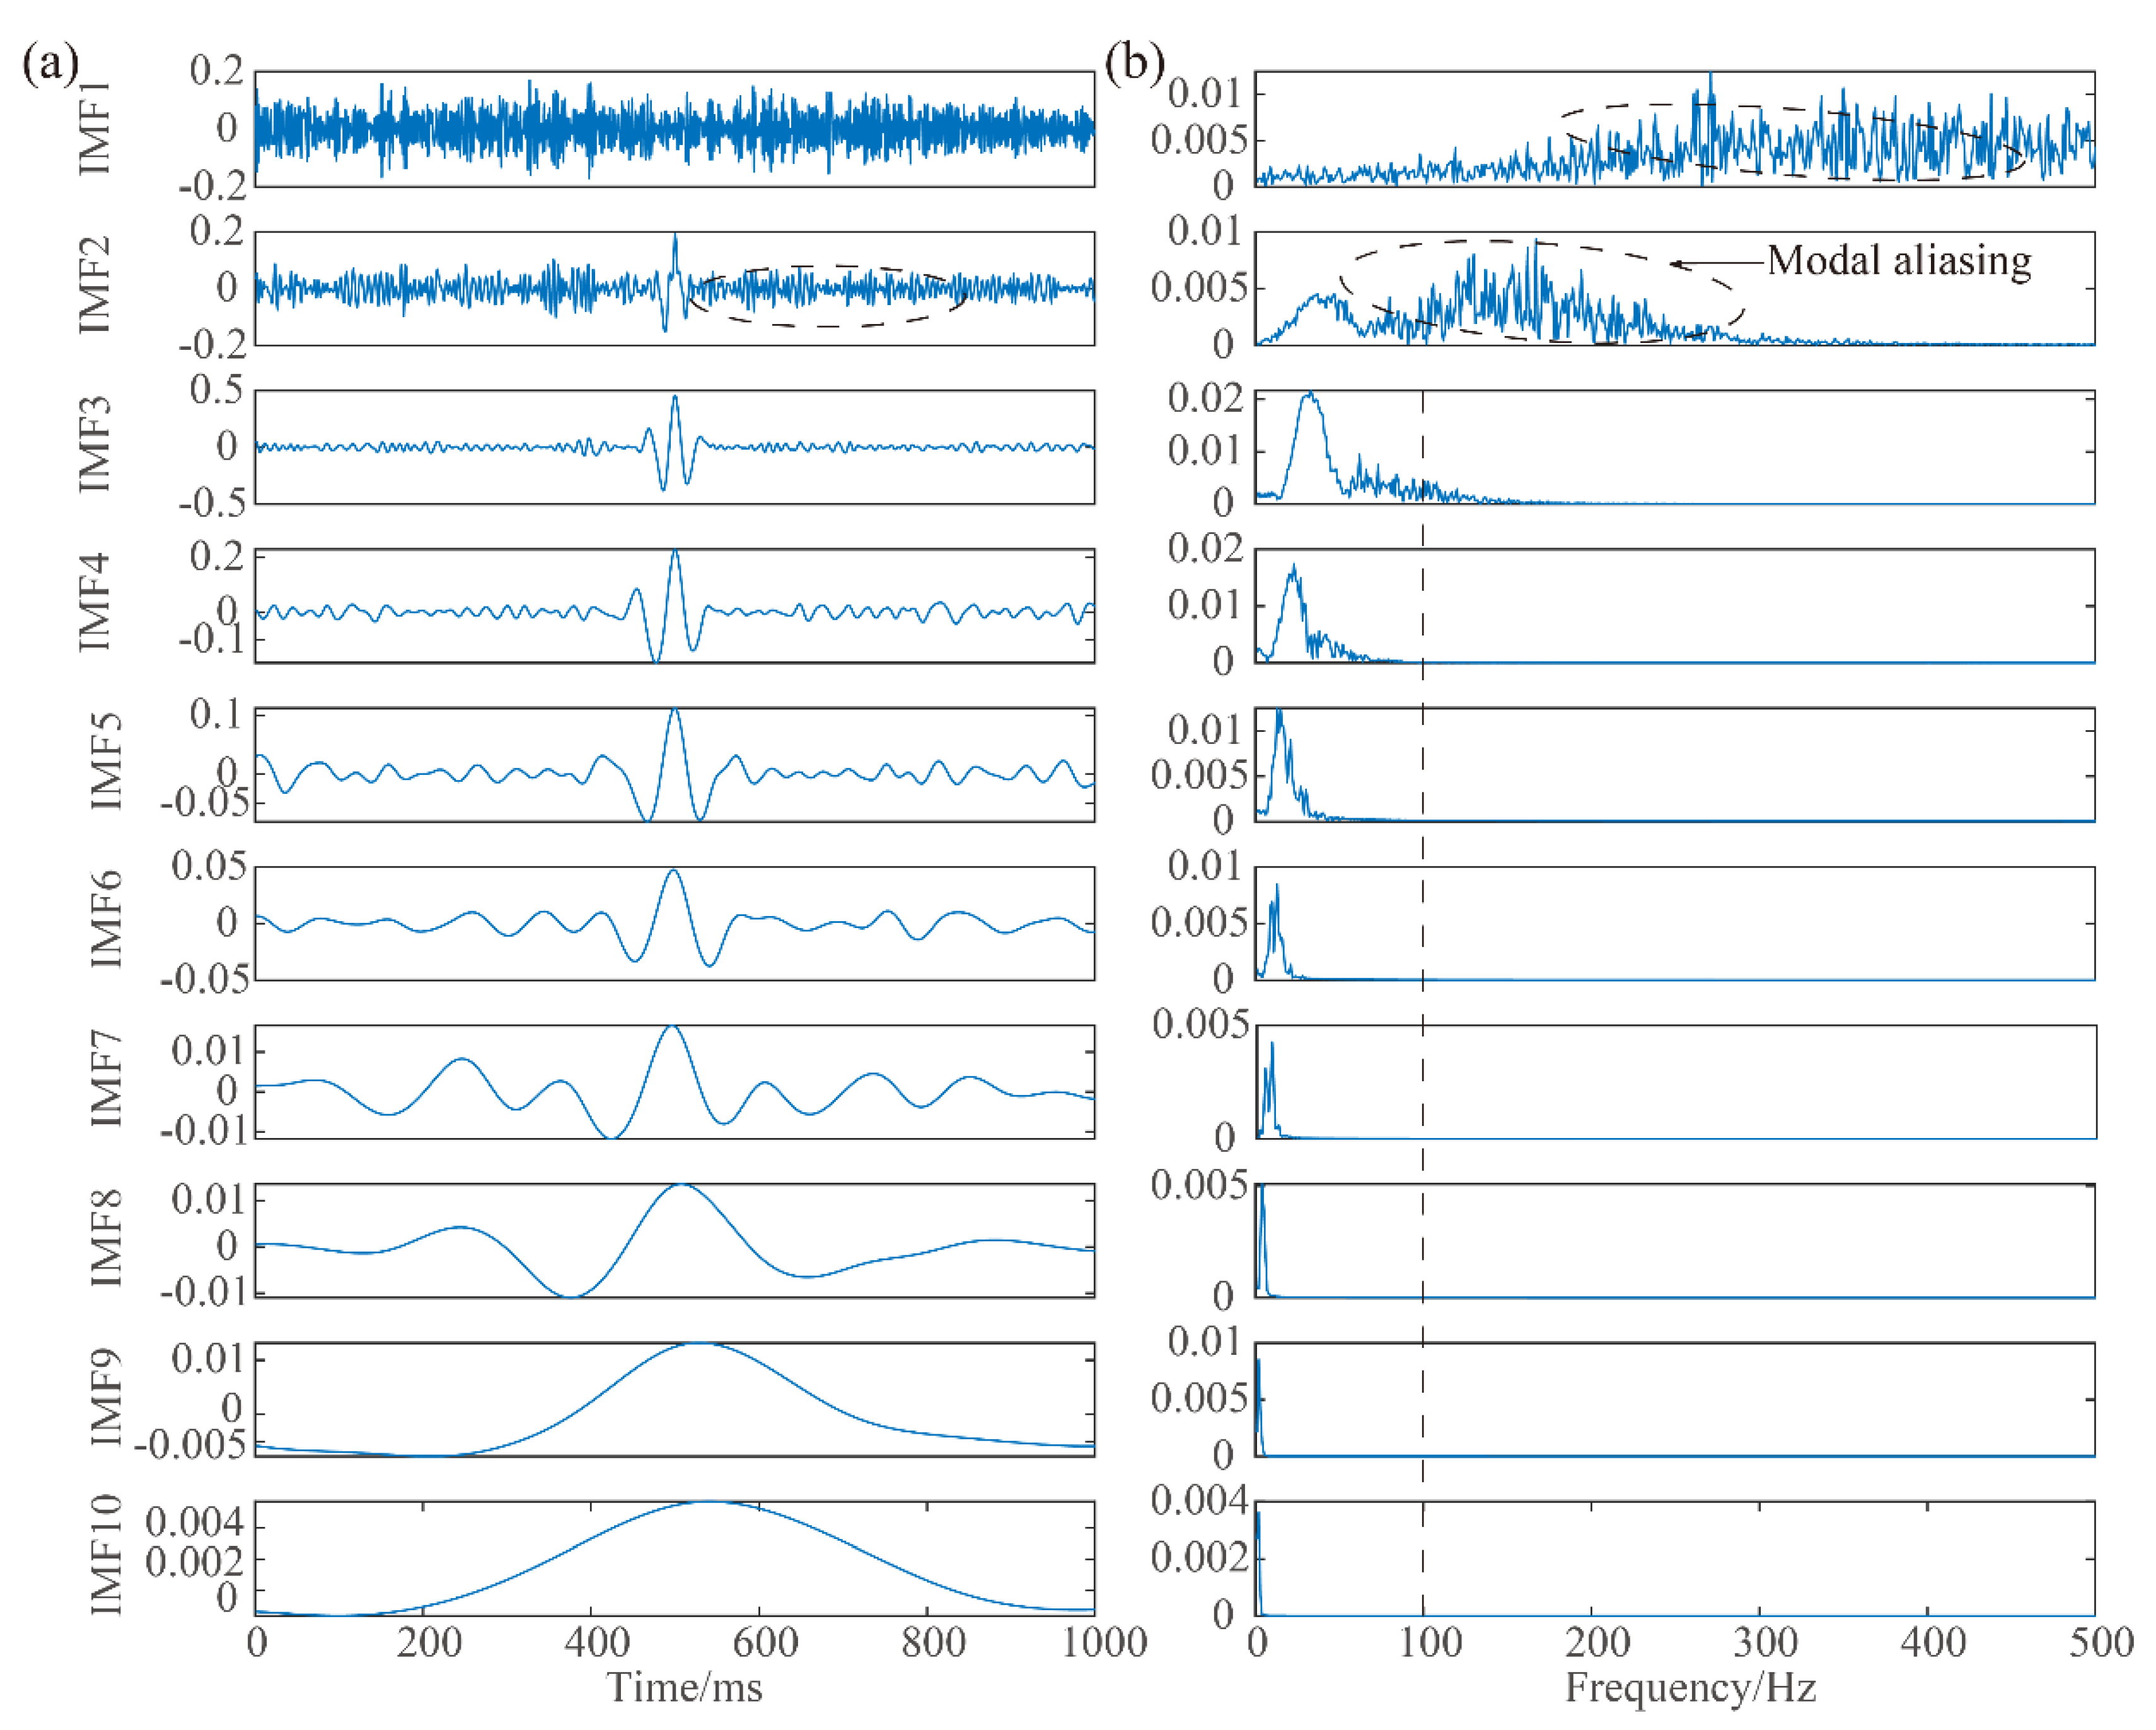
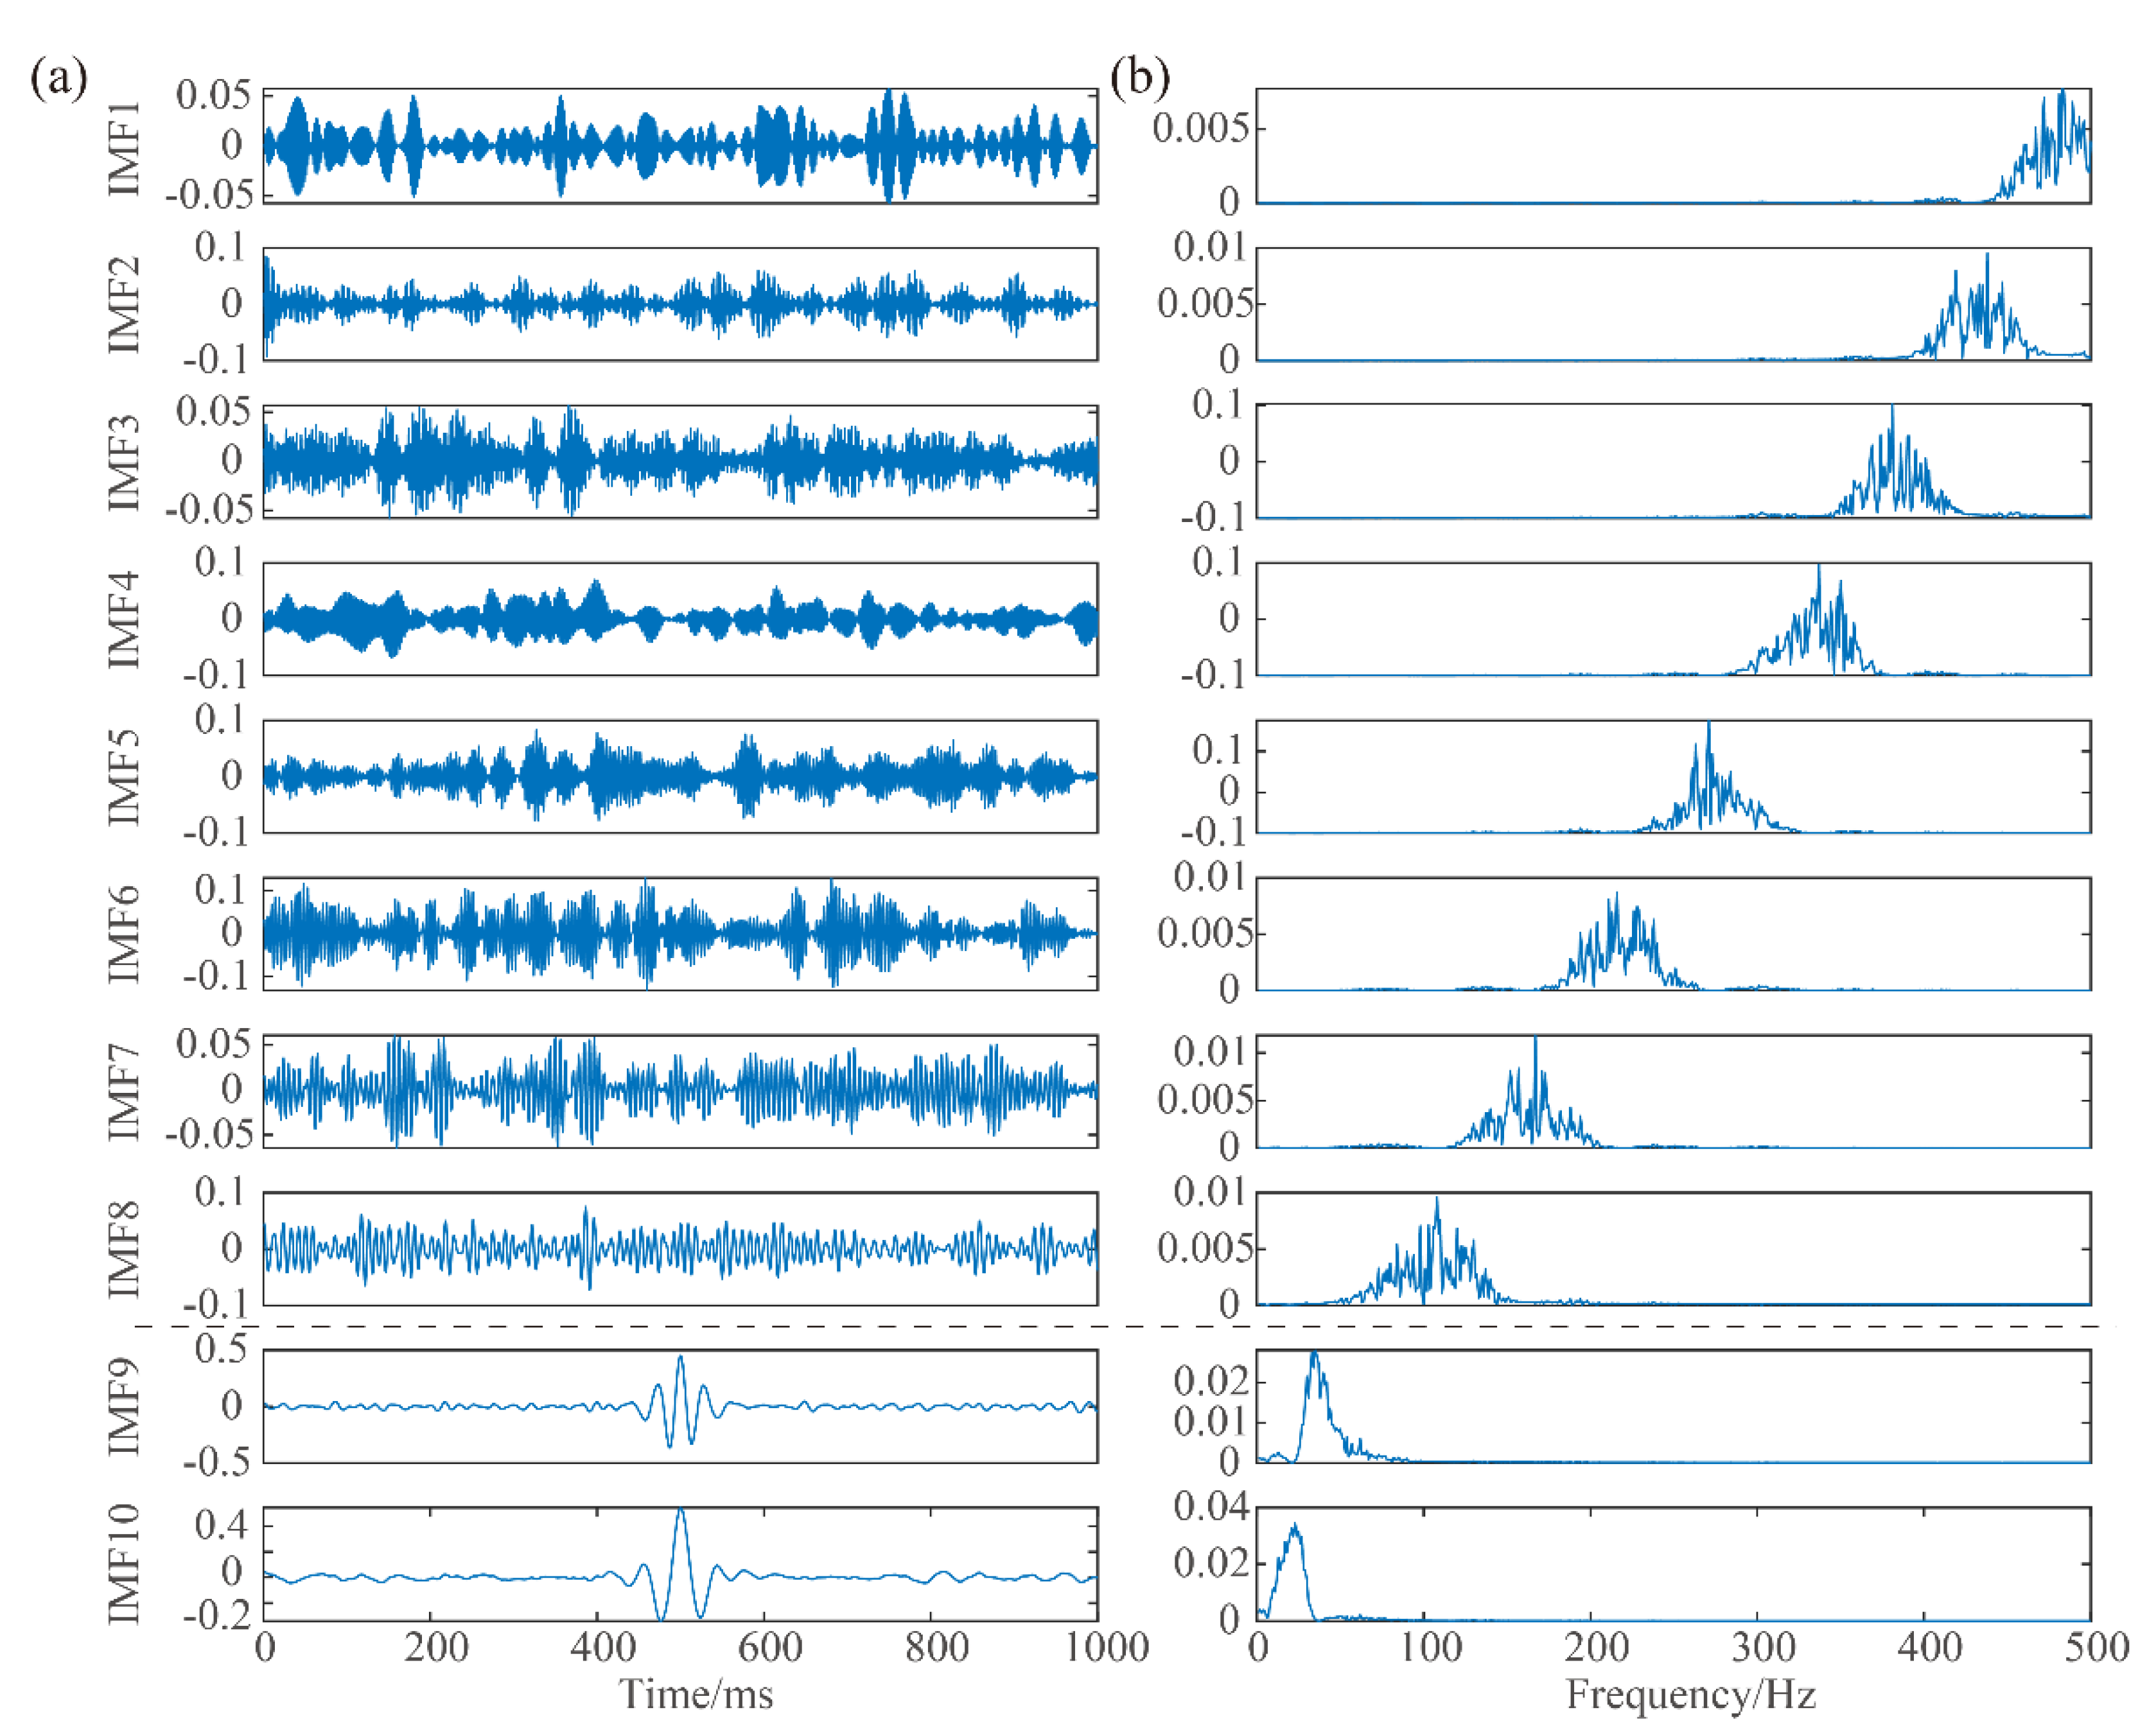
where fp is the dominant frequency. In this example, the wavelet with a dominant frequency of 25 Hz, has a sampling frequency of 1000 Hz. Its waveform is contaminated by adding white gaussian noise. Figure 3 shows its waveform and spectrum before and after adding noise. It is apparent that the whole frequency domain has been polluted by random noise, so the low-pass filter is not a useful approach. For comparing the performance difference between the proposed method with other existing popular algorithms, EEMD, CEEMD, and VMD are also used to decompose the synthetic signal and to restore it into a clean signal. Although the mode number K of VMD needs to be preset, the reconstructed results under different K is approximately the same [40]. To control the variables, the number of VMD sub-signals is set to 10 just as EEMD. The amplitude coefficient and the ensemble size of EEMD and CEEMD are set to 0.2 and 100, respectively. Figure 4 and Figure 5 illustrate the difference between ten component waveforms obtained by EEMD and VMD, respectively. It is shown from Figure 4 that the first two components of EEMD have obvious mode aliasing. The frequency of the first component is distributed nearly throughout the whole spectrum and the fluctuations with distinct frequency both exist in the second component, which causes two frequency peaks to be present in one spectrum. It is a sign of insufficient decomposition that waveforms in different frequency intervals are not clearly separated, which has a negative effect on noise reduction. However, the decomposition result of VMD has a rather different side. Their bandwidth is severely limited to a certain extent, unlike that of EEMD whose frequency bandwidth is either particularly large or extremely small. The distributions of different frequency bands in the spectrum show a certain regularity, which their dominant frequencies are relatively uniform in the whole interval. Taking the position of the component of mode mixing as the demarcation point, there are eight dominant frequencies of EEMD compactly concentrated below 100 Hz. It means that the high-frequency part of the same signal is decomposed more fully by VMD, which is favorable to suppress noise. Figure 6 displays the calculated CC and △CC for the ten decomposed components by VMD. The CC values of the first eight components are less than 0.1, and the latter two are more than 0.7. Their △CC values as a whole show a trend of rising first and then falling, reaching its maximum at the ninth mode. The change of the coefficient is consistent with the VMD decomposition result in Figure 5. It is clear that the last two modes are used to reconstruct the valuable signal.
Figure 7 depicts the waveforms and spectrums of denoised signals using different methods. It can be seen from the figure that the noise whose frequency is above 300 Hz is almost filtered out by EEMD or CEEMD, but there is apparent noise residue in the frequency range between 100 Hz and 300 Hz. Not only does the proposed VMD-AIC method eliminate the noise above 100 Hz, but also it weakens the excess oscillation below 100 Hz by removing the non-signal data points. In addition, the waveform of its Ricker wavelet is closer to the original noise-free waveform, unlike the waveforms of EEMD and CEEMD, which have a certain degree of distortion. The signal processed by VMD-AIC has the least noise and the cleanest waveform compared with the other three results.
In order to quantitatively compare the denoising effect by the above methods, the signal-to-noise ratio (SNR) is introduced as an evaluation index, which is defined as
S N R = 10 log ( i = 1 N ( x i ) 2 i = 1 N ( x i x ˜ i ) 2 )
where x i is the noiseless signal, x ˜ i is the signal after noise reduction by a certain method, and N is the number of sampling points. The larger the SNR is, the closer the denoised signal is to the original signal. Table 1 shows the values of SNR before and after noise reduction by VMD-AIC, VMD, EEMD and CEEMD. Due to the existence of mode aliasing, the SNRs of EMD and CEEMD have only an approximate improvement of 4.5, and the value of VMD-AIC reaches 23.49, which is almost twice that of VMD. This huge increase is due to the fact that the noise in the non-signal segment occupies a considerable part of the total noise, and eliminating it results in a significant reduction in the numerator of the formula and an increase in SNR. Both the above qualitative and quantitative results testify the effectiveness of this method in dealing with this simple synthetic signal.

3.2. Synthetic MS Examples with Different SNRs

In order to further compare the denoising ability of VMD-AIC under different intensity of noise interface, a clean MS signal is added with Gaussian white noise of different degrees to form 11 synthetic signal records with different SNRs. These synthetic MS signals are closer to the noisy signal of the construction site compared with a completely synthetic signal, and their denoised results are convenient for evaluation. Table 2 shows their noise reduction effect of VMD-AIC, VMD, EEMD, and CEEMD. It can be seen from the table that no matter what the initial noise level is, the SNR after VMD-AIC noise suppression can be increased by more than 10. These increases are generally larger than those of VMD by 2, and much larger than those of EEMD and CEEMD. When the SNR is equal to −4 or even lower, the signal is completely overwhelmed by noise. The algorithm can also suppress the noise very well and extract the effective waveform, while the noise of denoised signals of EEMD and CEEMD still occupy more than half of the effective signal (10log2 ≈ 3). The waveform and spectrum of the initial noiseless MS signal are shown in Figure 8a. Figure 8b–g display the noisy signals with different SNRs and their results after noise attenuation by VMD-AIC.
It can be clearly seen from their spectrums that the surplus frequency components above 500 Hz are basically removed by the proposed method. When the tail wave of the MS signal is completely submerged by noise in Figure 8b–d, there is some error in the pickup of the end position of the signal. Although the position is somewhat lagging, removing the noise in the latter section also improves the signal quality. Moreover, when the SNR of the signal is not too low, the location of the post-noise section is still relatively accurate. The position of the first arrival of MS is well determined, regardless of whether the initial SNR is high or low. The above results all indicate that the VMD-AIC algorithm has the ability to adapt to signals with different SNRs, and can further improve signal quality on the basis of VMD.

4. Case Study

In order to verify the feasibility of the method on field MS signals, the noisy data from the underground powerhouse of Shuangjiangkou Hydropower Station was processed by the above methods. Shuangjiangkou Hydropower Station, located in Aba Tibetan and Qiang Autonomous Prefecture, Sichuan Province, China, has the world’s highest dam at 312 m under construction. Its underground caverns have a minimum horizontal burial depth of about 400m and a vertical burial depth of about 320 m~500 m. Due to high ground stress and unstable structural plane, the MS monitoring system produced by the Engineering Seismology Group (ESG) of Canada has been applied to monitor the main powerhouse and the main transformer chamber for 24 h. The system is composed of 10 single-axis acceleration sensors, two Paladin signal acquisition system, a Hyperion signal processing system, and some cables. The accelerometer with a sensitivity of 25 V/g has a frequency response between 50 Hz and 5 kHz, and the sampling frequency of the acquisition system is 10 kHz [3,4].
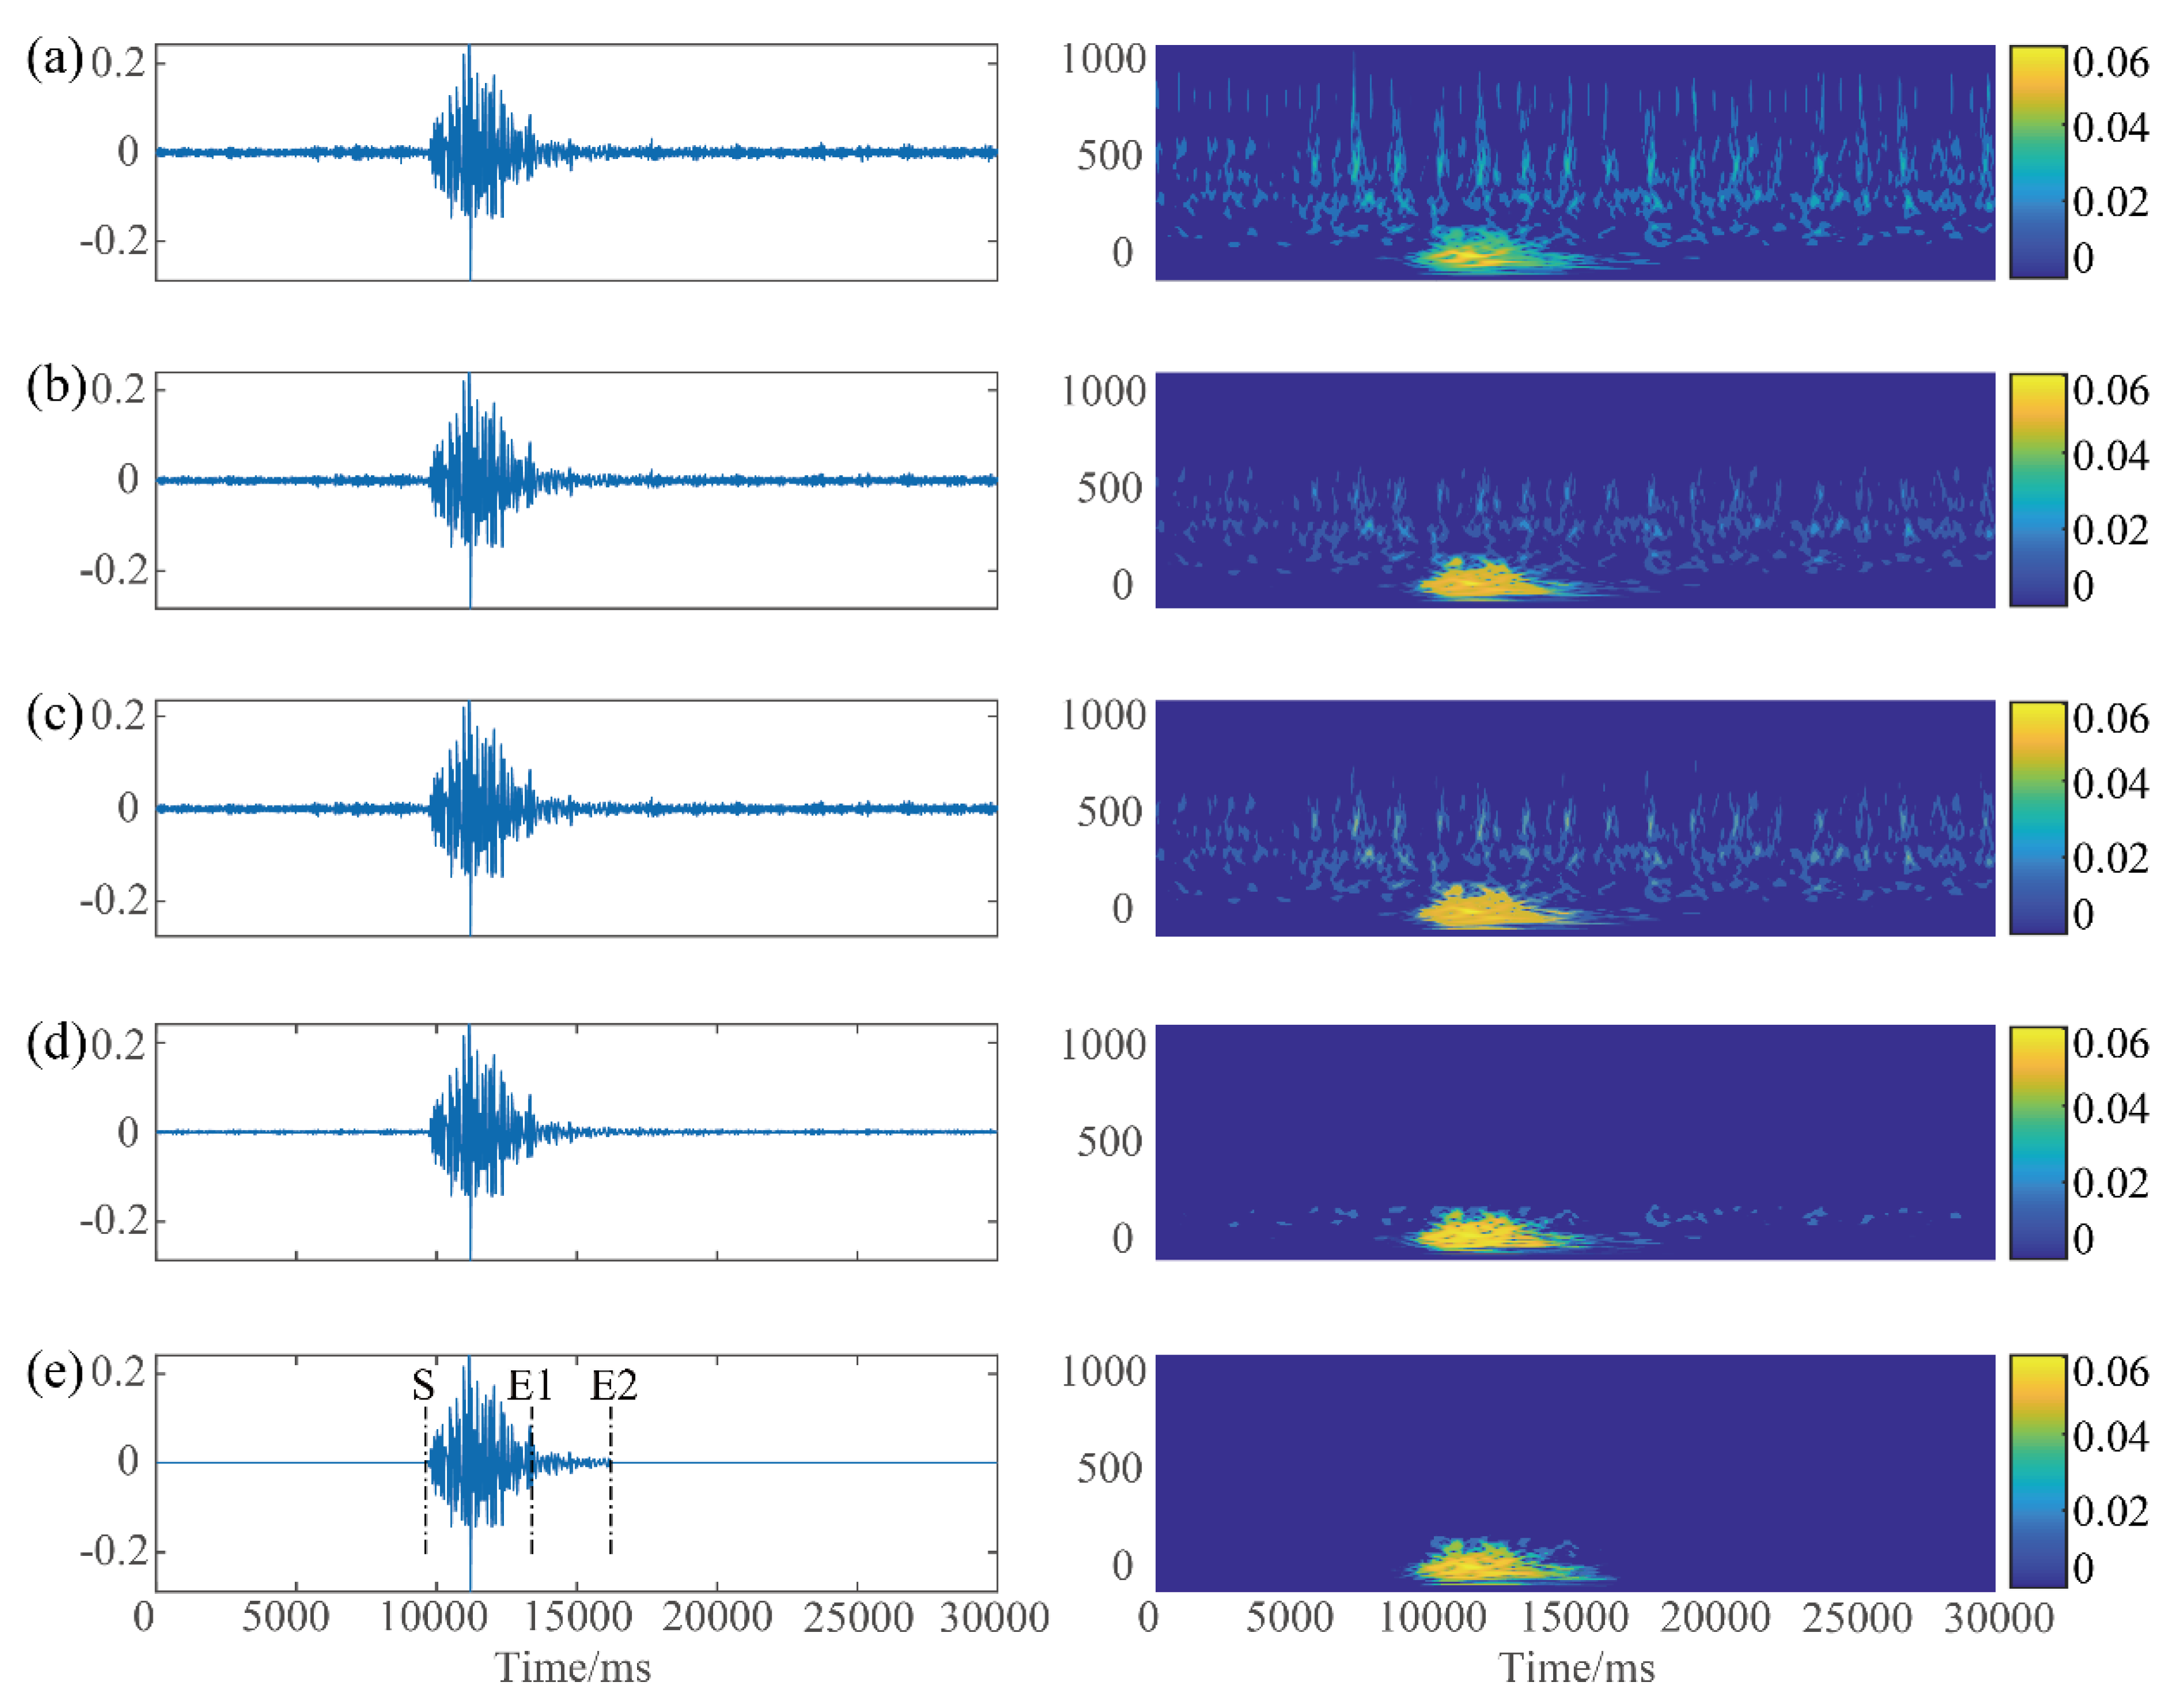
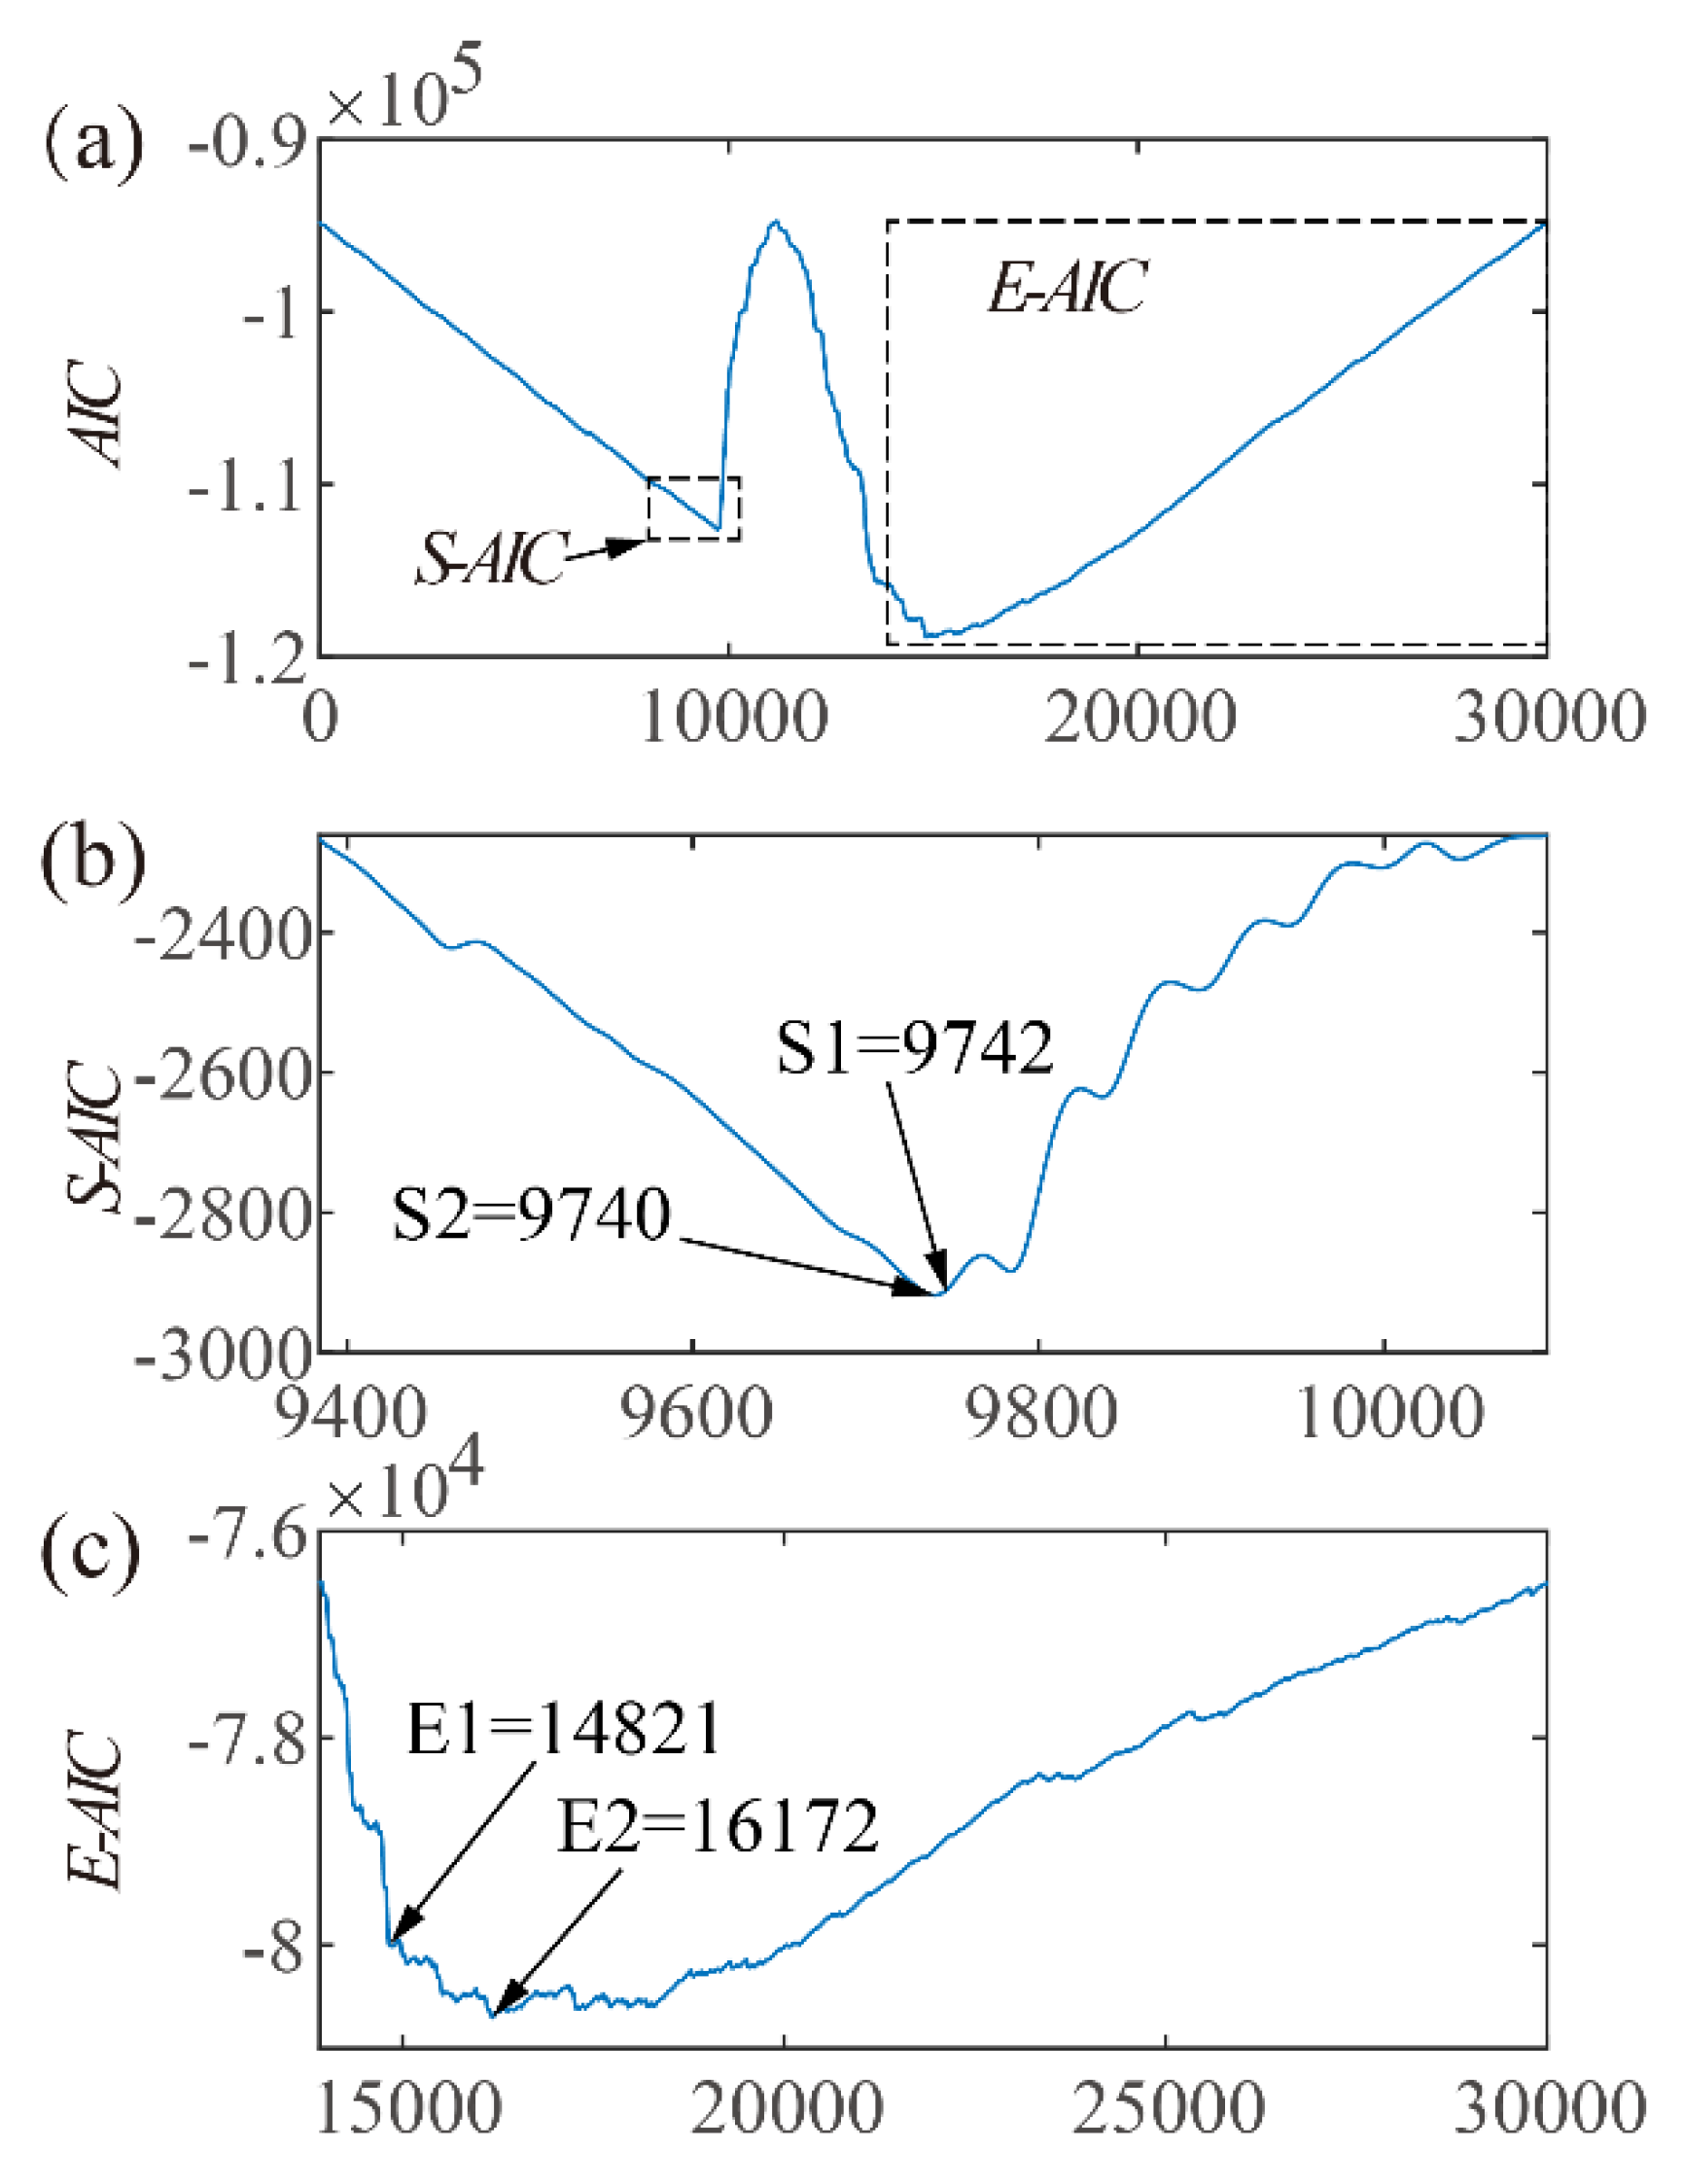
In this section, a noisy MS signal collected from the excavation of the underground powerhouse in April 2019 is selected for analysis. Figure 9 shows the waveforms and the time-frequency diagrams of the signal before and after noise reduction. Figure 10 illustrates applying the multi-step AIC method to determine the interval of the MS signal. Figure 10a is the AIC time series of the entire waveform, and Figure 10b,c are the revised AIC values of the front and back time window segments, respectively. It can be seen from the figure that there is a minimum value before and after the maximum value, and the global minimum of AIC is not a local minimum. The start position of MS is slightly adjusted from 9742 to 9740, while the end position has moved a lot from 14,821 to 16,172. As can be seen from the waveform diagram in Figure 9e, the repositioning result is more in line with the fluctuation of the MS signal. According to the time–frequency results of the above methods, their key parts from 9000ms to 15,000 ms have hardly changed, while the instantaneous frequencies of other parts weaken in various degrees. The noise with a frequency above 500 Hz is largely eliminated by EEMD or CEEMD, leaving other parts with a certain degree of attenuation. Apart from the frequency components above 300 Hz almost disappearing, a considerable portion below 300 Hz has also been reduced by VMD. VMD-AIC further reduces the unimportant frequency remaining in the VMD denoising result, and only retains the fluctuation in the range [9742–16172]. The waveform of VMD-AIC on the whole interval has slighter redundant oscillations than that of EEMD, CEEMD, and VMD.
To further test the performance of the proposed method, 40 noisy signals are also selected for the above comparative analysis. Due to the complex interference factors, the time series of pure MS signal cannot be definitively determined in the field signal. In order to reasonably evaluate the denoising effect of unknown signal, an easily implemented evaluation method is developed in this paper. With reference to the definition of SNR, the noise ratio (NR) for evaluating unknown field signals is defined as follows:
N R = 100 + 10 log ( i = 1 N ( x i x ˜ i ) 2 i = 1 N ( x i ) 2 )
where x i is the i-th amplitude of the original noisy signal, and x ˜ i is its new amplitude after noise suppression. The ratio is an indicator to assess the relationship between the noise variation and the original signal. The more random noise is extracted, the smaller the amplitude of the corresponding position of x ˜ i becomes. Admittedly, its NR will present a pretty big value. In general, NR is greater than 0 and less than 100. If a negative value occurs, it means the signal after noise reduction is almost unchanged. To prevent the valuable parts of the signal from being excessively removed, the energy ratio (ER) is introduced to evaluate its energy change before and after processing. It is defined as follows:
E R = E 1 E 0
where E1 and E0 are the energy before and after reconstructing, respectively. When the amplitude of the effective time series is weakened, the energy will be changed, resulting in a corresponding decrease of ER. Therefore, as long as ER is always kept at a high level, the size of NR indicates the effect of noise reduction.
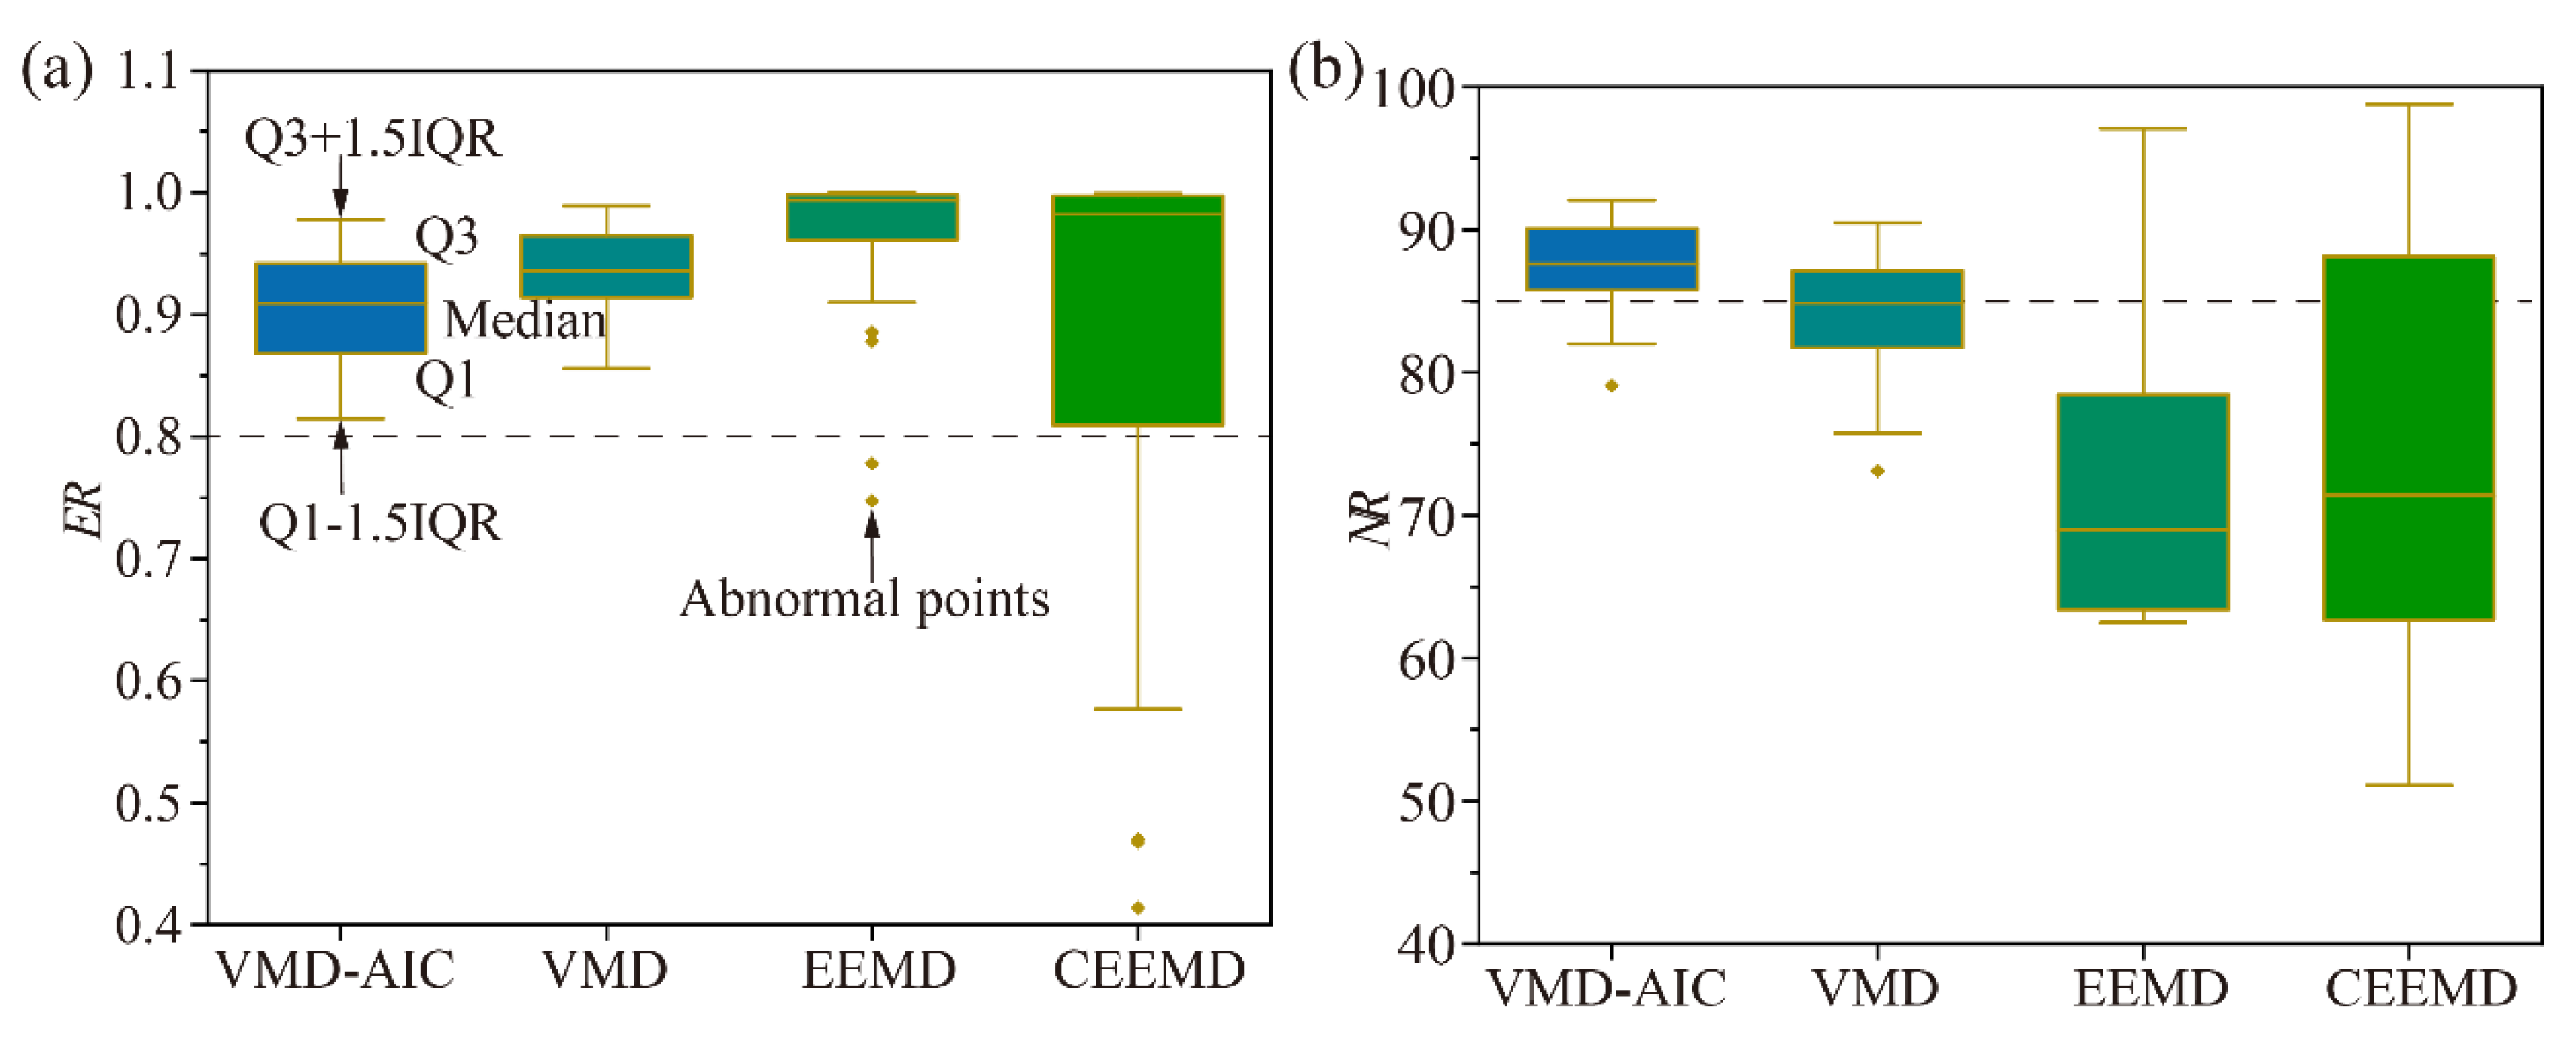
Figure 11a,b are the box diagrams of their NR and ER obtained by different methods. It can be seen from the distribution of ER that the whole data of VMD and VMD-AIC are greater than 0.8, and the main bodies of their boxes are even above 0.85. It means their reconstructed signals have little distortion. However, in EEMD and CEEMD, there are a few controversial points whose energy changes are excessive, resulting in their ER values being lower than the threshold. The distributions of NR manifest that the result processed by VMD-AIC is the best. Its median and quarter point are above 85, which is slightly greater than the median of VMD. The median of EEMD and CEEMD are even below 75. It means their processing results of MS signals are not particularly good. In addition, the box area of VMD-AIC, which is further reduced on the basis of VMD, is significantly smaller than that of EEMD and CEEMD. Its intensive distribution reflects the fantastic robustness of the algorithm in decomposing various MS signals. Whether it is the denoising effect or the stability of the algorithm, the proposed method can get better result than the classical algorithms in suppressing different noisy MS signals.

5. Conclusions

A large amount of noise in the MS signal has an adverse effect on the postprocessing of the collected data. A new method combining VMD and AIC is put forward for noise attenuation of MS signals. It can adaptively extract valuable components from the mixed signal by the VMD algorithm, and automatically divide the reconstructed signal into noise and MS segments by adopting the improved AIC method. The results of a synthetic wavelet signal, synthetic MS signals, and noisy field signals illustrate its excellent performance. It can adapt to not only noisy signals with different SNRs, but also MS signals with different characteristics. Both quantitative and qualitative results show that the reconstructed signal of this method is slightly better than that of VMD and far better than that of EEMD and CEEMD. Not only have the high-frequency noise been removed, but also the low frequency components mixed with effective signal is greatly reduced in its spectrum and time–frequency diagram. It is notable that the method does not need to select the basic function like WT, and the boundary position between noisy and valuable modes is determined automatically. It is very practical for adaptive noise suppression for different MS signals and rapid processing of large data sets.

Author Contributions

J.Z. wrote the manuscript. L.D. processed the signal data. N.X. conceived the research, provided some suggestions for the research and revised the article. All authors have read and agreed to the published version of the manuscript.

Funding

The National Key R &D Program of China (No. 2017YFC1501100) and the National Natural Science Foundation of China (No. 51679158).

Acknowledgments

Thanks to colleagues and teachers who contributed to this project at Shuangjiangkou Hydropower Station.

Conflicts of Interest

The authors declare no conflict of interest.

References

  1. Xiao, Y.-X.; Feng, X.-T.; Hudson, J.A.; Chen, B.-R.; Feng, G.-L.; Liu, J.-P. ISRM Suggested Method for In Situ Microseismic Monitoring of the Fracturing Process in Rock Masses. Rock Mech. Rock Eng. 2015, 49, 343–369. [Google Scholar] [CrossRef]
  2. Cheng, G.; Li, L.; Zhu, W.; Yang, T.; Tang, C.; Zheng, Y.; Wang, Y. Microseismic investigation of mining-induced brittle fault activation in a Chinese coal mine. Int. J. Rock Mech. Min. Sci. 2019, 123, 104096. [Google Scholar] [CrossRef]
  3. Xu, N.W.; Li, T.B.; Dai, F.; Li, B.; Zhu, Y.G.; Yang, D.S. Microseismic monitoring and stability evaluation for the large scale underground caverns at the Houziyan hydropower station in Southwest China. Eng. Geol. 2015, 188, 48–67. [Google Scholar] [CrossRef]
  4. Li, A.; Xu, N.; Dai, F.; Gu, G.; Hu, Z.; Liu, Y. Stability analysis and failure mechanism of the steeply inclined bedded rock masses surrounding a large underground opening. Tunn. Undergr. Space Technol. 2018, 77, 45–58. [Google Scholar] [CrossRef]
  5. Dong, L.; Yang, Y.; Qian, B.; Tan, Y.; Sun, H.; Xu, N. Deformation Analysis of Large-Scale Rock Slopes Considering the Effect of Microseismic Events. Appl. Sci. 2019, 9, 3409. [Google Scholar] [CrossRef] [Green Version]
  6. Li, B.; Li, T.; Xu, N.; Dai, F.; Chen, W.; Tan, Y. Stability assessment of the left bank slope of the Baihetan Hydropower Station, Southwest China. Int. J. Rock Mech. Min. Sci. 2018, 104, 34–44. [Google Scholar] [CrossRef]
  7. Maity, D.; Aminzadeh, F.; Karrenbach, M. Novel hybrid artificial neural network based autopicking workflow for passive seismic data. Geophys. Prospect. 2014, 62, 834–847. [Google Scholar] [CrossRef]
  8. Chen, H.; Meng, X.; Niu, F.; Tang, Y.; Yin, C.; Wu, F. Microseismic Monitoring of Stimulating Shale Gas Reservoir in SW China: 2. Spatial Clustering Controlled by the Preexisting Faults and Fractures. J. Geophys. Res. Solid Earth 2018, 123, 1659–1672. [Google Scholar] [CrossRef] [Green Version]
  9. Lin, B.; Wei, X.; Junjie, Z. Automatic recognition and classification of multi-channel microseismic waveform based on DCNN and SVM. Comput. Geosci. 2019, 123, 111–120. [Google Scholar] [CrossRef]
  10. Eisner, L.; Abbott, D.; Barker, W.B.; Lakings, J.; Thornton, M.P. Noise suppression for detection and location of microseismic events using a matched filter. SEG Techn. Program Expanded Abstr. 2008, 1431–1435. [Google Scholar]
  11. Abma, R.; Claerbout, J. Lateral prediction for noise attenuation by tx and fx techniques. Geophysics 1995, 60, 1887–1896. [Google Scholar]
  12. Mousavi, S.M.; Langston, C.A. Hybrid seismic denoising using higher-order statistics and improved wavelet block thresholding. Bull. Seismol. Soc. Am. 2016, 106, 1380–1393. [Google Scholar]
  13. Mousavi, S.M.; Langston, C.A.; Horton, S.P. Automatic microseismic denoising and onset detection using the synchrosqueezed continuous wavelet transform. Geophysics 2016, 81, V341–V355. [Google Scholar] [CrossRef]
  14. Langston, C.A.; Mousavi, S.M. Separating Signal from Noise and from Other Signal Using Nonlinear Thresholding and Scale-Time Windowing of Continuous Wavelet TransformsSeparating Signal from Noise and from Other Signal. Bull. Seismol. Soc. Am. 2019, 109, 1691–1700. [Google Scholar]
  15. Bekara, M.; Der Baan, M.V. Local singular value decomposition for signal enhancement of seismic data. Geophysics 2007, 72, V59–V65. [Google Scholar]
  16. Lv, H. Noise suppression of microseismic data based on a fast singular value decomposition algorithm. J. Appl. Geophys. 2019, 170, 103831. [Google Scholar] [CrossRef]
  17. Battista, B.M.; Knapp, C.; McGee, T.; Goebel, V. Application of the empirical mode decomposition and Hilbert-Huang transform to seismic reflection data. Geophysics 2007, 72, H29–H37. [Google Scholar]
  18. Bekara, M.; Van der Baan, M. Random and coherent noise attenuation by empirical mode decomposition. Geophysics 2009, 74, V89–V98. [Google Scholar] [CrossRef]
  19. Chen, W.; Xie, J.; Zu, S.; Gan, S.; Chen, Y. Multiple-reflection noise attenuation using adaptive randomized-order empirical mode decomposition. IEEE Geosci. Remote Sens. Lett. 2016, 14, 18–22. [Google Scholar] [CrossRef]
  20. Han, J.; van der Baan, M. Empirical mode decomposition for seismic time-frequency analysis. Geophysics 2013, 78, O9–O19. [Google Scholar]
  21. Li, H.; Wang, R.; Cao, S.; Chen, Y.; Huang, W. A method for low-frequency noise suppression based on mathematical morphology in microseismic monitoring. Geophysics 2016, 81, V159–V167. [Google Scholar] [CrossRef]
  22. Liang, X.; Li, Y.; Zhang, C. Noise suppression for microseismic data by non-subsampled shearlet transform based on singular value decomposition. Geophys. Prospect. 2018, 66, 894–903. [Google Scholar] [CrossRef]
  23. Zhang, C.; van der Baan, M. Multicomponent microseismic data denoising by 3D shearlet transform. Geophysics 2018, 83, A45–A51. [Google Scholar]
  24. Li, X.; Dong, L.; Li, B.; Lei, Y.; Xu, N. Microseismic Signal Denoising via Empirical Mode Decomposition, Compressed Sensing, and Soft-thresholding. Appl. Sci. 2020, 10, 2191. [Google Scholar] [CrossRef] [Green Version]
  25. Zhang, C.; van der Baan, M. Microseismic Denoising and Reconstruction by Unsupervised Machine Learning. IEEE Geosci. Remote Sens. Lett. 2019, 1–5. [Google Scholar] [CrossRef]
  26. Zhou, Y.; Wu, G. Unsupervised machine learning for waveform extraction in microseismic denoising. J. Appl. Geophys. 2020, 173, 103879. [Google Scholar] [CrossRef]
  27. Zhu, W.; Mousavi, S.M.; Beroza, G.C. Seismic Signal Denoising and Decomposition Using Deep Neural Networks. IEEE Trans. Geosci. Remote Sens. 2019, 57, 9476–9488. [Google Scholar]
  28. Mousavi, S.M.; Langston, C.A. Adaptive noise estimation and suppression for improving microseismic event detection. J. Appl. Geophys. 2016, 132, 116–124. [Google Scholar] [CrossRef]
  29. Oropeza, V.; Sacchi, M. Simultaneous seismic data denoising and reconstruction via multichannel singular spectrum analysis. Geophysics 2011, 76, V25–V32. [Google Scholar]
  30. Adamczak, S.; Makieła, W.; Stępień, K. Investigating advantages and disadvantages of the analysis of a geometrical surface structure with the use of Fourier and wavelet transform. Metrol. Meas. Syst. 2010, 17, 233–244. [Google Scholar]
  31. Huang Norden, E.; Shen, Z.; Long Steven, R.; Wu Manli, C.; Shih Hsing, H.; Zheng, Q.; Yen, N.-C.; Tung Chi, C.; Liu Henry, H. The empirical mode decomposition and the Hilbert spectrum for nonlinear and non-stationary time series analysis. Proc. R. Soc. Lond. Ser. A Math. Phys. Eng. Sci. 1998, 454, 903–995. [Google Scholar] [CrossRef]
  32. Wu, Z.; Huang, N.E. Ensemble empirical mode decomposition: A noise-assisted data analysis method. Adv. Adapt. Data Anal. 2009, 1, 1–41. [Google Scholar] [CrossRef]
  33. Han, J.; van der Baan, M. Microseismic and seismic denoising via ensemble empirical mode decomposition and adaptive thresholding. Geophysics 2015, 80, KS69–KS80. [Google Scholar] [CrossRef] [Green Version]
  34. Torres, M.E.; Colominas, M.A.; Schlotthauer, G.; Flandrin, P. A complete ensemble empirical mode decomposition with adaptive noise. In Proceedings of the 2011 IEEE International Conference on Acoustics, Speech and Signal Processing (ICASSP), Prague, Czech Republic, 22–27 May 2011; pp. 4144–4147. [Google Scholar]
  35. Dragomiretskiy, K.; Zosso, D. Variational mode decomposition. IEEE Trans. Signal Process. 2013, 62, 531–544. [Google Scholar] [CrossRef]
  36. Sleeman, R.; Van Eck, T. Robust automatic P-phase picking: An on-line implementation in the analysis of broadband seismogram recordings. Phys. Earth Planet. Inter. 1999, 113, 265–275. [Google Scholar] [CrossRef]
  37. Maeda, N. A Method for Reading and Checking Phase Time in Auto-Processing System of Seismic Wave Data. Zisin 1985, 38, 365–379. [Google Scholar] [CrossRef] [Green Version]
  38. Benesty, J.; Chen, J.; Huang, Y.; Cohen, I. Pearson Correlation Coefficient. Noise Reduction in Speech Processing 2009, 5, 1–4. [Google Scholar] [CrossRef]
  39. Zhang, J.; Jiang, R.; Li, B.; Xu, N. An automatic recognition method of microseismic signals based on EEMD-SVD and ELM. Comput. Geosci. 2019, 133, 104318. [Google Scholar] [CrossRef]
  40. Liu, W.; Cao, S.; Chen, Y. Applications of variational mode decomposition in seismic time-frequency analysis. Geophysics 2016, 81, V365–V378. [Google Scholar] [CrossRef]
Figure 1. Three parts of a typical microseismic (MS) signal.
Applsci 10 03790 g001
Figure 2. The VMD-AIC algorithm flow chart.
Applsci 10 03790 g002
Figure 3. Waveforms and spectrums of a 25 Hz Ricker wavelet before and after adding white gaussian noise. (a) Noise-free wavelet waveform; (b) noise-free wavelet spectrum; (c) noisy wavelet waveform; (d) noisy wavelet spectrum.
Applsci 10 03790 g003
Figure 4. Waveforms and spectrograms of ten components obtained by ensemble empirical mode decomposition (EEMD). (a) Waveforms of components; (b) spectrograms of components.
Applsci 10 03790 g004
Figure 5. Waveforms and spectrograms of ten components obtained by variational mode decomposition (VMD). (a) Waveforms of components; (b) spectrograms of components.
Applsci 10 03790 g005
Figure 6. The values of Pearson’s correlation coefficient (CC) and their difference △CC of the ten components decomposed by VMD.
Applsci 10 03790 g006
Figure 7. Noise reduction results of synthetic signals by different methods. (a) EEMD; (b) complete EEMD (CEEMD); (c) VMD and VMD-Akaike information criterion (AIC). The letter S means the start position of the MS signal segment, and the letter E indicates its end position. The portion in the solid box is an enlarged view of the portion in the dotted box.
Applsci 10 03790 g007
Figure 8. Waveforms and spectrograms of noisy signals with different SNRs before and after noise attenuation by VMD-AIC. (a) The original noiseless MS signal; (b) noisy signal with SNR = −8; (c) noisy signal with SNR = −4; (d) noisy signal with SNR = 0; (e) noisy signal with SNR = 4; (f) noisy signal with SNR = 8; (g) noisy signal with SNR = 10. The red line in the figure represents the signal after denoising by VMD-AIC, and the blue line represents the waveform before noise reduction.
Applsci 10 03790 g008
Figure 9. Waveforms and time-frequency diagrams of MS signal before and after noise reduction by EEMD, CEEMD, VMD and VMD-AIC. (a) Original noisy MS signal; (b) the signal denoised by EEMD; (c) the signal denoised by CEEMD; (d) the signal denoised by VMD; (e) the signal denoised by VMD-AIC. E1 means the end position of the first calculation, and E2 is the result of its second relocation.
Applsci 10 03790 g009
Figure 10. The AIC time series of the entire, front and rear time window, respectively. (a) The AIC of the entire waveform; (b) The AIC of the front time window segment; (c) The AIC of the rear time window segment. S-AIC and E-AIC are the recalculation results of the two dashed boxes in (a).
Applsci 10 03790 g010
Figure 11. The box diagrams of noise ratio (NR) and energy ratio (ER) of 40 noisy field signals obtained by VMD-AIC, VMD, EEMD, CEEMD. (a) NR; (b) ER. Q1 is the lower quartile point of the data set, and Q3 is the upper quartile point. IQR is the quarter-point spacing, whose value is equal to Q3-Q1. The points outside the limits of the box are considered abnormal points [39].
Applsci 10 03790 g011
Table 1. The SNR before and after denoising the wavelet by different methods.
MethodSNR/dB
BeforeAfter
VMD-AIC2.49 23.47
VMD2.49 11.90
EEMD2.49 6.73
CEEMD2.49 6.92
Table 2. Denoising effect of signals with different SNRs using different methods.
SNR/dBVMD-AICVMDEEMDCEEMD
−84.973.721.55−0.19
−67.173.180.601.61
−410.045.742.432.37
−210.847.784.592.15
011.599.426.814.45
215.1310.588.606.37
414.4312.228.068.65
618.2214.5010.1010.77
819.4615.6911.9112.45
1021.3317.6914.1814.77
1222.8019.6716.3516.78