1. Introduction
Noise pollution is generally defined as regular exposure to elevated sound levels that may lead to adverse effects in humans or other living organisms [
1]. It has become one of the public health issues which is being extensively researched since it affects the overall quality of everyday life [
1,
2,
3]. An accumulation of noise pollution that occurs outside is defined as environmental noise. This type of noise can be caused by transport, industrial and recreational activities [
1]. The acoustic environment of a place or space is the sound from all the sources that could be heard by someone in that place. This acoustic environment is shaped by all the different sound sources that are present and by the modification of the sounds as they propagate along their paths from the sources to the receiver [
4]. Nowadays, people are exposed to different sound environments during their sleep, rest, work and other activities. Nevertheless, when compared to other different environmental pollutions (e.g., air pollution, water pollution, soil pollution and climate change) noise pollution is still often overlooked and even neglected. However, in the same way as the all the other aforementioned pollutions, noise exposure has an accumulating character, meaning that the harmful effect of noise will be detected only after a long period of time [
5]. Long exposure to noise pollution can be manifested as a bad mood, fatigue, insomnia, headache and the loss of concentration, which causes reduced work ability and ultimately permanent hearing impairment [
6,
7,
8]. In addition, recent studies show that environmental noise has an impact on several cardiovascular (e.g., increased blood pressure) and metabolic effects, cognitive impairment among children, annoyance, stress-related mental health risks and tinnitus [
9,
10,
11].
The ISO 12913-1 Standard defines soundscapes as acoustic environments “as perceived by people, in context”. Thus, nowadays, more and more soundscape studies are oriented towards human health, well-being and the overall quality of life [
12,
13,
14,
15]. In addition, the WHO Environmental Noise Guidelines for the European Region provide certain guidance on protecting human health from harmful exposure to environmental noise. Namely, several health-based recommendations on average environmental noise exposure of five relevant sources of environmental noise are provided. These sources are road traffic noise, railway noise, aircraft noise, wind turbine noise and leisure noise [
16]. To sum it up, the guidelines strongly recommend reducing the noise levels (
Lden and
Lnight) for the cases of environmental noise sources described above. In the past, the only possible approach to tackle these issues and reduce noise levels in an efficient way has been noise barriers [
17,
18,
19,
20]. However, in order to construct and position an effective noise barrier, first one needs to have enough space for it. When observing the expansion of cities and urban areas, noise barriers can serve as a solution only if they are planned before the actual building which is today a quite rare case scenario. In addition, if there is an opportunity to incorporate a noise barrier into an existing urban environment, researchers must consider the “visual pleasantness” [
21,
22] as well as the economic feasibility of the noise barrier [
23,
24].
Finally, a noise barrier as a solution is only focused on reducing the noise levels from traffic sources while the final goal of the WHO and researchers (with different types of expertise) is much broader and includes the improvement of the overall life quality. In order to accomplish this goal, different tools, guidelines, descriptors and an interdisciplinary approach was used as well as the designing, preserving and investigating of pleasant acoustic environments i.e., positive soundscapes [
25,
26,
27,
28]. Although traffic noise is indeed the most common type of noise, through several conducted studies [
29,
30] there are noise sources which have arisen with a higher level of annoyance when compared to traffic noise. In that sense this paper aimed to investigate these sound sources with the core objective of determining the acoustic parameters which could unambiguously describe them.
From the acoustic point of view, there are several studies which show that it is possible to calculate an “annoyance level” of a certain sound or an acoustic environment [
31,
32] taking into account the objective acoustic parameters such as loudness, sharpness and roughness [
33,
34,
35,
36,
37]. Moreover, another part of acoustic environment research deals with their distraction properties and how characteristic sounds influence people performing logical, mathematical and other concentration-demanding tasks [
38,
39].
In our previous research we proposed a simple acoustical model, which allows one to quantify how much some kind of typical urban acoustic environment is subjectively perceived in terms of affecting the listeners’ concentration [
31]. For that purpose, we recorded several different acoustic environments which were then reproduced to the listeners. It was found that the linear model is adequate for calculating the parameter that we termed as the total distraction coefficient (
TDC) [
31]. The total distraction coefficient (
TDC) is a numerical value of a certain acoustic environment and can serve as an objective parameter for the evaluation of different acoustic environments. It is defined by the following expression:
where
LDIF,
LGDDIF and
SDIF are defined as a ratio of difference values and the average value of the three considered objective parameters themselves (loudness, loudness growth difference and sharpness).
For instance, the lowest
TDC was obtained for the acoustic environment of stream. Namely, we have also found in [
40] that it is the sudden and unexpected signals of short duration that are perceived as most distracting and annoying, hence we decided to put some more focus on them in order to determine which parameter of such signals makes the key influence on the
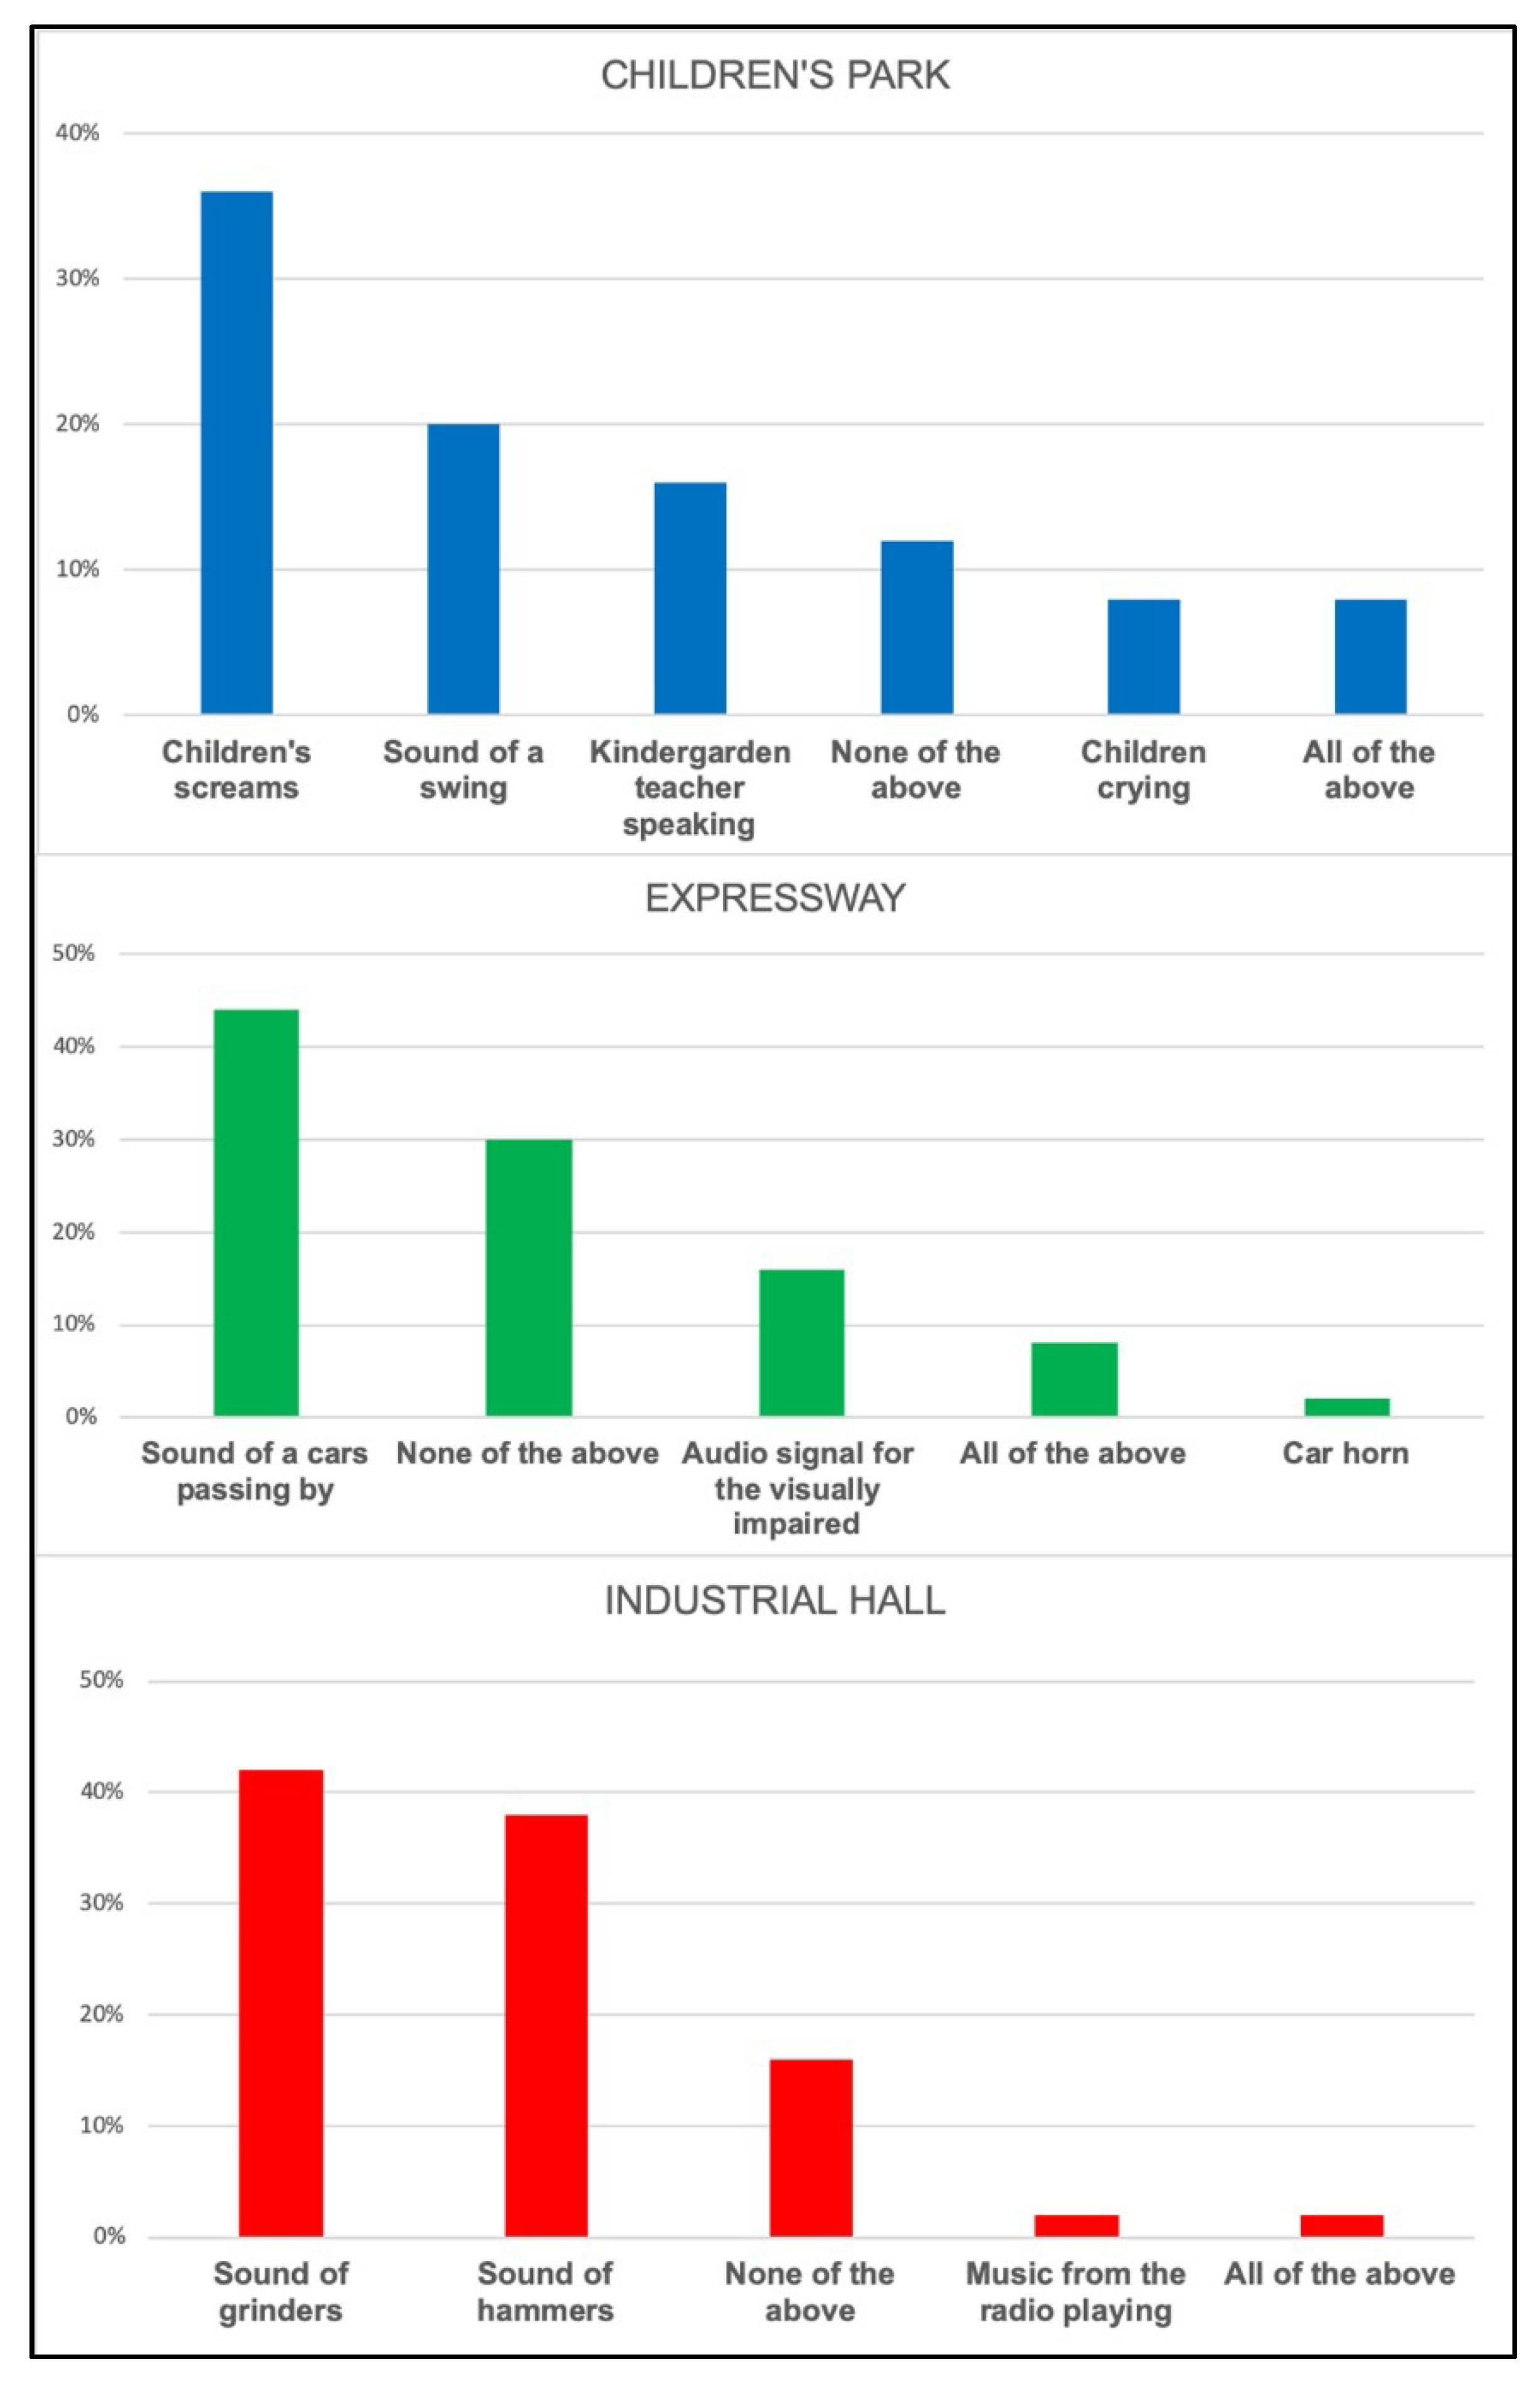
TDC. To extend this research in this paper we present an additional study involving short distracting signals. Short signals such as children’s screams, a car passing by and the sound of a grinder which were used in this study (see
Figure 1) were chosen due to the fact that in our previous research [
31,
40] these signals were characterized by participants as extremely annoying and distracting, i.e., they influenced the quality of life in a negative way. In addition, these signals are quite common for each resident living in a typical urban environment (i.e., usually near every apartment building there is a park, a road and some type of store).
In [
37,
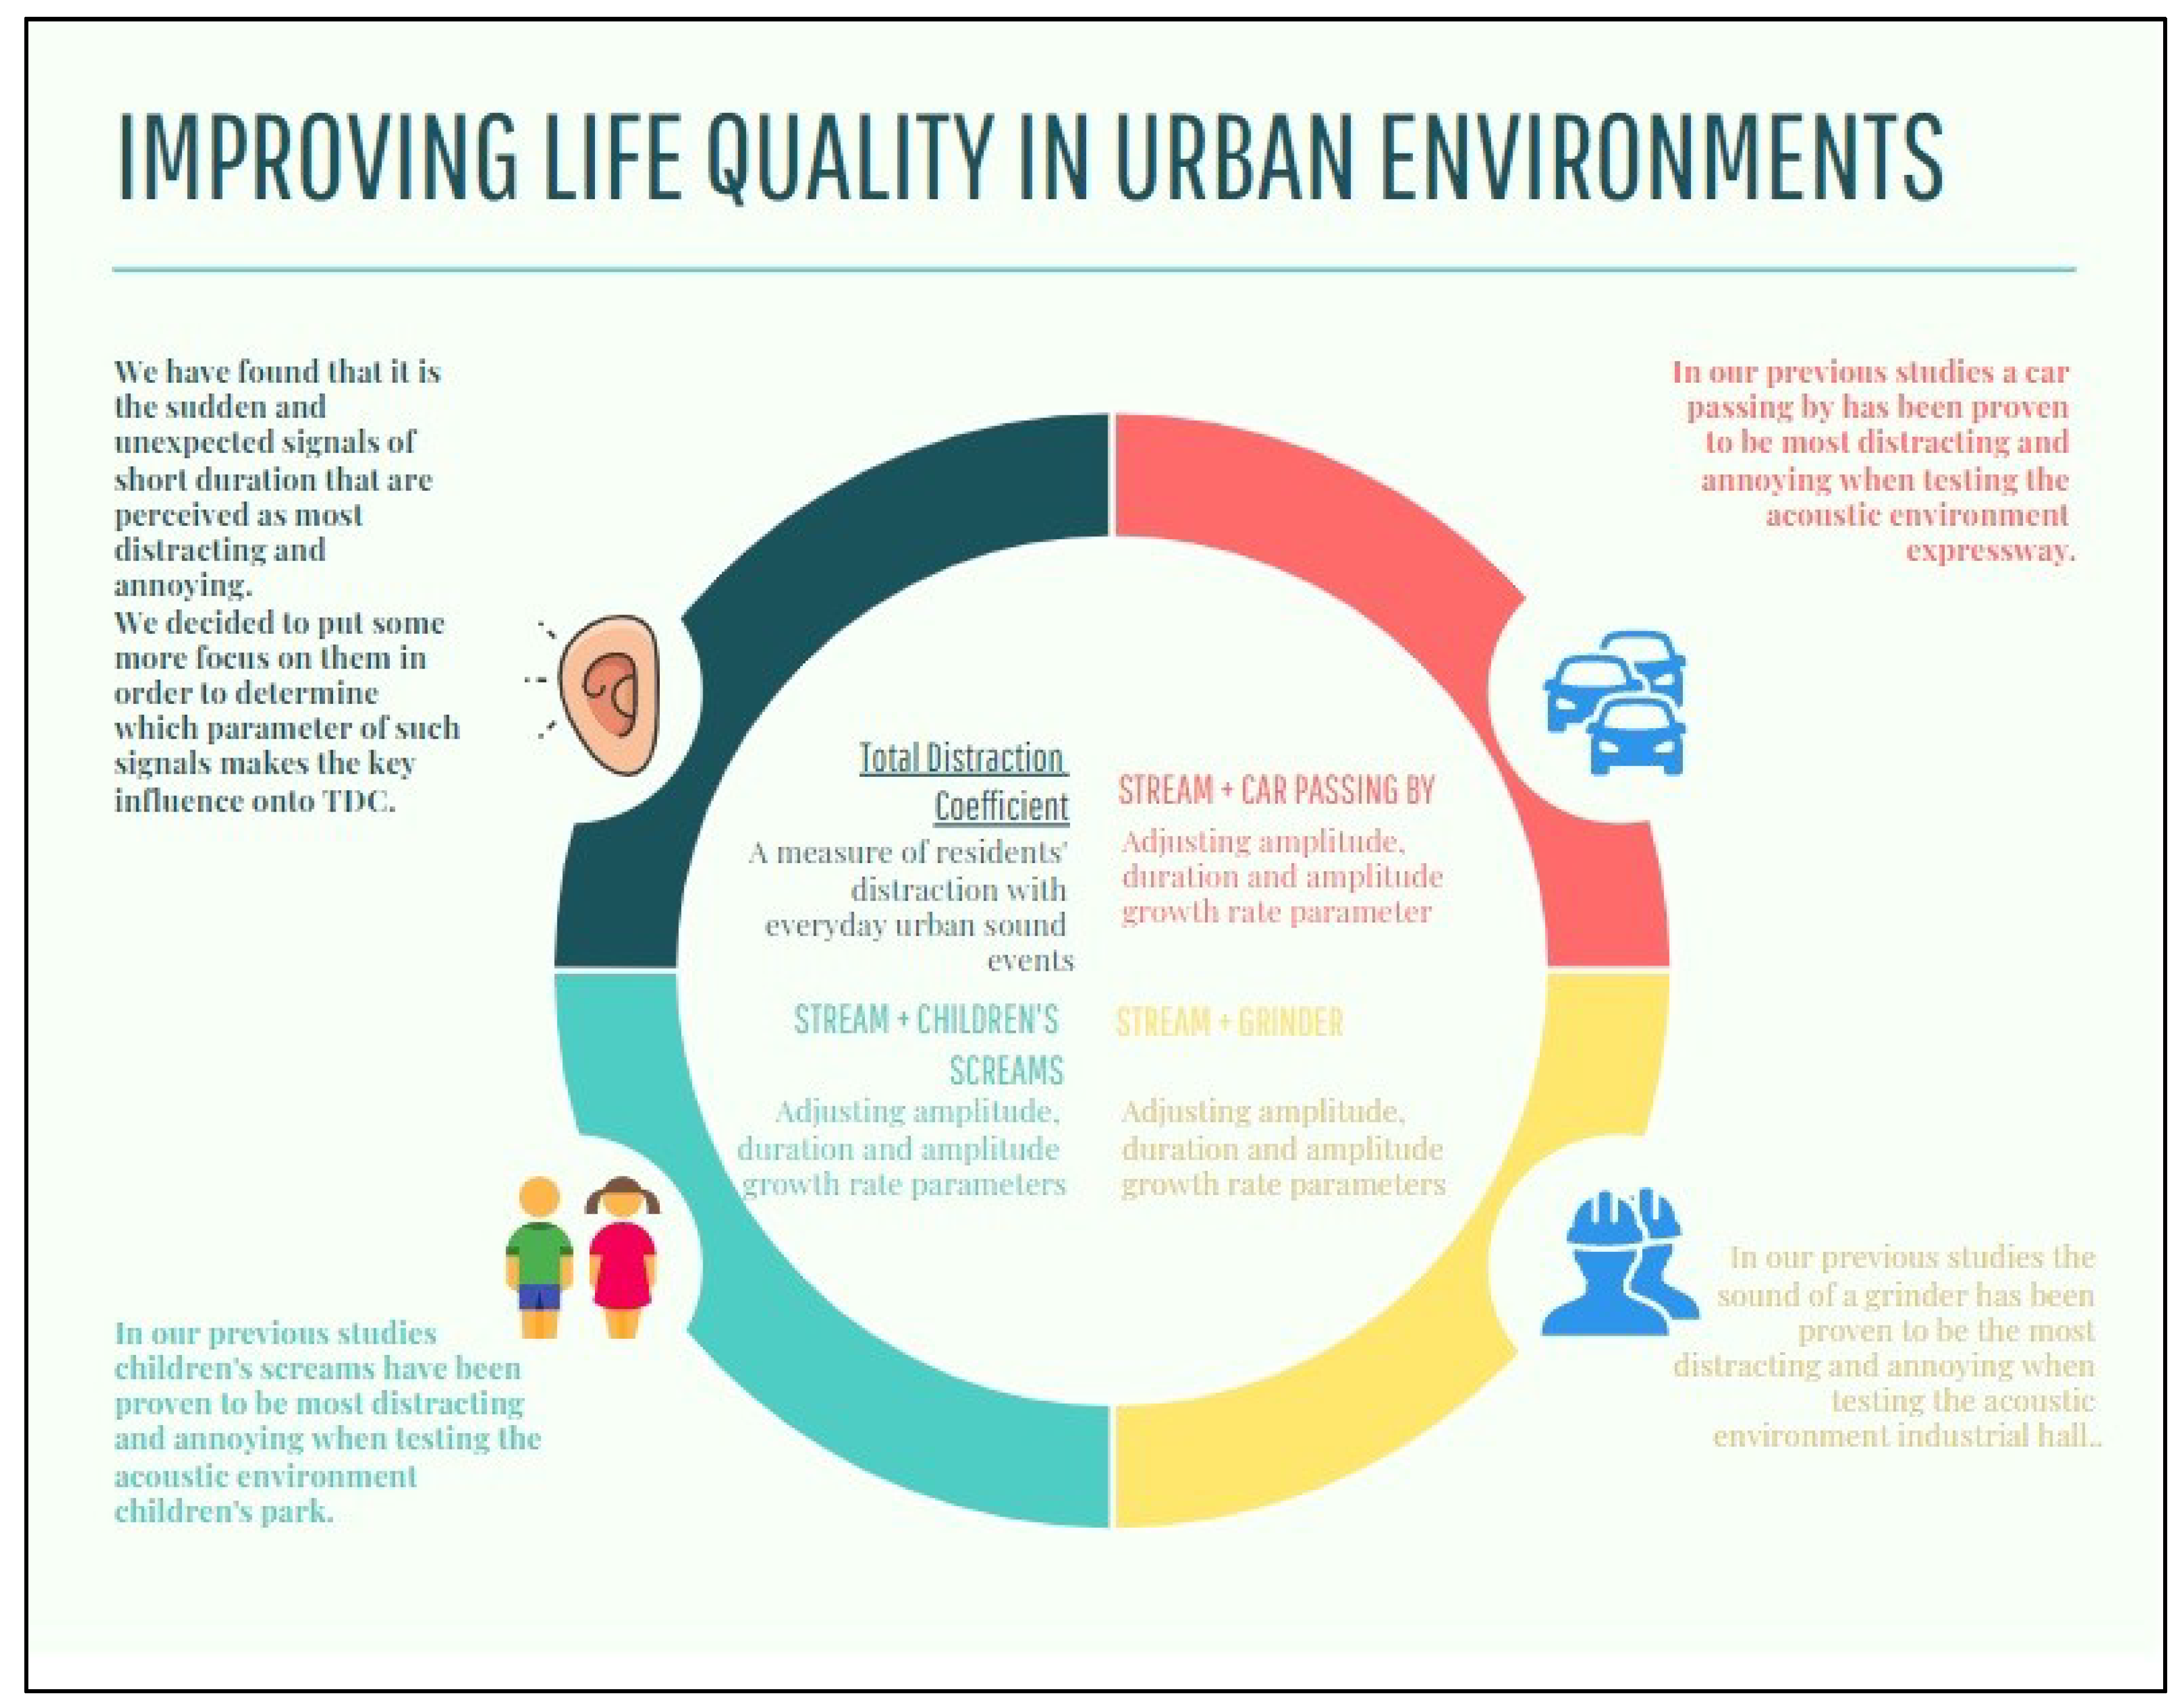
41] the studies established that loudness, duration and loudness growth rate have an impact on the overall human perception of an acoustic environment, however we actually desire to investigate, focus and prove how significant and major that impact is in terms of human annoyance. Considering our previous research, the null hypothesis of this study was that the mentioned parameters will be ranked by the study participants in the following way: loudness, duration and in last place the loudness growth rate. We expected that the higher levels of loudness would have a more significant impact on the annoyance than the duration of some typical sound signal. In addition, we wanted to determine when certain signals became annoying in terms of all three parameters. In our opinion, determining the ranking of the objective acoustic parameters while assessing the annoyance of a certain acoustic environment could benefit other scientists in their efforts to improve the overall comfort and pleasantness of acoustic environments (see
Figure 2), and therefore increase the health and well-being of residents especially in urban acoustic environments.
Thus, it can be inferred that architects, urban planners, acoustic engineers and doctors need to be involved in these studies and collaborate in order to address this issue of noise pollution and its negative effect on human health.
2. Materials and Methods
In this section we will describe in detail how the experiment was carried out. First, the process of creating the reproduced acoustic environment was outlined, which was followed by a detailed description and explanation of the user interface implemented in Matlab.
In particular, our idea was to start with the acoustic environment we found most pleasant and calming (i.e., stream [
31,
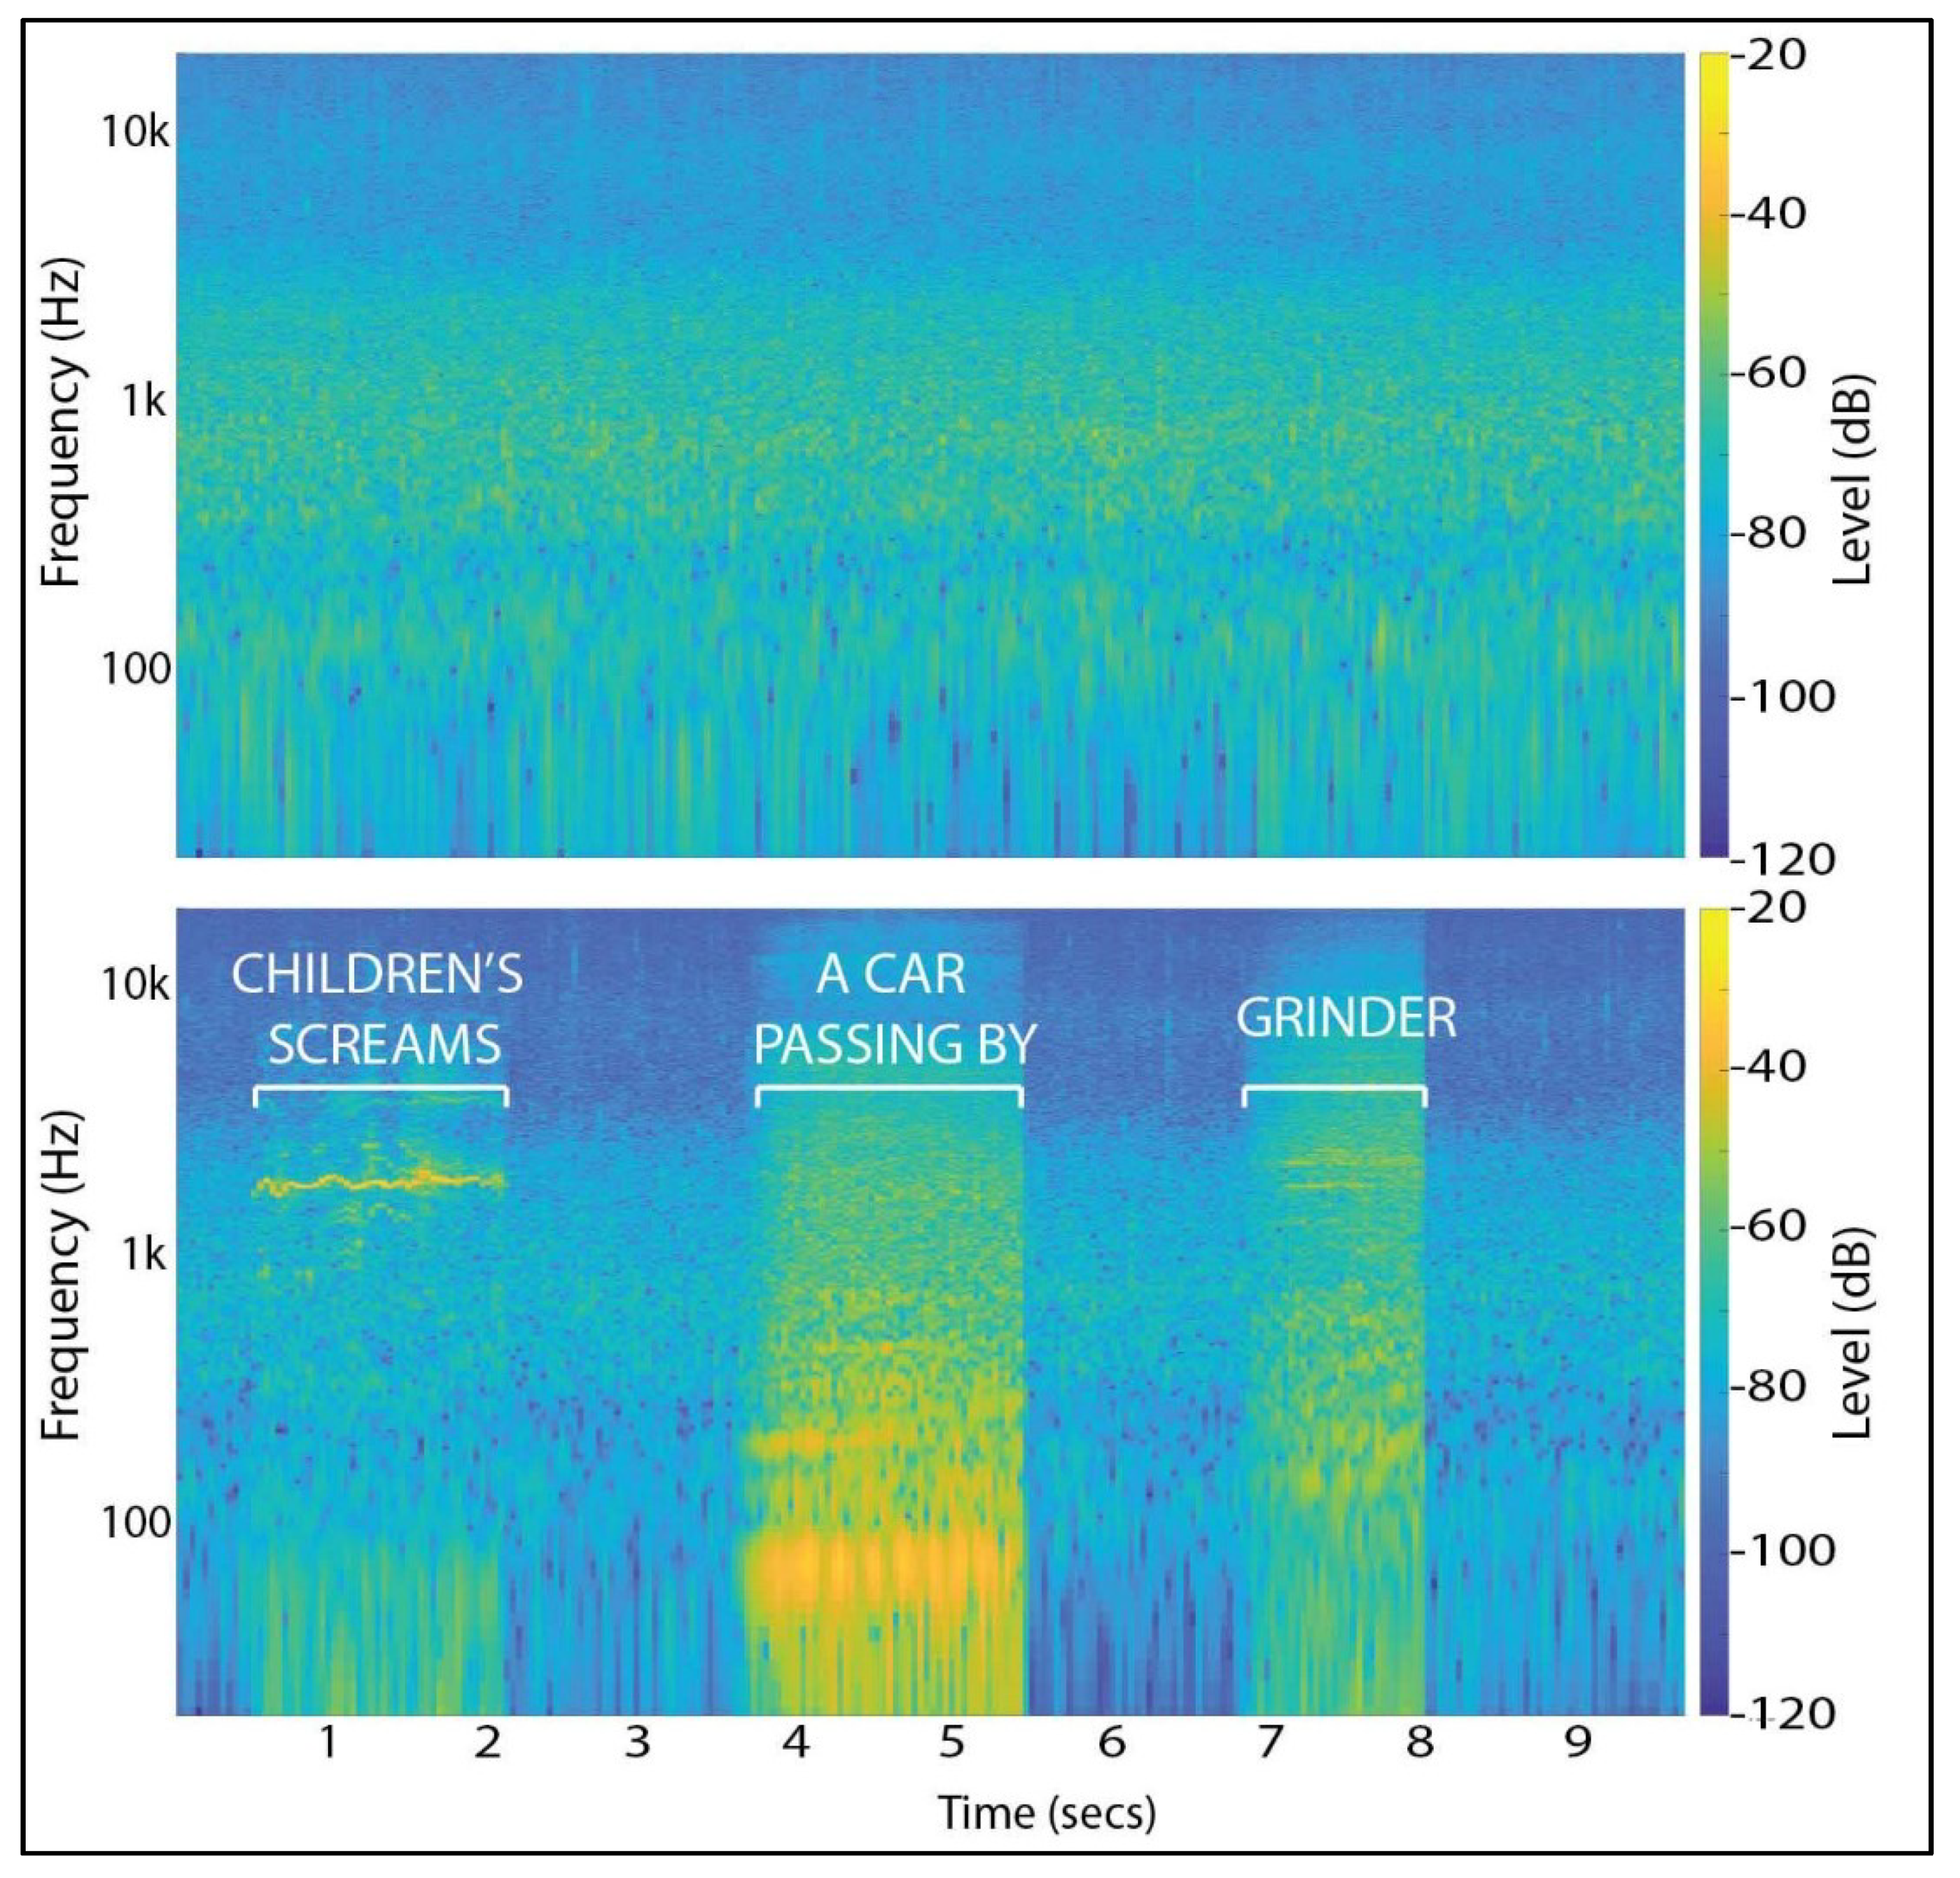
40]), and to artificially design several “corrupted” acoustic environments by inserting short distracting signals such as children’s screams, a car passing by and the sound of a grinder. By doing that, we obtained three similar acoustic environments suitable for more detailed analysis. The spectrogram of the stream is shown in the top part of
Figure 3, while the spectrogram of the “corrupted” stream acoustic environment is shown in the bottom part of
Figure 3.
The amplitude of the selected two second short signals used for this study was relatively continuous. In this way, we could ensure that the changes in amplitude could not influence the results. Furthermore, this facilitated the use of our short signals’ processing method, which we based on changing the amplitude envelope, which is described in more detail in the following paragraphs.
In addition, according to psychological research methodology certain conditions must be met in order to test a null hypothesis without bias or interference. Only then, after statistical processing, may the research hypothesis be proven or rejected [
42]. It is important to emphasize the controlled aspects of testing i.e., the size of the test sample, the testing conditions and the application of appropriate statistical procedures in tabulating and analyzing the data. This research involved 68 participants which volunteered and were therefore selected randomly. The average age of the participants was 23 years and the number of men and women involved in the study was equal. The minimum age among the participants was 18 and the maximum age was 47. Bearing in mind all the aforementioned, it can be seen that the study was carried out with respect to the established psychological methodology. In addition, the participation in a study was carried out anonymously and the participants were not exposed to any potentially harmful noise levels.
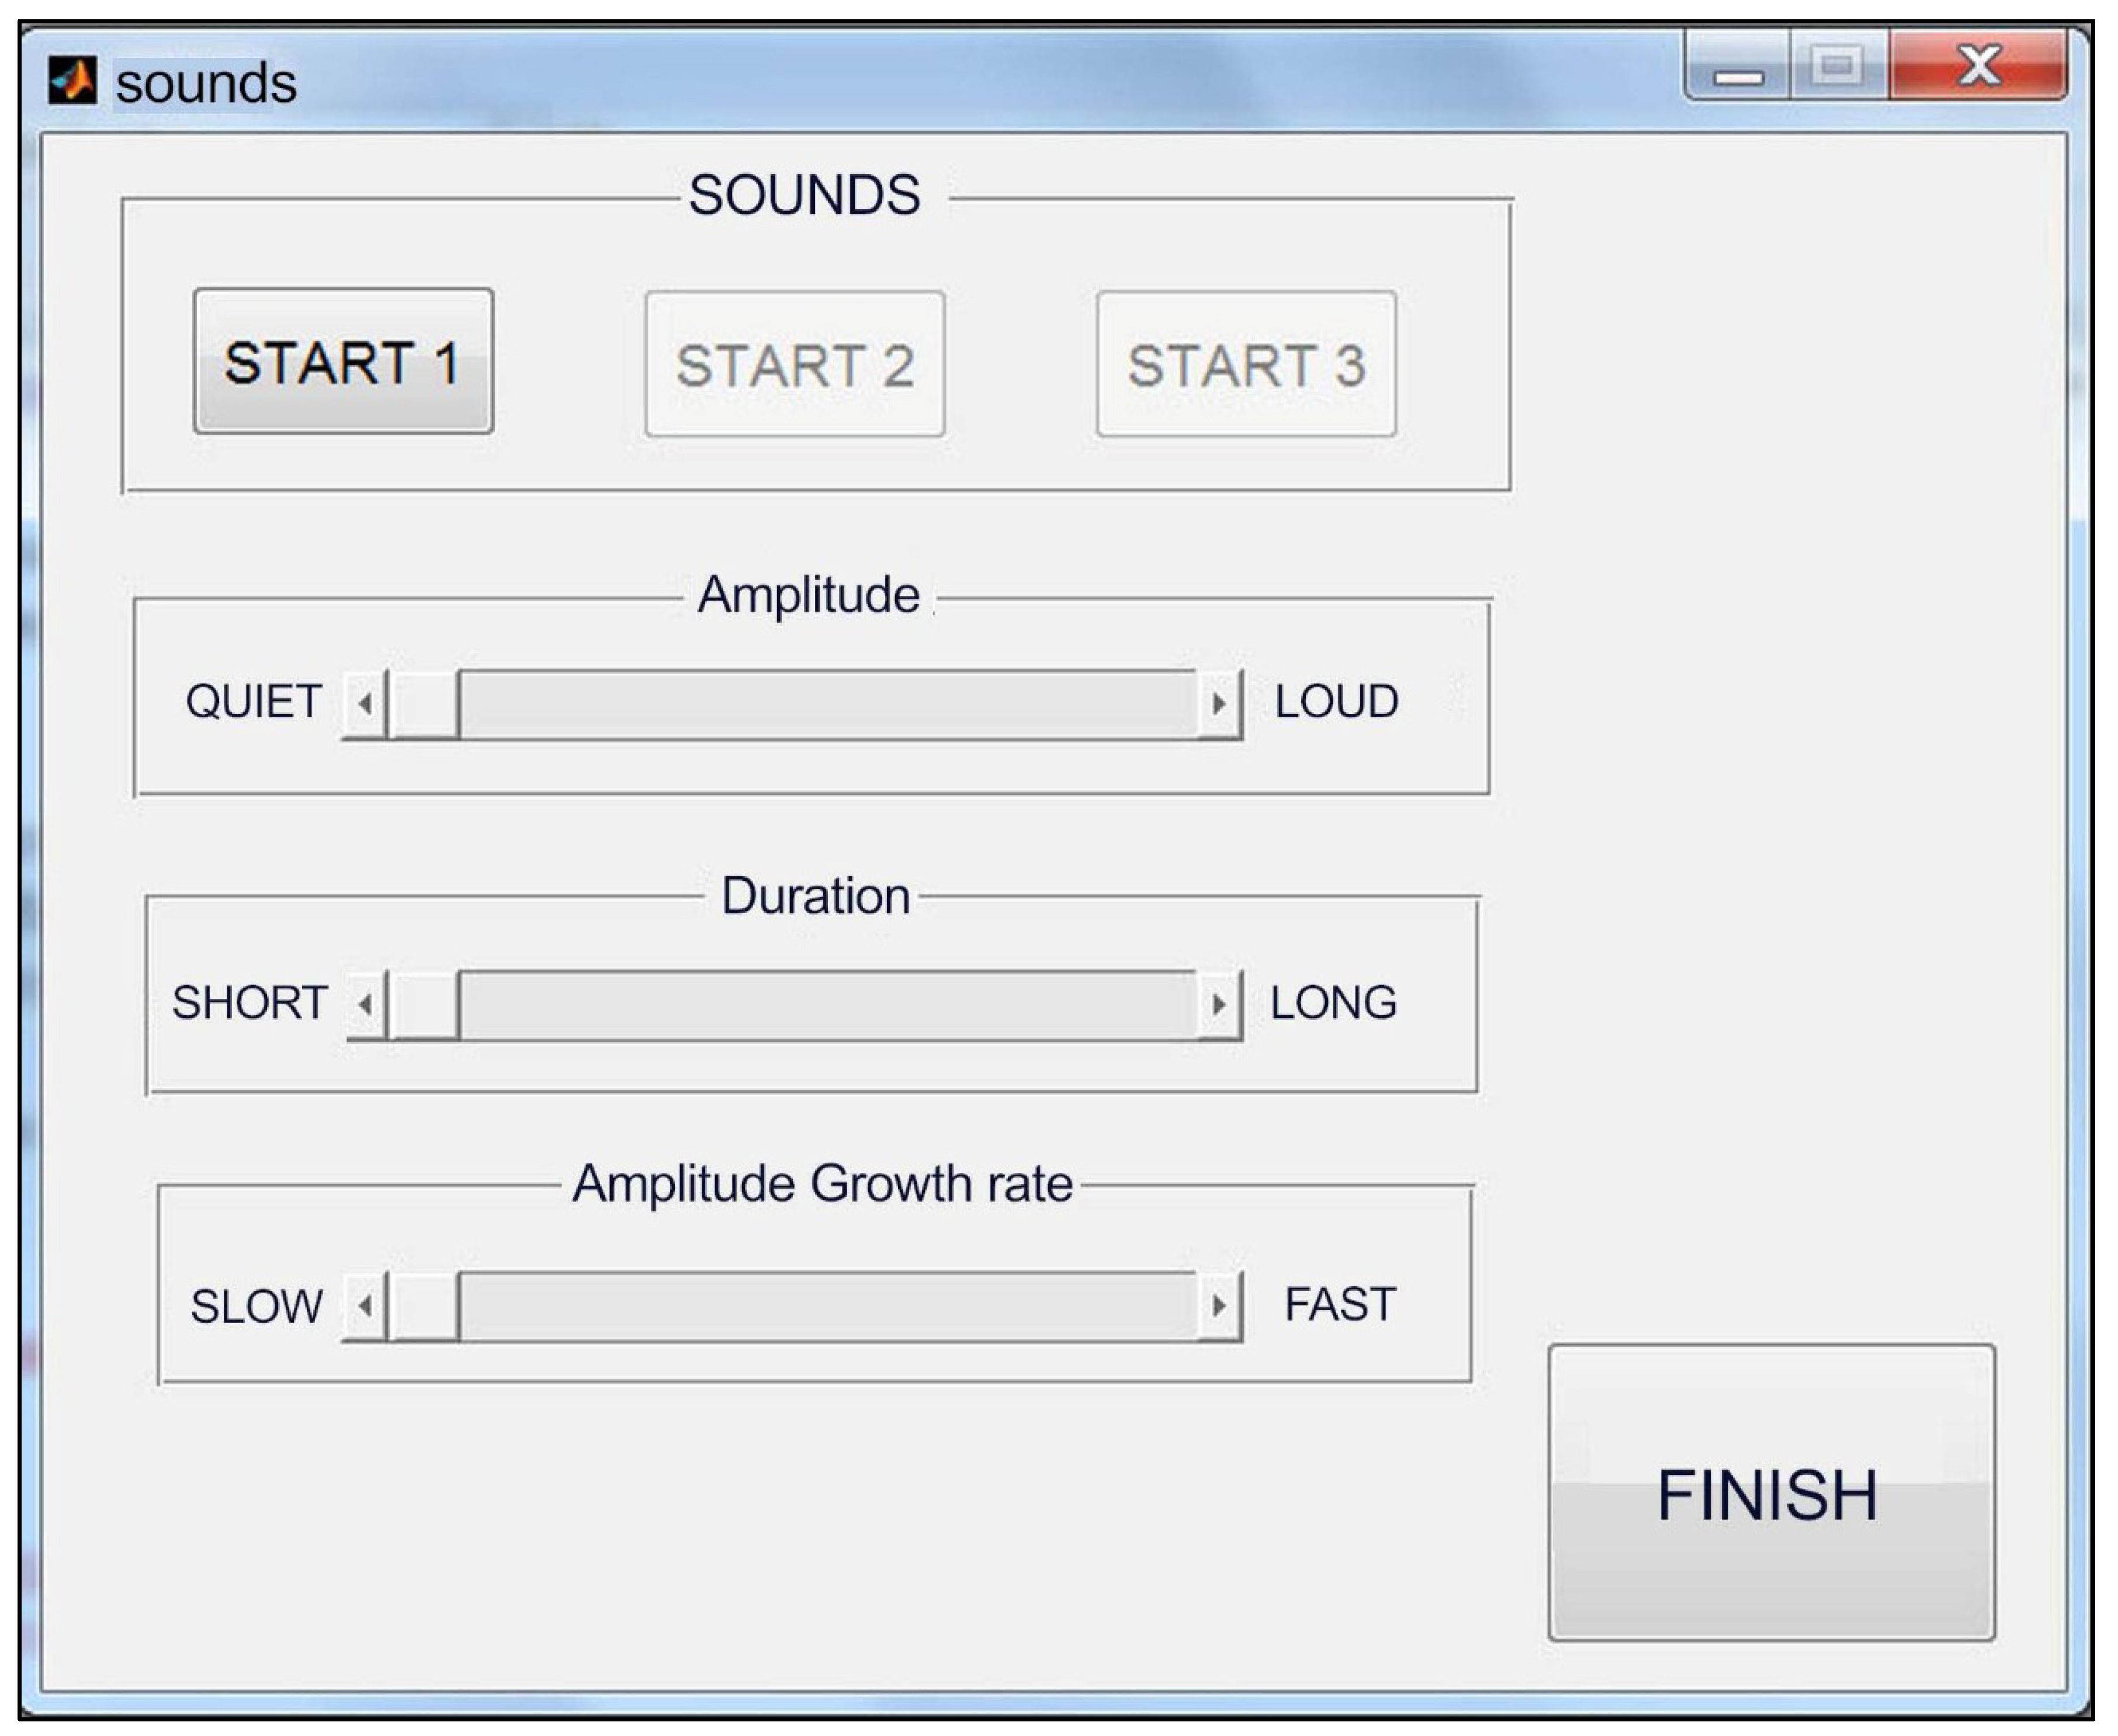
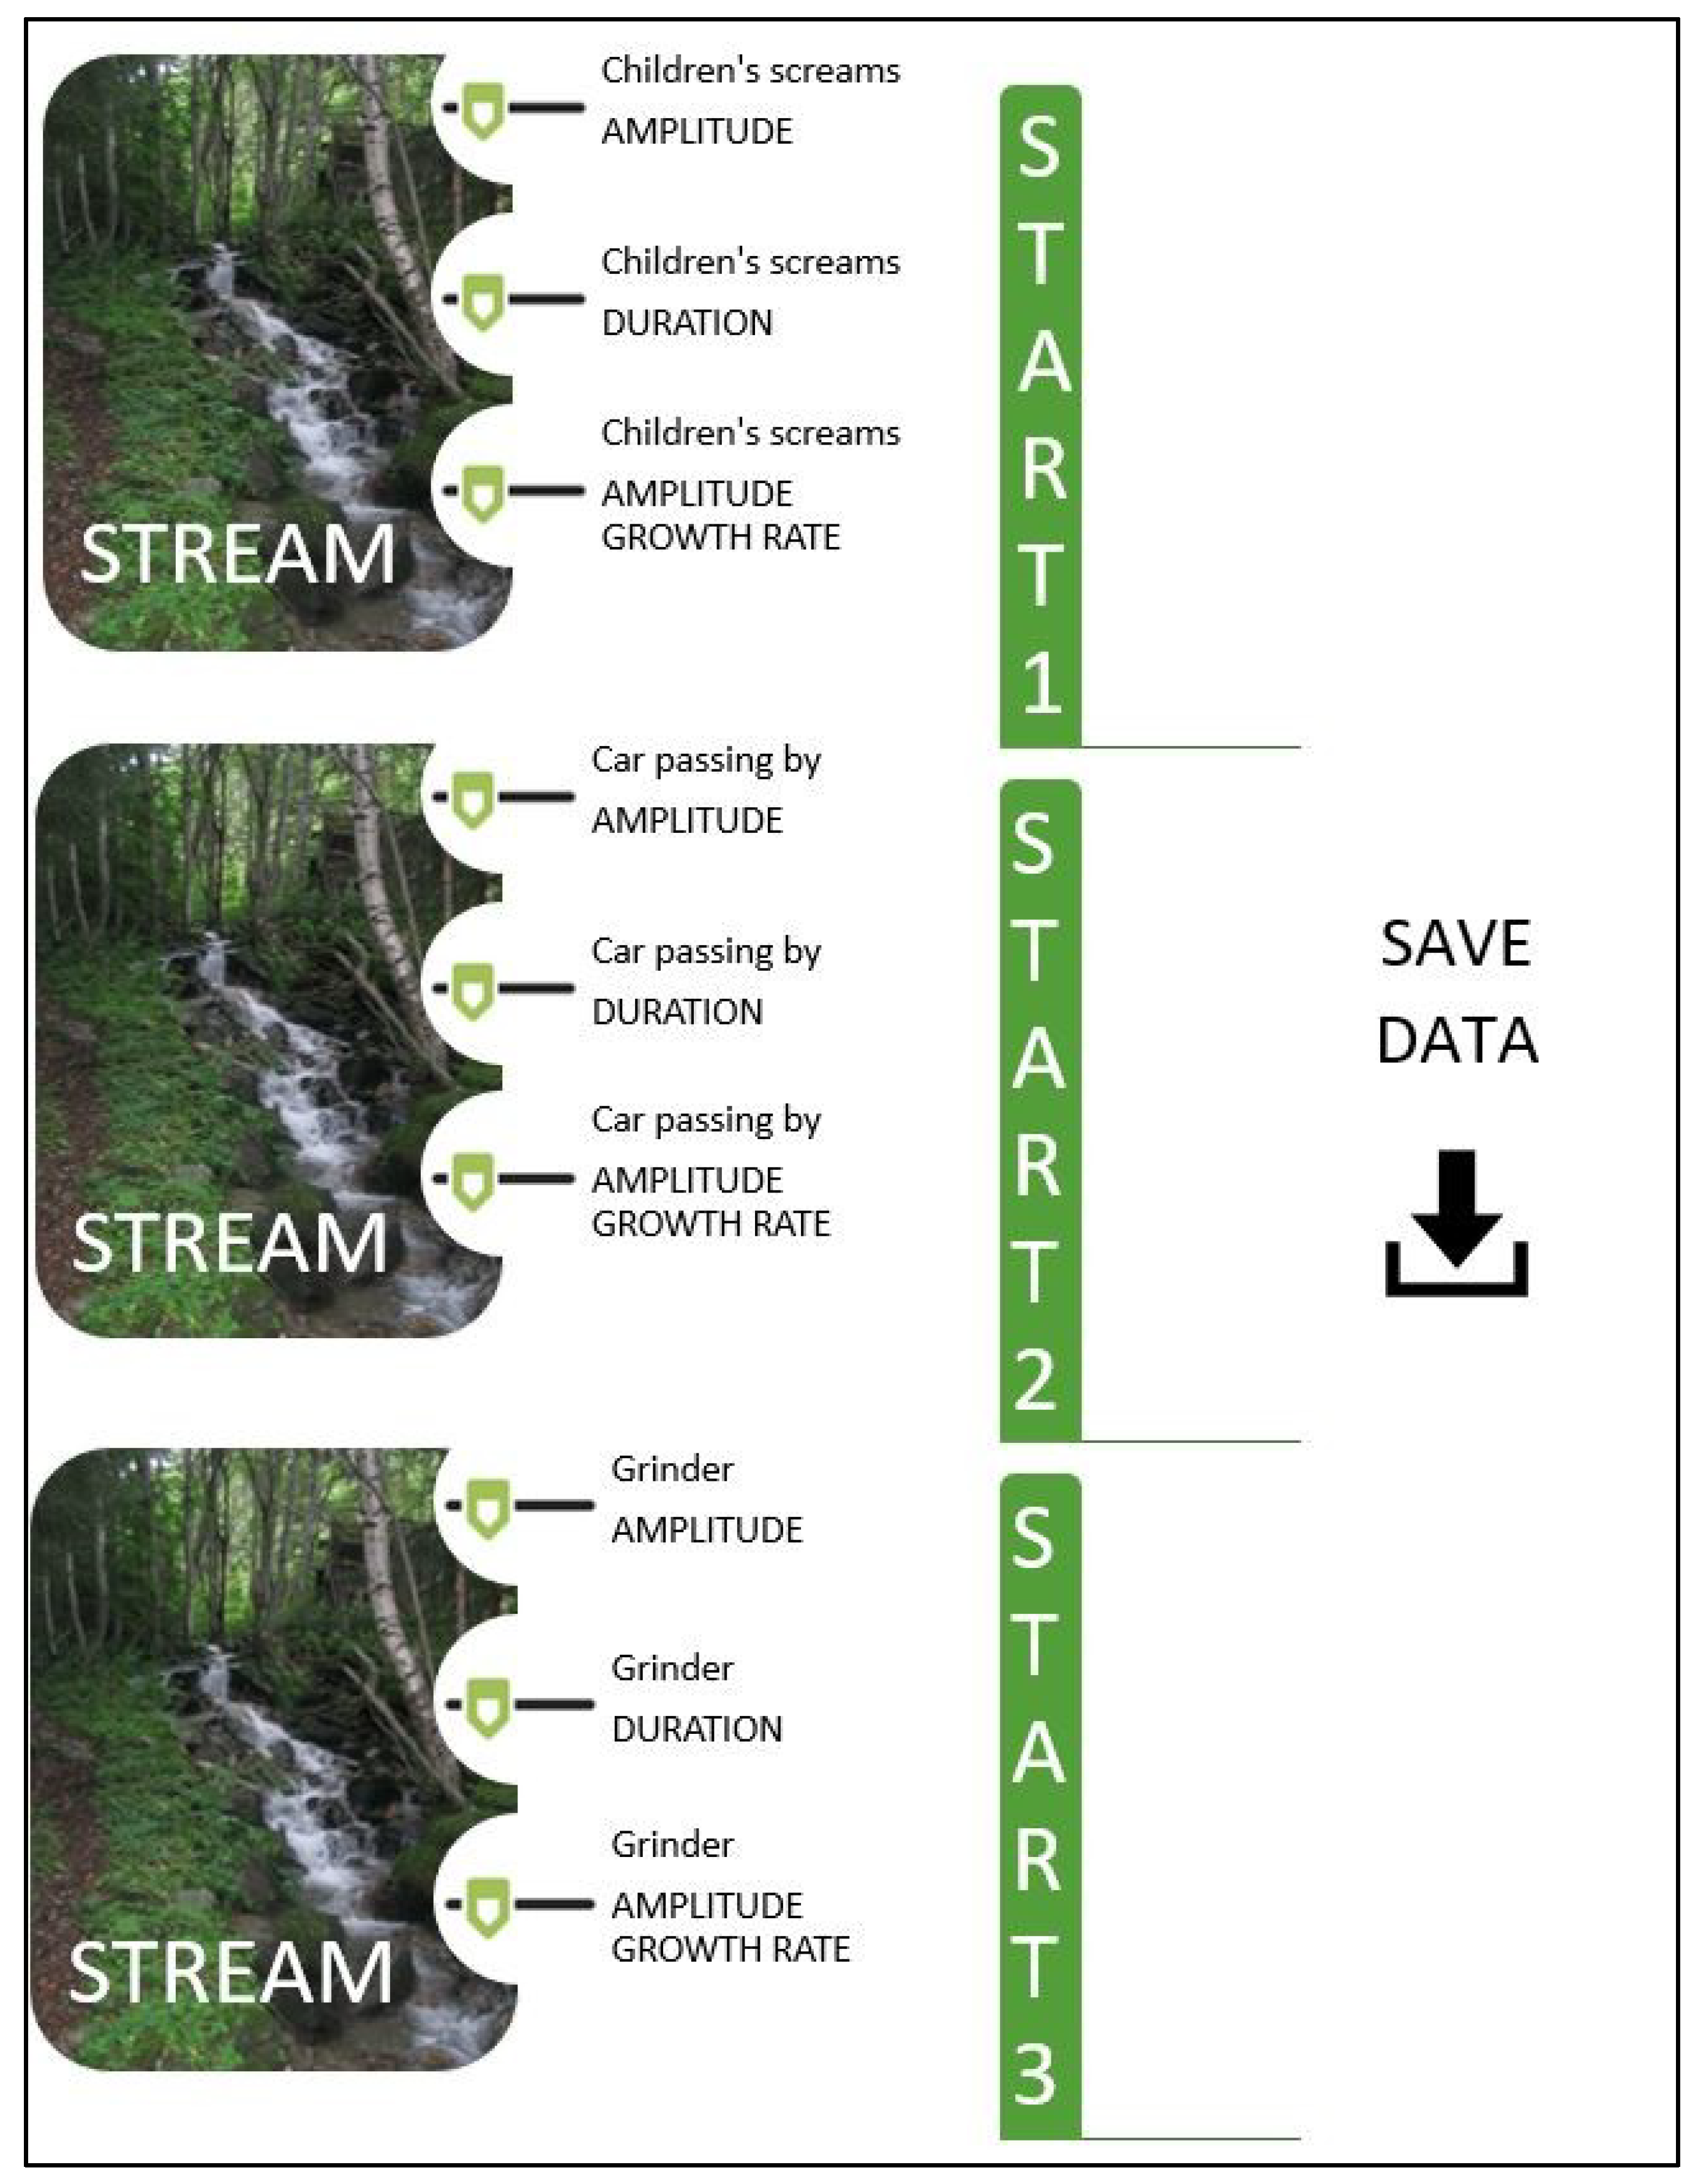
As previously stated, the study was carried at the Department of Electroacoustics in a specially equipped space (laboratory conditions) i.e., the participants had to listen to the recording on a computer with the AKG-55 (originally Akustische und Kino-Geräte Gesellschaft m.b.H., English: Acoustic and Cinema Equipment) closed headphones connected to a sound card. The experiment was carried out once for each participant i.e., there were no repetitions. An interface was programmed in Matlab and is shown in
Figure 4.
The interface allowed the participants to adjust three parameters e.g., the amplitude, duration and the amplitude growth rate of the short signals, and the processed short signals were reproduced together with the stream acoustic environment. The amplitude of the background i.e., the amplitude level of the sound environment stream, could not be changed. The envisaged idea was to get more information from the listeners on what annoyed them the most and in addition on what level, among the already proven distracting short signals. Each participant had the task of adjusting the sliders for the amplitude, duration and the amplitude growth rate of the short signal to the lowest possible level at which the short signal becomes irritating. The sliders were programmed to have 100 discrete steps. We presumed this would give enough resolution. A flowchart with the steps of the experiment procedure is shown in
Figure 5.
The average sound pressure level in the earphones of the stream acoustic environment was adjusted to around 50 dBA, for the entire duration of the recording, which was 10 s. The average sound pressure level was achieved through reproduction over the AKG headphones on the Neumann dummy head with a calibrated preamplifier. The signal level on the test computer was regulated until the preamplifier showed 50 dBA. When the participants selected the first, second or third short signal, and adjusted the three aforementioned parameters, an algorithm calculated an amplitude envelope of the selected short signal and multiplied the short signal with the calculated envelope. In particular, for the first five seconds of the stream recording, the participants of the study only listened to the “uncorrupted” stream acoustic environment. After the five seconds, short distracting signals appeared in the recording of the stream. Participants had the option to adjust the three aforementioned parameters and then listened again to the same stream acoustic environment with an added short signal. When they found a combination of the three parameters which resulted with the most annoying short signal, they continued to adjust the three parameters for the other two short signals. Finally, the interface program saved the adjusted parameters for all the short signals in a database.
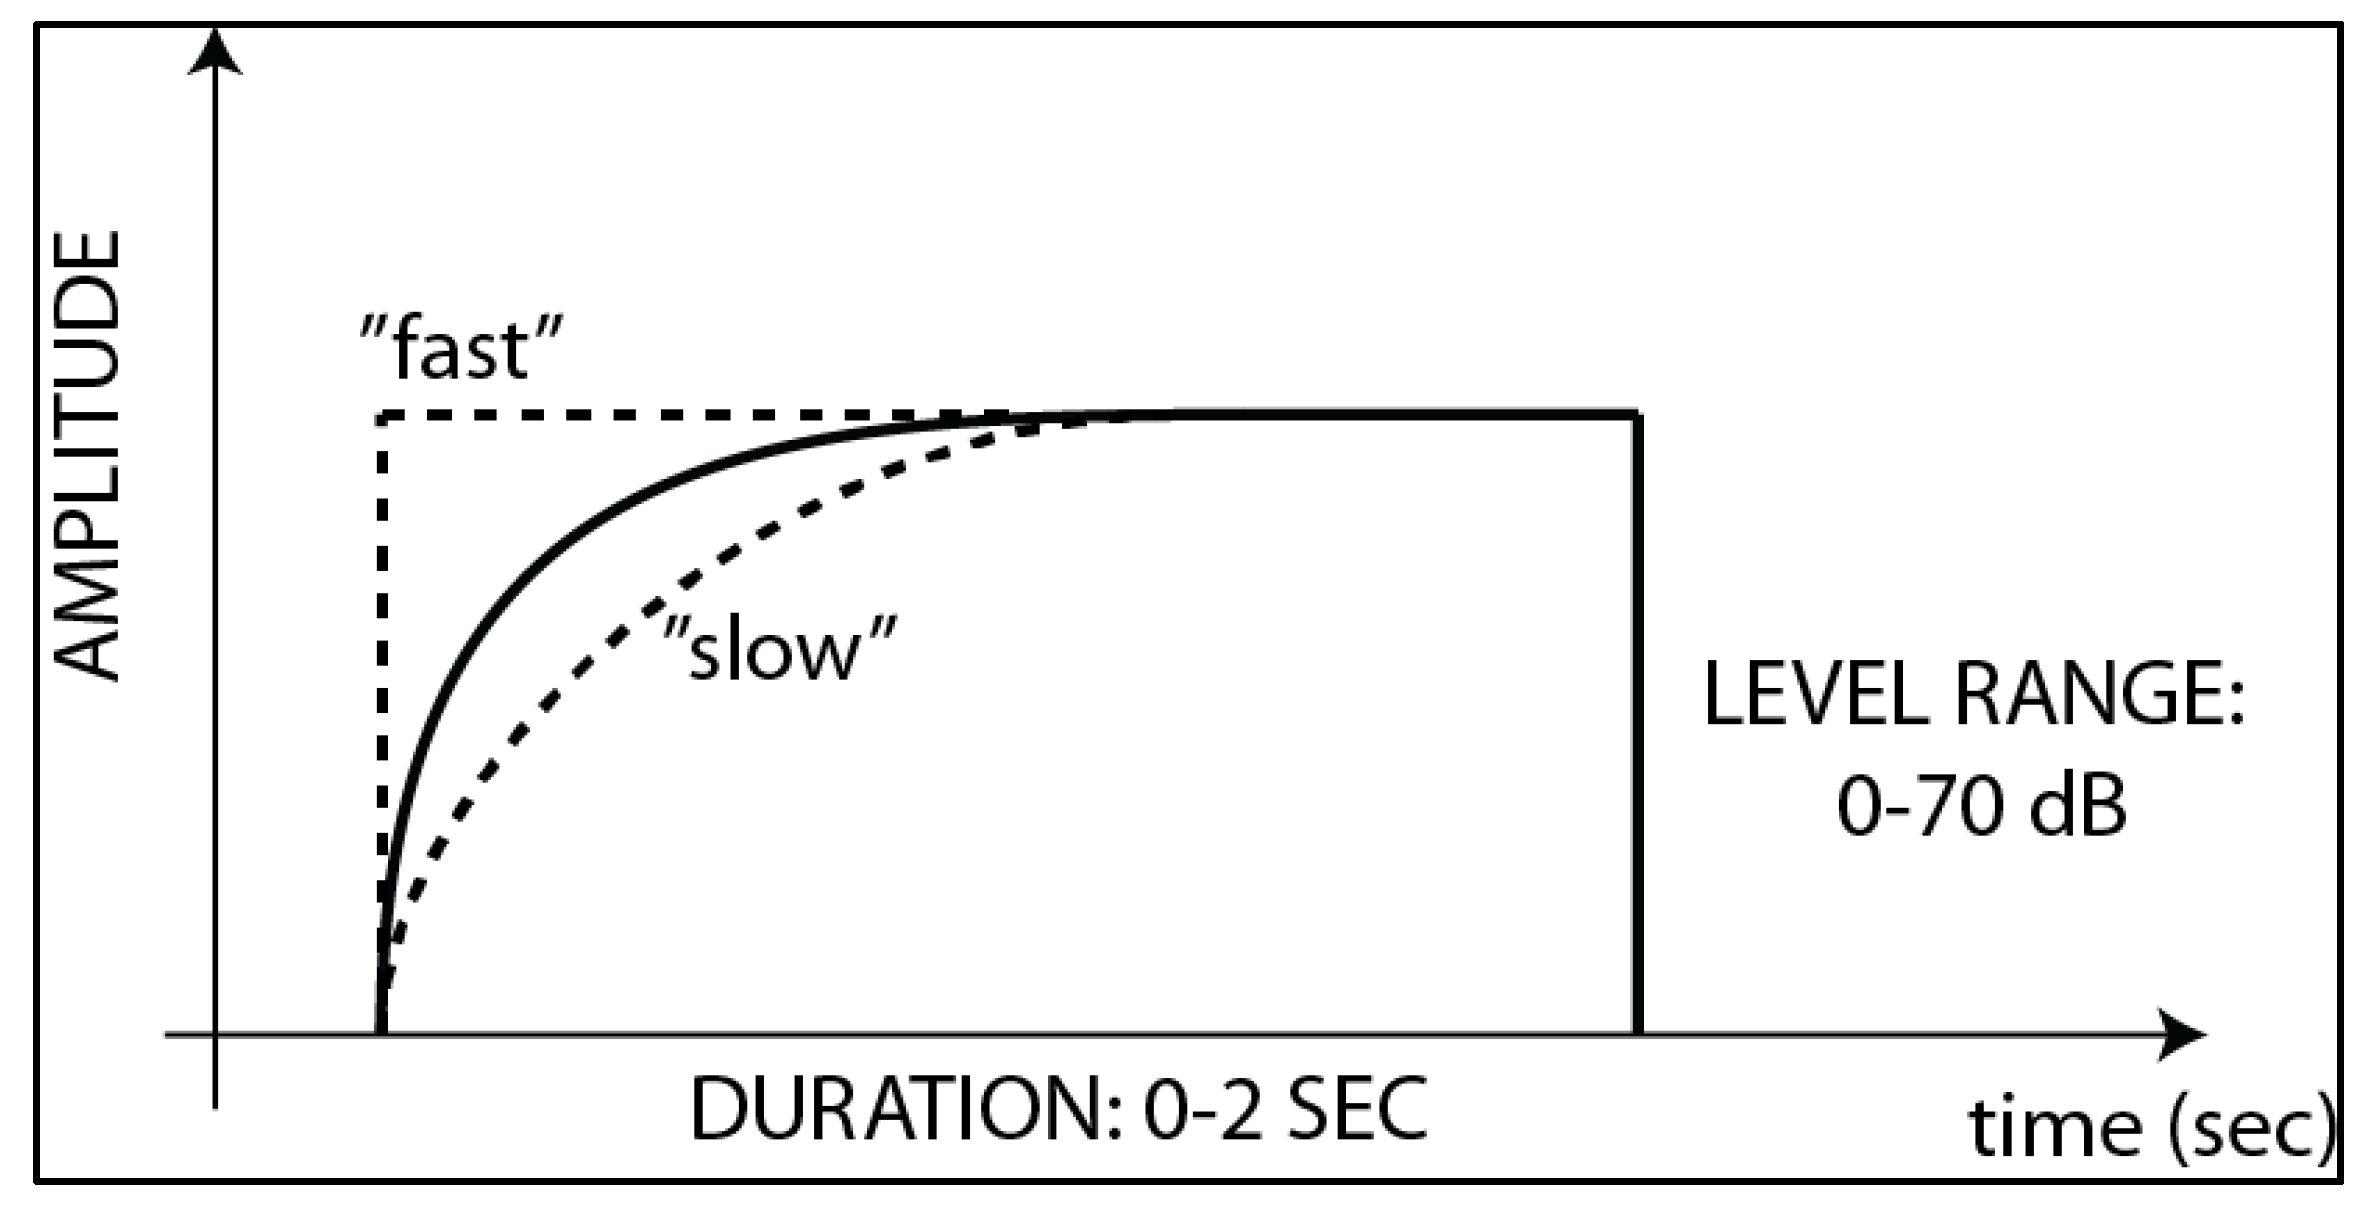
The program provided data for the amplitude parameter within range of 0–1 where 0 presents a 0 dB sound pressure level and level 1 indicates a sound pressure level of 70 dB, above the average level of the stream acoustic environment. These levels corresponded to different loudness in sones, depending on the short signal. The duration ranged from 0 to 2, where 0 is zero seconds and 2 is two seconds.
The third parameter was the amplitude growth rate of the signal within a range of 0–1. The amplitude growth rate corresponded to the exponential increase in the amplitude in a way that the listener could choose the duration of that increase. If a “slow” feature was selected, this presented the longest amplitude growth rate, where amplitude exponentially grew for one second. If the “fast” feature was selected, the amplitude grew for zero seconds.
Figure 6 shows an example of the amplitude envelope used for processing the short signals, with adjustable ranges of duration and amplitude.
Equation (2) shows a formula used for the calculation of a time window (
TW) for the short signals, according to the amplitude parameter (
AMP) and growth rate (
GR):
where
i = 1 to
N. The number of used samples N was selected according to the selected duration of the short signal.
3. Results and Discussion
In this section, the analysis and discussion of the results that were obtained via the Matlab interface are portrayed, followed by the application of the chi-square test as a statistical tool used for proving the research null hypothesis and the drawn conclusions. The research null hypothesis was that the loudness would be the most significant parameter in terms of human annoyance with a particular sound signal, followed by the duration and the loudness growth rate.
3.1. Results from Matlab
Table 1 shows the results obtained from this research for the children’s screams, a car passing by and the sound of the grinder.
In the case of the children’s screams, the listening results showed that this short signal becomes annoying at the mean amplitude parameter value of 0.51. Furthermore, since the amplitude potentiometer was set from 0 to 1 (where 0 indicates 0 dB and 1 denotes 70 dB), it can be concluded that 0.51 corresponds to the absolute sound pressure level of 35.70 dB above the level of the stream acoustic environment, which corresponded to 85.70 dBA or 15.60 sones including both stream sound environment and short signal.
Following the same analogy for the passing of a car, a mean amplitude parameter value of 0.42 was obtained which corresponded to the absolute sound pressure level of 79.40 dBA or 14.75 sones.
Finally, for the sound of the grinder, it was concluded that the sound becomes irritable at a mean value of the amplitude parameter 0.47, which is equivalent to the absolute sound pressure level of 82.90 dBA or 14.95 sones. The loudness values were calculated using the Zwicker’s loudness model [
32,
33,
34,
35,
36] for each short signal including the background stream acoustic environment, using the 100 milliseconds time intervals.
When analyzing the duration of the short signals, the mean values were obtained in the following order: for the screaming children, 1.10, for the car passing by, 0.98, and for the grinder, 0.92. The duration potentiometer has a range of 0–2, where 0 means zero seconds and 2 means two seconds. It can now be concluded that all three short signals for the majority of listeners become annoying after a minimal duration of one second.
Furthermore, the mean values of the amplitude growth rate were obtained: for the children’s screams, 0.55, for the cars passing by, 0.63, and for the grinder, 0.54. In addition, the signal’s amplitude growth level is expressed in sones per second and the mean values are the following: 17.30, 16.67 and 16.21 sones per second.
If we observe the obtained mean results for the three distracting short signals (shown in
Table 1) it can be concluded that the “most important” parameters, regarding the human annoyance with a particular sound, are the amplitude and the duration. The test has shown that the sound will become annoying to the listener if its sound pressure level is at least 34.30 dB above the level of the stream acoustic environment and if the sound is no shorter than one second.
3.2. Chi-Square Test Calculations
In order to apply the conclusions that were made for this sample (68 participants) to the whole population, it is necessary to apply a certain and appropriate statistical method, which is in this concrete case is the chi-square (
χ2) test [
43]. A
χ2-test is a very practical statistical tool which is used when it is necessary to determine whether some of the obtained or observed values differ from the values that would be expected under a certain research hypothesis. The
χ2-test calculations are similar to the correlation coefficient calculations in terms of showing if there is a link between the two variables. However, in these cases there is also a significant difference between the correlation coefficient calculations and the
χ2-test. The correlation coefficient calculations show the degree of correlation between the two variables, while the
χ2-test shows the probability of the correlation. Thus, in almost all the cases (provided that some additional corrections sometimes need to be made or it is more practical to use another formula that abbreviates computation), the
χ2-test is calculated according to the following expression:
where
fo is the observed frequencies and the
ft is the expected (theoretical) frequencies.
In this particular study, it was expected (e.g., the null hypothesis was) that the listeners will be annoyed with the amplitude, the duration and the amplitude growth rate of the short signal, however, not necessarily in the same ratio. Bearing in mind the defined intervals in this experiment, the expected values would be: for amplitude 0.40, for duration 1.20, and for amplitude growth rate 0.60. The expected values were obtained in the following way. Considering the results of our previous research [
31,
40], a signal’s amplitude is the most important parameter in determining the signal’s irritability, so its expected value is equal to the mean value of the range reduced by a correction value of 0.10 (i.e., the majority of participants will be annoyed at a lower level i.e., 10% of the entire range lower from the mean value of the range which is 0.50 − 0.10 = 0.40). The correction value of 0.10 was not chosen randomly. If we look at
Table 1, in particular the amplitude parameter for each startling sound change and we take into account the range of its change, 0.10 “covers” the whole difference change and in addition, it represents “one step” in adjusting the sliders. Thus, following the same methodology, the expected frequencies for the duration and the amplitude growth rate were also adjusted. Since the duration turned out to be less important than the loudness, its expected value was obtained by adding the 0.20 to the midpoint of the corresponding interval. In the end, the least important parameter e.g., the amplitude growth rate, was obtained by adding the 0.20 to the range’s mean value due to the fact that previous research [
31,
40] showed that for the listeners this was not the “crucial” parameter in terms of annoyance. For example, if the duration and the amplitude growth rate were equally important, then the expected value for the loudness growth rate would be obtained by adding 0.10 or in particular the expected value would be 0.60. Finally, in
Table 2 the results of the
χ2-test are shown.
Table 2 has shown that the
χ2 boundary value with two degrees of freedom (for three parameters: amplitude, duration, amplitude growth rate and furthermore, the degrees of freedom were calculated using the formula (N − 1), where N is the number of parameters e.g., cells) and at the level of significance
p = 0.05 (=5%) is equal to 5.991. The value
χ2 calculated from the data obtained in this experiment was significantly lower than the boundary value, moreover, it was very close to the zero value, which means that the null hypothesis was correct and can be accepted. Therefore, it can be concluded that the obtained results do not statistically significantly differ from those that were expected (i.e., the null hypothesis of the study is confirmed).
For this reason, it can finally be concluded that the most significant reason for human annoyance is a sound’s amplitude, then its duration and in last place its amplitude growth rate.
4. Conclusions
This paper describes a study which focused on the human annoyance perception of three short signals with respect to three acoustic parameters: amplitude, duration and amplitude growth rate. Short irritable signals (children’s screams, a car passing by and the sound of a grinder) were used in this study. The aforementioned signals were inserted in the most calming and pleasant sound environment, i.e., a stream. The main idea was to get more information from the listeners on what annoyed them the most on already proven distracting short signals with the final goal of improving the quality of life, human well-being and health in urban areas and reducing noise pollution. The study was carried out in laboratory conditions and the listeners had to listen to the recording on the computer with the AKG-55 closed headphones. For this purpose, an interface was specially designed in Matlab which allowed the study participants to adjust the acoustic parameters e.g., the amplitude, duration and the amplitude growth rate of the short signals, while in the background the sound environment stream was played. The amplitude level of the sound environment stream could not be changed. If we observed the obtained results for three irritable short signals, it can be concluded that the “most important” parameters, regarding the human annoyance with a particular sound, are its amplitude and duration. To be more precise, the study showed that the sound will become annoying if its sound pressure level was at least 34.30 dB with respect to the level of the background of the stream acoustic environment and if the sound was no shorter than one second. In order to apply the conclusions that were made for this sample to the whole population, the chi-square test was carried out for the obtained results. The χ2-test proved our null hypothesis, thus it can finally be concluded that the most common reason for listeners’ annoyance is the sound amplitude which is followed by its duration and the amplitude growth rate, respectively. We noted that some bias in this particular study may be present since this research was carried out in laboratory conditions, however we believe that the results of this research can serve as a basis for the further improvement of acoustic environments and making new architectural and urban planning solutions that give rise to overall acoustic comfort. Urban planners, architects, doctors, psychologists as well as acoustic engineers need to work together and benefit from each other’s work with a common cause to improve the overall quality of life. By collaborating, we could reduce noise pollution and moreover improve the human health and well-being of residents, especially the ones living and working in urban areas. Future work will be oriented towards expanding the existing calculation for the total distraction coefficient, considering the findings obtained through this study. Another parameter focused primarily on particular sound sources, which are described by their amplitude, duration and the amplitude growth rate, will be introduced into the formula. This should enable us to provide a large database of sound sources ranked according the human annoyance and link the objective and subjective parameters i.e., establish how certain clusters of sound sources influence the overall human perspective of a sound environment.
