Article

Stability Tests of Agricultural and Operating Machines by Means of an Installation Composed by a Rotating Platform (the “Turntable”) with Four Weighting Quadrants

by
Marco Bietresato
* and
Fabrizio Mazzetto
Faculty of Science and Technology, Free University of Bozen-Bolzano, Piazza Università 5, I-39100 Bolzano, Italy
*
Author to whom correspondence should be addressed.
Appl. Sci. 2020, 10(11), 3786; https://doi.org/10.3390/app10113786
Submission received: 2 April 2020 / Revised: 18 May 2020 / Accepted: 26 May 2020 / Published: 29 May 2020
(This article belongs to the Section Mechanical Engineering)

Abstract

:

Featured Application

This study describes the possible outputs of a novel test rig having an inclinable and rotating turntable, illustrating in detail the physical laws governing the phenomena. This rig can be successfully used to test the stability of real-scale vehicles in many operative conditions.

Abstract

The stability of agricultural machines, earth-moving machines, snow-compaction machines and, in general, of all vehicles that may operate on sloping terrains is a very important technical feature and should not be underestimated. In fact, it is correlated, above all, to the safety of the operators, but also to the preservation of the structural integrity of these vehicles, to the prosecution of the activities and to the preservation of the economic investment. Although these facts are well-known, the international legislation and technical standards do not yet have a sufficient level of detail to give an all-inclusive quantification of the stability of the vehicle under examination in all its working conditions, e.g., at different inclination angles of the support surface, at different climbing angles of the vehicle on the slope, with different tires and inflating pressures, and on different terrains. Actual standards limit the stability tests to the experimental measurement of the lateral rollover angle only. Furthermore, the realization of unconventional test equipment able to widen the usually-tested scenarios could not be simple, due to the necessary size that such equipment should have (to perform tests not in scale) and to the related difficulties of handling full-scale vehicles. This work illustrates the applications of a new rig for testing the stability of vehicles, able to address all the above-illustrated issues and of possible future adoption to certify the stability performance of machines and perform homologations. This installation, named “rotating platform” or “turntable”, has the peculiarity of being able to move the machine positioned on it according to two rotational degrees of freedom: (1) overall inclination of the support plane, (2) rotation of the support plane around an axis perpendicular to the plane. The same installation is also designed to record the weight supported by each wheel of the machine placed on it (by means of four sensorized quadrants), both when the platform is motionless and while the above-described movements of tilt and rotation are being carried out, thus locating precisely the spatial position of the vehicle center of gravity. The presented physical-mathematical models highlight the great potential of this facility, anticipate the outcomes of the recordings that the experimenters will have at disposal when the test rig will be effectively active, and help the future understanding of trends of data, thus maximizing the available information content.

1. Introduction

The configuration (i.e., the absolute position and orientation) of a vehicle in the space (if assimilated to a rigid body) is uniquely defined by six independent variables called “degrees of freedom” (DoFs): three translational DoFs (the coordinates of its center of gravity (CoG)) and 3 rotational DoFs (roll, pitch and yaw angles) [1,2]. The first three DoFs characterize the absolute position of the vehicle (and, therefore, its trajectory, by observing how the coordinates of its CoG vary over time), the second three DoFs (referred also to as “Euler angles”) characterize its orientation in the space and, therefore, its attitude [2]. In particular, the three rotational DoFs are directly involved in the balance of a terrestrial system/vehicle in relation to its support base. As demonstrated in other previous works principally focussed on agricultural machines stability [3,4,5,6,7,8,9,10,11,12,13,14,15,16,17], a vehicle (or, more generally, a body) placed on a (rigid) plane with friction has a stable position on that plane if both the following conditions are verified:
  • the resultant of external forces acting on the CoG intercepts the support plane inside the support polygon, defined by taking the footprints of the vehicle supports (e.g., the centers of the tyre footprints) as vertices [3,4,9,10,11];
  • the friction developed at the interface with the support ground is higher than the parallel component of the resultant of the external forces applied to that body [18,19].
If the first condition is verified, the vehicle has a null moment of the external forces and, hence, does not experience any rotation, i.e., does not overturn [11,20,21,22,23,24,25]; if the second condition is verified, the vehicle has a null resultant of the external forces and, in particular, does not slide along the support surface [26,27]. The stability of a vehicle is normally referred to as the overturning. Excluding the sliding/translation of the vehicle (hence, of the CoG) along the plane, which are not of interest in this study, because they had not been foreseen by any international test standards dealing with the stability of a vehicle [28,29,30,31], all current stability tests aim at imposing known values of the three rotational DoFs from outside the vehicle under test, for example by acting on the orientation of the support system (in this case: a support platform). Traditional test equipment, mainly used in certification laboratories (e.g., OECD test stations), is composed basically by a tilting rigid platform with only one degree of freedom (i.e., the tilting angle of the platform). Such an equipment causes the vehicle to tilt when it has one of its main axles aligned with the tilt axis and it has the steering wheels in a straight-ahead traveling configuration or in a single specific steering configuration (as forecasted for telehandlers, pallet stackers, double stackers and order-picking trucks having an articulated frame with a central steering joint [28,29]). Other less conventional equipment was developed principally for research purposes; for example Scarlett [32] proposed a pre-fabricated steel spiral roll-over ramp with an increasing slope (from 18° to 35°), Gravalos et al. [33] developed instead a four-post weighting test bench. By imposing respectively a roll or a pitch angle [30,32,34,35], the experimenters test only the lateral or the longitudinal rollover, as prescribed also by international standards [28,29,30,36]. To be sure that slippage does not occur during lateral overturning tests on conventional inclinable platforms, the cited standards even allow the use of removable prominences of 5 cm in height or with a height equal to 10% of the nominal wheel diameter to be placed in contact with the downstream tyres at the beginning of each lateral overturning test. This situation of absence of slippage, prescribed by all standards, although not frequent in the realty, corresponds to the worst condition in which a vehicle can find itself: a lateral slippage blocked by the presence of a step, triggering the lateral overturning. The above-described test scenarios (pure lateral/pure longitudinal rollover) represent evidently only two very special conditions in which a vehicle can find itself, and any experimental test imposing a combination of the illustrated angles still miss completely [37].
For the explained reasons, following a popular engineering framework [38] properly integrated with functional analysis and decomposition principles [39,40], Bietresato and Mazzetto [41] developed, from a structural and functional point of view, a test rig that can be considered as a unique and innovative solution to fill a gap in international standards [28,29,30,36,42]. In particular, the present study focuses the attention on a subsystem of that test rig, namely the “turntable”, usable to perform the global static and quasi-static stability tests. This equipment has two degrees of freedom and it is basically constituted by an inclinable rotating platform on which placing the vehicle to be tested (see following sections for a detailed description). It can provide very in-depth knowledge of the behavior of vehicles operating on slopes, thanks to the actuators that equipped it and the measuring system for the weight supported by each quadrant [41], as illustrated later in this article. Although the test scenarios that are currently proposed by the reference standards (i.e., the lateral overturning test) and that will be proposed through this novel installation are, on the whole, relatively simple, it is appropriate to point out that they can in no way be replaced by numerical simulations carried out on digital models of the machines to be tested. Indeed, the principal aim of the proposed installation is the certification of the stability of a machine (in this case an agricultural or an operating machine), possibly aimed also at the homologation of that machine. Hence, it is necessary to experimentaly investigate the stability performance of vehicles through adequate equipment, like the one illustrated here in its functionalities, and under repeatable conditions. This is the reason why more or less complex experimental tests are carried out in many industrial sectors and on very different systems (e.g., compression test on samples of even-known building materials, car impact tests on variants of already-on-the market cars) and the agricultural machinery sector is no exception. International reference protocols in this field, such as those of the OECD, provide for a series of tests to be carried out on agricultural machinery in order to compile very detailed technical reports, called “OECD bulletins”, which certify the properties of the tested machines. In the case of the development of a vehicle, aware of the fact that physical experimentation on real-scale systems can be a rather demanding cost for companies, there is however the possibility of adopting a mixed experimental-numerical approach. On the basis of this one, an initial experimental test should in any case be carried out to use then the results of this first test to validate more or less detailed numerical models. Even with this type of approach, the need to have an installation to carry out full-scale tests is essential. A partial opening of international boards on the use of virtual analyses in the official testing of agricultural machines has appeared only recently in an international standard, precisely in the OECD code 4 about protective structures [43]. In the cited document, a virtual analysis of the protective structure under test can be “given only for information under the legal responsibility of the manufacturer applicants”, and can be included in a specific Annex. Carrying out virtual analyses does not, however, exempt the manufacturer from carrying out the usual experimental test.
The aim of this publication is therefore to illustrate the experimental possibilities offered by such an inclinable turntable (i.e., the possible outputs) by illustrating the physical laws that govern the phenomena and that allow an effective interpretation of the experimental evidence. In this regard a case-study, concerning the test of a farm tractor, is also illustrated in this article. The final intent of this study to raise the awareness of international bodies towards an extension of vehicle performance (specifically concerning the stability) that can be certified by an accredited test center possibly equipped with a similar test rig and performing the illustrated tests (in particular the quasi-static stability test; see Section 3.2).

2. Materials and Methods

2.1. The Test Rig

The concept of the test rig referred to in this article, named the “turntable”, is visible in Figure 1. It has a main structure, which can assume an inclination α with respect to the horizontal reference, and a subsystem (i.e., the properly-said rotating platform or turntable) able to rotate by an angle β around an axis of rotation perpendicular to the inclinable structure (zSP). The angle β of rotation of the turntable (or, better, the angle of rotation of the axis ySP fixed to the turntable) is measured with respect to the maximum slope direction rms that is generated by the inclination of the platform main structure (Figure 1b) and it is positive if counter-clockwise. The rotating subsystem presents four rigid quadrants on its top, rotating with the turntable, able to support the weight of a real-scale vehicle placed on it without bending (they could be considered as having an infinitely-rigid surface) and provided with four load cells, one per quadrant, so that it is possible to measure the weight sustained by each of them in every time instant and in correspondence of every angle α and β. From this point on, the two angles α and β will be referred to as “operative angles” of the test rig. The frame of reference fixed to the turntable is xSP-ySP-zSP-CoR.

2.2. The Approach

The following paragraphs illustrate the operation of this test rig, firstly highlighting the characteristics that differentiate it from other more conventional test installations (Section 3.1 and Section 3.2), and then analyzing in detail the outputs that can be generated in each of the two operating modes that will be described (Section 3.4: completely static operative mode; Section 3.5: quasi-static operative mode; see also Figure 2). Before analyzing the two operating modes, the position of the CoG projection (i.e., the point CoG′) is proven to be correlated with the stability condition of the vehicle (Section 3.3). In this way, it is demonstrated the full equivalence of a situation that can be described with the equations of the static, therefore in the physical domain of the forces, with a situation that can be instead described with geometric parameters only (i.e., the position of remarkable points, trajectories, distances), hence in the physical domain of the space. All the equations of Section 3.4 and Section 3.5 are based on this demonstration.

3. Results and Discussion

3.1. Correlation between the Operative Angles of the Rig and the Orientation Angles of a Vehicle under Test

Thanks to its two DoFs, i.e., the possibility to set the operative angles α and β, the test rig object of this study can easily impose a generic spatial orientation to the vehicle under test in terms of angles α (of the support plane) and β′ (of the vehicle longitudinal axis with the maximum slope direction; β′ = β only when the vehicle longitudinal axis is parallel with ySP) and hence of angles of roll φ, pitch ϑ and yaw ψ (Figure 3), according to the following formulas:
{ ϕ = arctan sin α tan β 1 + cos 2 α tan 2 β ϑ = arctan sin α tan 2 β + cos 2 α ψ = arctan tan β cos α
In particular, if compared to conventional test rigs, the second degree of freedom of the presented rig (i.e., the possibility of rotation for the turntable) prevents experimenters from having to carry out maneuvers to re-position the vehicle at different angles of inclination of its longitudinal axis with respect to the maximum slope direction of the support surface. This has made possible to design two classes of stability tests (global completely static tests, global quasi-static tests) that are completely new if compared with the tests proposed so far (in which the vehicle has its longitudinal axis parallel or perpendicular to the axis of inclination of the supporting plane; see Table 1).
If considering a perfect alignment of the vehicle frame of reference with the turntable frame of reference (in particular when the vehicle longitudinal axis is parallel to ySP), the angles of roll (φ), pitch (ϑ) and yaw (ψ) of the vehicle under test can be obtained directly from the operative angles α and β imposed to the test rig in the experimental setup, using the above-presented formulas of Equation (1) with β where β′.

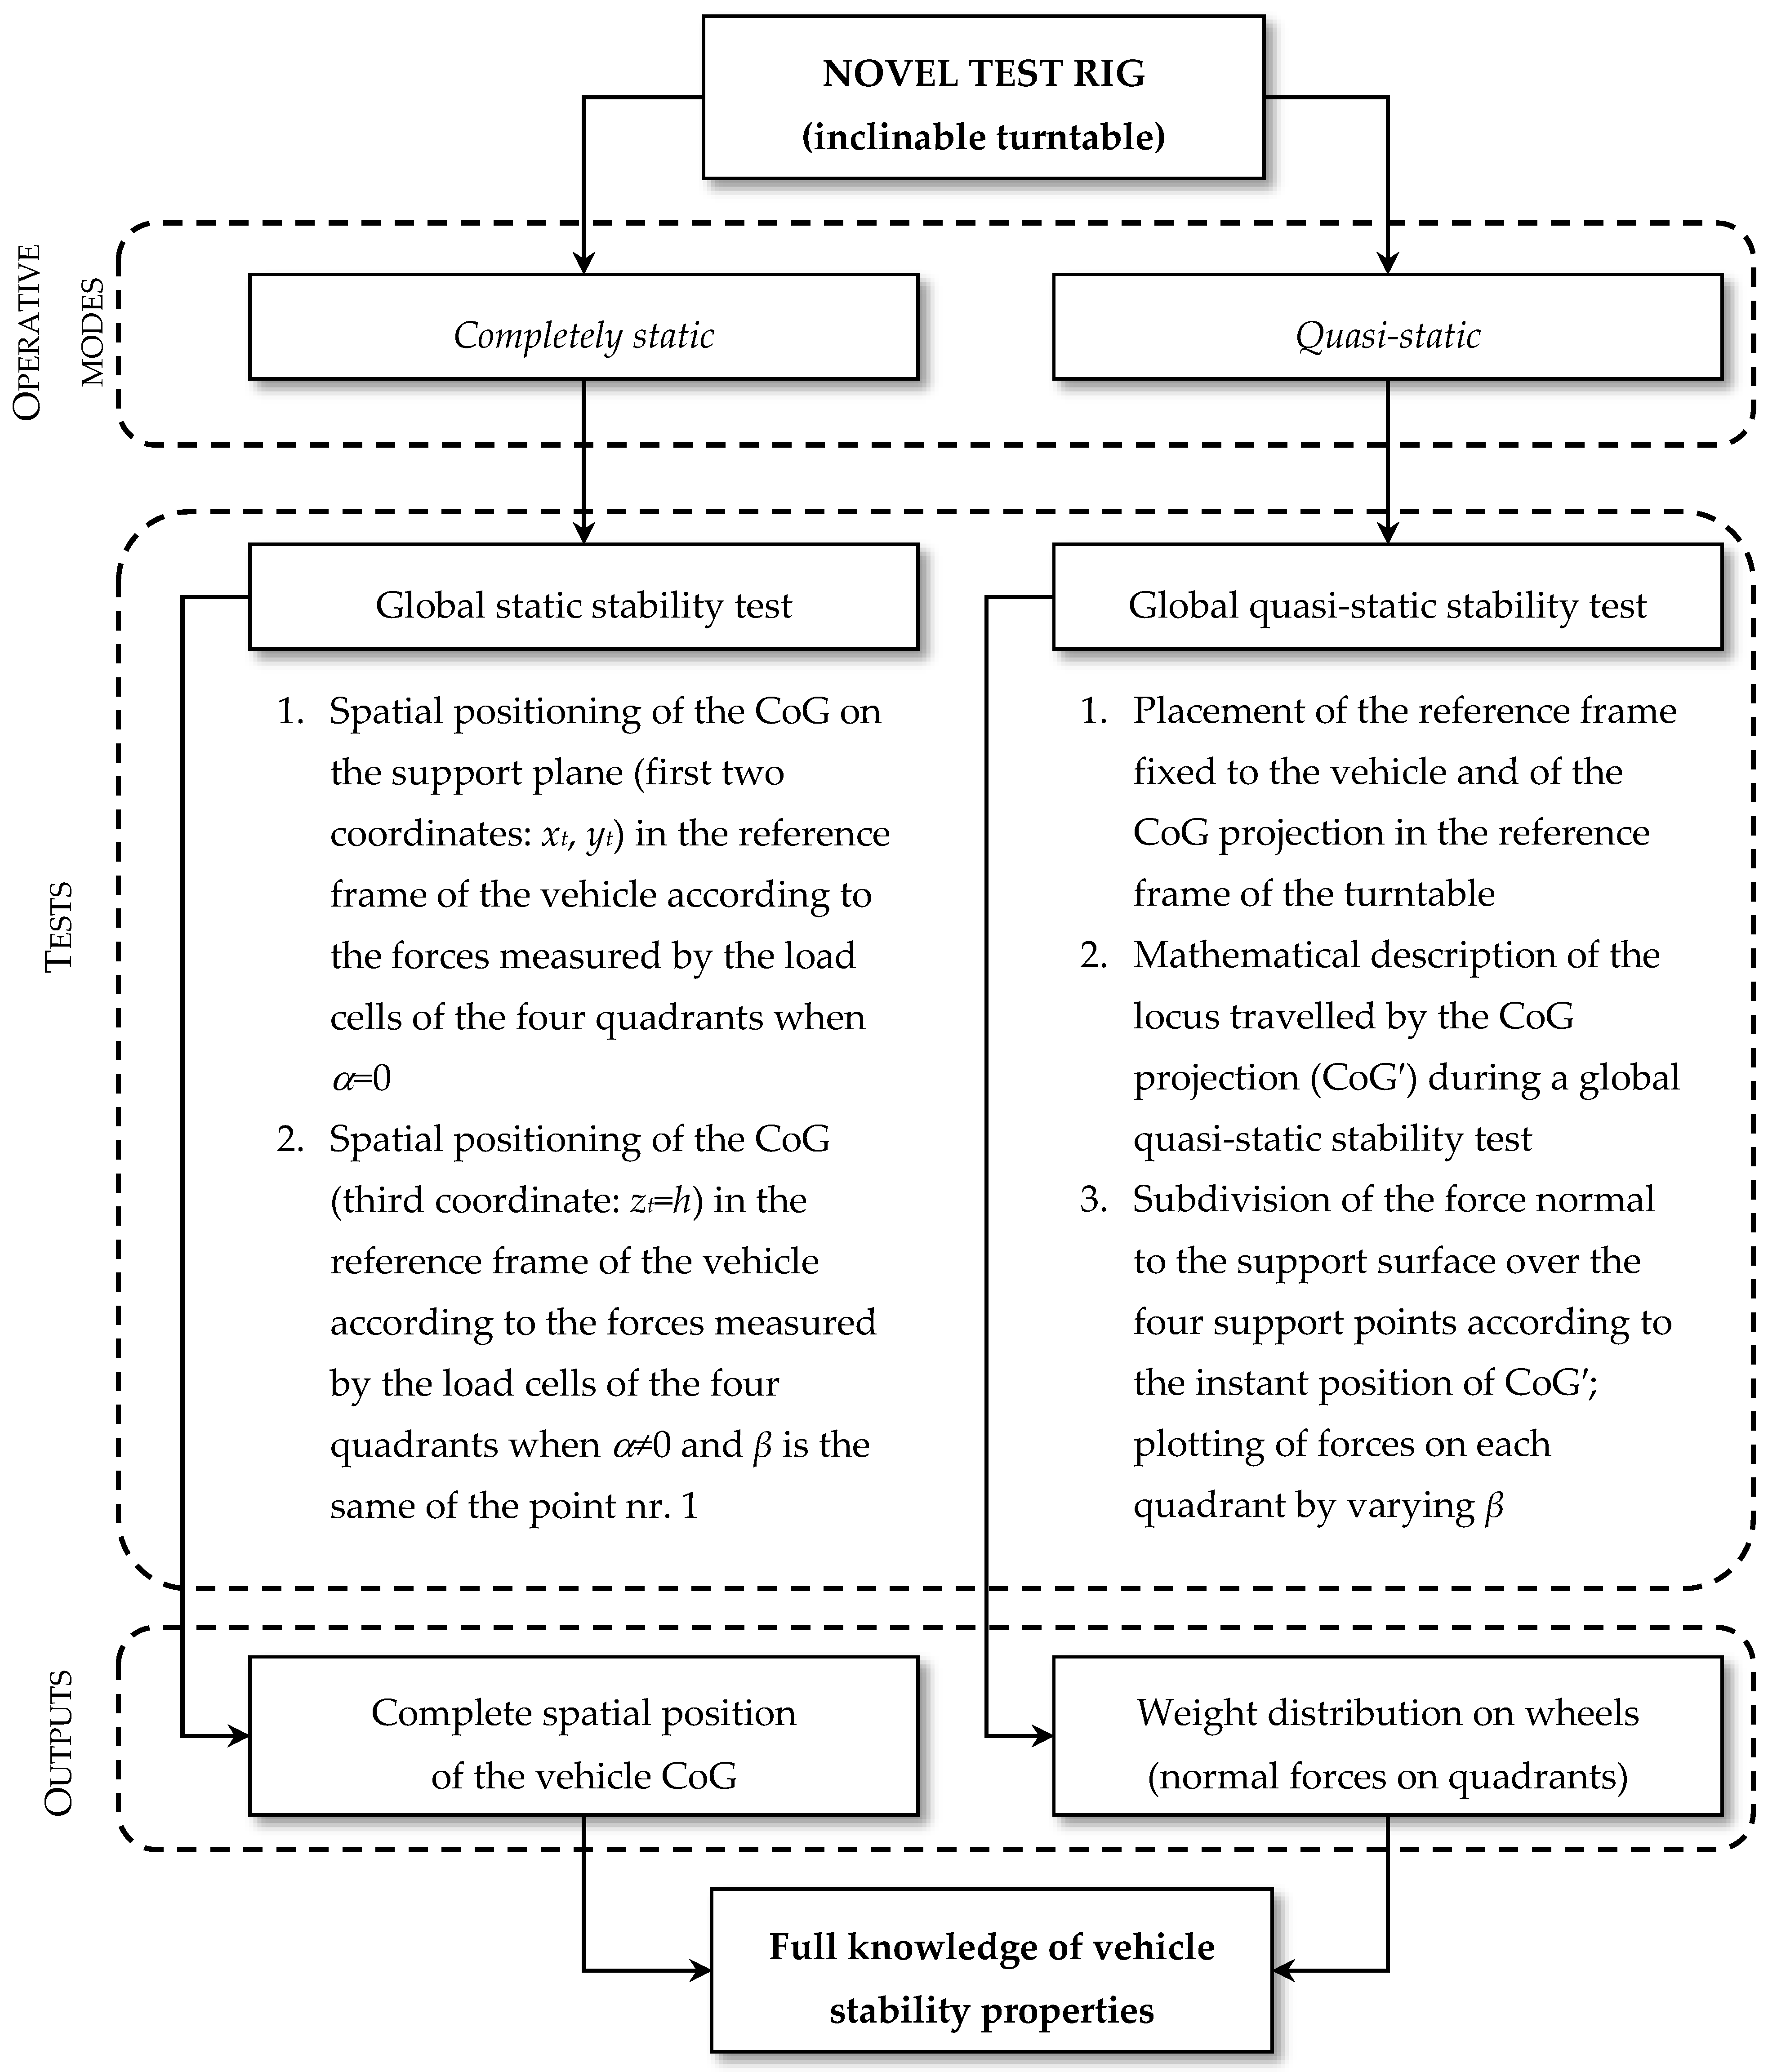
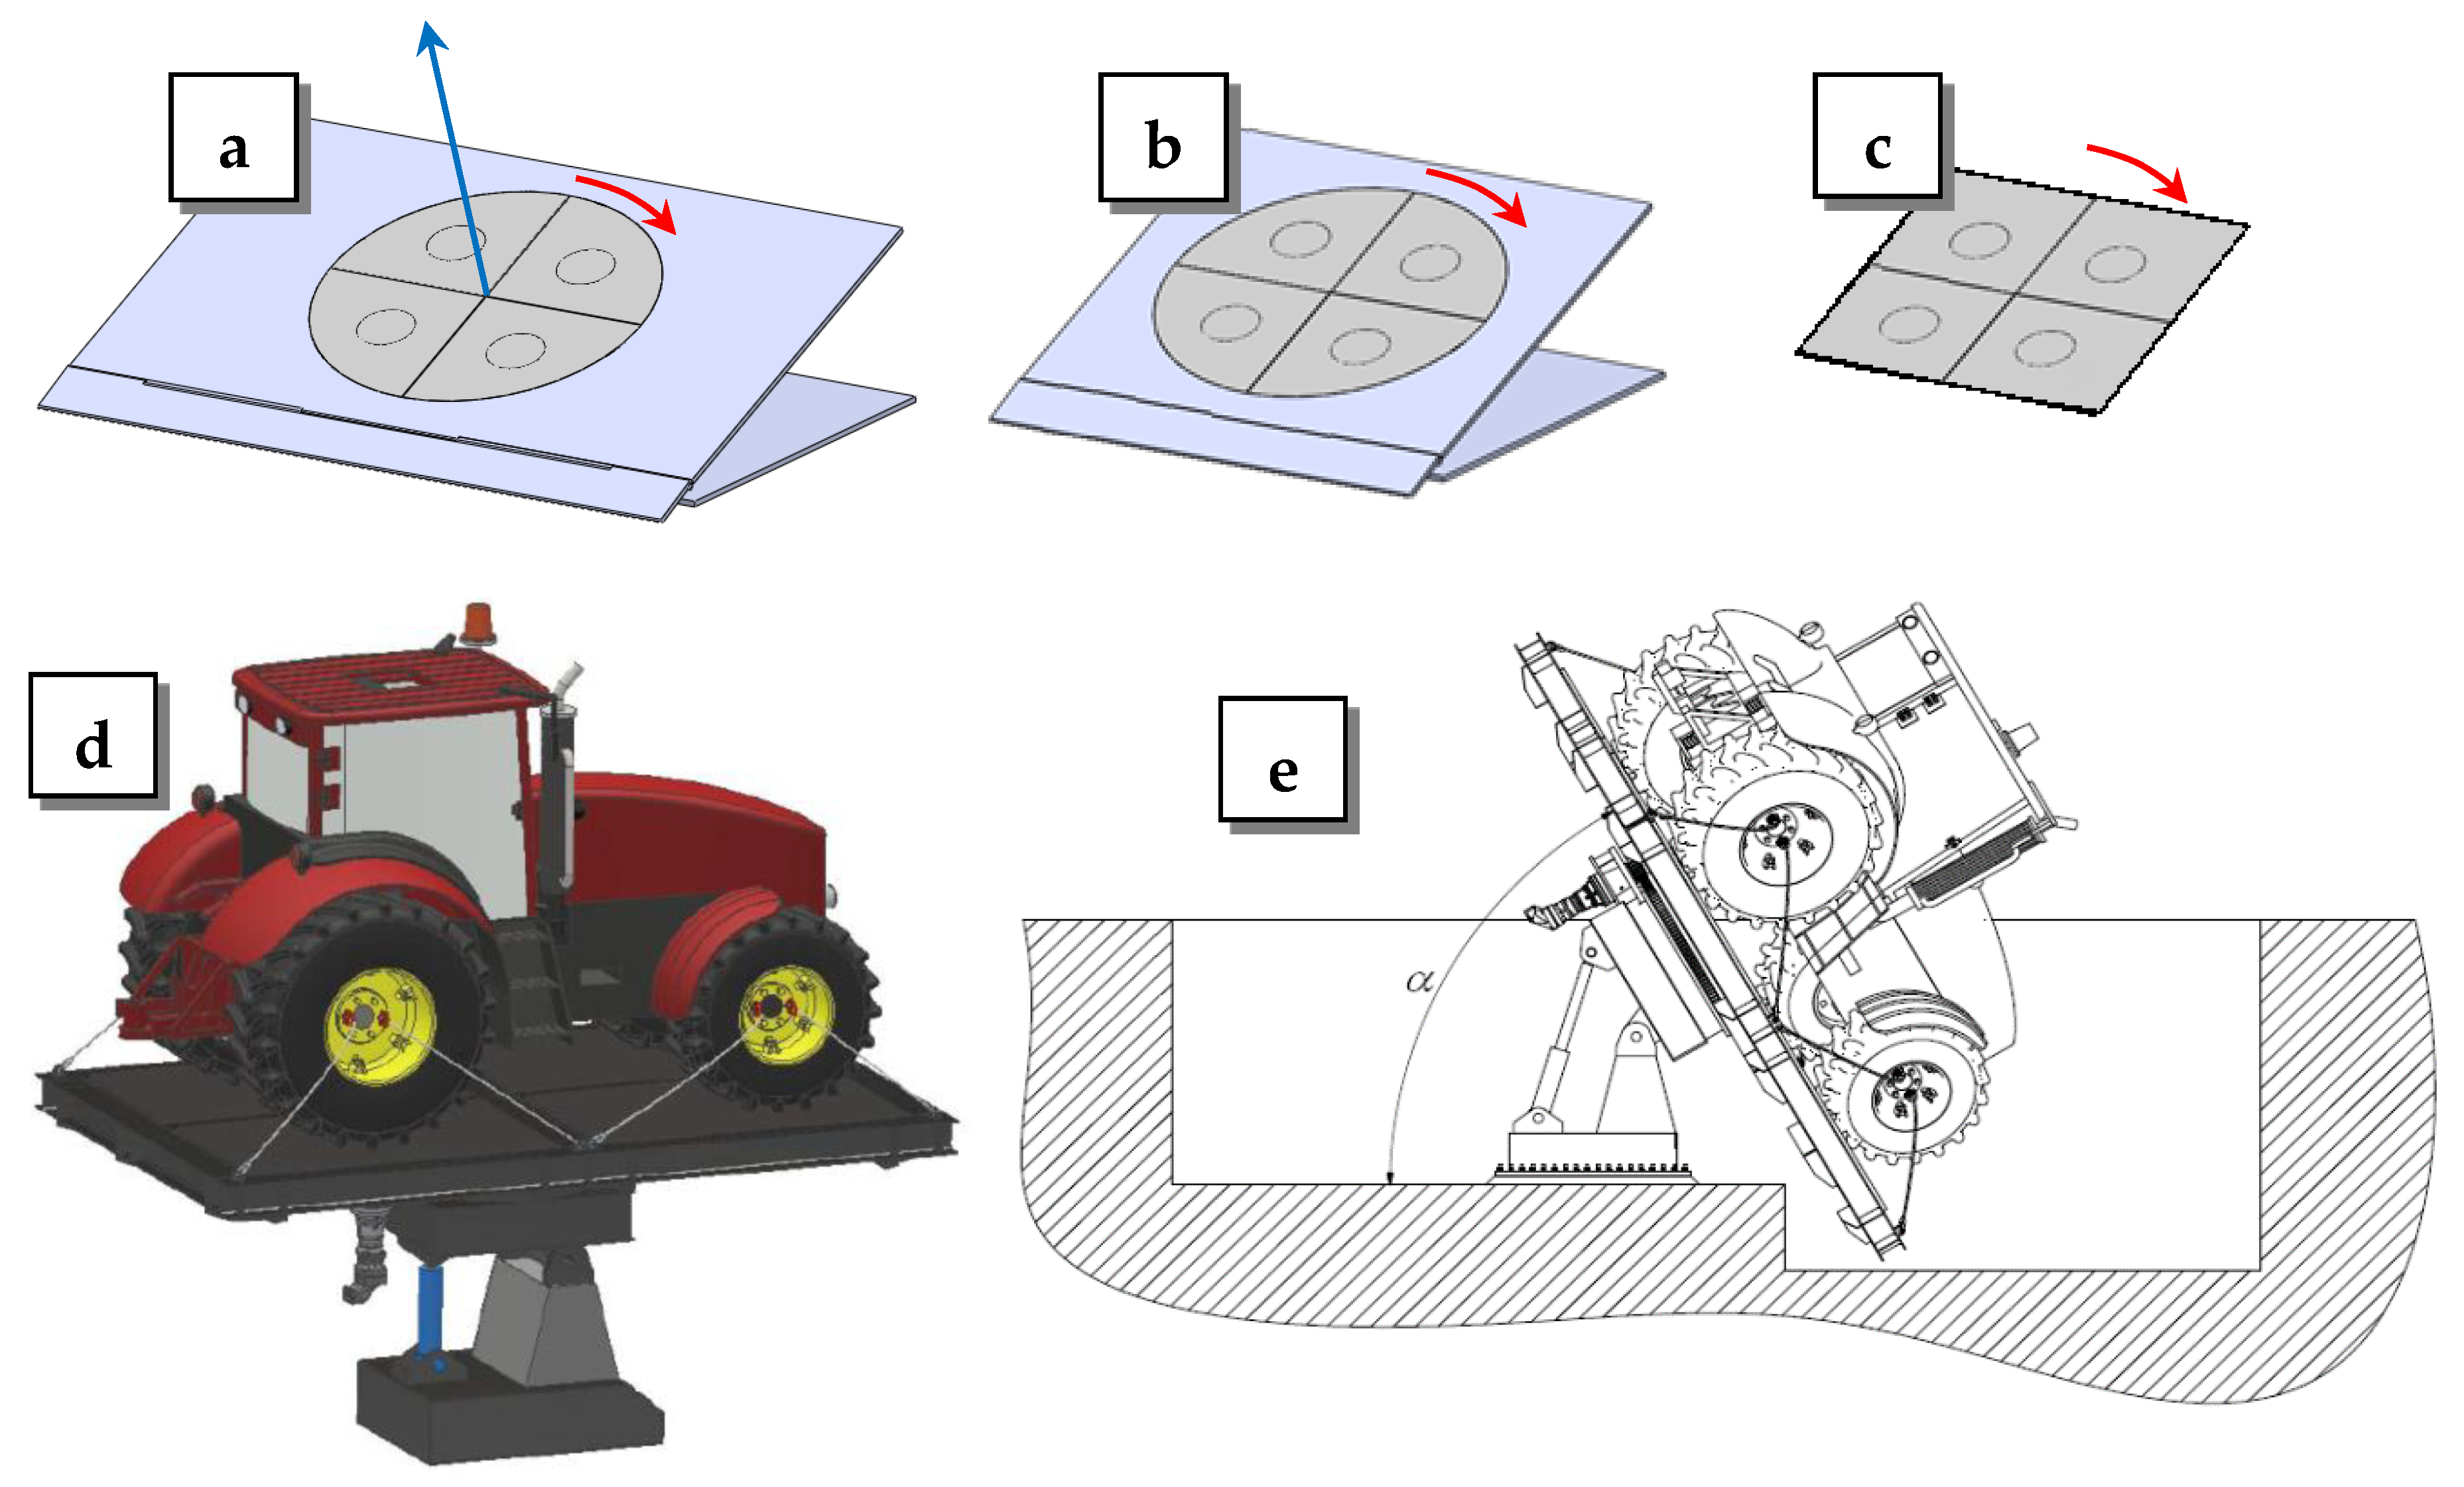
3.2. Possible Operative Modes of the Test Rig

The rotating platform (also called “turntable”) can be used in two operating modes:
  • completely static mode (i.e., no revolution of the turntable around its axis of rotation) to have a global static stability test; (phase 1) the vehicle is placed on the platform when the support structure is horizontal (α = 0°) and the sides of the quadrant are aligned with the inclination hinge (β = 0° or β = ±90° or β = ±180°), thanks to the measurement of the weights supported by each quadrant, it is possible to place the center of gravity in relation to the center of the platform; (phase 2) subsequently, without moving the vehicle (its wheels are fixed to the quadrants), the support structure is tilted at a fixed angle (however far from the vehicle rollover); by doing so it is therefore possible to identify the height of the CoG of the machines under test; (phase 3) the support structure is tilted until the (lateral, frontal) overturning angle is reached;
  • quasi-static mode (i.e., very slow rotation of the turntable and of the vehicle on it) to have a global quasi-static stability test; (phase 1) when the support structure is horizontal, the vehicle is positioned on the platform and the vehicle wheels are fixed to the quadrants; (phase 2) the support structure is tilted at different angles with respect to the horizontal plane and, at each fixed inclinations, the rotating subsystem is then activated thus making the vehicle revolute around the turntable rotation axis (the rotation speed should be around 0.026 rad·s−1 as declared in [41], i.e., a full rotation is completed in about 4 min); in the meantime, the weights supported by each quadrant (hence, supported by each wheel of the vehicle) are measured, thus characterizing the balance of the vehicle at different angles of roll, pitch and yaw (see next paragraphs); (phase 3) the procedure described in the previous phase is repeated till reaching an overturning condition. It is worth noting that the slowness of movement should make it possible to avoid (or, at least, mitigate) the vibrations that unfortunately occur in structures in which there are rotating organs [44], that can be a serious disturbance when measurements are made. However, another possibility to consider after first real-scale tests is eventually transforming the continuous movement into an intermittent one. This would allow exploring the stability of vehicles at a limited number of angles, equally-spaced by a fixed angle (e.g., 10° or 20°) until the turntable performs a complete rotation with a low number of stop-and-go not to lengthen a test too much. Then, it will be possible to thicken the measurements close to the angle of rotation where the stability conditions will be more critical.
In each of the two described modes (completely static, quasi-static), a condition of incipient overturning for the vehicle corresponds to a condition of null sustained force on at least one support of the vehicle i.e., on one wheel [4] or, in this case, on a quadrant. If the chassis and each element involved in supporting the weight of the vehicle (e.g., tires, suspensions) are considered to have an infinite stiffness, the above-enunciated condition regards two supports (or quadrants). In a real situation, considering the elasticity of all the elements of the vehicle involved in supporting its weight, at least only the tires, a critical condition for the stability is considered to be already reached when one of the quadrants registers a null sustained force.

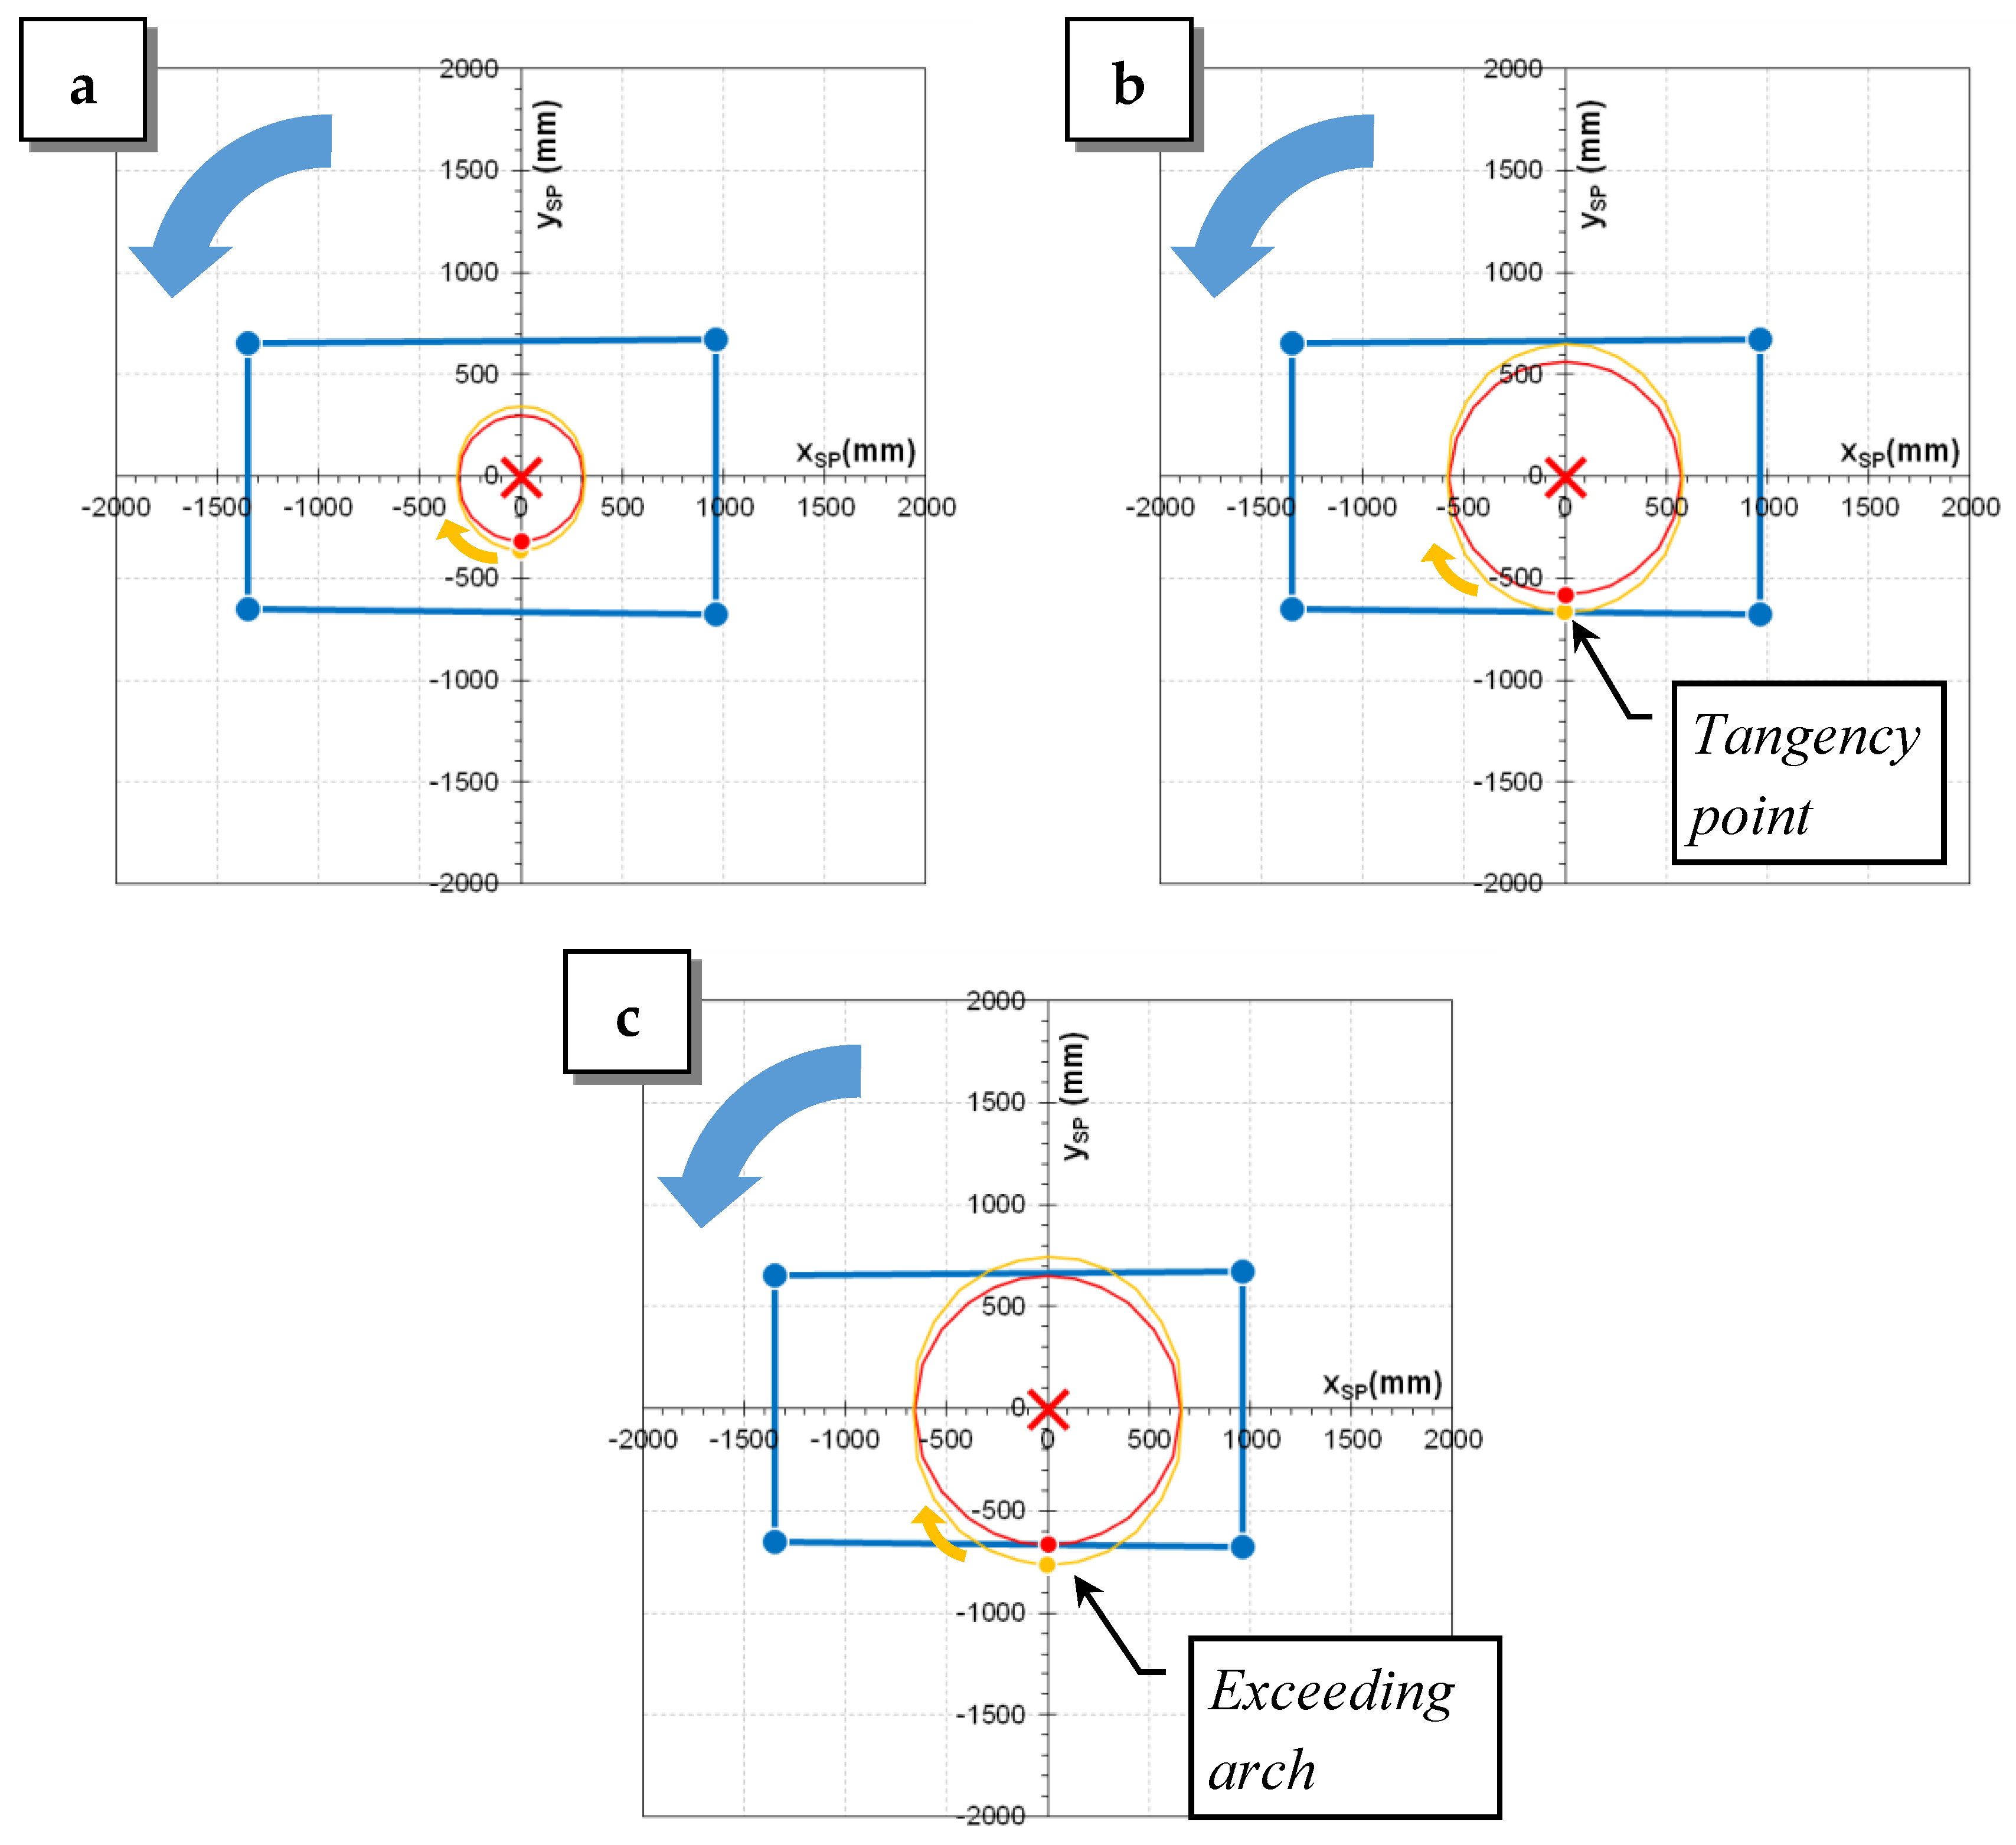
3.3. Possibility of Using the Position of the CoG Projection to Express the Incipient Roll-over Condition

In the situation described in Figure 4, a tractor is placed motionless on an inclined slope with the longitudinal axis perpendicular to the maximum slope direction (i.e., β′ = 90°); the following hypotheses are valid for this explanation:
  • the front and rear tracks have the same width, hence L and R (i.e., the centers of the left/right tires) are limit points for the rollover also in the transversal plane containing the CoG;
  • the tractor CoG is exactly in the median longitudinal plane of the vehicle (hence: L H ¯ = H R ¯ ).
The same figure shows also the weight force and the boundary reactions that occur in correspondence to the tractor points of supports on the ground (i.e., the centers of the tires).
By imposing the equilibrium of the system (the vehicle) on the vertical translation and on the rotation around a point (in this case, the point L), i.e., the first and second condition for the static equilibrium of rigid bodies, the following expressions are obtained for the modules of the binding reactions (and of their components perpendicular to the support plane) in the points L and R:
{ R R = P 2 ( 1 h tan α ) R L = P 2 ( 1 + h tan α ) { R R = R R cos α = P 2 ( cos α h sin α ) R L = R L cos α = P 2 ( cos α + h sin α )
The ratio between these two components of the binding reactions perpendicular to the support plane at the points L and R is:
r B R = R R R L = R R cos α R L cos α = R R R L = h tan α + h tan α
In the same situation it is possible to calculate the distance of CoG′ from L and R, and their ratio:
{ C o G L ¯ = h tan α C o G R ¯ = 2 C o G L ¯ = + h tan α r d i s t = C o G L ¯ C o G R ¯ = h sin α + h sin α
As it is possible to observe from the previous equations, we have that r B R = r d i s t and therefore, starting from the position of the CoG projection on the support plane, it is possible to calculate both the modules of the binding reactions R R and R L , and the modules of their components perpendicular to the support plane R R and R L . This means that it is, therefore, possible to use the distances of the CoG projection on the support plane to express the condition of stability or incipient overturning for the vehicle (geometric interpretation of the rollover stability condition). Indeed, with reference to the figure above, the condition of incipient rollover in the described configuration is the same either by using the condition on the forces or by using the condition on the distances, and allows the calculation of the limit angle:
R R = 0 P 2 ( cos α h sin α ) = 0 C o G L ¯ = 0 h tan α = 0 } α lim = arctan h
If the CoG is not exactly in the median plane of the vehicle L H ¯ H R ¯ but, rather, it is shifted by a distance Δ , for example to the left of Figure 4 (i.e., downstream of the slope, thus having L H ¯ < H R ¯ ), what expressed above ( r B R = r d i s t ) is still valid; the new formulas are:
{ R R = P 2 ( Δ h tan α ) R L = P 2 ( + Δ + h tan α ) { R R = R R cos α = P 2 ( Δ cos α h sin α ) R L = R L cos α = P 2 ( + Δ cos α + h sin α ) r B R = R R R L = R R cos α R L cos α = R R R L = Δ h tan α + Δ + h tan α
{ C o G L ¯ = Δ h tan α C o G R ¯ = 2 C o G L ¯ = + Δ + h tan α r d i s t = C o G L ¯ C o G R ¯ = Δ h sin α + Δ + h sin α
The limit angles are different depending on the considered side (L, R) of possible overturning:
{ α lim , L = arctan Δ h α lim , R = arctan + Δ h   with   α lim , L < α lim , R
If the front and rear tracks of a vehicle are different, all the presented equations are still valid if considering 2 as the vehicle width in correspondence of the CoG′ (Figure 5):
2 = L R ¯ = F T + ( R T F T ) W B a W B = R T ( R T F T ) a W B

3.4. Completely Static Operative Mode of the Test Rig

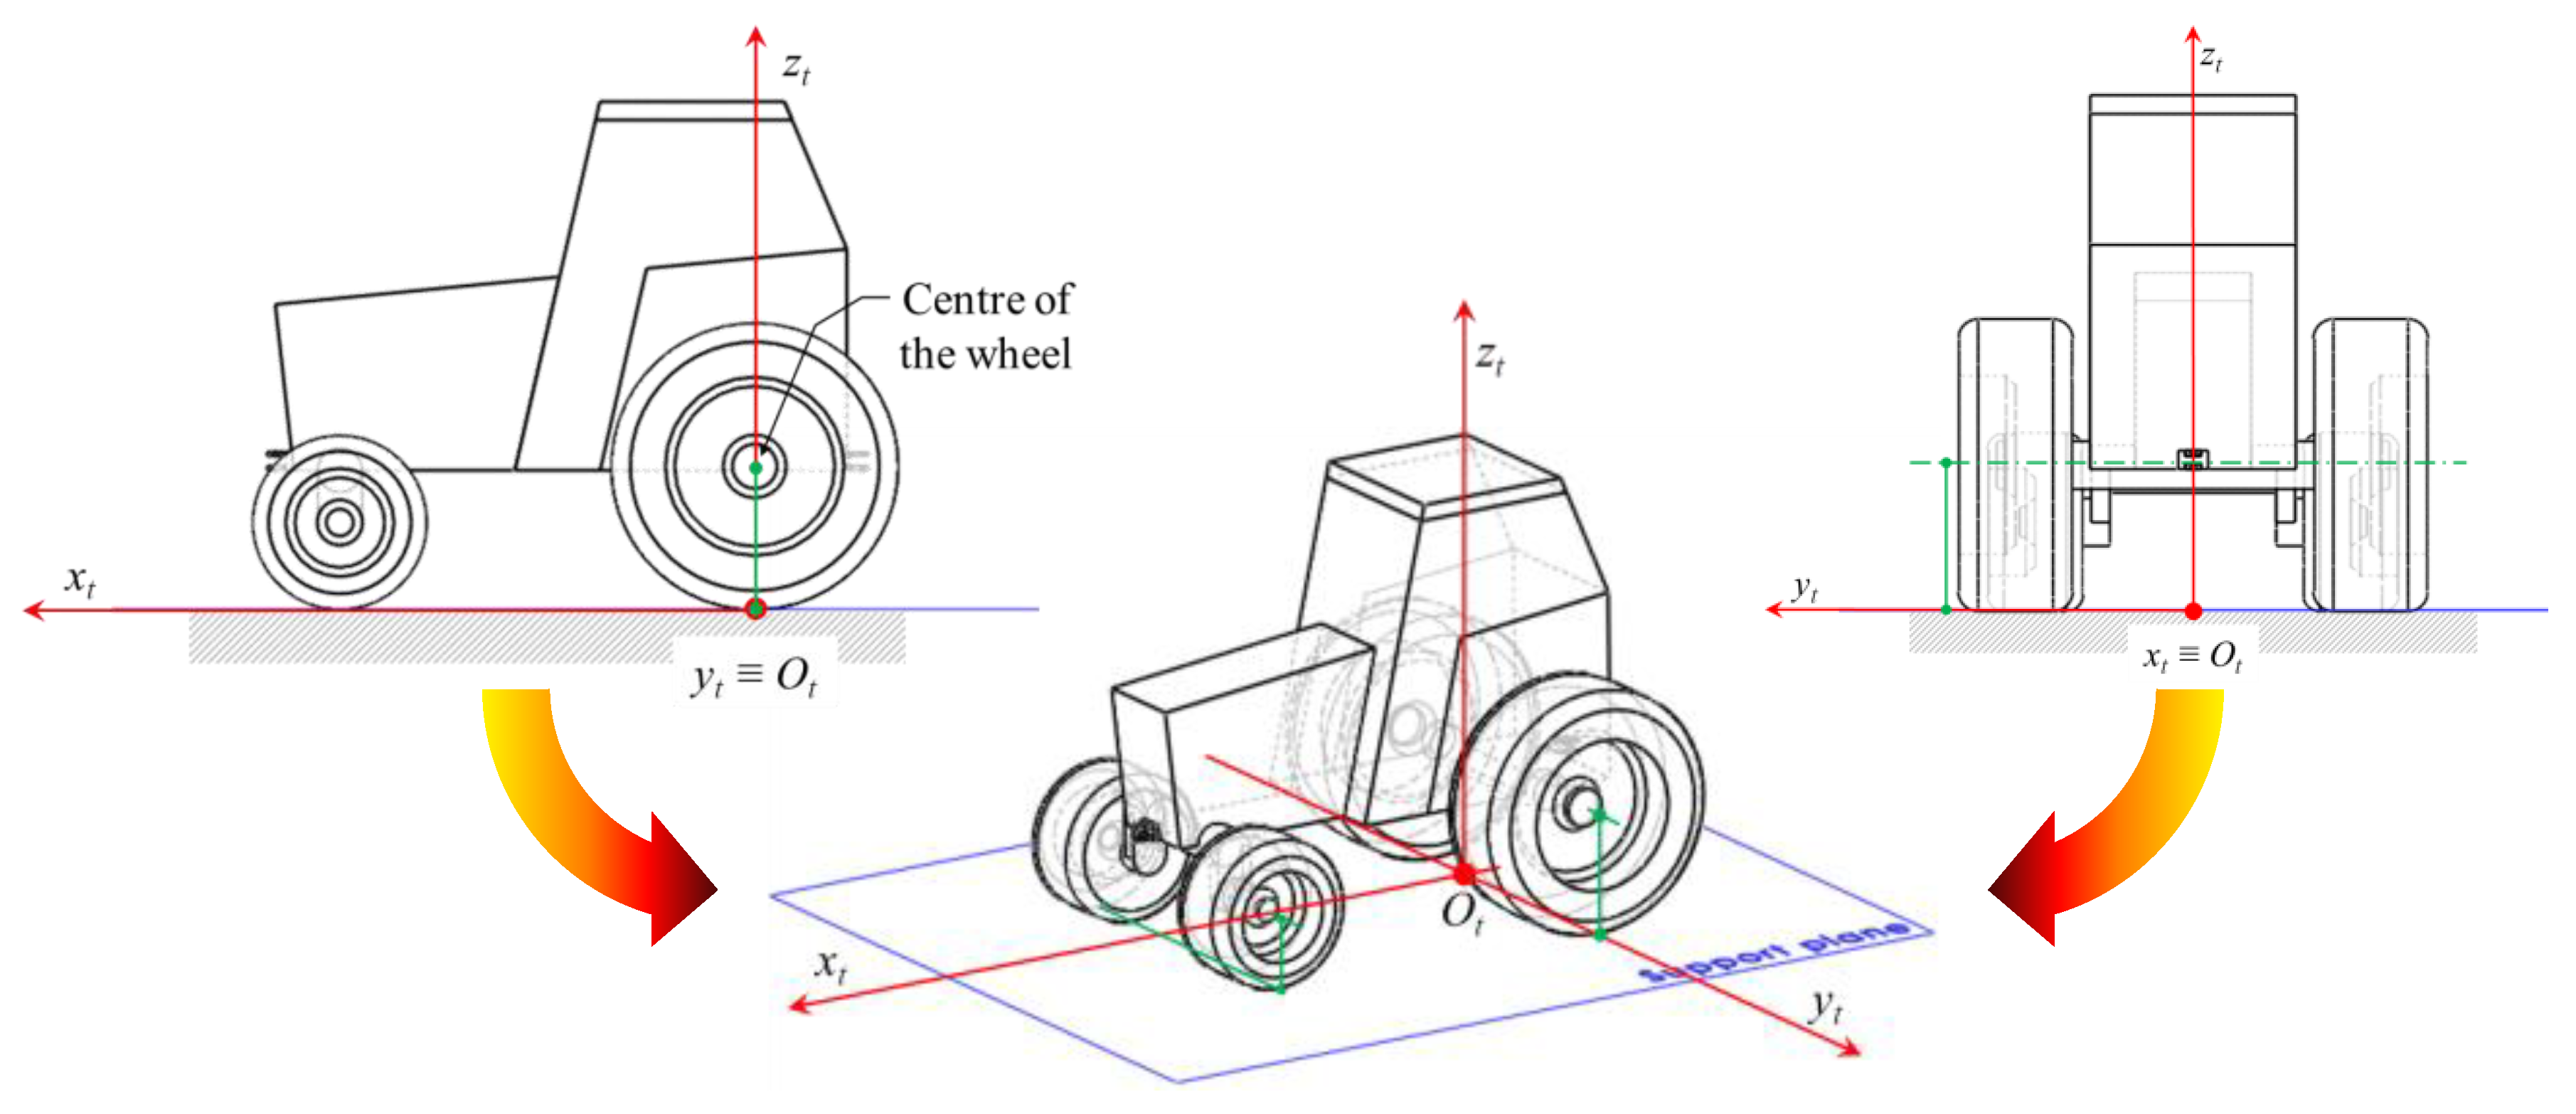
3.4.1. Setting of a Frame of Reference Fixed to the Vehicle

The vehicle frame of reference xt-yt-zt-Ot can be assumed oriented as follows (Figure 6):
  • xt axis: aligned with the tractor median axis, contained in the tractor support plane;
  • yt axle: aligned with the rear axle of the tractor, passing through the center of the rear tyre traces and, hence, contained in the tractor support plane; the point of the passage of the yt axle can be identified by taking the center of the rear wheel hub as reference (see Figure 6);
  • zt axis: perpendicular to the other two axles, and therefore also perpendicular to the support plane of the tractor;
  • Origin Ot: positioned at the center of the tractor rear axle, contained in the support plane of the tractor.

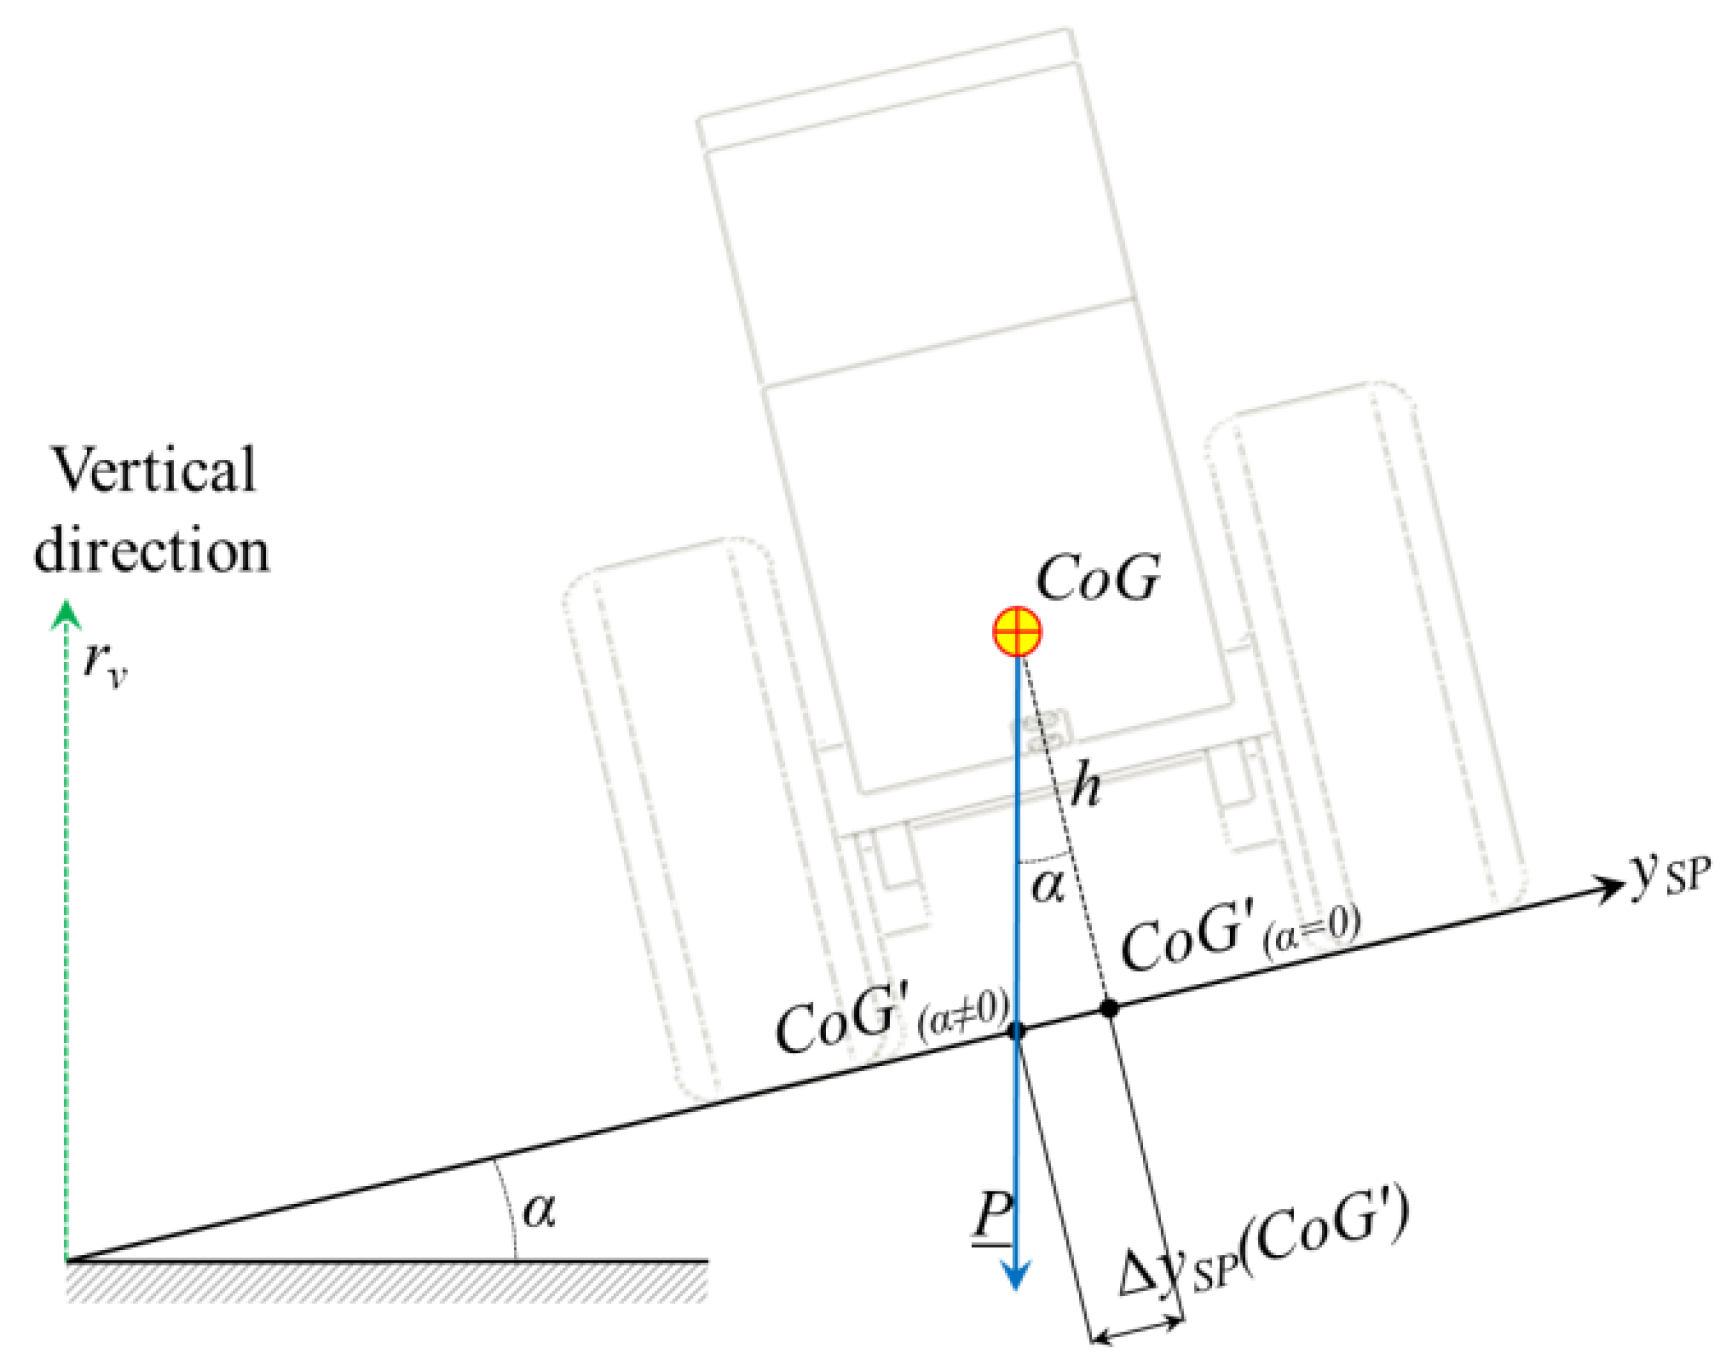
3.4.2. Positioning of the CoG Projection in the Support Plane Frame of Reference According to the Forces Measured by the Load Cells of the Four Quadrants

It is important to note that the four-quadrant system is not able to give directly the absolute position of the CoG in the frame of reference of the turntable: it gives the relative position of the CoG in the reference frame of the tractor under test. Indeed, the quadrants are large enough to tolerate angular and axial misalignments in tractor positioning and, considering the large variety of the dimensions of tractors, there is no way (i.e., no technical feature) to force the tractor reference system to be perfectly aligned with the platform reference system (Figure 7). If the experimenters have the care to place a single wheel of the vehicle to be tested on each quadrant, at a fixed α, the weights supported by each quadrant do not vary whatever the misalignment of the vehicle.
Each quadrant (numbered from 1 to 4 counter-clockwise in the same way as the quadrants of the Cartesian plane; see Figure 8a) is supported by a load cell that measures only the component (W1, … W4) of the binding reaction perpendicular to the support plane, whatever the angle of inclination of it. The load cells are placed symmetrically with respect to the lines of subdivision of the support plane into quadrants (coinciding with the xSP and ySP axes of the reference frame fixed to the support platform).
For the situation represented in Figure 8c, it follows (NB: Wtot = P only if α = 0):
{ W F R = W 1 W F L = W 2 W R R = W 4 W R L = W 3 W t o t = i = 1   to   4 W i = m g cos α = P cos α
Given the main characteristic dimensions of the vehicle (the wheelbase WB, the front track width FT, the rear track width RT; see Figure 8b), the CoG′ position on the support plane in the vehicle reference frame is given by the following equations (a > 0 if CoG′ is on the positive half-plane of xt, i.e., always, b > 0 if CoG′ is on the positive half-plane of yt; see Figure 8b):
( C o G ) t { a = W B ( W F R + W F L ) W t o t b = F T ( W F L W F R ) + R T ( W R L W R R ) 2 W t o t
Therefore to have the absolute positioning of the CoG′ a further step is required: the identification of the position of the origin and the orientation of the vehicle reference frame.

3.4.3. Calculation of the CoG Height

To calculate the CoG height, the support platform has to be inclined of a known angle α without rotating the turntable (i.e., for the same values of β or β′), thus causing a rearrangement of the weights supported by each quadrant and a reposition of CoG′ on the support plane with reference to the vehicle reference frame (calculated using the same formula of Equation (12) used to position the CoG′ on the support plane when it is horizontal). By quantifying the shift of CoG′ downstream the inclined support plane, i.e., ΔySP(CoG′), it is possible to quantify the CoG height h (i.e., the distance of CoG from the support plane; Figure 9):
h = Δ y S P ( C o G ) tan α

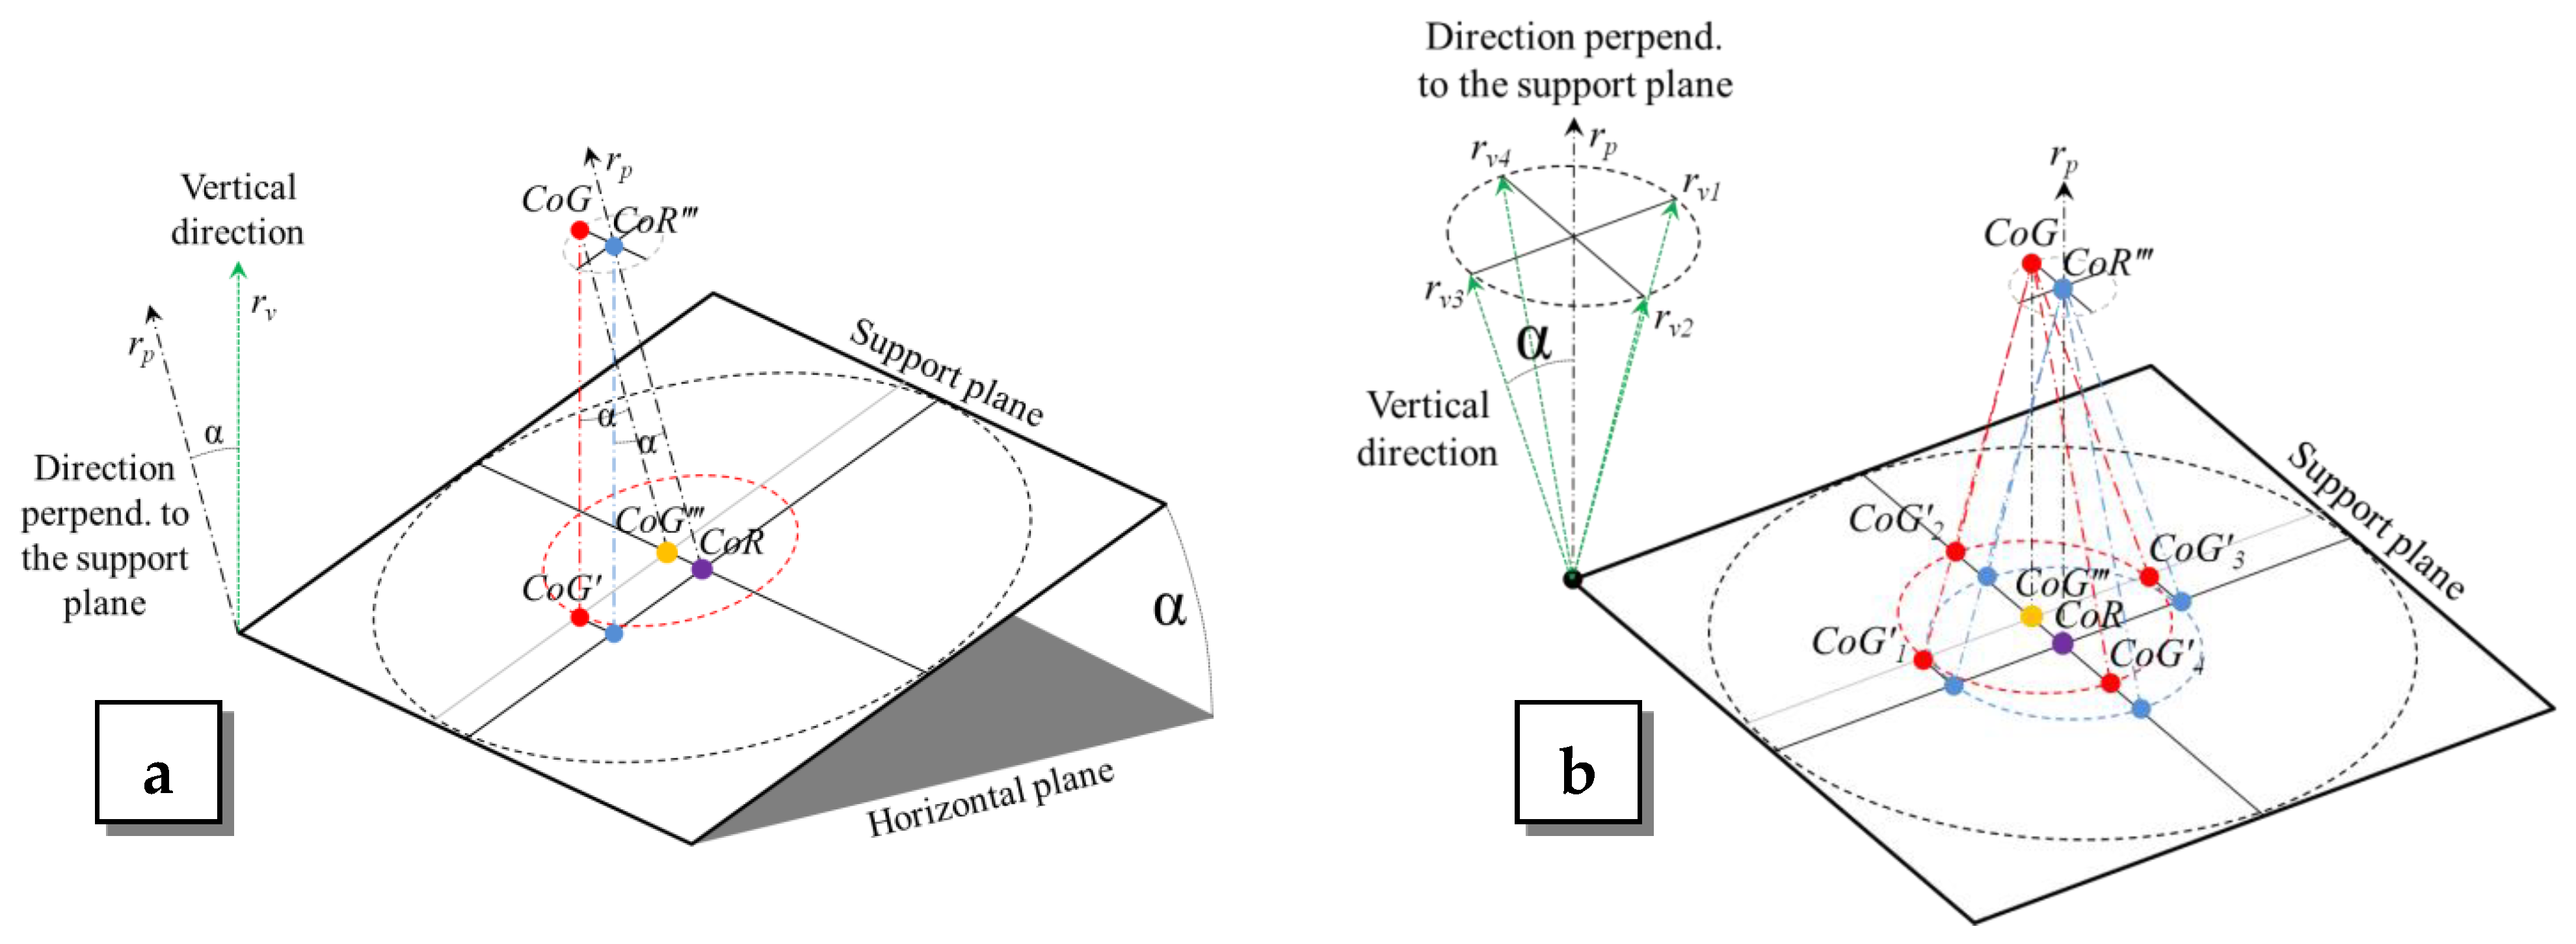
3.5. Quasi-Static Operative Mode of the Test Rig

3.5.1. Expressing the Coordinates of CoG′ in the Support Plane Frame of Reference

Any consideration regarding this mode of operation of the test system implies the knowledge of the position of the CoG in the reference system fixed to the turntable, i.e., xSP-ySP-zSP-CoR.
If (xSP(Ot); ySP(Ot); 0) are the coordinates of Ot (origin of the vehicle frame of reference xt-yt-zt-Ot) in the coordinate system of the support plane, and δ is the angle (positive if counter-clockwise) between the abscissa/ordinate axis of the coordinate system of the support plane (axis xSP or ySP) and the abscissa/ordinate axis of the coordinate system of the vehicle (axis xt or yt see Figure 10), it is possible to locate the CoG in the support plane frame of reference by using the following system of equation (in matrix form):
{ x S P ( C o G ) y S P ( C o G ) z S P ( C o G ) } = [ cos δ sin δ 0 sin δ cos δ 0 0 0 1 ] { x t ( C o G ) y t ( C o G ) z t ( C o G ) } { x S P ( O t ) y S P ( O t ) 0 } = = [ cos δ sin δ 0 sin δ cos δ 0 0 0 1 ] { a b h } { x S P ( O t ) y S P ( O t ) 0 }

3.5.2. Locus Described by the CoG Projection during a Global Quasi-Static Stability Test

During a test carried out in the quasi-static operative mode of the test rig, thanks to the slowness of the movements made by the actuators, the vehicle in the test undergoes a series of equilibrium states having different values of the angle of rotation and the same angle of inclination. The position of the CoG projection of the vehicle under test on the support plane (i.e., the point CoG′) is determined by the geometry of the vehicle system and of the test system, and in particular by the initial position of the CoG on the support plane (distance from the axis of rotation), by its height on the support plane and by the angles that determine the position of the rotating platform (inclination and rotation); see Figure 11a. When the support platform rotates completely around its axis rp, looking at the support plane only, there is a complete rotation of CoG′ around CoG″, i.e., the projection of CoG on the support surface when this is horizontal. The radius of the trajectory followed by the CoG′ is given by the inclination α of the plane and by the height h of the CoG from the supporting plane; the shift of the center of the trajectory covered by CoG′ is equal to the distance of the CoG from the rotation axis of the platform (the center of the circumference describing the trajectory is given by the coordinates of the projection CoG″ of CoG when the support plane is not inclined, i.e., when α = 0). This scenario can be understood better thanks to the principle of the relative motion: in the frame of reference fixed to the turntable, the projecting beams virtually describe the lateral surface of two equal cones, respectively having CoR″ and CoG as vertices (Figure 11b).
The equation in the implicit form of the circumference described by CoG′ on the support plane (generic coordinates: xSP, ySP) is, therefore:
[ x S P ( C o G ) x S P ( C o G ) ] 2 + [ y S P ( C o G ) y S P ( C o G ) ] 2 = R 2 [ x S P ( C o G ) x S P ( C o G ) ] 2 + [ y S P ( C o G ) y S P ( C o G ) ] 2 = ( h tan α ) 2 { x S P ( C o G ) [ x S P ( C o G ) h tan α ; x S P ( C o G ) + h tan α ] y S P ( C o G ) = y S P ( C o G ) ± ( h tan α ) 2 [ x S P ( C o G ) x S P ( C o G ) ] 2

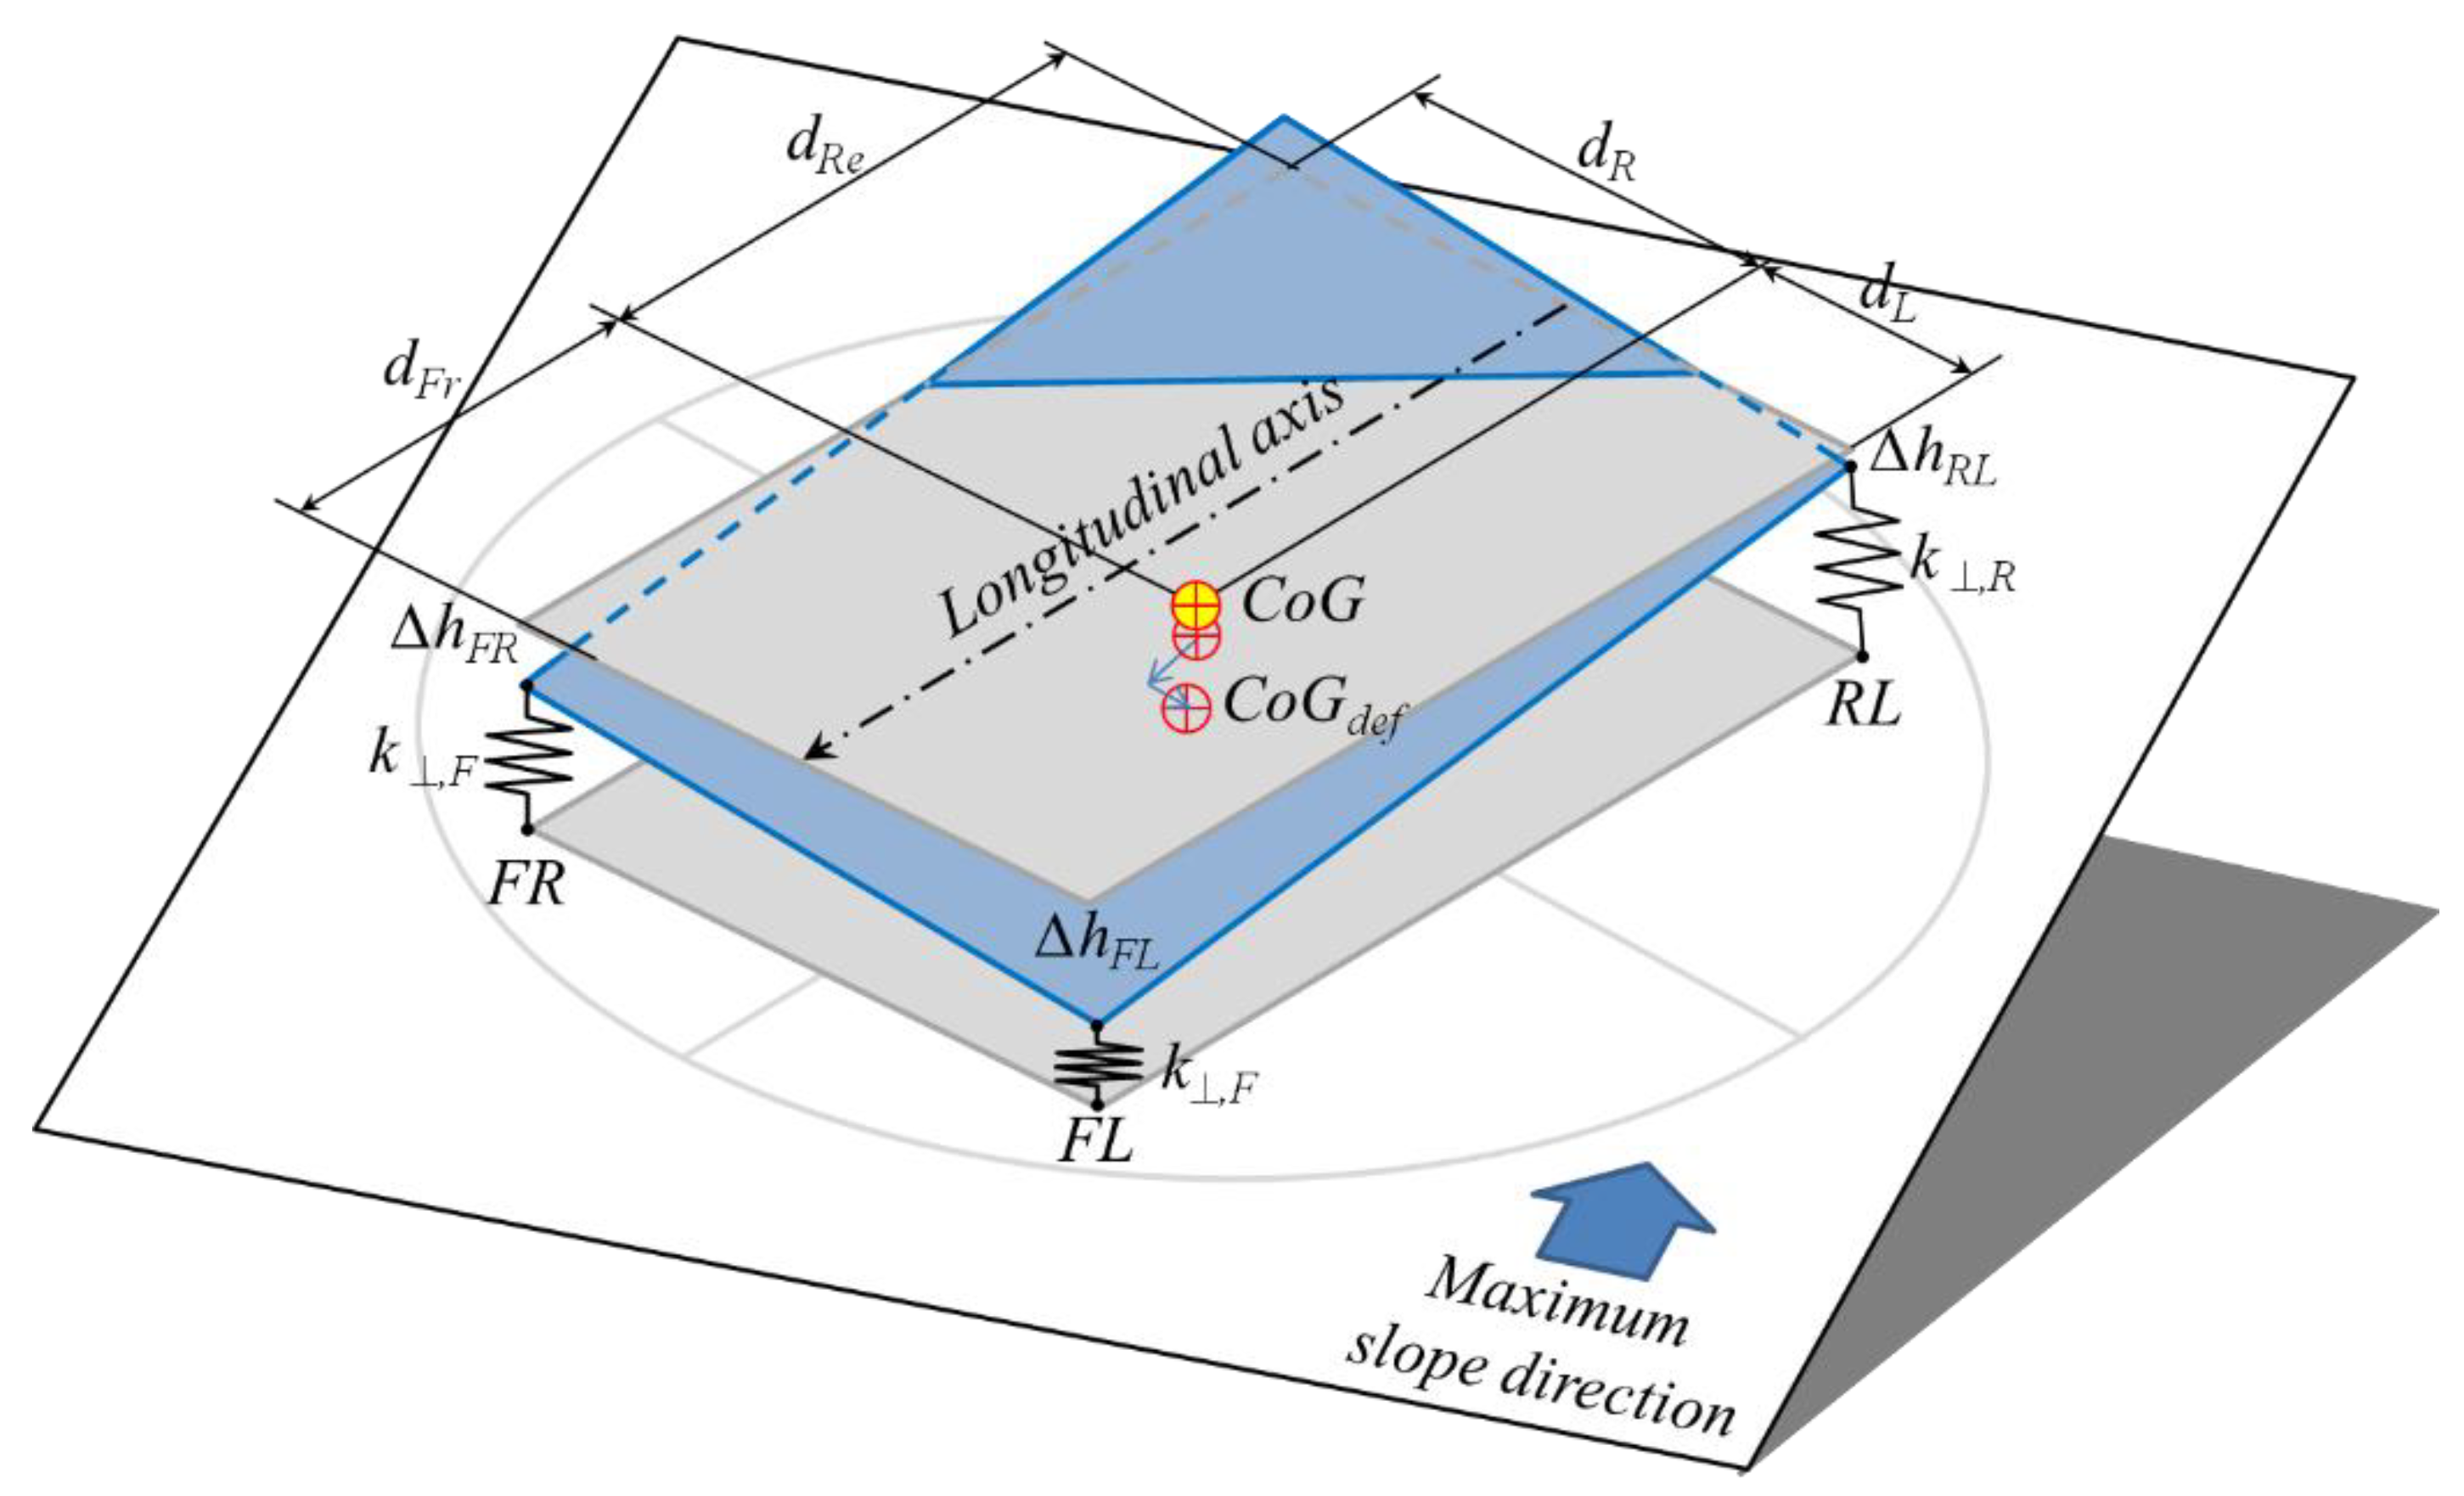
3.5.3. Subdivision of the Force Normal to the Support Surface over the Four Support Points According to the Position of the CoG Projection (CoG′)

Given the instantaneous position of the projection of the vehicle CoG on the support plane (point CoG′, belonging to the above-described locus), it is possible to calculate the instantaneous distribution of the vehicle weight on its wheels (i.e., on the quadrants) and, hence, to predict the trends varying the rotation angle β (or β′), using the inverse formulas of those previously presented for the completely static case (Equation (12)).
In particular, said dL, dR respectively the distances of the CoG′ from the two sides of the support polygon in correspondence of the CoG′, dFr, dRe respectively the distances of the CoG′ from the front and the rear axles of the tractor, dFL, dFR, dRL, dRR respectively the distances of the line passing through CoG′ from the front/rear left/right wheels of the tractor (Figure 12), it is possible to calculate the weights on the front and rear axles (WF, WR) and the weights on every single wheel of the vehicle (WFL, WFR, WRL, WRR) using the following formulas:
{ W t o t = P cos α d L = F L ¯ 2 + y S P ( C o G ) d R = F L ¯ 2 y S P ( C o G ) { W F = W t o t d R e W B W R = W t o t d F r W B d F L = F T d F R d F R = F T d R F L ¯ d R L = R T d R R d R R = R T d R F L ¯ { W F R = W F d F L F T W F L = W F d F R F T W R R = W R d R L R T W R L = W R d R R R T { W F R = P cos α d R e W B d F L F T W F L = P cos α d R e W B d F R F T W R R = P cos α d F r W B d R L R T W R L = P cos α d F r W B d R R R T

3.6. Effect of the Tyres Deformation on the Vehicle Stability

The above-presented equations have general validity, since they relate the instantaneous spatial position of the CoG of a vehicle under test with the possible gatherings of the presented equipment (i.e., the weights supported by each quadrant). In a real case, the CoG position is the result of both the spatial distribution of the vehicle masses and the consequent possible deflection of the elastic elements involved in supporting the vehicle itself (e.g., shock absorbers, tyres). Indeed, the deflection of these elastic elements can cause a translation downstream of the CoG and/or an additional pitch and roll angle, greater than the corresponding angles imposed by the inclination of the support surface, having again the effect of moving downstream the CoG. The above-exposed mathematical model, useful for the prediction of the weight loaded on each support, can, therefore, be further completed to take into account the presence of any elastic elements by iteratively correcting the spatial position of the CoG to keep into account the deformable elements, as described hereinafter. The starting point is the result of the application of the equations written under the hypothesis of infinite stiffness of the elastic elements, useful to describe the very first distribution of the weights on the supports. Subsequently, on the basis of these first weights and of the equations that express the deflection of these elastic elements as a function of the applied load [45], it is possible to correct the position of the CoG, hence to recalculate the position of the CoG′ and the distribution of the weights on the supports, and again the deflection of the elastic elements until arriving at a numerical convergence of the results. The viscous damping component of these deformable media is not taken into account here because the measurement methods shown above are static or quasi-static.
In particular, most of the agricultural tractors still in use today (the average age is very high, especially in Italy [46,47]) are not equipped with shock absorbers (the comfort of the operator is delegated entirely to the suspension seat). Therefore, the only elastic elements that can be taken into account for these machines are the pneumatic tyres. The tyres are subject to:
  • a load perpendicular to the support plane, which causes a flattening of the tyres (i.e., they undergo a decrease in height), thus causing the chassis having a rigid rotation downstream as a consequence of the increase in the roll and pitch angles;
  • a load parallel to the supporting plane; in particular, the component of this load parallel to the axis of the wheel (called: the lateral horizontal load) is the one of greatest interest, as it is responsible for a lateral deformation of the tyre and, therefore, it causes a translation of the entire chassis downstream.

3.6.1. Effect on the CoG Position of a Load on the Tyres Perpendicular to the Vehicle Support Plane

The higher the center of gravity is positioned with respect to the tyre sidewall, the more pronounced is the effect of the downstream shift of the CoG as a consequence of the perpendicular displacement of the tyres. To illustrate this effect, it is possible to assume a first simple initial placement of the vehicle in the test rig with the longitudinal axis perpendicular to the direction of the maximum gradient (e.g., in a situation similar to the lateral tilting test). In this case, the equivalent coefficient of elasticity k in the perpendicular direction for each of the two sides of the tractor is the same, the front and rear wheels being equal in pairs (hence, with the same coefficient of elasticity k⊥,FL = k⊥,FR and k⊥,RL = k⊥,RR). In particular, the equivalent coefficient of elasticity k for each side can be calculated as the sum of the modulus of elasticity of each of the two front wheels k⊥,FL = k⊥,FR and rear wheels k⊥,RL = k⊥,RR (the wheels of each side constitute two elastic systems in parallel). With reference to Figure 13 (using the same symbols of Section 3.3), if the distance of H (i.e., the projection of CoG perpendicular to the support plane) from L, the center of left support, is (−Δ) (therefore with a possible deviation Δ from the centreline of the vehicle, the additional angle Δα of lateral inclination of the vehicle frame and the consequent new distance (−Δ)def of the projection of CoG perpendicular to the support plane from L can be calculated from the resulting forces on the left side RL,⊥ and on the right side RR,⊥ in the absence of deformation through the following equations:
{ k = k , F L + k , R L = k , F R + k , R R sin ( Δ α ) = R L , k R R , k 2 = R L , R R , 2 k ( Δ ) d e f = ( Δ ) cos ( Δ α ) ( h h t ) sin ( Δ α )
Once the new distance ( Δ ) d e f has been calculated, it is possible to calculate the new forces applied to the supports (quadrants) of the two sides of the vehicle and then iteratively apply the same equations until numerical convergence.
The above-presented scheme may also be applied to a vehicle with a different orientation in space (e.g., during a quasi-static test in which the turntable has brought the longitudinal axis of the vehicle into a generic position; see Figure 14), using the same equations presented above in the direction of the vehicle longitudinal and transverse axis, to calculate the roll and pitch angle increments for the chassis. In this scenario, starting from the initial distribution of the weights on the supports (i.e., corresponding to an infinite perpendicular stiffness for the tyres), it is, therefore, possible to calculate the inclination of the chassis and then, iteratively, the new position of the center of gravity CoGdef.
In a quasi-static mode test, the effect of the sole vertical compression of the tyres causes a displacement of CoG′ towards the outside of the support polygon and, therefore, a widening of the locus described by CoG′ during a test. For a farm tractor, for example, this enlargement would not be isometric (i.e., quantitatively equal in all directions from CoG‴), even if the coefficient of elasticity of the tyres were equal for front and rear tyres and if the center of gravity was positioned exactly on the vertical of the geometric centre of the supporting polygon. In fact, the support polygon of a farm tractor is never a square but it is more elongated along the longitudinal axis (to have a rectangle or a trapezium) and, therefore, the effect of this inclination of the chassis will be greater in the transversal direction (i.e., along the left-right axis of the vehicle). Consequently, the effect is to accentuate the roll more than the pitch.

3.6.2. Effect on the CoG Position of a Load on the Tyres Parallel to the Vehicle Support Plane

To illustrate the effect of lateral stiffness of the tyres, it is worth referring again to the static test of lateral overturning, illustrated previously in Section 3.6.1 (see Figure 15).
Again, the equivalent lateral stiffness of the tyres on each side k// is the sum of the lateral stiffness of a front and rear tyre together, acting as parallel elastic systems. Since the tangential forces acting on each side of the vehicle have a different magnitude, the tyre deflections will also be different (the downstream tyre has a greater deflection than the upstream tyre). Considering the presence of the chassis to connect the wheels and the test conditions of a vehicle in a conventional test rig installation, however, the displacement of the centre of gravity may be at most equal to the compression experienced by the downstream tyre:
{ k / / = k / / , F L + k / / , R L = k / / , F R + k / / , R R ( Δ ) d e f = ( Δ ) R L , / / k / /
Indeed, the contact point of the downstream tyre, in this case the point L, cannot move along the slope thanks to the presence of an appropriate prominence blocking the wheel laterally; vice versa, the point of contact of the upstream tyre (point R) can instead move appropriately so that the distance between the wheel hubs (due to the chassis) remains the same (i.e., they continue to be at a distance 2; Figure 15b).
The above-presented scheme may also be applied to a vehicle with a different orientation in space (e.g., during a quasi-static test in which the turntable has brought the longitudinal axis of the vehicle into a generic position; see Figure 16), using the same equations presented above in the direction of the vehicle transverse axis, to calculate the lateral shift of the chassis, so that the effect is to move the CoG downstream. Starting from the initial distribution of the weights on the supports (i.e., corresponding to an infinite lateral stiffness for the tyres), it is, therefore, possible to calculate the shift of the chassis and then, iteratively, the new position of the centre of gravity CoGdef.
In a quasi-static mode test, the effect of the sole lateral compression of the tyres (in the direction parallel to the rotational axes of the wheels) causes a displacement of CoG′ towards the outside of the support polygon and, therefore, a widening of the locus described by CoG′ during a test. For the considered deflection, this enlargement is not isometric (i.e., quantitatively equal in all directions from CoG‴) but it substantially affects only the transversal width of the locus described by CoG′. In each position of β, the effect of this lateral shift is to reduce the width of the vehicle support base and, therefore, to bring CoG′ closer to the lateral boundary of the support polygon (and the vehicle to the lateral overturning condition).

3.7. Case-Study: Simulation of the Test of a Farm Tractor

The presented equations have been applied to the data of a real farm tractor, a “TL 90 4WD” by New Holland Agriculture (Torino, Italia; [48]), taken from an OECD technical bulletin [49,50] (Table 2). This tractor has a “conventional” architecture: it has a block chassis as supporting structure and the steering is performed by orienting the front axle wheels.
Assuming a placement of the center of the tractor reference frame (i.e., the point Ot) in the point (965; 0)SP and the axis xt aligned and opposite to xSP, the centers of the wheels are placed in the positions/quadrants reported in the following Table 3.

3.7.1. Static Test (Without Tyres Deflection)

By simulating a static test on a rig similar to what has been described in this article under the assumption that the tyres are not deformable, it is possible to obtain the following results (Table 4). Please note that, according to the initial placement of the tractor, the static tests at 20.00° and 37.73° are imposing the tractor a leftward side inclination.
As can be seen from the Table 4, the side inclination of 37.73° is the leftward limit inclination for that tractor, as the normal force in correspondence to the front/rear right wheels is null.

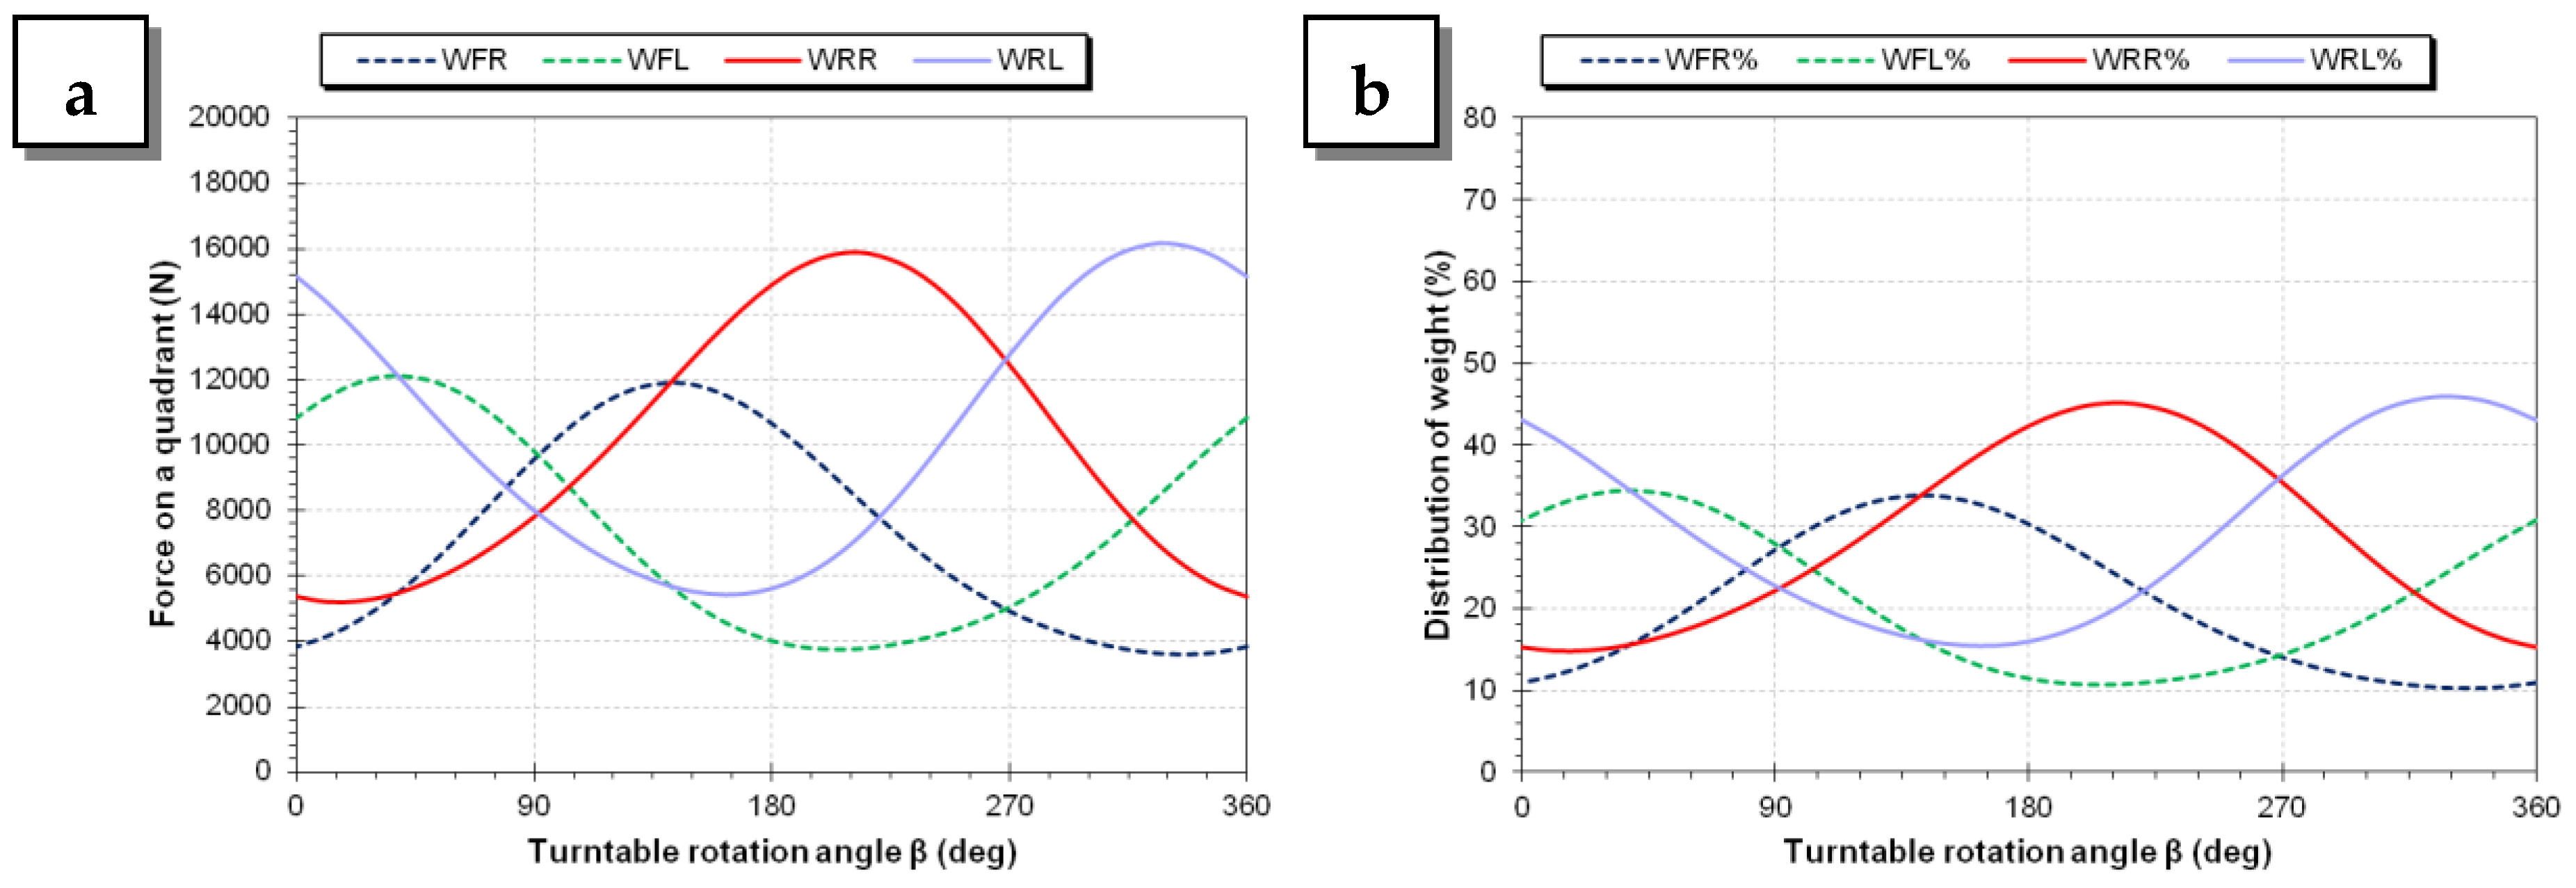
3.7.2. Quasi-Static Test (Without Tyres Deflection)

In a second test (quasi-static tests at the inclination α = 20.00° and 37.73°), the turntable rotates counter-clockwise by 360° around its axis. Under the same assumption of the previous paragraph (i.e., considering that the tyres are not deformable), the locus of CoG′ described during a complete revolution of the turntable in the two above-referred cases is represented in Figure 17; it has a radius of 309 mm (at α = 20.00°) or 658 mm (at α = 37.73°) respectively. In the latter case, the distance between the circumference traveled by CoG′ and the support polygon is zero in the left side of the tractor (the circumference is tangent to the support polygon), and this means that in that angular position (corresponding, in this case, to β = 0°) the vehicle is in a condition of incipient rollover.
The normal forces (absolute values, percentage of the total weight of the tractor) which can be recorded on each quadrant during such test are visible in Figure 18 (for an inclination α = 20.00°) and Figure 19 (for α = 37.73°). Note that the same condition of incipient rollover is evidenced by two of the four curves reaching a condition of null force, i.e., touching the abscissa axis as in Figure 19a,b (for β = 0°).
From the graphs shown here, it is possible to see that the safest stability condition is, as expectable, the one at β = 90°, i.e., corresponding to a situation where the front of the tractor is heading downstream. The safety margin is in fact the minimum vertical distance of the curves from the abscissae axis, in this case maximum for β = 90°. The opposite situation to this one, i.e., with the front of the tractor upstream (β = 270°), does not have the same safety margin (i.e., curves are closer to the abscissae axis), since the CoG of this tractor is closer to the rear axle (as in all farm tractors with a conventional architecture). From the same figures it is also possible to read the maximum loads reached by every single wheel (reported also in Table 5), recorded when that wheel is in the lowest position on the sloping support plane.

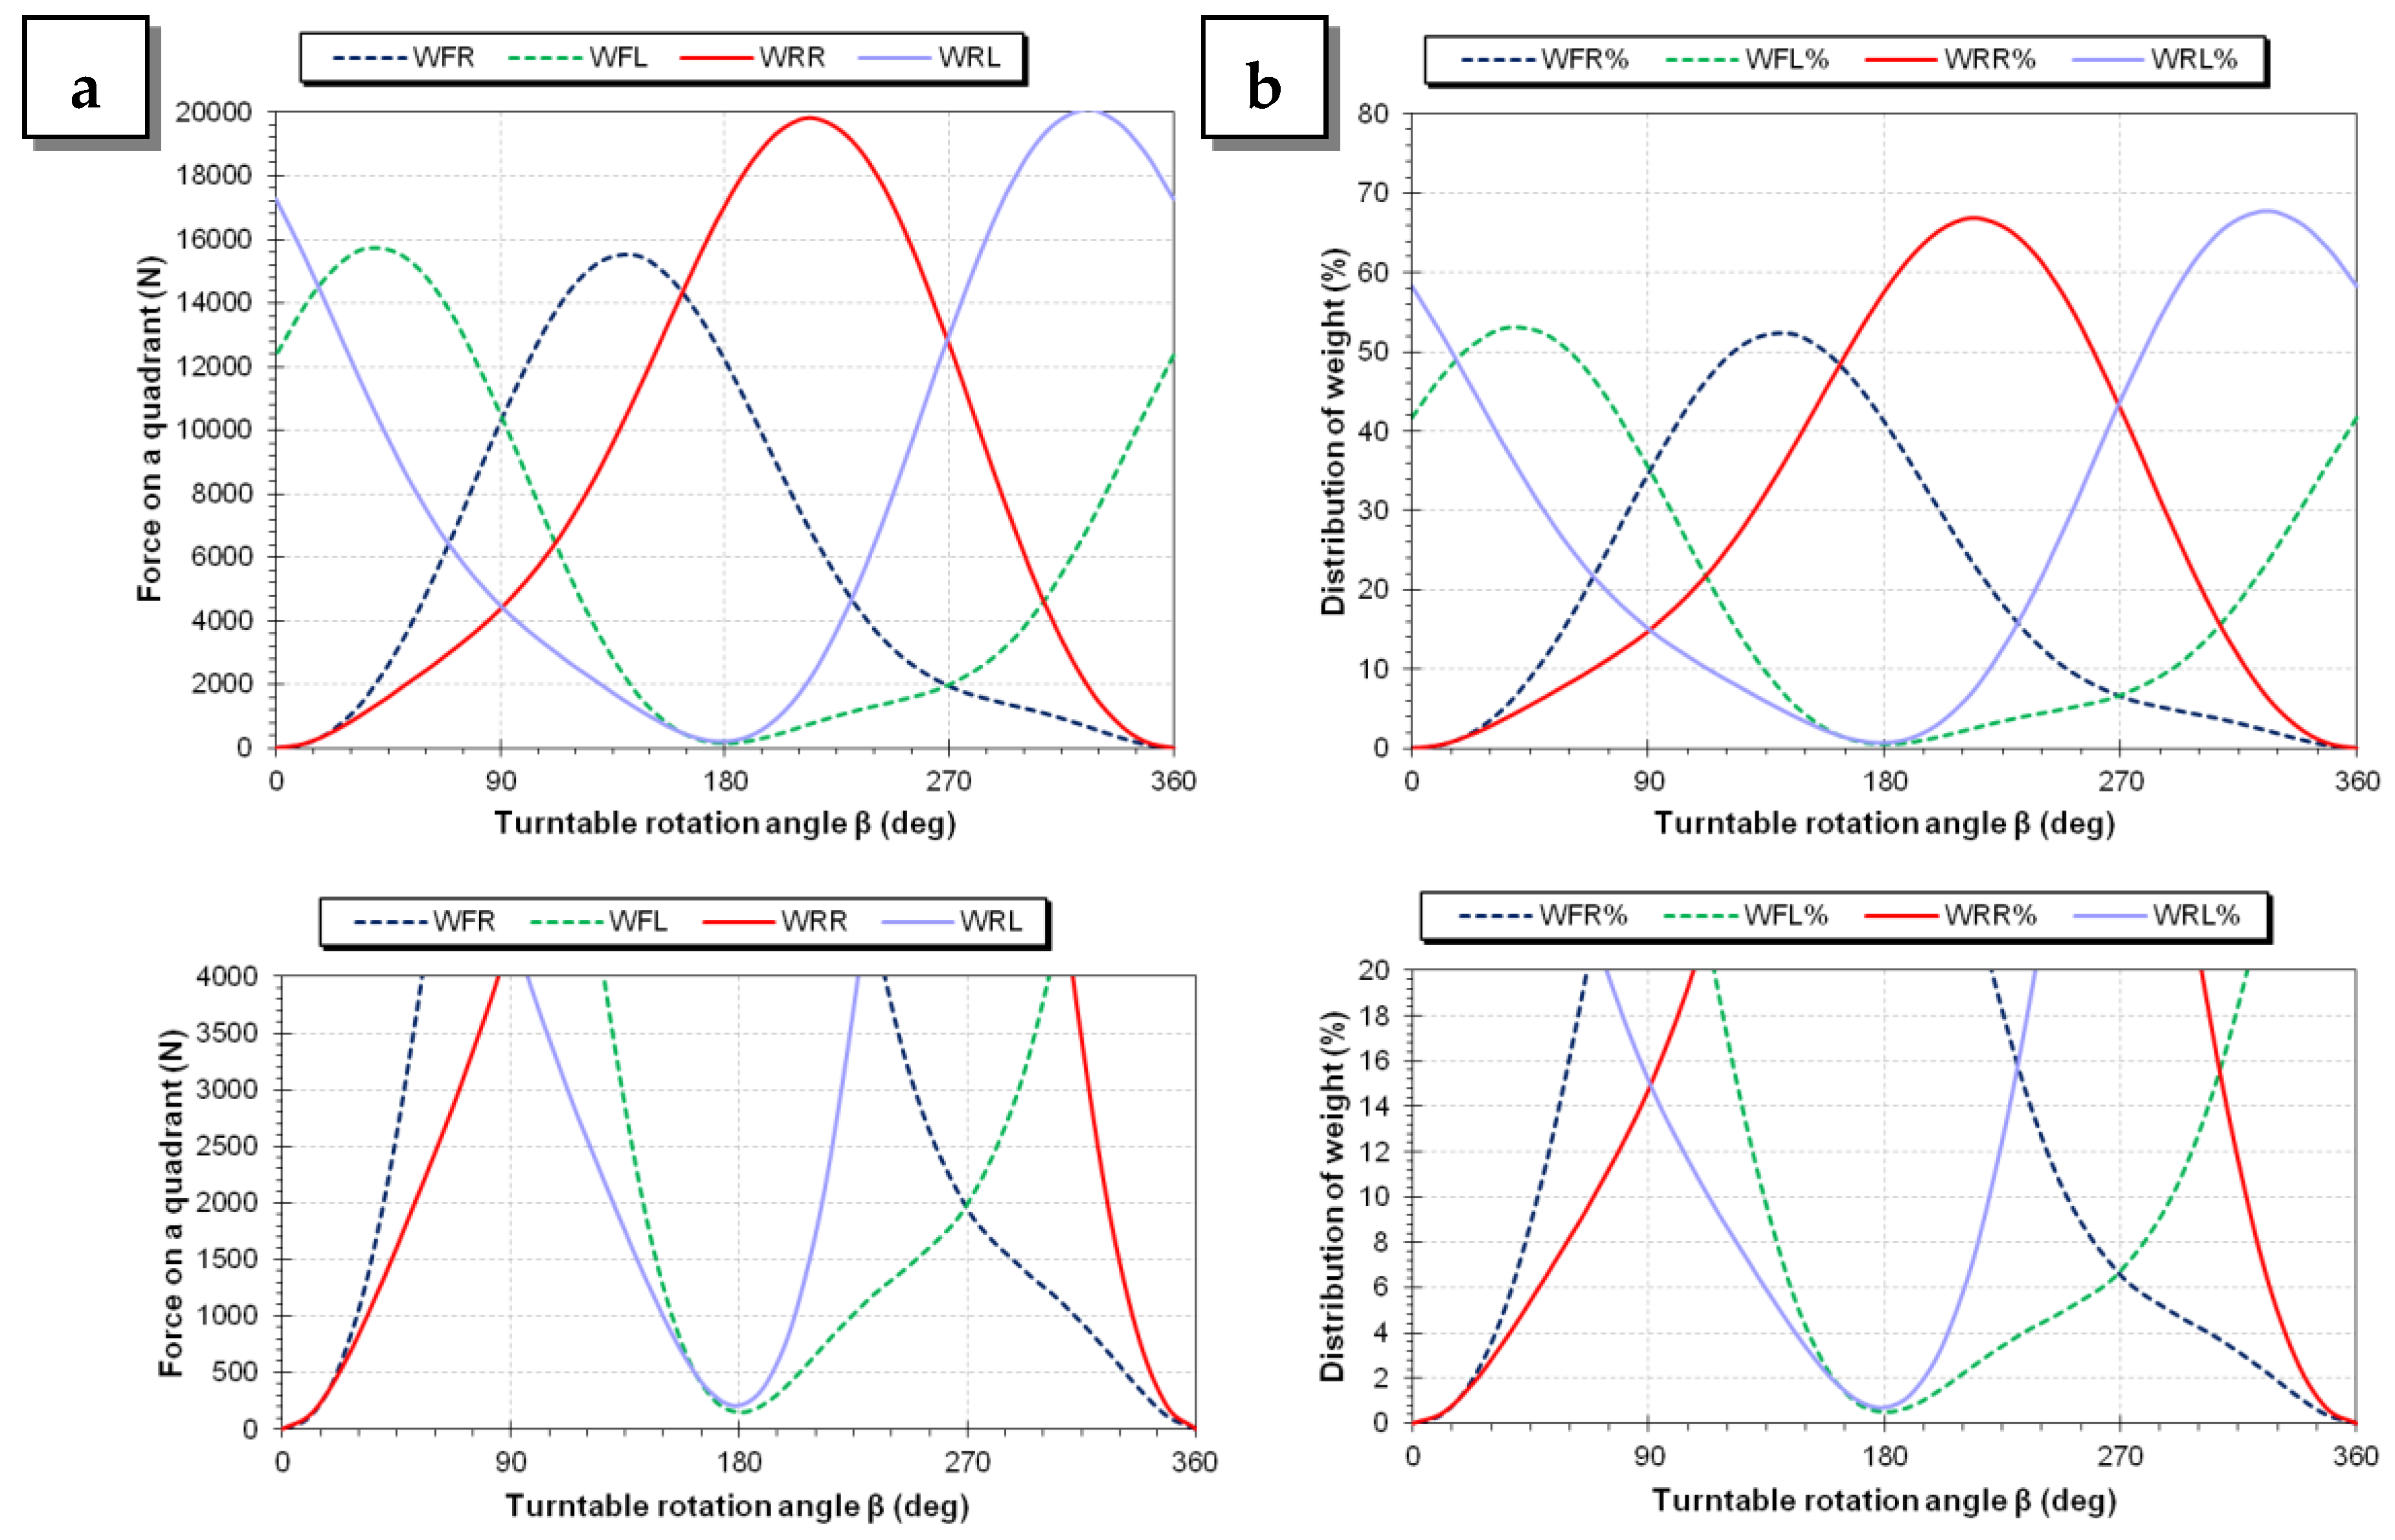
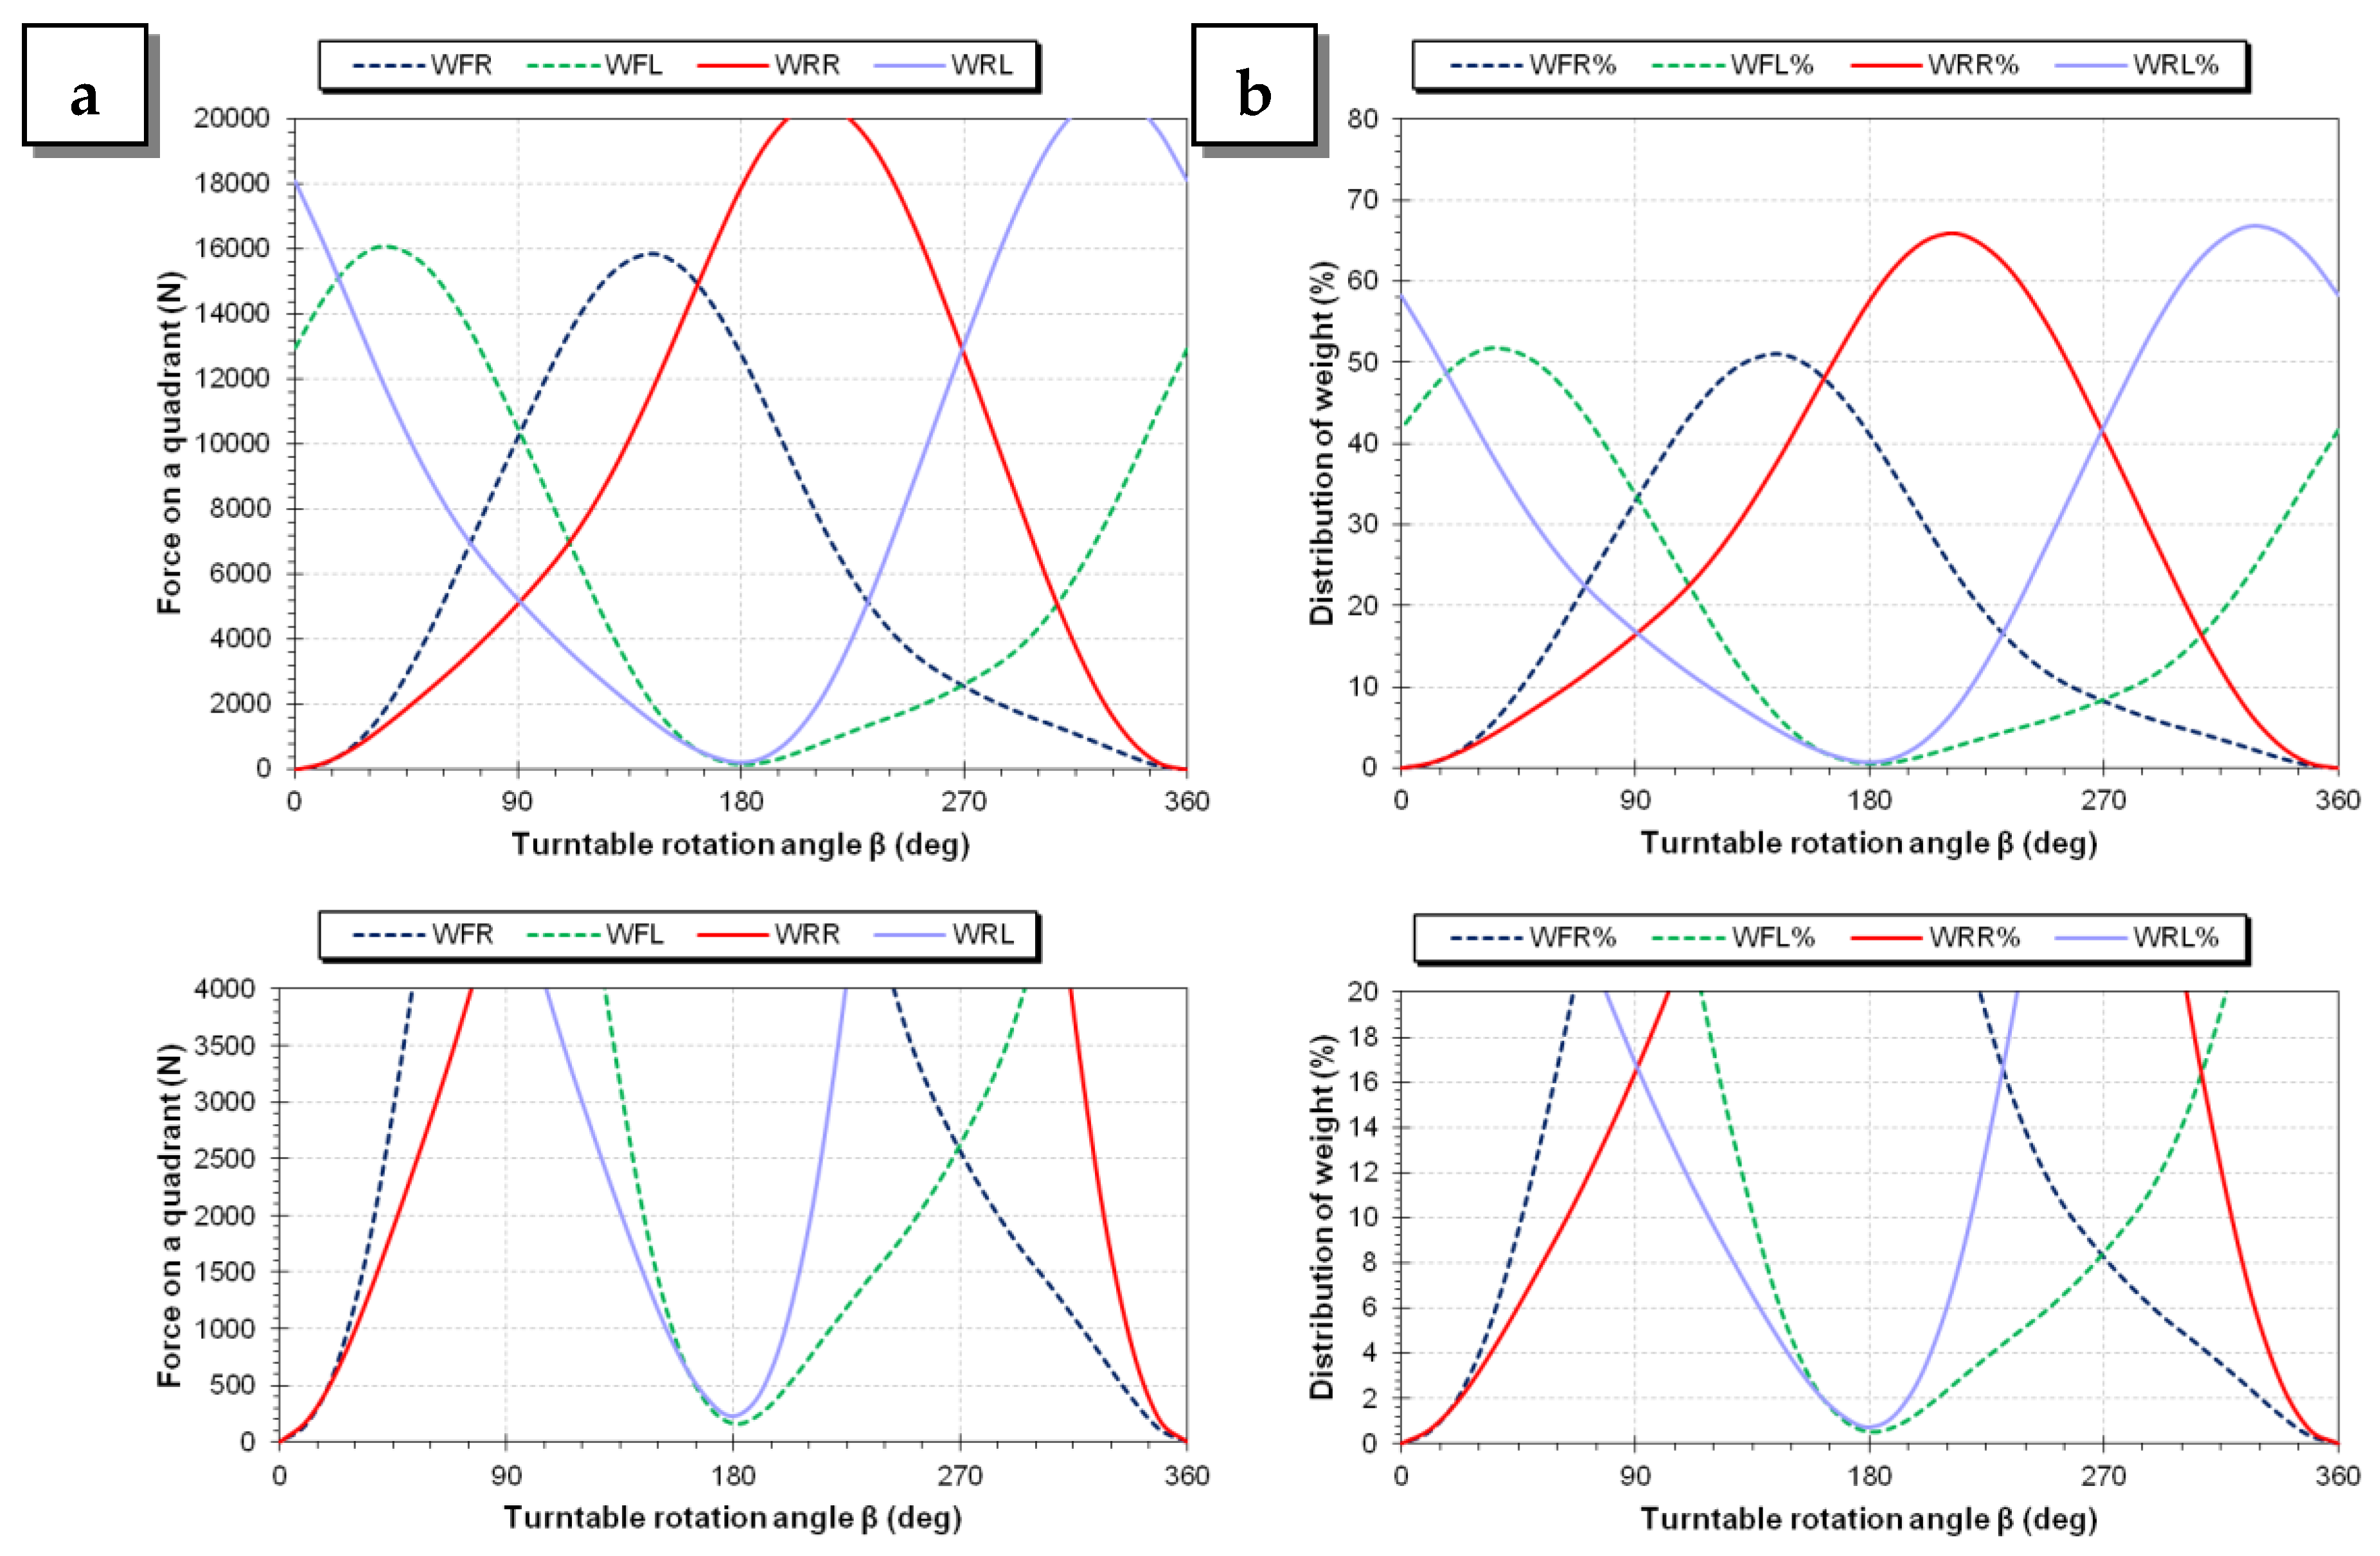
3.7.3. Quasi-Static Test (Considering Also the Tyres Deflection)

As previously explained, starting from the results of the quasi-static test, illustrated in Section 3.7.2, it is now possible to recalculate the locus of the positions of CoG′ and, hence, the graphs of the distribution of the weight on the four wheels of the tractor so as to keep into account also the deflection of the tyre. The main characteristics of the tyres equipping the tractor, reported in the bulletin [49] using a technical information format compliant with ETRTO standard [51], are shown in Table 6.
To proceed, it is necessary to know the perpendicular and lateral stiffness of the tyres (quantified respectively by the perpendicular and lateral elastic coefficients), e.g., by performing some experiments with proper equipment or finding the values of the elastic coefficients in the literature. It is worth noting that the inflation pressure has a very high influence on the tyre stiffness, and, hence, on the deflection of a tyre [52], so a pressure level has to be stated. In this case, since it would be interesting to have a greater knowledge of the risks that occur when the tractor is used in a working environment and in the worst possible condition, i.e., on a sloping hillside and with the tyres at the minimum possible inflating pressure, it is assumed the execution of a quasi-static test with the tyres inflated at a pressure of 1.0 bar (100 kPa). This value is equal to the lower limit of the pressure range that is normally used in field operations, with the aim of increasing the footprint area and limiting the soil compaction. At such low pressures, the tyre stiffness is very low and the risk of lateral rollover is high, so it is surely a case to investigate. For example, with the indicated pressure of 1.0 bar, a 14.9–30 tyre, i.e., a wheel with a rim diameter that is intermediate between the two diameters of the considered tractor, has a value of 230 kN·m−1 (i.e., 230 N·mm−1) for the tyre elastic coefficient along the vertical direction [53]. To have two values more suitable for the agricultural tyres referred to in the present case, it is possible to interpolate the experimental load–deflection curves reported in [54] for the 420/85 R24 and 460/85 R34 tyres at the inflating pressures of 1.0 bar. By doing so it is possible to obtain the following coefficients: 3.87 × 10⁻³ mm·N−1 (equivalent to an elastic coefficient of 258 N·mm−1) for the 420/85 R24 tyre (very similar to the 14.9–24 tyre), and 3.58 × 10⁻³ mm·N−1 (equivalent to an elastic coefficient of 279 N·mm−1) for the 460/85 R34 tyre (very similar to the 18.4–34 tyre). The ratio between the lateral stiffness and the perpendicular stiffness of a tyre has a value highly variable with the characteristics of the tyre itself (specifically, of the carcass) and with the geometry of the tyre section (in particular, the sidewalls height and the rim diameter). Observing the values of that ratio reported in [45], spanning from 0.21 and 0.75 with an average of 0.51 (even if referred to car tyres), it is reasonable to hypothesize a lateral stiffness equal to the 0.50 of the stiffness measured along the vertical direction respectively for both the tyres of the present case (129 N·mm−1 for the 14.9–24 tyre, 181 N·mm−1 for the 18.4–34 tyre).
The locus of CoG′ described during a complete revolution of the turntable in the two above-referred cases (at the inclination α = 20.00° and 37.73°), plus a third intermediate inclination (α = 33.95°) is represented in Figure 20. As visible, the locus is no longer a perfect circumference, but appears to be widened and deformed by the effect of the tyre deflection. The minimum and maximum dimensions are: 626 and 706 mm for α = 20.00°, 1157 and 1315 mm for α = 33.95°, 1329 and 1511 mm for α = 37.73°. Moreover, with the highest inclination (α = 37.73°), the locus travelled by CoG′ exceeds the support polygon in both the sides of the tractor, specifically for β = [0°;12°]U[3–48°;360°] and for β = [168°;192°], and this means that, with the test rig at that inclination and the turntable in those angular positions, the vehicle would already be overturned unless it was held at the structure by some security system (see next paragraph for details about it). Indeed, under the described hypothesis (deformable tyres), the incipient overturning conditions occur at 33.95°, i.e., at an angle that is the 10% smaller than the case where the deformation of the tyres is neglected.
The normal forces (absolute values, percentage of the total weight of the tractor) which can be recorded on each quadrant during such a test are visible in Figure 21 (for an inclination α = 20.00°) and Figure 22 (for α = 33.95°). Note that the same condition of incipient rollover is evidenced by two of the four curves reaching a condition of the null force, i.e., touching the abscissa axis as in Figure 22a,b (for β = 0°).
The considerations that can be drawn from the graphs of Figure 22 about the safest stability condition (at β = 90° or β = 270°) are the same of the case in which the deformability of the tyres is neglected. From the same figures, it is also possible to read the maximum loads reached by every single wheel (reported also in Table 7), recorded when that wheel is in the lowest position on the sloping support plane, or the minimum load, reached when that wheel is in the highest position on the sloping support plane.
Observing the data in Table 7 and the homologous data in Table 5, it can be observed that:
  • for a 20° inclination of the support, with the assumption of tyre deformability, the maximum loads are higher than 5% whilst the minimum loads are lower than 10%, a clear sign of the worsening of the situation due to the deformation of the tyres downstream, which has affected the position of the CoG and caused a load transfer;
  • for an inclination of the support at the limit of incipient rollover for the tractor (respectively of 37.73° and 33.95° in the two examined cases), the maximum loads recorded under the assumption of tyre deformability are greater by 2–3%, due to the lower inclination of the support platform, which results in a greater normal component on each wheel.

3.8. Possible Realization of the Described Test Rig

From a structural point of view, it is possible to simplify the structure of the test rig presented in the previous paragraphs by reducing the support surface to the quadrants only (Figure 23a–c). The final result of this design process, visible in Figure 23d,e, is currently under development and will be installed within the “Laboratory for Agroforestry Innovations” at the NOI Techpark in Bolzano (Italy).
Despite the conceptual simplification of the structure, which has reduced it to just the quadrants (each one having the following dimensions: 2.10 m × 3.15 m), it was decided to position the tilt hinges at the center of the supporting structure. This design choice allows the installation to tilt up to 60°, limit the maximum elevation of the platform and hold the vehicle in test in a pit in case of a failure of the vehicle fixture system. Indeed this layout requires the excavation of a 3.70-m-depth pit to house the main column and allow the structure to incline. The pit occupies more than 100 m2 on the laboratory floor (dimensions 11.00 m × 9.50 m), i.e., an extension wider than the top surface of the turntable (equal to 26.46 m2), so as not to interfere with it during rotations. CAD estimates indicate a total mass for the platform of about 25,000 kg with a nominal load-bearing capacity of 10,000 kgf for the bearing structure (value corresponding to the maximum weight of vehicles that can be safely tested by the rig with inclinations up to 60°); the safety factor is 1.5, meaning that the structure can withstand up to a weight force of 15,000 kgf before collapsing. The maximum load on a single quadrant is instead set at 5000 kgf, thinking to a condition of incipient rollover for a 10,000-kg vehicle, i.e., a scenario characterized by the total weight supported by only two wheels/quadrants. Thanks to its dimensions, this test installation is capable of testing vehicles of different sizes, both with a conventional architecture (i.e., with front steering wheels) and with a central steering joint (articulated machines), possibly also in a steering configuration.
The quadrants surface is made with a rigid and simple-to-be-serviced embossed metal plate with a standard pattern, to have a high-grip support surface that can be easily found and used also in other similar possible future test installations (this is the premise to have normed scenarios hence allowing to perform a comparison of test outputs even if coming from different test stations). For safety reasons, each quadrant is also equipped with steel ropes to be used to secure the hub of each wheel supported by that quadrant (see Figure 23d). The anchor ropes will only tension when the tipping condition for that vehicle is reached.

4. Conclusions

This work illustrates the potential of a new installation for testing and certifying the stability of agricultural and operating machines. This installation, called a rotating platform or turntable, has the peculiarity of moving the machine positioned on it according to two rotational degrees of freedom (global inclination of the support plane, rotation of the support plane around an axis perpendicular to it). It significantly expands the test scenarios currently proposed by the reference standards (foreseeing, instead, only a lateral overturning test without any measurements of the weights supported by the tyres) with a novel type of test, namely the quasi-static stability tests, allowing to obtain a much wider information content than from a single conventional test. The same installation is predisposed to record the weight supported by each wheel of the agricultural machine positioned on it, both when the platform is stationary and while the above-described movements are being carried out. The mathematical models presented here anticipate and help the future understanding of the trends that will be recorded when the installation is actually active, thus maximizing the information content that will be made available. In the wishes of the authors, such equipment should enable the driver to have a greater awareness of the way in which his vehicle behaves and, thus, to operate in complete safety. In addition, the operative angles of this test equipment that may lead the vehicle to an incipient overturning condition (in terms of angle of inclination α and rotation β of the support plane) should also be used to guide the development of possible prototypes of the tested machines and/or to set the operating limits of any active safety equipment. In the simplest configuration, one of these devices could be configured as a double inclinometer (or an inertial platform) equipped with a series of acoustic (buzzer) and visual (flashing lights) alarms that signal the driver the approach of the vehicle to its limit angles (by setting, for example, the alarm thresholds to the 90% or 95% of these angles). In a more advanced version, this instrument could also be given the possibility to act on some actuators that, for example, regulate the excursion of the shock absorbers (if any) or the position of the machine body for those machines that are equipped with a self-leveling system. All these systems can be safely tested using the presented rig.
The reported case-study allowed exemplifying the outputs of this test rig after some tests on a conventional tractor. Thanks to this mathematical model, it was possible to anticipate one of the most interesting results that will be made available by the structure when it is built. It is a graph that shows, in correspondence to a set inclination α of the structure, the trend of the normal load on each support as the rotation angle β of the turntable spans from 0° to 360° (corresponding to a complete revolution of the turntable). In this graph, the distance of each curve from the abscissae axis represents the safety margin of that machine under the conditions of spatial orientation imposed by the rig (corresponding to a defined angle of roll and pitch). The mathematical model used here has also allowed the quantification of the destabilizing effect of tyres inflated to a pressure of 1.0 bar (i.e., a value usually adopted in field works to avoid over-compacting the ground): the incipient overturning limit is 10% less than if the tyres were neglected. Any rollover prevention system should therefore also include sensors to monitor the tyre pressure in order to adjust the danger threshold.
The equipment described here will be part of the new Laboratory for Agroforestry Innovation of the Free University of Bozen/Bolzano, located in the NOI techpark in Bolzano (Italy).

Author Contributions

The authors contributed to the study reported in this article as follows. Conceptualization, M.B. and F.M.; Data curation, M.B.; Formal analysis, M.B. and F.M.; Funding acquisition, F.M.; Investigation, M.B.; Methodology, M.B. and F.M.; Project administration, M.B. and F.M.; Resources, M.B.; Software, M.B.; Supervision, F.M.; Validation, M.B.; Visualization, M.B.; Writing—original draft, M.B.; Writing—review & editing, M.B. All authors have read and agreed to the published version of the manuscript.

Funding

This study was developed within the activities foreseen by the “Alpine Technologies” contract for research capacity building (“ALPItec”) of the Free University of Bozen/Bolzano, grant number TN820A, funded by the Autonomous Province of Bolzano/Bozen (http://www.provincia.bz.it/it/default.asp). The publication of this work was supported by the Open Access Publishing Fund of the Free University of Bozen/Bolzano.

Conflicts of Interest

The authors declare no conflict of interest. The funders had no role in the design of the study; in the collection, analyses, or interpretation of data; in the writing of the manuscript, or in the decision to publish the results.

Nomenclature

AbbreviationSignificance
CoGcenter of gravity (of a vehicle or, in general, of a body)
CoGprojection of the CoG of a vehicle (or, in general, of a body) on the vehicle support plane
CoGprojection of the CoG of a vehicle (or, in general, of a body) on the vehicle support plane when the support plane is horizontal
CoRcenter of rotation (of the rotating system) on the support plane
CoRcenter of rotation (of the rotating system) at a height h from the support plane
DoF(s)degree(s) of freedom
OECDOrganization for Economic Co-operation and Development
Q1, … Q4quadrants of the turntable on which a vehicle under test is positioned, subdividing the support plane
SymbolSignificance, units
αinclination angle (always positive) of the support plane (in the frame of reference of the test system); together with β is one of the “operative angles” of the test rig [°]
αlim,L, αlim,Rlimit angle of inclination of the support plane α, corresponding to an incipient rollover condition on the left (L) or right (R) side of the vehicle [°]
βrotation angle (positive if counter-clockwise) of the turntable, measured between the ySP axis of the turntable and the maximum slope direction of the support plane; together with α is one of the “operative angles” of the test rig [°]
βrotation angle (positive if counter-clockwise) of vehicle longitudinal axis with the maximum slope direction; it coincides with the rotation angle of the turntable only when the vehicle longitudinal axis xt is parallel to the ySP axis of the turntable [°]
δangle (positive if counter-clockwise) between the abscissa/ordinate axis of the coordinate system of the support plane (xSP or ySP) and the abscissa/ordinate axis of the coordinate system of the vehicle (xt or yt) [°]
ϑpitch angle of a vehicle (in the vehicle frame of reference) [°]
kcoefficient of elasticity in the direction perpendicular to the support plane for each of the two sides of the vehicle under test [N·mm−1]
k//coefficient of elasticity in the direction parallel to the support plane and to the wheel rotational axis for each of the two sides of the vehicle under test [N·mm−1]
k,FL/k,FR/k,RL/k,RRcoefficient of elasticity in the direction perpendicular to the support plane for the front-left/front-right/rear-left/rear-right tyre of the vehicle under test [N·mm−1]
k//,FL/k//,FR/k//,RL/k//,RRcoefficient of elasticity in the direction parallel to the support plane and to the wheel rotational axis for the front-left/front-right/rear-left/rear-right tyre of the vehicle under test [N·mm−1]
φroll angle of a vehicle (in the vehicle frame of reference) [°]
ψyaw angle of a vehicle (in the vehicle frame of reference) [°]
(a, b)coordinates of CoG′ in the reference frame of the vehicle placed on the turntable [m; m]
Δdistance of the CoG of a vehicle under test from its longitudinal axis/plane [m]; in other words, in a plane transverse to the longitudinal axis of the vehicle, offset from the centreline of the vertical line passing through the CoG
ΔySP(CoG′)shift of CoG′ downstream the inclined support plane in the frame of reference fixed to the turntable as an effect of an increase in the support plane inclination [m]
d1, d2dimensions of the quadrilateral linking the load cells under the quadrants (i.e., distance along xSP and ySP between the load cells under the quadrants) [m]
dFr, dRedistances of the CoG′ from the front and the rear axles of a vehicle under test [m]
dFL, dFR, dRL, dRRrespectively the distances of the line passing through CoG′ from the front/rear left/right wheels of the tractor
FTfront track width of the vehicle under test (positioned on the support plane) [m]
gmodulus of the gravitational acceleration [m·s−2]
h = ztdistance of the CoG from the vehicle support plane (height of the CoG) [m]
half-track width of a vehicle under test (positioned on the support plane) or half-width of a vehicle under test (positioned on the support plane) in correspondence to the CoG [m]
mmass of the vehicle under test [kg]
Pmodulus of the weight force of a vehicle under test [N]
rBRratio between the components perpendicular to the support plane of the binding reaction in the points R and L, i.e., in the center of the right and left rear wheel of a vehicle under test (positioned on the support plane) [-]
rdistratio of the distances of CoG′ from L and from R, i.e., from the centers of the right and left rear wheels of a vehicle under test (positioned on the support plane) [-]
rmsmaximum slope direction of the support plane of the test system
rpdirection perpendicular to the support plane, on which the vehicle under test is placed
rv(absolute) vertical direction, perpendicular to the horizontal plane on which the test rig is placed
RR, RLmodulus of the component perpendicular to the support plane of the binding reaction in the points R (L), i.e., in the center of the right (left) rear wheel of a vehicle under test, i.e., positioned on the support plane [N]
RR, RLmodulus of the binding reaction in the points R (L), i.e., in the center of the right (left) rear wheel of a vehicle under test (positioned on the support plane) [N]
RTrear track width of the vehicle under test (positioned on the support plane) [m]
W1, … W4weights measured by the load cell placed under each quadrant [N]
W1,%, … W4,%percentage distribution of weights on each quadrant [%]
WBwheelbase of the vehicle under test (positioned on the support plane) [m]
WF, WRweight supported by the front (rear) axles of the vehicle under test (positioned on the support plane) [N]
WFR, WFLweight supported by the front right (left) wheel of the vehicle under test (positioned on the support plane) [N]
WRR, WRLweight supported by the rear right (left) wheel of the vehicle under test (positioned on the support plane) [N]
Wtottotal weight supported by the wheels of the vehicle under test (positioned on the support plane); NB if the support plane inclination is not null, it is different from the weight force P of the same vehicle under test [N]
xSP-ySP-zSP-CoRCartesian frame of reference of the support plane fixed to the turntable (i.e., rotating with it)
xt-yt-zt-OtCartesian frame of reference of a vehicle under test (positioned on the support plane, NB variously inclined with respect to the horizontal plane)

References

  1. Genta, G. Motor Vehicle Dynamics: Modeling and Simulation—Series on Advances in Mathematics for Applied Sciences; World Scientific Publishing Co Pte Ltd.: Singapore, 1997. [Google Scholar]
  2. Resnick, R.; Halliday, D.; Krane, K.S. Physics; Wiley: Hoboken, NJ, USA, 2001; Volume 1. [Google Scholar]
  3. Mazzetto, F.; Bietresato, M.; Vidoni, R. Development of a dynamic stability simulator for articulated and conventional tractors useful for real-time safety devices. Appl. Mech. Mater. 2013, 394, 546–553. [Google Scholar] [CrossRef]
  4. Vidoni, R.; Bietresato, M.; Gasparetto, A.; Mazzetto, F. Evaluation and stability comparison of different vehicle configurations for robotic agricultural operations on side-slopes. Biosyst. Eng. 2015, 129, 197–211. [Google Scholar] [CrossRef]
  5. Melzi, S.; Sabbioni, E.; Vignati, M.; Cutini, M.; Brambilla, M.; Bisaglia, C.; Cavallo, E. Multibody model of fruit harvesting trucks: Comparison with experimental data and rollover analysis. J. Agric. Eng. 2018, 49, 92–99. [Google Scholar] [CrossRef] [Green Version]
  6. Hicks, D.; Grzebieta, R.; Mongiardini, M.; Rechnitzer, G.; Simmons, K.; Olivier, J. Investigation of when quad bikes rollover in the farming environment. Saf. Sci. 2018, 106, 28–34. [Google Scholar]
  7. Sun, C.; Nakashima, H.; Shimizu, H.; Miyasaka, J.; Ohdoi, K. Physics engine application to overturning dynamics analysis on banks and uniform slopes for an agricultural tractor with a rollover protective structure. Biosyst. Eng. 2019, 185, 150–160. [Google Scholar] [CrossRef] [Green Version]
  8. Sun, C.; Nakashima, H.; Tsukamoto, S.; Minagawa, K.; Takahashi, H.; Shimizu, H.; Miyasaka, J.; Ohdoi, K. Numerical analysis of overturning of a three-wheeled agricultural carrier with a safety frame on a slope. Eng. Agric. Environ. Food 2017, 10, 249–258. [Google Scholar] [CrossRef]
  9. Bietresato, M.; Mazzetto, F. Morphometry as a Key to Investigate the Stability to a Wind-Induced Rollover of Agricultural Equipment for Irrigation. Int. J. Saf. Secur. Eng. 2020, 10, 129–139. [Google Scholar]
  10. Mazzetto, F.; Bietresato, M.; Gasparetto, A.; Vidoni, R. Simulated stability tests of a small articulated tractor designed for extreme-sloped vineyards. J. Agric. Eng. 2013, XLIV, 663–668. [Google Scholar] [CrossRef]
  11. Bietresato, M.; Carabin, G.; Vidoni, R.; Mazzetto, F.; Gasparetto, A. A parametric approach for evaluating the stability of agricultural tractors using implements during side-slope activities. Contemp. Eng. Sci. 2015, 8, 1289–1309. [Google Scholar]
  12. Guzzomi, A.L. A revised kineto-static model for Phase I tractor rollover. Biosyst. Eng. 2012, 113, 65–75. [Google Scholar] [CrossRef]
  13. Chisholm, C.J. A mathematical model of tractor overturning and impact behaviour. J. Agric. Eng. Res. 1979, 24, 375–394. [Google Scholar] [CrossRef]
  14. Coombes, G.B. Slope stability of Tractors. In Farm Machine Design Engineering; Design Engineering Publications: London, UK, 1968; pp. 18–33. [Google Scholar]
  15. Hunter, A.G.M. A review of research into machine stability on slopes. Saf. Sci. 1993, 16, 325–339. [Google Scholar] [CrossRef]
  16. Li, Z.; Zhu, Z.; Qin, J.; Mao, E.; Mitsuoka, M.; Inoue, E.; Shin, S. Factorial significance on tractor stability under variation of terrain roughness employing the Taguchi method. Int. J. Agric. Biol. Eng. 2018, 11, 88–94. [Google Scholar] [CrossRef] [Green Version]
  17. Zhang, S.; Li, Z.; Zhu, Z.; Mao, E.; Mitsuoka, M.; Inoue, E. Scale Model Experiment on Lateral Stability of Tractor Affected by Multi-factors. Nongye Jixie Xuebao Trans. Chin. Soc. Agric. Mach. 2017, 48, 358–363. [Google Scholar]
  18. Inotsume, H.; Sutoh, M.; Nagaoka, K.; Nagatani, K.; Yoshida, K. Slope traversability analysis of reconfigurable planetary rovers. In Proceedings of the 2012 IEEE/RSJ International Conference on Intelligent Robots and Systems, IEEE, Vilamoura, Algarve, Portugal, 7–12 October 2012; pp. 4470–4476. [Google Scholar]
  19. Bekker, M.G. Theory of Land Locomotion: The Mechanics of Vehicle Mobility; The University of Michigan Press: Ann Arbor, MI, USA, 1956. [Google Scholar]
  20. Bietresato, M.; Belotti, R.; von Ellenrieder, K.D.; Mazzetto, F. A Preliminary Study of Active Stabilization for Agricultural Machines Using a Movable Mass. In Volume 4: Dynamics, Vibration, and Control; American Society of Mechanical Engineers: New York, NY, USA, 2019. [Google Scholar]
  21. Ahmadi, I. Dynamics of tractor lateral overturn on slopes under the influence of position disturbances (model development). J. Terramechanics 2011, 48, 339–346. [Google Scholar] [CrossRef]
  22. Chisholm, C.J. The effect of parameter variation on tractor overturning and impact behaviour. J. Agric. Eng. Res. 1979, 24, 417–440. [Google Scholar] [CrossRef]
  23. Yisa, M.G.; Terao, H.; Noguchi, N.; Kubota, M. Stability criteria for tractor-implement operation on slopes. J. Terramechanics 1998, 35, 1–19. [Google Scholar] [CrossRef]
  24. Baker, V.; Guzzomi, A.L. A model and comparison of 4-wheel-drive fixed-chassis tractor rollover during Phase I. Biosyst. Eng. 2013, 116, 179–189. [Google Scholar] [CrossRef]
  25. Previati, G.; Gobbi, M.; Mastinu, G. Mathematical models for farm tractor rollover prediction. Int. J. Veh. Des. 2014, 64, 280–303. [Google Scholar]
  26. Lindemann, R.A.; Voorhees, C.J. Mars Exploration Rover Mobility Assembly Design, Test and Performance. In Proceedings of the 2005 IEEE International Conference on Systems, Man and Cybernetics, IEEE, Waikoloa, HI, USA, 12 October 2005; Volume 1, pp. 450–455. [Google Scholar]
  27. Cameron, J.; Jain, A.; Huntsberger, T.; Sohl, G.; Mukherjee, R. Vehicle-Terrain Interaction Modeling and Validation for Planetary Rovers; Jet Propulsion Laboratory, National Aeronautics and Space Administration: Pasadena, CA, USA, 2009.
  28. UNI; ISO. UNI ISO 22915-4:2012 Carrelli Industriali—Verifica Della Stabilità—Parte 4; UNI: Milan, Italy, 2012. [Google Scholar]
  29. UNI—Ente Nazionale Italiano di Unificazione. UNI EN 1459-3:2015 Carrelli Elevatori Fuoristrada-Requisiti di Sicurezza e Verifica-Parte 3; UNI: Milan, Italy, 2015. [Google Scholar]
  30. ISO. ISO 16231-2:2015—Self-Propelled Agricultural Machinery—Assessment of Stability—Part. 2: Determination of Static Stability and Test Procedures; ISO: Geneva, Switzerland, 2015. [Google Scholar]
  31. OECD (Organization for Economic Co-operation and Development) Code 6—OECD Standard Code for the Official Testing of Front Mounted Rollover Protective Structures on Narrow Track Wheeled Agricultural and Forestry Tractors; OECD: Paris, France, 1990.
  32. Scarlett, A.J.; Reed, J.N.; Semple, D.A.; Seward, P.C.; Stockton, A.D.; Price, J.S. Operator Roll-Over Protection on Small Vehicles—Research Report 432; HSE—Health and Safety Executive: Silsoe, UK, 2006.
  33. Gravalos, I.; Gialamas, T.; Loutridis, S.; Moshou, D.; Kateris, D.; Xyradakis, P.; Tsiropoulos, Z. An experimental study on the impact of the rear track width on the stability of agricultural tractors using a test bench. J. Terramechanics 2011, 48, 319–323. [Google Scholar]
  34. Zhao, X.T.; Jiang, H.Z.; Zheng, S.T.; Han, J.W. Precision Gravity Center Position Measurement System for Heavy Vehicles. Key Eng. Mater. 2006, 315–316, 788–791. [Google Scholar] [CrossRef]
  35. Franceschetti, B.; Lenain, R.; Rondelli, V. Comparison between a rollover tractor dynamic model and actual lateral tests. Biosyst. Eng. 2014, 127, 79–91. [Google Scholar] [CrossRef]
  36. ISO. ISO 789-6:1982—Agricultural Tractors—Test. Procedures—Part. 6: Centre of Gravity; ISO—International Organization for Standardization: Geneva, Switzerland, 1982. [Google Scholar]
  37. Bietresato, M.; Mazzetto, F. Increasing the safety of agricultural machinery operating on sloping grounds by performing static and dynamic tests of stability on a new-concept facility. Int. J. Saf. Secur. Eng. 2018, 8, 77–89. [Google Scholar]
  38. Pahl, G.; Beitz, W.; Feldhusen, J.; Grote, K.-H. Engineering Design—A Systematic Approach; Springer: London, UK, 2007. [Google Scholar]
  39. Hsu, W.; Liu, B. Conceptual design: Issues and challenges. Comput. Des. 2000, 32, 849–850. [Google Scholar] [CrossRef]
  40. Deng, Y.-M.; Tor, S.B.; Britton, G.A. A dual-stage functional modelling framework with multi-level design knowledge for conceptual mechanical design. J. Eng. Des. 2000, 11, 347–375. [Google Scholar] [CrossRef]
  41. Bietresato, M.; Mazzetto, F. Definition of the Layout for a New Facility to Test the Static and Dynamic Stability of Agricultural Vehicles Operating on Sloping Grounds. Appl. Sci. 2019, 9, 4135. [Google Scholar] [CrossRef] [Green Version]
  42. Bietresato, M.; Mazzetto, F. Proposal of an advanced facility to perform static and dynamic tests of stability on agricultural machines. Chem. Eng. Trans. 2017, 58, 151–156. [Google Scholar]
  43. OECD (Organization for Economic Co-operation and Development) Code 4—OECD Standard Code for the Official Testing of Protective Structures on Agricultural and Forestry Tractors (Static Test); OECD: Paris, France, 2020.
  44. Fu, C.; Xu, Y.; Yang, Y.; Lu, K.; Gu, F.; Ball, A. Response analysis of an accelerating unbalanced rotating system with both random and interval variables. J. Sound Vib. 2020, 466, 115047. [Google Scholar] [CrossRef]
  45. Kulikowski, K.; Szpica, D. Determination of directional stiffnesses of vehicles’ tires under a static load operation. Maint. Reliab. 2014, 16, 66–72. [Google Scholar]
  46. FEDERUNACOMA—Federazione Nazionale Costruttori Macchine per l’Agricoltura/Italian Agricultural Machinery Manufacturers Federation Annuari FEDERUNACOMA. Available online: http://www.federunacoma.it/en/index.php (accessed on 2 April 2020).
  47. Bietresato, M.; Calcante, A.; Mazzetto, F. A neural network approach for indirectly estimating farm tractors engine performances. Fuel 2015, 143, 144–154. [Google Scholar]
  48. CNH Industrial New Holland—Agricultural & Farm Machinery. Available online: https://agriculture.newholland.com/eu/en-uk?market=uk (accessed on 1 April 2020).
  49. Istituto per la Meccanizzazione Agricola. Test in Accordance with the OECD Code 1 for the Official Testing of Agricultural Tractors—New Holland TL 90 4WD—OECD Approval No.: 1/1915—Report No. 2648/T/2000; Consiglio Nazionale delle Ricerche—Istituto per la Meccanizzazione Agricola: Torino, Italy, 2000. [Google Scholar]
  50. Bietresato, M.; Bisaglia, C.; Merola, M.; Brambilla, M.; Cutini, M.; Mazzetto, F. An application of morphometry to artificial systems: The evolutionary study of farm tractors. Chem. Eng. Trans. 2017, 58, 145–150. [Google Scholar]
  51. ETRTO—European Tyre and Rim Technical Organisation. Standards Manual 2020; ETRTO—European Tyre and Rim Technical Organisation: Brussels, Belgium, 2020. [Google Scholar]
  52. Gorshkov, Y.G.; Starunova, I.N.; Kalugin, A.A.; Troyanovskaya, I.P. Investigation of the slope angle influence on the loading imbalance of the wheeled vehicle sides and the change in the center of gravity vector direction. J. Phys. Conf. Ser. 2019, 1177, 012005. [Google Scholar] [CrossRef]
  53. Brassart, F.P.; Wright, M.E. A Machine to Study Vertical Tire Stiffness and Damping Coefficient; SAE Technical Papers; SAE International: Warrendale, PA, USA, 1993. [Google Scholar]
  54. Anifantis, A.S.; Cutini, M.; Bietresato, M. An Experimental–Numerical Approach for Modelling the Mechanical Behaviour of a Pneumatic Tyre for Agricultural Machines. Appl. Sci. 2020, 10, 3481. [Google Scholar] [CrossRef]
Figure 1. Embodiment design of the inclinable turntable, useful to present the main features that this test rig has ((a) with only the support plane inclined; (b) with the support plane inclined and after a rotation of the rotating subsystem). In the same picture the reference frame xSP-ySP-zSP-CoR, fixed to the turntable (NB: different from the reference frame of the vehicle placed on it) and the operative angles α and β are also visible.
Applsci 10 03786 g001
Figure 2. The approach followed in the prediction of experimental outputs in the two operative modes for the test rig illustrated in this paper.
Applsci 10 03786 g002
Figure 3. (a) lateral inclination of an agricultural machine, the imposed angle α corresponds to the roll angle φ; (b) frontal inclination of an agricultural machine, the imposed angle α is the pitch angle ϑ; (c) general inclination of an agricultural machine, the two set angles α and β′ impose angles of roll φ, pitch ϑ and yaw ψ to the vehicle under test.
Applsci 10 03786 g003
Figure 4. Forces acting on a tractor that is placed motionless on an inclined slope, with the longitudinal axis perpendicular to the maximum slope direction (view from the rear of the tractor).
Applsci 10 03786 g004
Figure 5. Farm tractor with different widths at the front and rear tracks: in this case L and R are the extremal points and 2 the length (i.e., the vehicle width) of the segment perpendicular to the longitudinal axis in correspondence of the projection of the center of gravity (CoG′).
Applsci 10 03786 g005
Figure 6. Placement of the tractor frame of reference.
Applsci 10 03786 g006
Figure 7. Axial (a,b) and angular (c,d) misalignments of a tractor frame of reference with respect to the turntable frame of reference. Please note that each of these scenarios will result in the same weight distribution on the quadrants.
Applsci 10 03786 g007
Figure 8. (a) Main dimensions characterizing the positions of the load cells on the support plane; (b) dimensions characterizing a vehicle (here: a conventional farm tractor) and position of the CoG projection on the support plane (i.e., of CoG′); (c) real test situation.
Applsci 10 03786 g008
Figure 9. Shift of CoG′ downstream as a consequence of the inclination of the support plane; in the represented case the transversal axis of the tractor (yt) is parallel and opposite to ySP.
Applsci 10 03786 g009
Figure 10. Procedure for positioning the CoG/CoG′ on the support plane frame of reference; (a) starting from the CoG/CoG′ position on the vehicle, (b) the vehicle reference frame (in red) is placed and (c) the coordinates of the CoG are then written in the support plane reference frame.
Applsci 10 03786 g010
Figure 11. Determination of the trajectories followed by CoG′ during a complete rotation of the turntable around rp when the support plane is inclined at an angle α; (a) starting situation; (b) trajectories described by CoG′ around CoG″ for a complete (counter-clockwise) rotation of the turntable around CoR (or, better, around the axis passing through CoR and CoR″, perpendicular to the support plane). The numerical sequence of the subscripts indicates the direction of the travel of CoG′.
Applsci 10 03786 g011
Figure 12. Distances of the CoG′ from the front/rear axles, and from the left and right wheels.
Applsci 10 03786 g012
Figure 13. Graphical representation of the effect of a pure compression of the tyres due to the weight component in the direction perpendicular to the support plane, supported by each tyre ((a) initial situation–tyres not deformed; (b) final situation–tyres deformed).
Applsci 10 03786 g013
Figure 14. Graphical representation of the three-dimensional effect of a pure compression of the tyres due to the weight component in the direction perpendicular to the support plane, supported by each tyre. In the represented case, the FL tyre is the downstream tyre.
Applsci 10 03786 g014
Figure 15. Graphical representation of the effect of a pure lateral solicitation of the tyres due to the weight component in the direction parallel to the support plane, supported by each tyre ((a) initial situation–tyres not deformed; (b) final situation–tyres deformed).
Applsci 10 03786 g015
Figure 16. Graphical representation of the three-dimensional effect of a lateral deflection of the tyres due to the weight component in the direction parallel to the support plane and to the rotational axes of the wheels. In the represented case, the FL tyre is the downstream tyre.
Applsci 10 03786 g016
Figure 17. Locus of the positions of CoG′ in the frame of reference fixed to the turntable, when the turntable does a complete counter-clockwise rotation around its rotation axis (i.e., the origin of the reference frame) for (a) α = 20.00° and (b) α = 37.73°. The blue arrow indicates the direction of rotation of the support platform (the ySP axis is oriented as in the figures only at the beginning, then rotates accordingly to the blue arrow); the red arrow instead indicates the direction of travel of the locus of the positions of CoG′ (the initial point is the one evidenced, then it moves clockwise along the red circumference). The red cross indicates the position of CoG″ (NB: not coincident with the origin).
Applsci 10 03786 g017
Figure 18. (a) forces normal to the four quadrants that support the vehicle during a complete rotation of the turntable for α = 20.00°; (b) percentage decomposition of the total weight on the four quadrants/wheels for α = 20.00°.
Applsci 10 03786 g018
Figure 19. (a) forces normal to the four quadrants that support the vehicle during a complete rotation of the turntable for α = 37.73°; (b) percentage decomposition of the total weight on the four quadrants/wheels for α = 37.73°. In the lower part of the picture there are two enlargements of the Cartesian planes close to the abscissae axis.
Applsci 10 03786 g019
Figure 20. Locus of the positions of CoG′ in the frame of reference fixed to the turntable, when the turntable does a complete counter-clockwise rotation around its rotation axis (i.e., the origin of the reference frame) for (a) α = 20.00°, (b) α = 33.95° and (c) α = 37.73°. The blue arrow indicates the direction of rotation of the support platform (the ySP axis is oriented as in the figures only at the beginning, then rotates accordingly to the blue arrow); the orange arrow instead indicates the direction of travel of the locus of the positions of CoG′ (the initial point is the one evidenced, then it moves clockwise along the orange circumference). It is reported for proper comparisons also the locus of the positions of CoG′ in case of non-deformable tyres. The red cross indicates the position of CoG″ (NB: not coincident with the origin).
Applsci 10 03786 g020
Figure 21. (a) forces normal to the four quadrants that support the vehicle during a complete rotation of the turntable for α = 20.00°; (b) percentage decomposition of the total weight on the four quadrants/wheels for α = 20.00°.
Applsci 10 03786 g021
Figure 22. (a) forces normal to the four quadrants that support the vehicle during a complete rotation of the turntable for α = 33.95°; (b) percentage decomposition of the total weight on the four quadrants/wheels for α = 33.95°. In the lower part of the picture there are two enlargements of the Cartesian planes close to the abscissae axis.
Applsci 10 03786 g022
Figure 23. Structure simplification process of the test rig (ac); 3D rendering of the test installation currently under development (d) and exemplification of its kinematic mechanism to incline the support platform, placed under the ground plane, requiring a pit of adequate size to operate (e).
Applsci 10 03786 g023
Table 1. possible scenarios that can be experimented by a vehicle placed on an inclinable platform (angles α and β′).
Test ScenarioPure Lateral InclinationPure Frontal InclinationGeneric Inclination (Realistic Situation)
Characteristic angles of the vehicle in the frame of reference of the test system (support plane inclination, vehicle longitudinal axis direction)(α, ±90°)(α, 0°/±180°)(α, β′)
Characteristic angles of vehicle (roll, pitch, yaw)(φ, 0, 0) = (α, 0, 0)(0, ϑ, 0) = (0, α, 0)(φ, ϑ, ψ)
Test able to generate the described scenarioTraditional test; turntable test
(in partic.: global completely static tests with β′ = ±90°)
Traditional test; turntable test
(in partic.: global completely static tests with β′ = 0° or ±180°)
Turntable test
(in partic.: global completely static tests, global quasi-static test)
Table 2. Main technical characteristics of a “New Holland TL 90 4WD” farm tractor.
QuantitySymbolValueUnit
Support polygon dimensionsWheelbaseWB2314mm
Front track widthFT1305mm
Rear track widthRT1350mm
CoG positionCoG heighth850mm
CoG distance from the rear axledR965mm
CoG distance from the longitudinal axis
(leftward if seen from the rear part)
dF8mm
Total mass m3820kg
Table 3. Coordinates of the main points of the tractor.
PointCoordinates Quadrant
xSP (mm)ySP (mm)
CoGProjection of CoG on the support surface when this is horizontal+0.0−8.01–4
FRCentre of the front right wheel−1349.0+652.52
FLCentre of the front left wheel−1349.0−652.53
RRCentre of the rear right wheel+965.0+675.01
RLCentre of the rear left wheel+965.0−675.04
Table 4. Results from the simulated static test (at three different inclinations: 0.00°, 20.00° and 37.73°).
QuantityMeas. Unitα
0.00°20.00°37.73°
WFR (≡ W2)N771738400
WFL (≡ W3)N790510,84012,356
WRR (≡ W1)N10,78853680
WRL (≡ W4)N11,05115,15417,273
Normal force (∑Wi)N37,46135,20229,629
WA ( = W2 + W3; front part of the tractor)N15,62214,68012,356
WB ( = W1 + W4; rear part of the tractor)N21,83920,52217,273
WC ( = W1 + W2; right part of the tractor)N18,50692090
WD ( = W3 + W4; left part of the tractor)N18,95625,99429,629
x(CoG′)SPmm0.00.00.0
y(CoG′)SPmm−8.0−317.4−665.6
Table 5. Maximum and minimum values recorded during a complete rotation of the turntable for α = 20.00° and α = 37.73° (incipient rollover).
Wheels Loads (N)Wheels Load Distribution (%)
WFRWFLWRRWRLWFR,%WFL,%WRR,%WRL,%
20.00°min360137555210544610.210.714.815.5
max11,91012,12115,86216,14133.834.445.145.9
37.73°min014902080.00.50.00.7
max15,51815,72919,80120,06852.453.166.867.7
Table 6. Characteristics of the tyres equipping the “New Holland TL 90 4WD” farm tractor.
Tyre DenominationRim Diameter (in.)Load Index (-)Overall Diameter (mm)Load Capacity (kgf)Nominal Inflation Press (bar)Speed Radius Index (-)
14.9–2424126124517001.6600
18.4–3434144164528001.6775
Table 7. Maximum and minimum values recorded during a complete rotation of the turntable for α = 20.00° and α = 33.95° (incipient rollover).
Wheels Loads (N)Wheels Load Distribution (%)
WFRWFLWRRWRLWFR,%WFL,%WRR,%WRL,%
20.00min31823338460148439.09.513.113.8
max12,44612,66916,61816,89935.436.047.248.0
33.95min016302280.00.50.00.7
max15,86916,10220,39420,68651.151.865.666.6

