Article

Research on Fatigue Properties of Typical Welded Joints of DH36 Steel at −60 °C

Department of Shipbuilding Engineering, Harbin Engineering University, Harbin 150001, China
*
Author to whom correspondence should be addressed.
Appl. Sci. 2020, 10(11), 3742; https://doi.org/10.3390/app10113742
Submission received: 28 April 2020 / Revised: 23 May 2020 / Accepted: 25 May 2020 / Published: 28 May 2020
(This article belongs to the Section Mechanical Engineering)

Abstract

:
As the development of the polar region continues to increase, the fatigue properties of structures at low temperature are increasingly receiving researcher attention. This study aimed to investigate the fatigue properties of T-welded and cruciform welded joints at −60 °C. Logarithmic S–N curves based on the hot-spot stress of the T-welded and cruciform welded joints at 50% and 95% confidence levels were obtained at −60 °C. The test results showed that the fatigue properties of T-welded joints were almost 2–7% better than those of the cruciform welded joints at −60 °C. Factors that affected the fatigue properties of welded joints, such as the stress concentration factor, microstructure, Vickers hardness profiles, and fractography, were also studied and the test results showed that the fatigue properties of cruciform welded joints at −60 °C were 57.215% better than at room temperature.

1. Introduction

Fatigue is a common failure mode of ship structures [1]. The widespread use of high-strength steel in recent years has directed the attention of researchers to the fatigue failure of ship structures. Fricke investigated the fatigue properties of two types of ship structure and observed that T-welded and cruciform welded joints are prone to fatigue resulting from high cyclic loads [2].
T-welded and cruciform welded joints are commonly-used welded joints in polar ships. Cruciform welded joints can simulate the intersections between longitudinal and transverse web frames in ships, and T-welded joints can simulate the intersections of longitudinal and transverse bulkheads in ships [3]. The fatigue properties of welded components have been studied by many researchers [4,5]. However, most of these studies evaluated the fatigue properties of these welded components at room temperature, and the parameters obtained at room temperature are not appropriate for fatigue evaluation at low temperature [5].
For ships navigating in ice fields, low-temperature-induced fatigue damage is a highly relevant issue. Chai and Leira [6] studied the fatigue damage of icebreakers based on the ice-induced loads and found that the fatigue damage caused by ice-induced loads deserves attention, which means that extremely harsh environments and conditions will present new challenges to the fatigue properties of the structure [7].
According to the regulations published by the China Classification Society (CCS) [8], DH36 steel can be used in marine structural components at −60 °C environments. A similar description can also be found in the specification “Ships for Navigation in Ice”, published by DNV GL [9]. Hence, the study of low temperature fatigue of DH36 steel at −60 °C has great practical significance for the evaluation of fatigue properties of polar ships. The fatigue properties of steel and its weld can be affected by ambient temperature [10,11,12,13,14]. For example, Carpinteri and Brighenti carried out fatigue tests of metallic alloys S275 J2 and Al7075 T6 at low temperatures [10]. Zhao and Feng found the fatigue crack behavior of DH36 steel and its butt weld is temperature-dependent [13,14]. Although the effect on the fatigue properties of steels at low temperatures is well documented, there are few experimental data of fatigue properties of T-welded and cruciform welded joints of DH36 steel at low temperatures available. Therefore, the research on the fatigue properties of T-welded and cruciform welded joints of DH36 steel at −60 °C deserves to be studied.
The fatigue properties of welded joints can be analyzed by many factors, such as the stress concentration factor, microstructure, Vickers hardness, and fractography. These factors can be divided into structural perspective, material perspective, and fractography. From the structural perspective, the stress concentration factor plays an important role in determining the fatigue properties [15]. A structure with a higher stress concentration factor is more prone to crack, and the crack propagation rate is also higher [16]. From the material perspective, the microstructure can reflect the fatigue properties of the structure [17]. Casagrande proposed a method to predict the fatigue limit using Vickers hardness measurements and verified the good correlation between Vickers hardness and fatigue properties [18]. Kramer developed a new short-time procedure named PHYBALCHT which can evaluate fatigue properties of metallic materials based on cyclic hardness indentation tests [19]. Koyama investigated the fatigue properties and associated crack growth behaviors of as-hot-rolled and solution-treated Fe-30Mn-3Si-3Al twinning-induced plasticity (TWIP) steels. His results showed that fatigue crack behavior of this TWIP steel is related to the hardness [20]. These researchers observed that the Vickers hardness affects the fatigue properties. The fractography of structures with different fatigue properties is different. Therefore, one can analyze the fatigue properties by examining the fractography [21]. In this paper, all the factors mentioned above were analyzed with −60 °C ambient temperature to study the fatigue properties of T-welded and cruciform welded joints.
The aim of this study was to investigate the fatigue properties of T-welded and cruciform welded joints at −60 °C. The fatigue tests were performed at −60 °C, and the resulting S–N curves of the T-welded and cruciform welded joints were compared. After the fatigue tests, simulation based on the finite element method (FEM), optical micrographic observation, Vickers hardness tests at low temperature, and observation of the fracture surface were performed to compare fatigue properties of the T-welded and cruciform welded joints at −60 °C.

2. Material Descriptions

The material used for the specimens was DH36 steel (certified by American Bureau of Shipping). Specimens tested in this study were welded with the carbon dioxide arc welding process. The filler metal was CHE50 (J507) which was referenced to ISO 2560:2009 [22]. The chemical compositions of DH36 steel and filler metal are shown in Table 1 and Table 2. The name of the welding power source was CHAMP MIG 400 (ADOR). The height of weld toe was 6mm. Other main parameters of the welding procedure are given in Table 3.
The metallographic samples, cut from the welded joints, are shown in Figure 1a,b.
A welded joint can be divided into the welded zone (WZ), fusion zone (FZ), heat-affected zone (HAZ), and base metal (BM) [23]. As shown in Figure 2a,b fatigue failure of the specimen was predominantly located in the HAZ. Therefore, it was essential to study the microstructure of the HAZ. In this study, the microstructures of the T-welded and cruciform welded joints specimens were examined using SEM, and the various zones of the welded joints were classified.
In the welded zone, a large amount of bainite was observed, and it contained mixed martensite–austenite phases (an M/A island) (M/A island) [24]. During the formation of the M/A island, while ferrite was precipitated from the supercooled austenite, carbon was also formed in the supercooled austenite, which had not yet undergone the transformation and was gradually enriched. Carbon-rich austenite was formed because the carbon content was not sufficiently concentrated to reach the level of precipitated carbide. The carbon-rich austenite was mostly transformed into martensite during cooling, and a small amount of austenite remained, thereby forming an M/A island [25], as shown in Figure 3a and Figure 4a.
The fusion zone refers to the boundary zone between the weld and base metal and is also called the semi-melting zone. It is the zone where the weld metal transitions to the heat-affected zone in the welded joint [26]. The zone was very narrow, with the completely-melted weld zone and completely-infusible heat-affected zone on both sides, and the fusion zone was in the transition zone from the weld metal to the base metal in the zone close to the weld [13], as shown in Figure 3b and Figure 4b. The grains in this zone were coarse, and the chemical composition was very complex [13].
The zone of the base metal mainly consisted of flaky pearlite and quasi-polygonal ferrite [13], as shown in Figure 3d and Figure 4d.
Cross-sections of the welds revealed a significant microstructural change in the HAZ for both welded joints, as shown in Figure 3c and Figure 4c. The temperature in the HAZ was close to or below the critical temperature during welding. A certain amount of lath-like martensite was observed in the HAZ with staggered ferrite and M/A islands [27].
Comparing the HAZs of the T-welded and cruciform welded joints, it can be observed that more ferrite and granular bainite existed in the HAZ of the cruciform welded joints than that of the T-welded joints. Some researchers studied the relationship between fatigue properties and microstructures, and found that constituents of microstructures can affect the fatigue properties of material [27,28,29,30]. For example, Qiu found that ferrite and granular bainite can reduced the fatigue strength of material [30].

3. Fatigue Tests at Low Temperature

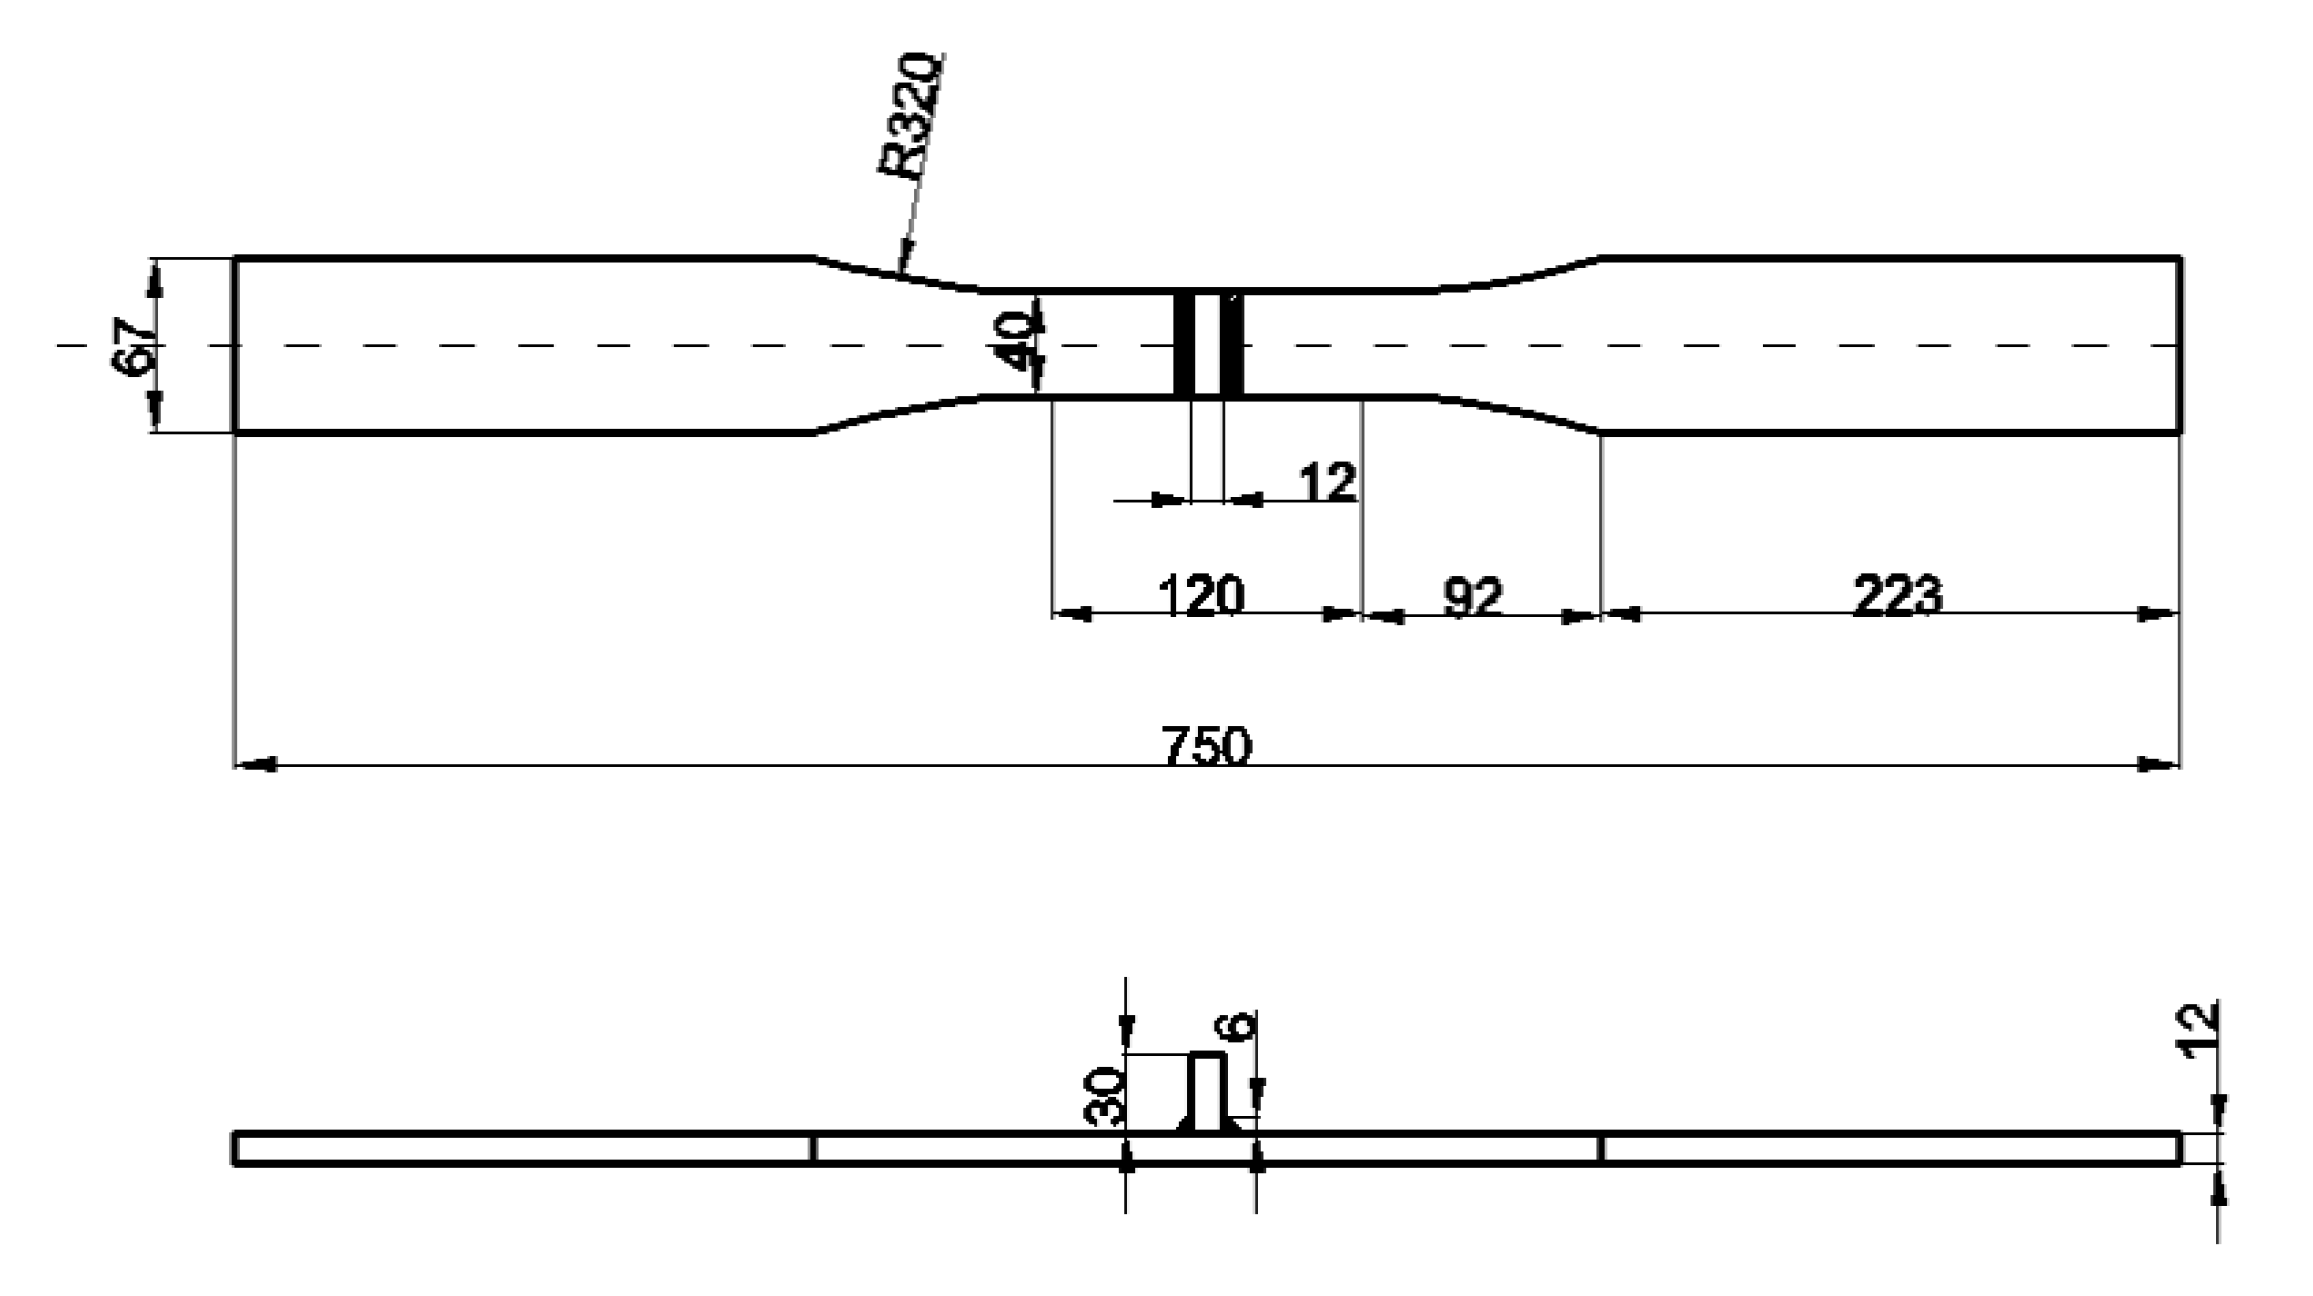
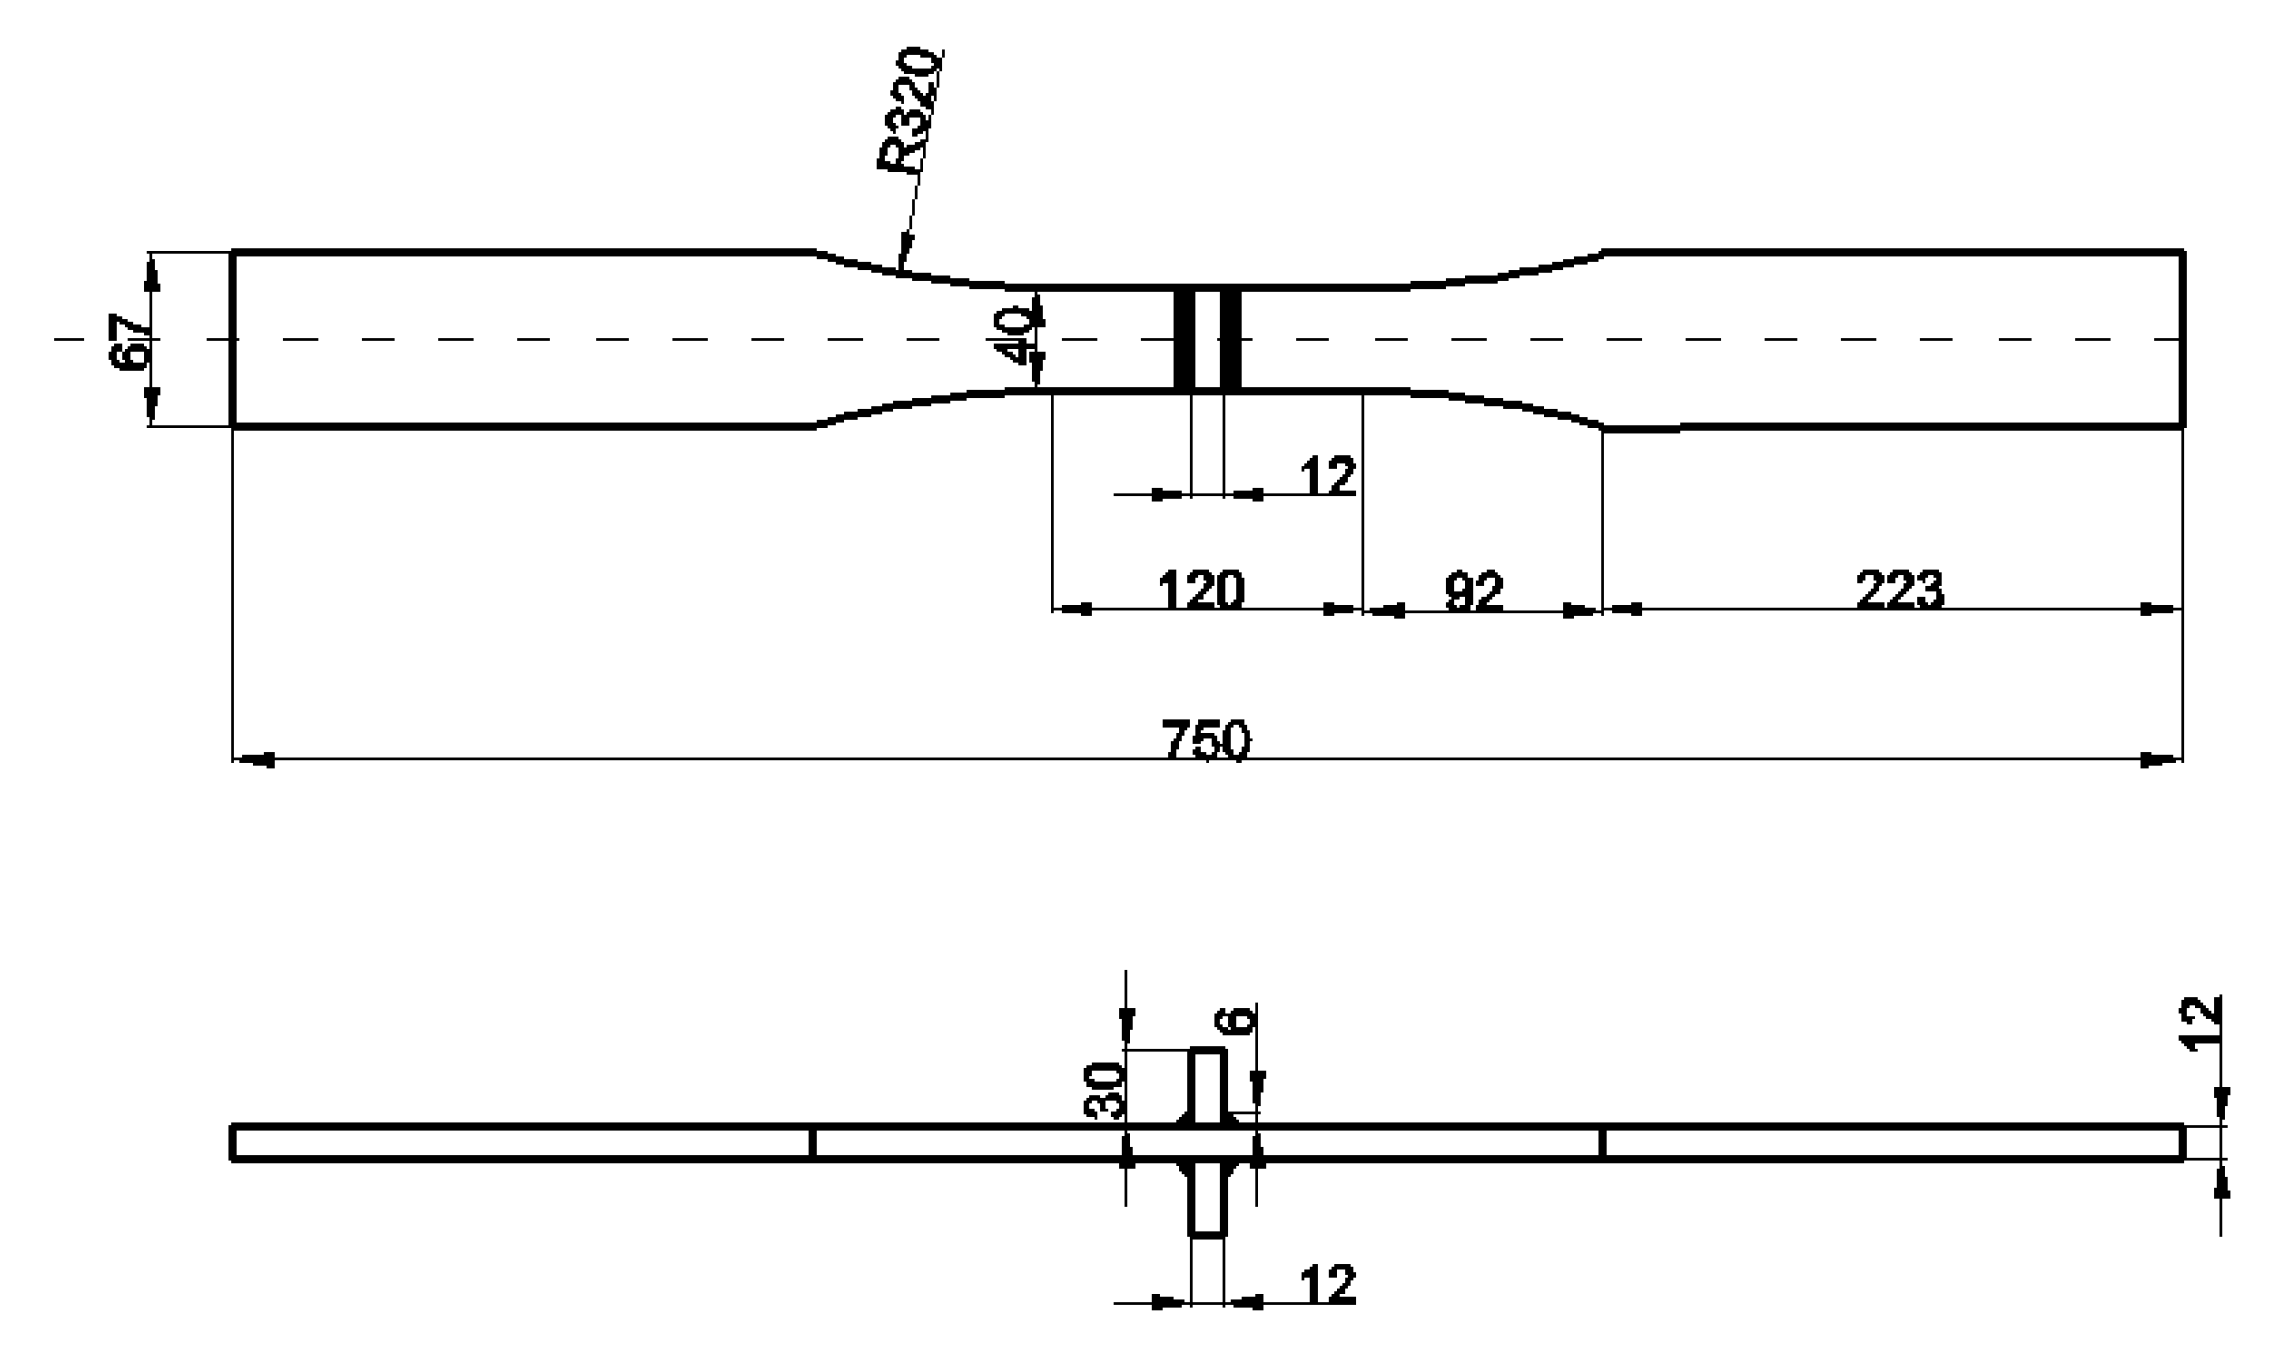
3.1. Design of Specimens

The specimens were designed by referring to ASTM E466-15 [31]. The size and geometry of the T-welded and cruciform welded joint specimens are shown in Figure 5 and Figure 6.

3.2. Loading

Fatigue tests were carried out using a testing machine, PWS-250, with a maximum dynamic load of 200 kN. The specimen was rigidly clamped at one end and loaded at the other end. The loading force was a sinusoidal tensile force with a stress ratio of 0.1, and the loading frequency was 9.5 Hz. The loading conditions of fatigue tests are shown as Table 4.
The fatigue tests were performed at −60 °C (±0.5 °C), and the temperature was created by a low environmental chamber (Figure 7a). During the cooling process from room temperature to −60 °C, the temperature changed dramatically, and the strain gauge with its own temperature compensation could produce a large temperature drift [32] after reaching the specified temperature, which would also cause a certain temperature drift, as shown in Figure 7b. The temperature drift affected the data measured by the strain gauges. Therefore, the strain gauges needed to be temperature-compensated in the low-temperature environment. The method used was to add a strain gauge (the strain gauge can be called a compensated strain gauge, Rd) that was the same as the working strain gauge. Then, the compensated strain gauge was attached to blocks of the same material as the specimen and formed a half-bridge circuit (Figure 7c), such that the temperature drift generated by the specimen could offset the temperature drift generated by the sample, as shown in Figure 7d.

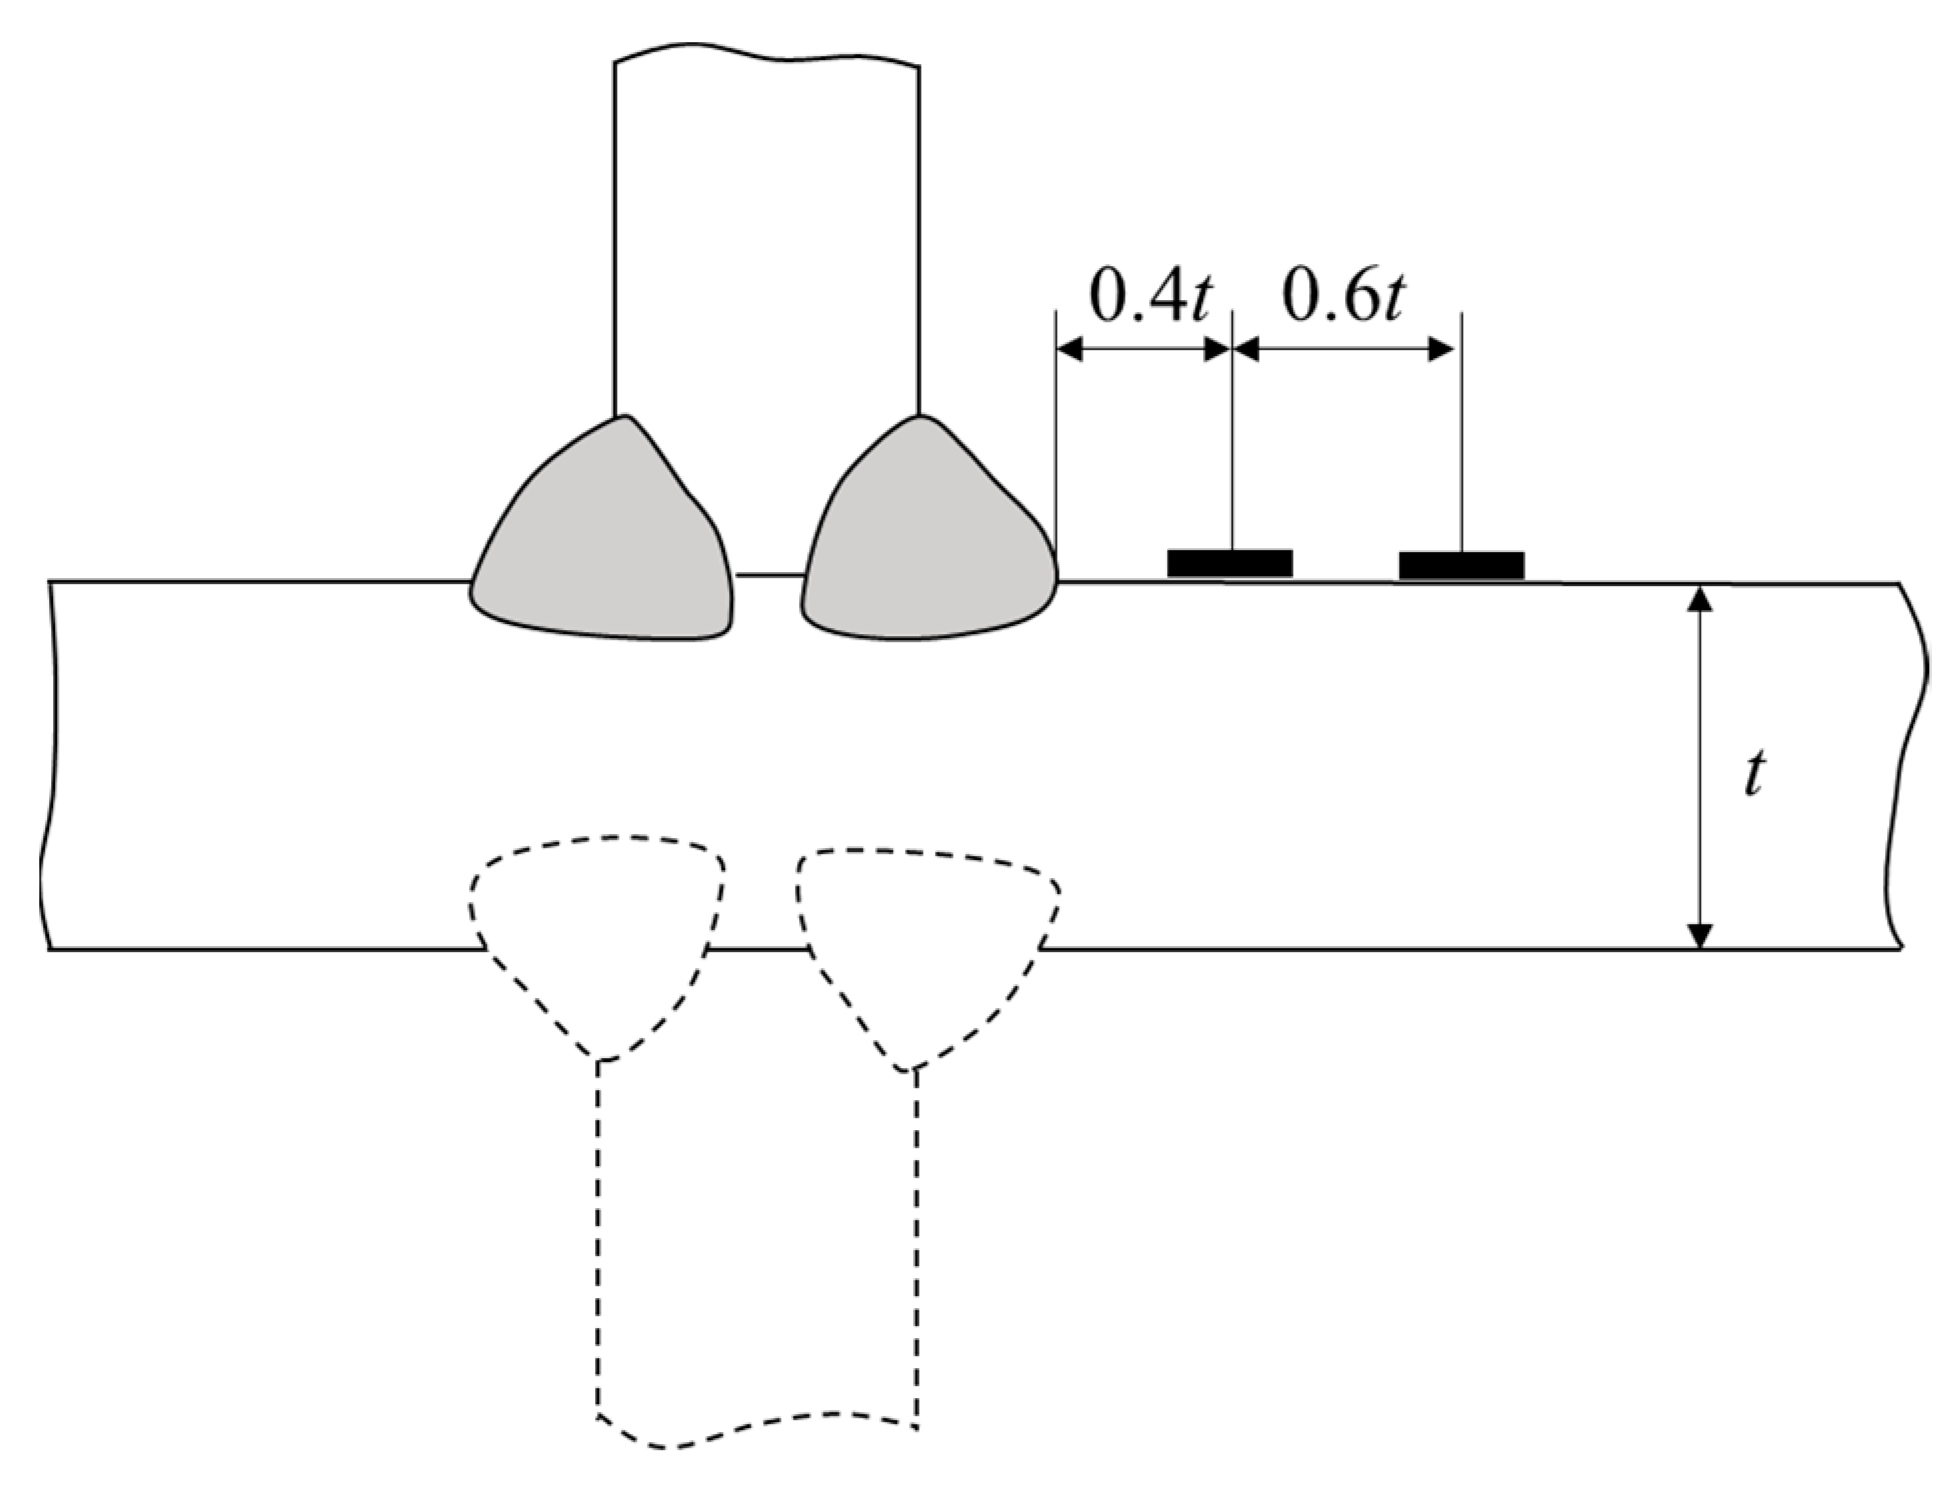
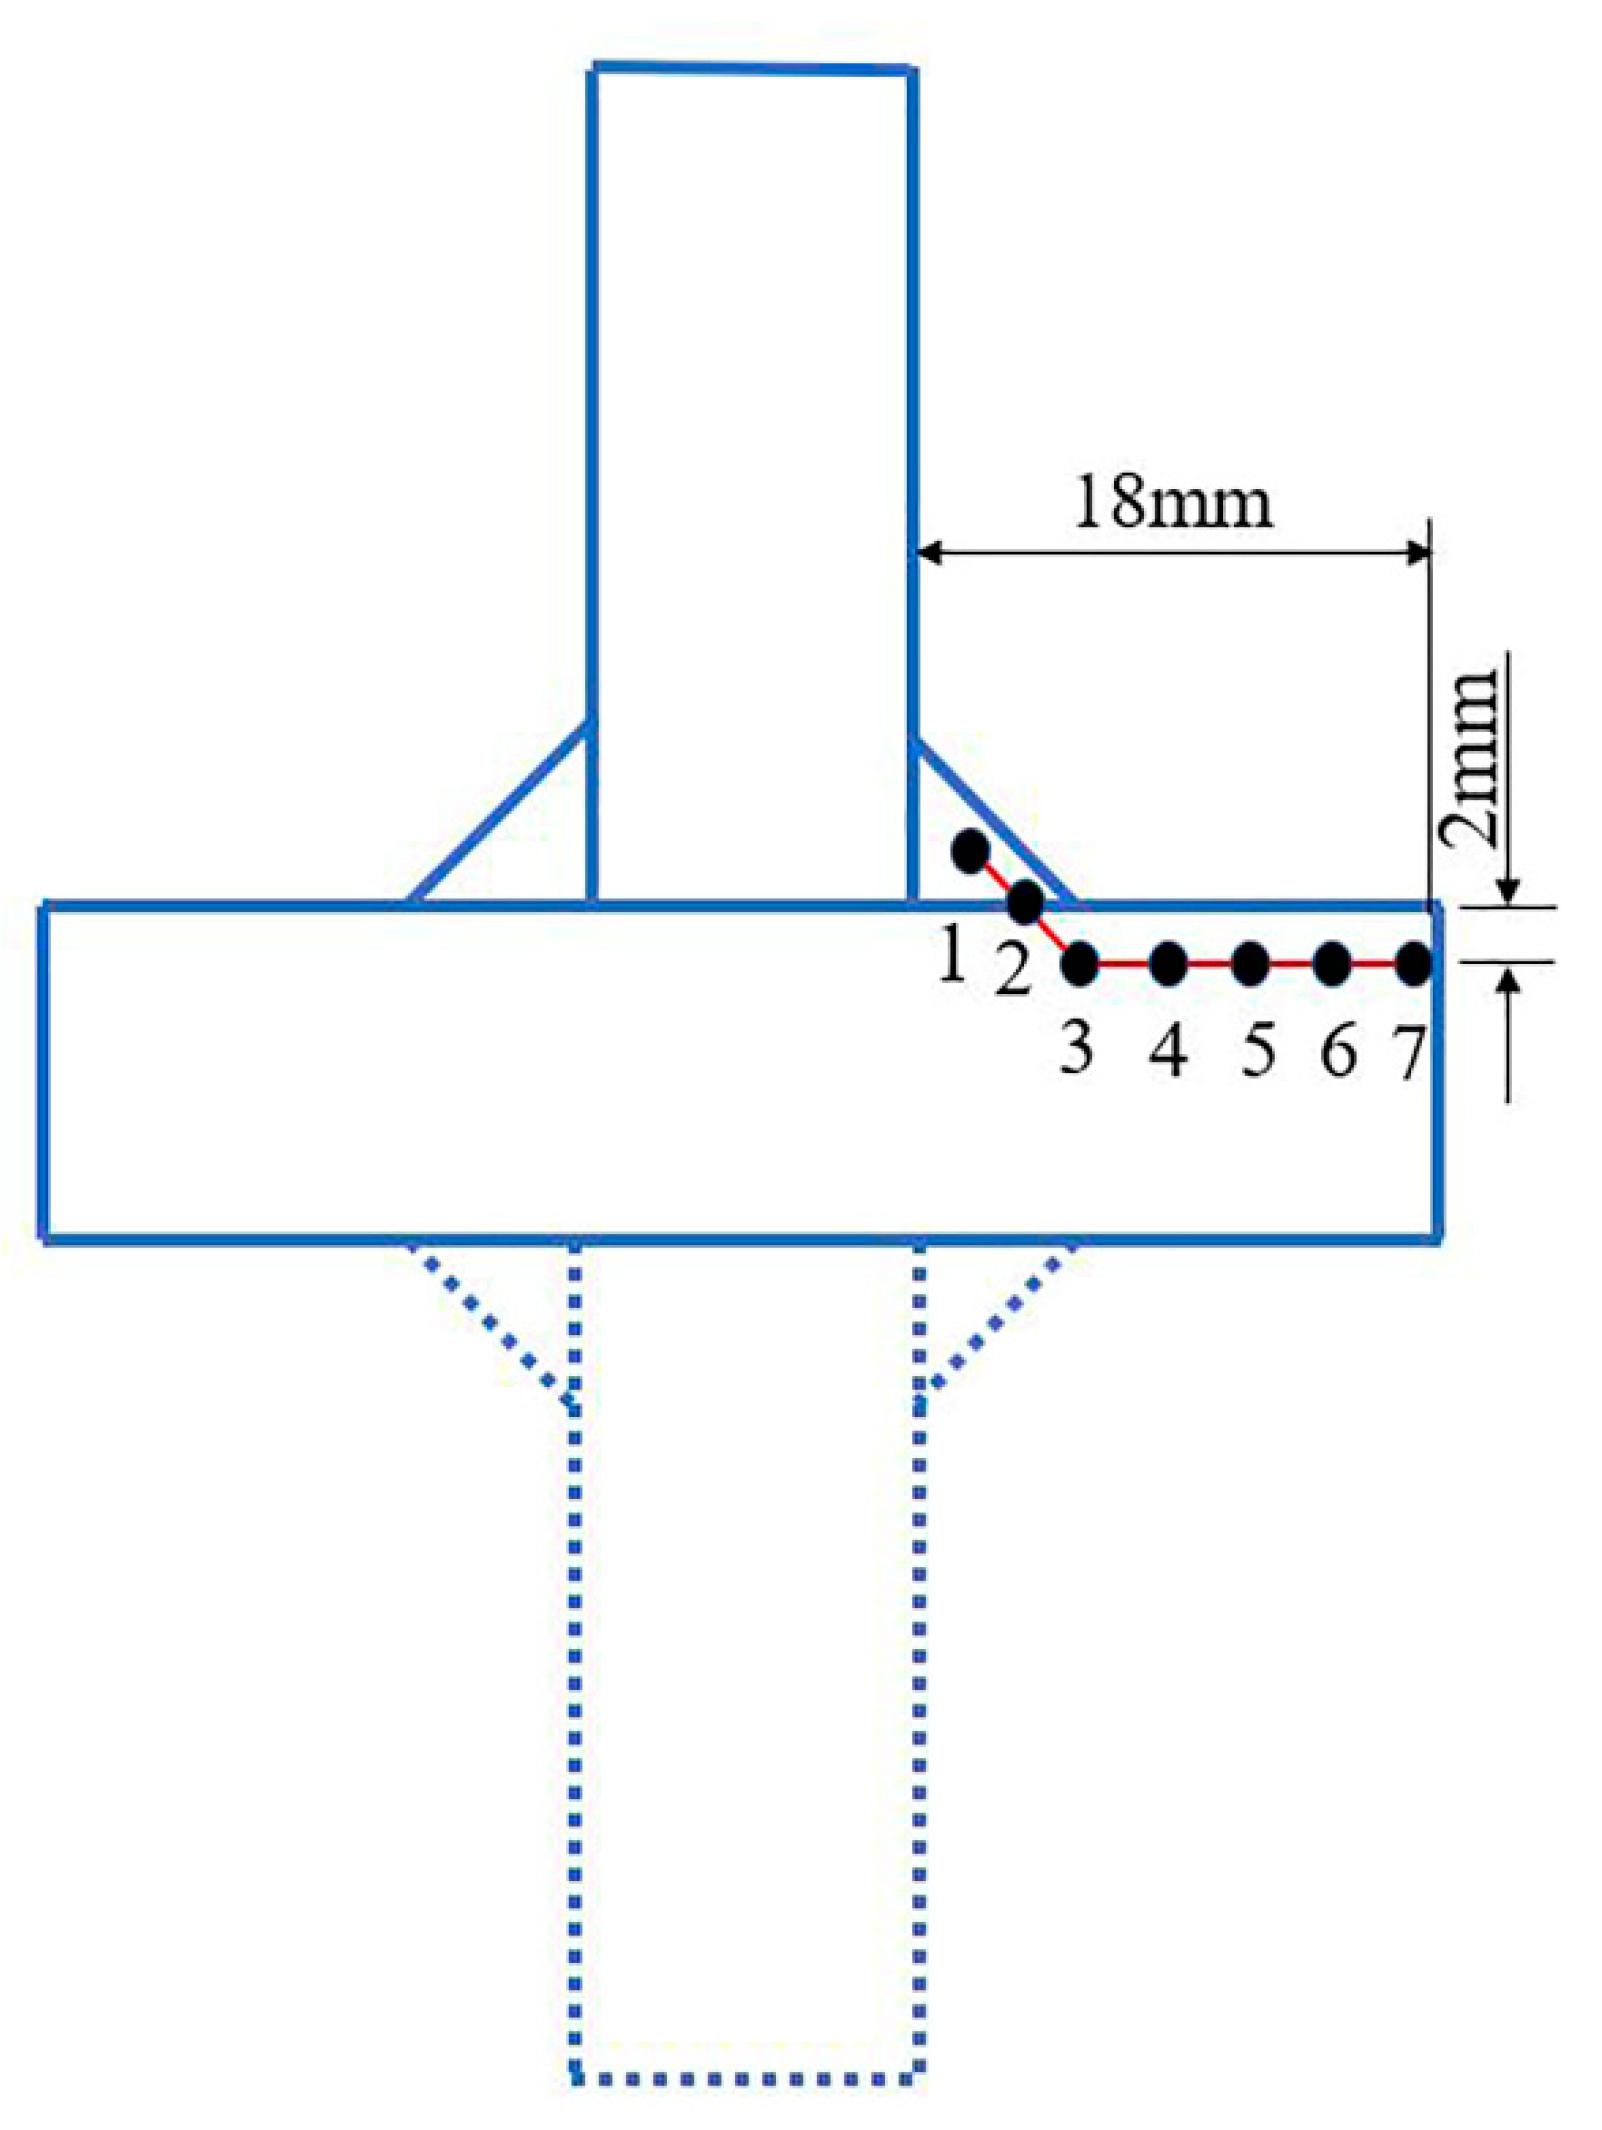
3.3. Determination of Hot-Spot Stress

The use of S–N curves based on the hot-spot stress was an effective approach for the fatigue design of welded components and structures [33,34]. The hot-spot stress was the stress at a weld toe obtained by a linear or quadratic extrapolation of stresses over two points in front of the weld toe under consideration [35]. The stress state of the fatigue tests was measured using strain gauges. According to the guidance document given by the International Institute of Welding [36], strain gauges were placed at a distance of 0.4t and 1.0t from the weld toe (Figure 8), and the linear stress was extrapolated to determine the hot-spot stress at the weld [36]. The hot-spot stress was calculated using Equation (1):
σ h o t = 1.67 σ 0.4 t 0.67 σ 1.0 t
where
  • σ h o t is the hot-spot stress,
  • σ 0.4 t is the stress at 0.4t,
  • σ 1.0 t is the stress at 1.0t,
  • t is the thickness of steel.

3.4. Data Processing

The distribution of the fatigue life at a given stress range is often subject to a lognormal distribution. A distribution test of the logarithmic fatigue life was performed, and the P-value (P-value is the probability of an error when accepting the null hypothesis) of the logarithmic fatigue life under each stress range was greater than 0.05, indicating that the logarithmic fatigue life in this study satisfied the normal distribution. Due to space limitations, only one stress level of the normality test of T- and cruciform welded joints is shown in Figure 9a,b. Under the premise that the logarithmic fatigue life obeyed the normal distribution, the S–N curve with different failure probability and confidence based on the normal distribution model could be obtained [37].
According to the guidance document given by the International Institute of Welding, “Recommendations for Fatigue Design of Welded Joints and Components” [36], if the number of specimens is less than ten or the test data were insufficient to obtain an accurate m , m can be taken to have a fixed value of 3.
The exponential form of the S–N curve is described by Equation (2):
S m N = A
Taking the logarithm on both sides of Equation (2), we obtain
m lg S + lg N = lg A
where,
  • S is the stress range,
  • N is the number of cycles,
  • m, A is the material parameters related to fatigue.
After m was determined, lg A could be fitted using the maximum likelihood method. The standard deviation of the logarithmic fatigue life was assumed to be S i under any stress range. The parameter lg A could then be estimated from the test data.
The maximum likelihood function is
L = i = 1 n 1 2 π σ lg N exp [ 1 2 σ lg N ( lg N i lg A + m lg S ) 2 ] = ( 1 2 π σ lg N ) n exp [ 1 2 σ lg N i = 1 n ( lg N i lg A + m lg S ) 2 ]
The estimated value of the parameter lg A ^ can be obtained using Equation (5):
lg A ^ = 1 n i = 1 n lg N i m n i = 1 n lg S
where
  • lg N ¯ is the average logarithmic value of the fatigue life, lg N ¯ = 1 n i = 1 n lg N i .
Taking lg N P f ( γ ) as the logarithmic fatigue life with probability of failure P f and confidence level γ . Among them, the probability of failure P f indicates the probability of failure when the life is N at a given stress level. The confidence level γ indicates the reliability of the probability of failure P f at a given stress level with a fatigue life of N. lg N P f ( γ ) is obtained as shown in Equation (6).
lg N P f ( γ ) = lg N ¯ + k σ lg N
where,
  • σ lg N is the standard deviation of the logarithmic fatigue life,
  • k is the unilateral tolerance coefficient, which can be determined from a probability book or related specifications [38], its value is related to the confidence level and failure probability.
By replacing lg N ¯ with lg N P f ( γ ) in Equation (5), the logarithmic fatigue life with a 50% and 95% confidence level under 10% failure probability could be obtained, as shown in Equation (6).

4. Results and Discussion

4.1. S–N Curves with Confidence Level

Based on fatigue tests at −60 °C, the test data of T- and cruciform welded joints were obtained. Then, the logarithmic S–N curve was confirmed based on data processing in Section 3.4, as shown in Table 5.
The logarithmic S–N curves of the two welded joints at the 50% and 95% confidence levels are shown in Figure 10a,b.
At the logarithmic stress range of 2.50 (316 MPa), it could be observed that the logarithmic fatigue life of the different welded joints was different under the same logarithmic stress range. For example, under the logarithmic stress range of 2.50 (316 MPa), the logarithmic fatigue life at the 50% confidence level of the T-welded joints ( lg N 1 ) was 5.632 (428,548 cycles), whereas that of the cruciform welded joints ( lg N 2 ) was 5.623 (419,759 cycles). Under the logarithmic stress range of 2.50 (316 MPa), the logarithmic fatigue life at the 95% confidence level of the T-welded joints ( lg N 3 ) was 5.587 (386,366 cycles), whereas that of the cruciform welded joints ( lg N 4 ) was 5.557 (360,579 cycles). In summary, it could be observed that the fatigue life of the T-welded joints at the 50% and 90% confidence level was longer than that of the cruciform welded joints.

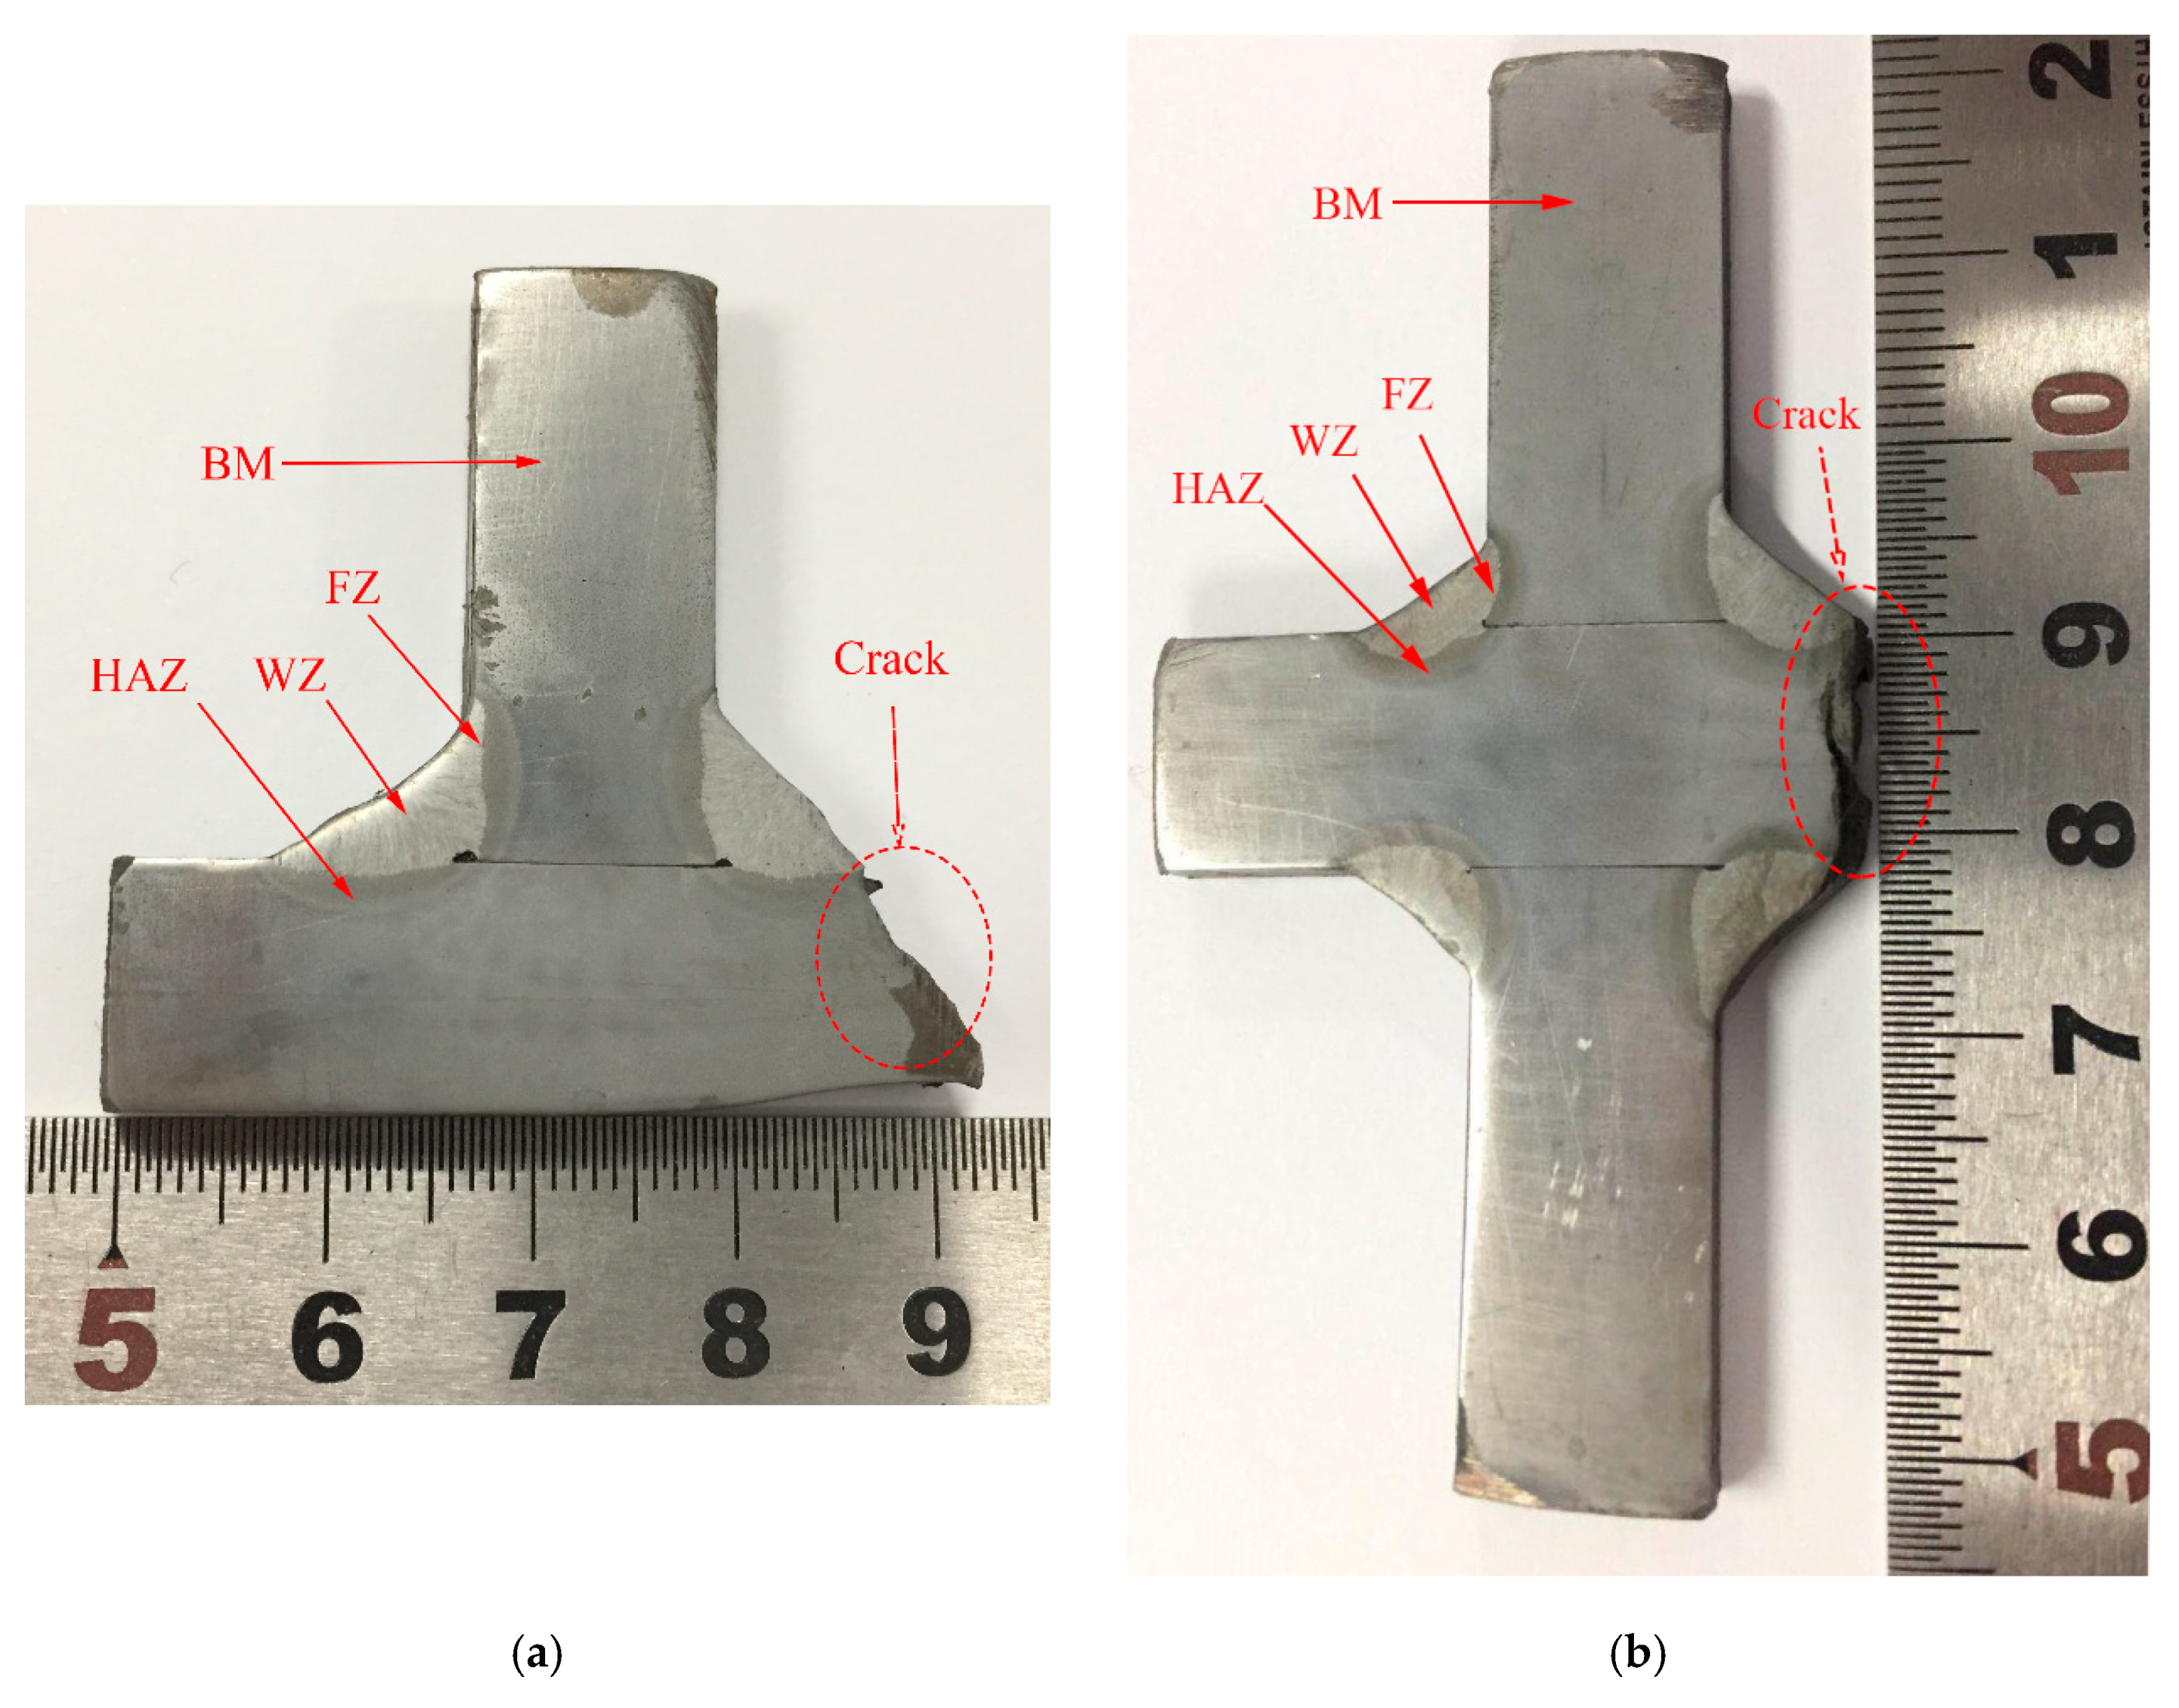
4.2. Structural Perspective

The fatigue properties of welded joints and the stress concentration factor, microstructure, and Vickers hardness have a close relationship. In this study, the fatigue properties of two types of welded joints at low temperature were analyzed from structural and material perspectives, and fractography.
Stress concentration phenomena are common in various engineering structures, and most of the structural damage is caused by stress concentration. Based on ABAQUS, finite element simulations of T-welded and cruciform welded joints (idealized model) were carried out to investigate the stress concentration factor (SCF) of the two welded joints (Figure 11). Modeling was performed using a three-dimensional solid C3D8R reduced integration element, and mesh refinement was performed at the weld toe of two welded joints. The low temperature material properties were, elastic modulus 214 GPa, yield strength 434 MPa, Poisson’s ratio 0.281, and density 7.85 g/cm3 [39]. One end of the model was rigidly fixed and the other end was applied with a tensile force of 150 kN.
The SCF can be obtained using Equation (7):
k = σ h o t σ n
where,
σ n is the nominal stress (the data of σ h o t and σ n were obtained from the tests in the current study).
Then the SCF of two welded joints were calculated and put in one table, as shown in Table 6. For the FEM, the hot-spot stress of cruciform welded joints was about 28.334 MPa higher than that of T-welded joints under the same load (150 kN). For tests at −60 °C, the hot-spot stress of cruciform welded joints was about 34.884 MPa higher than that of T-welded joints under the same load (150 kN). Both the FEM and the tests reflected that the SCF of cruciform welded joints is higher than that of T-welded joints. In addition, the error between the hot-spot stress obtained by FEM and the tests was less than 5%, which may have been caused by the measurement error in tests. Besides, the good consistency between the hot-spot stress obtained by FEM and the tests also verifies the reliability of the hot-spot stress obtained from the tests at −60 °C.

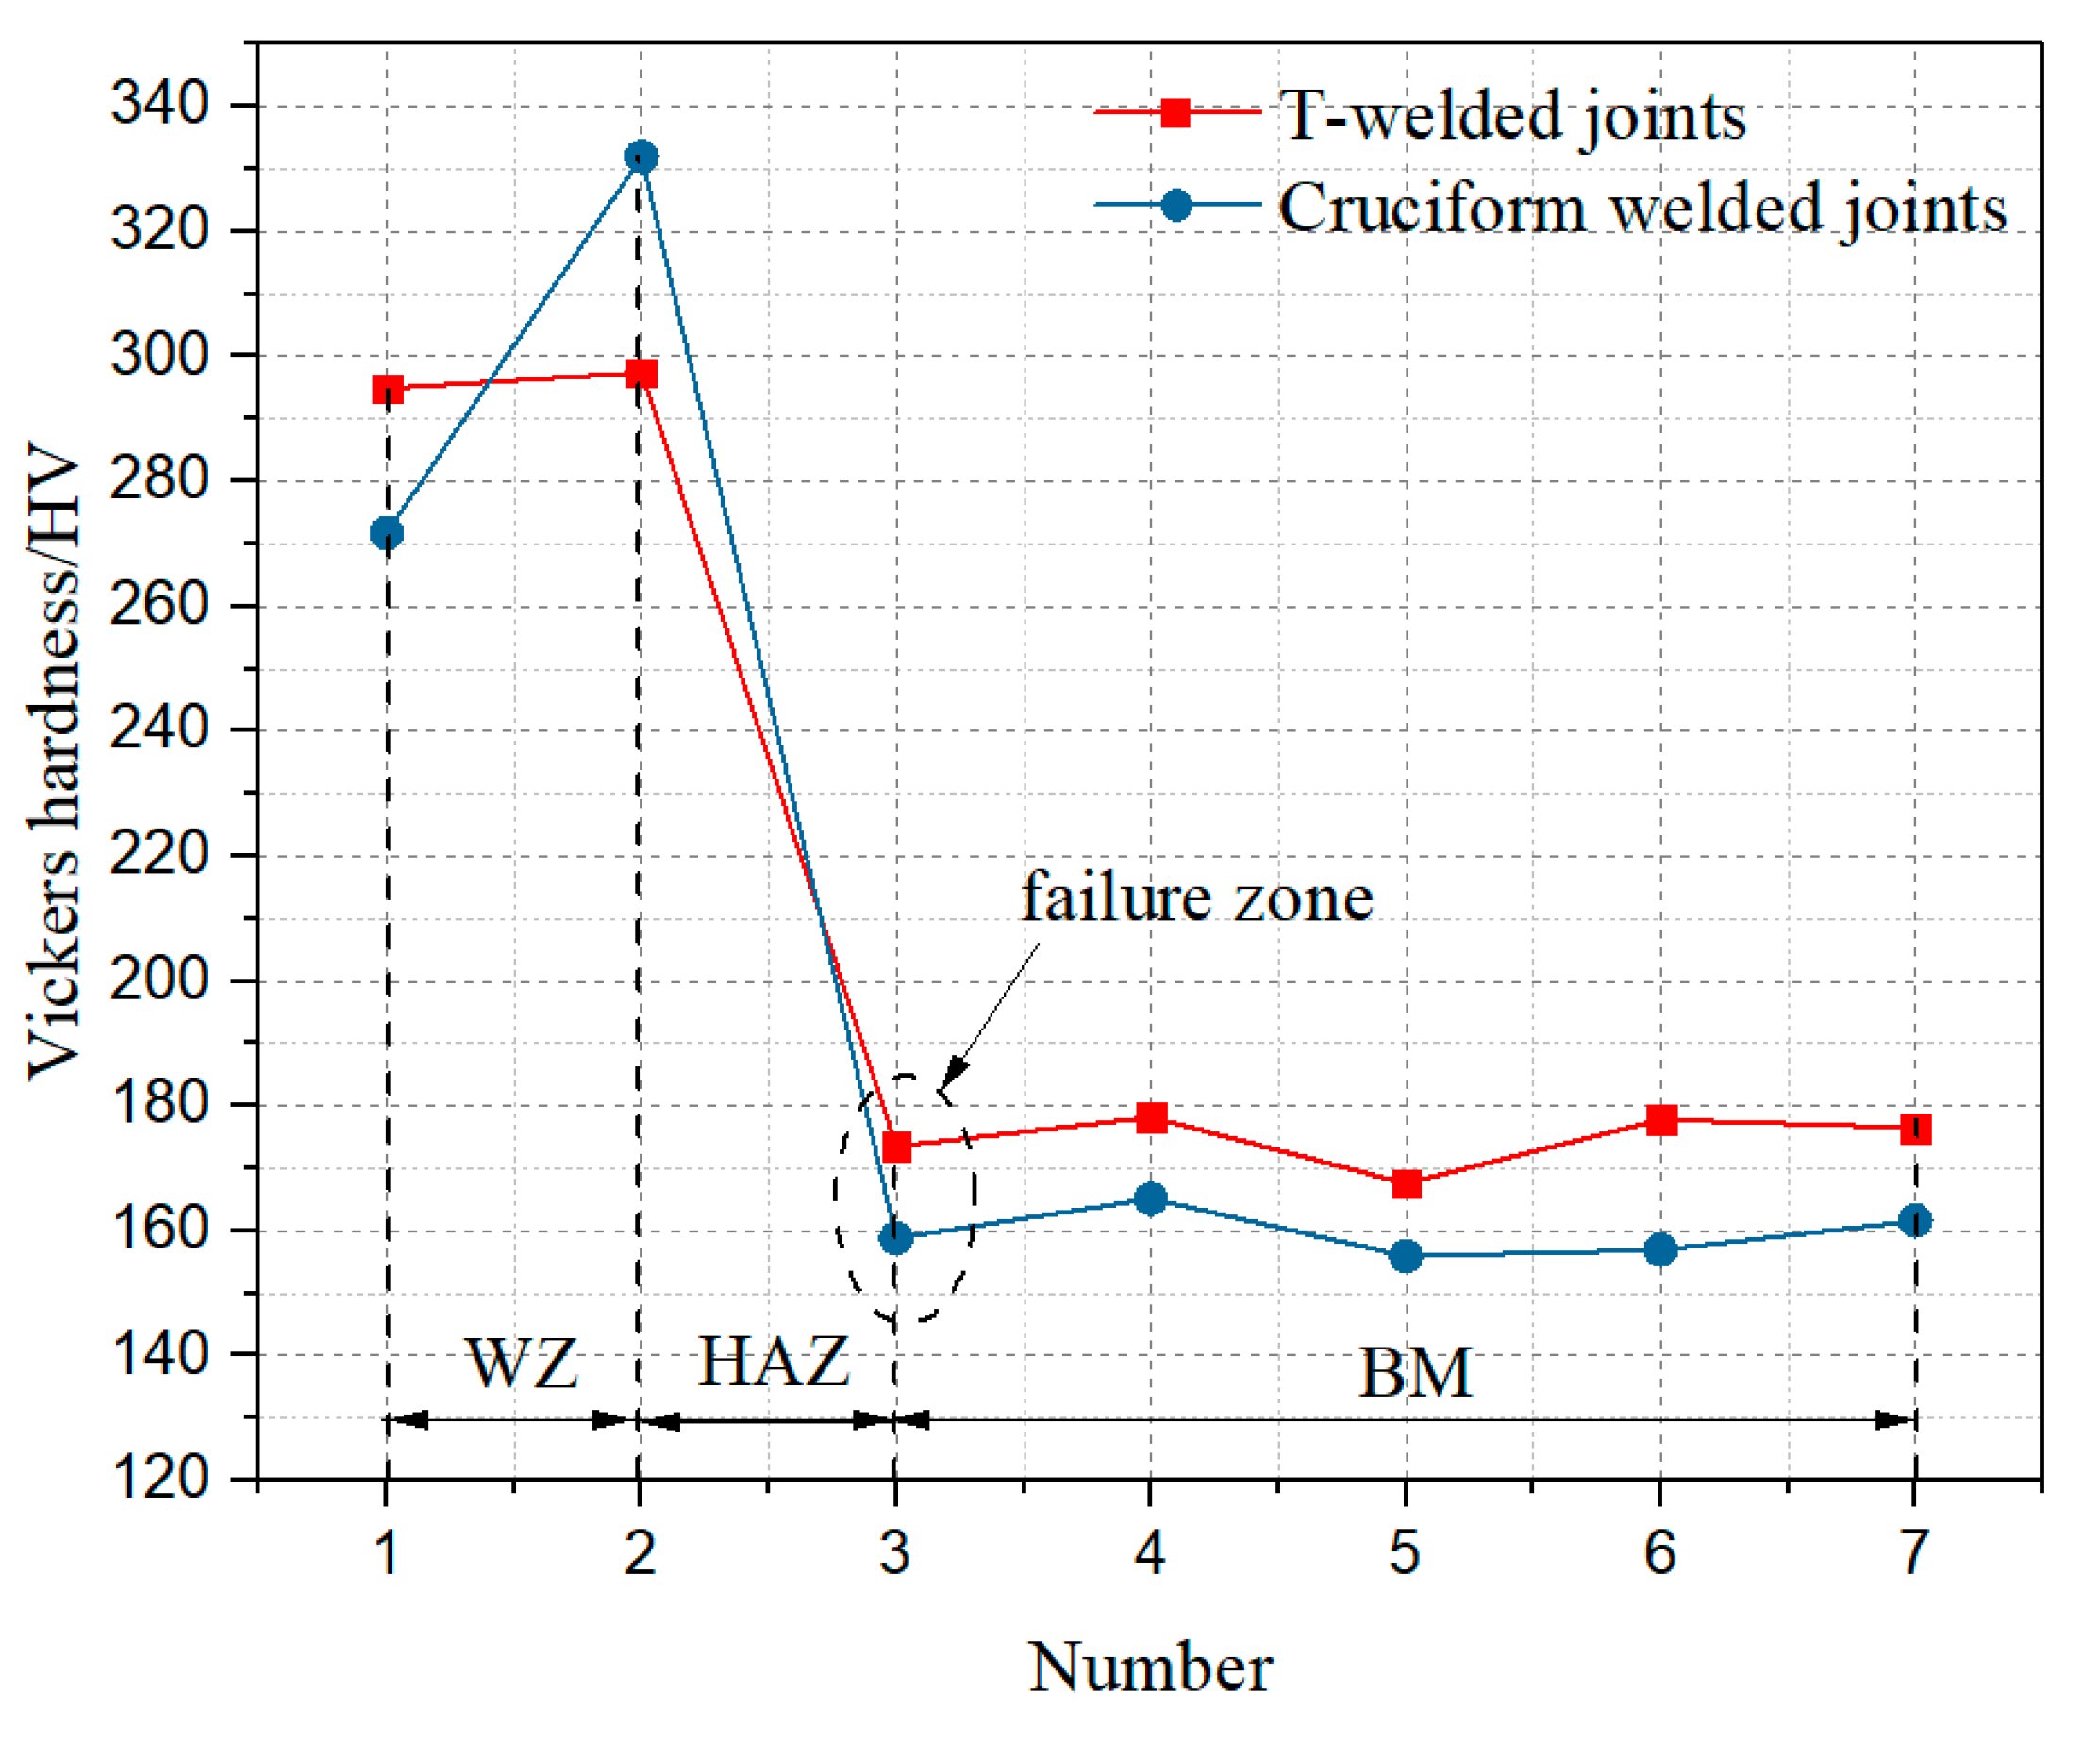
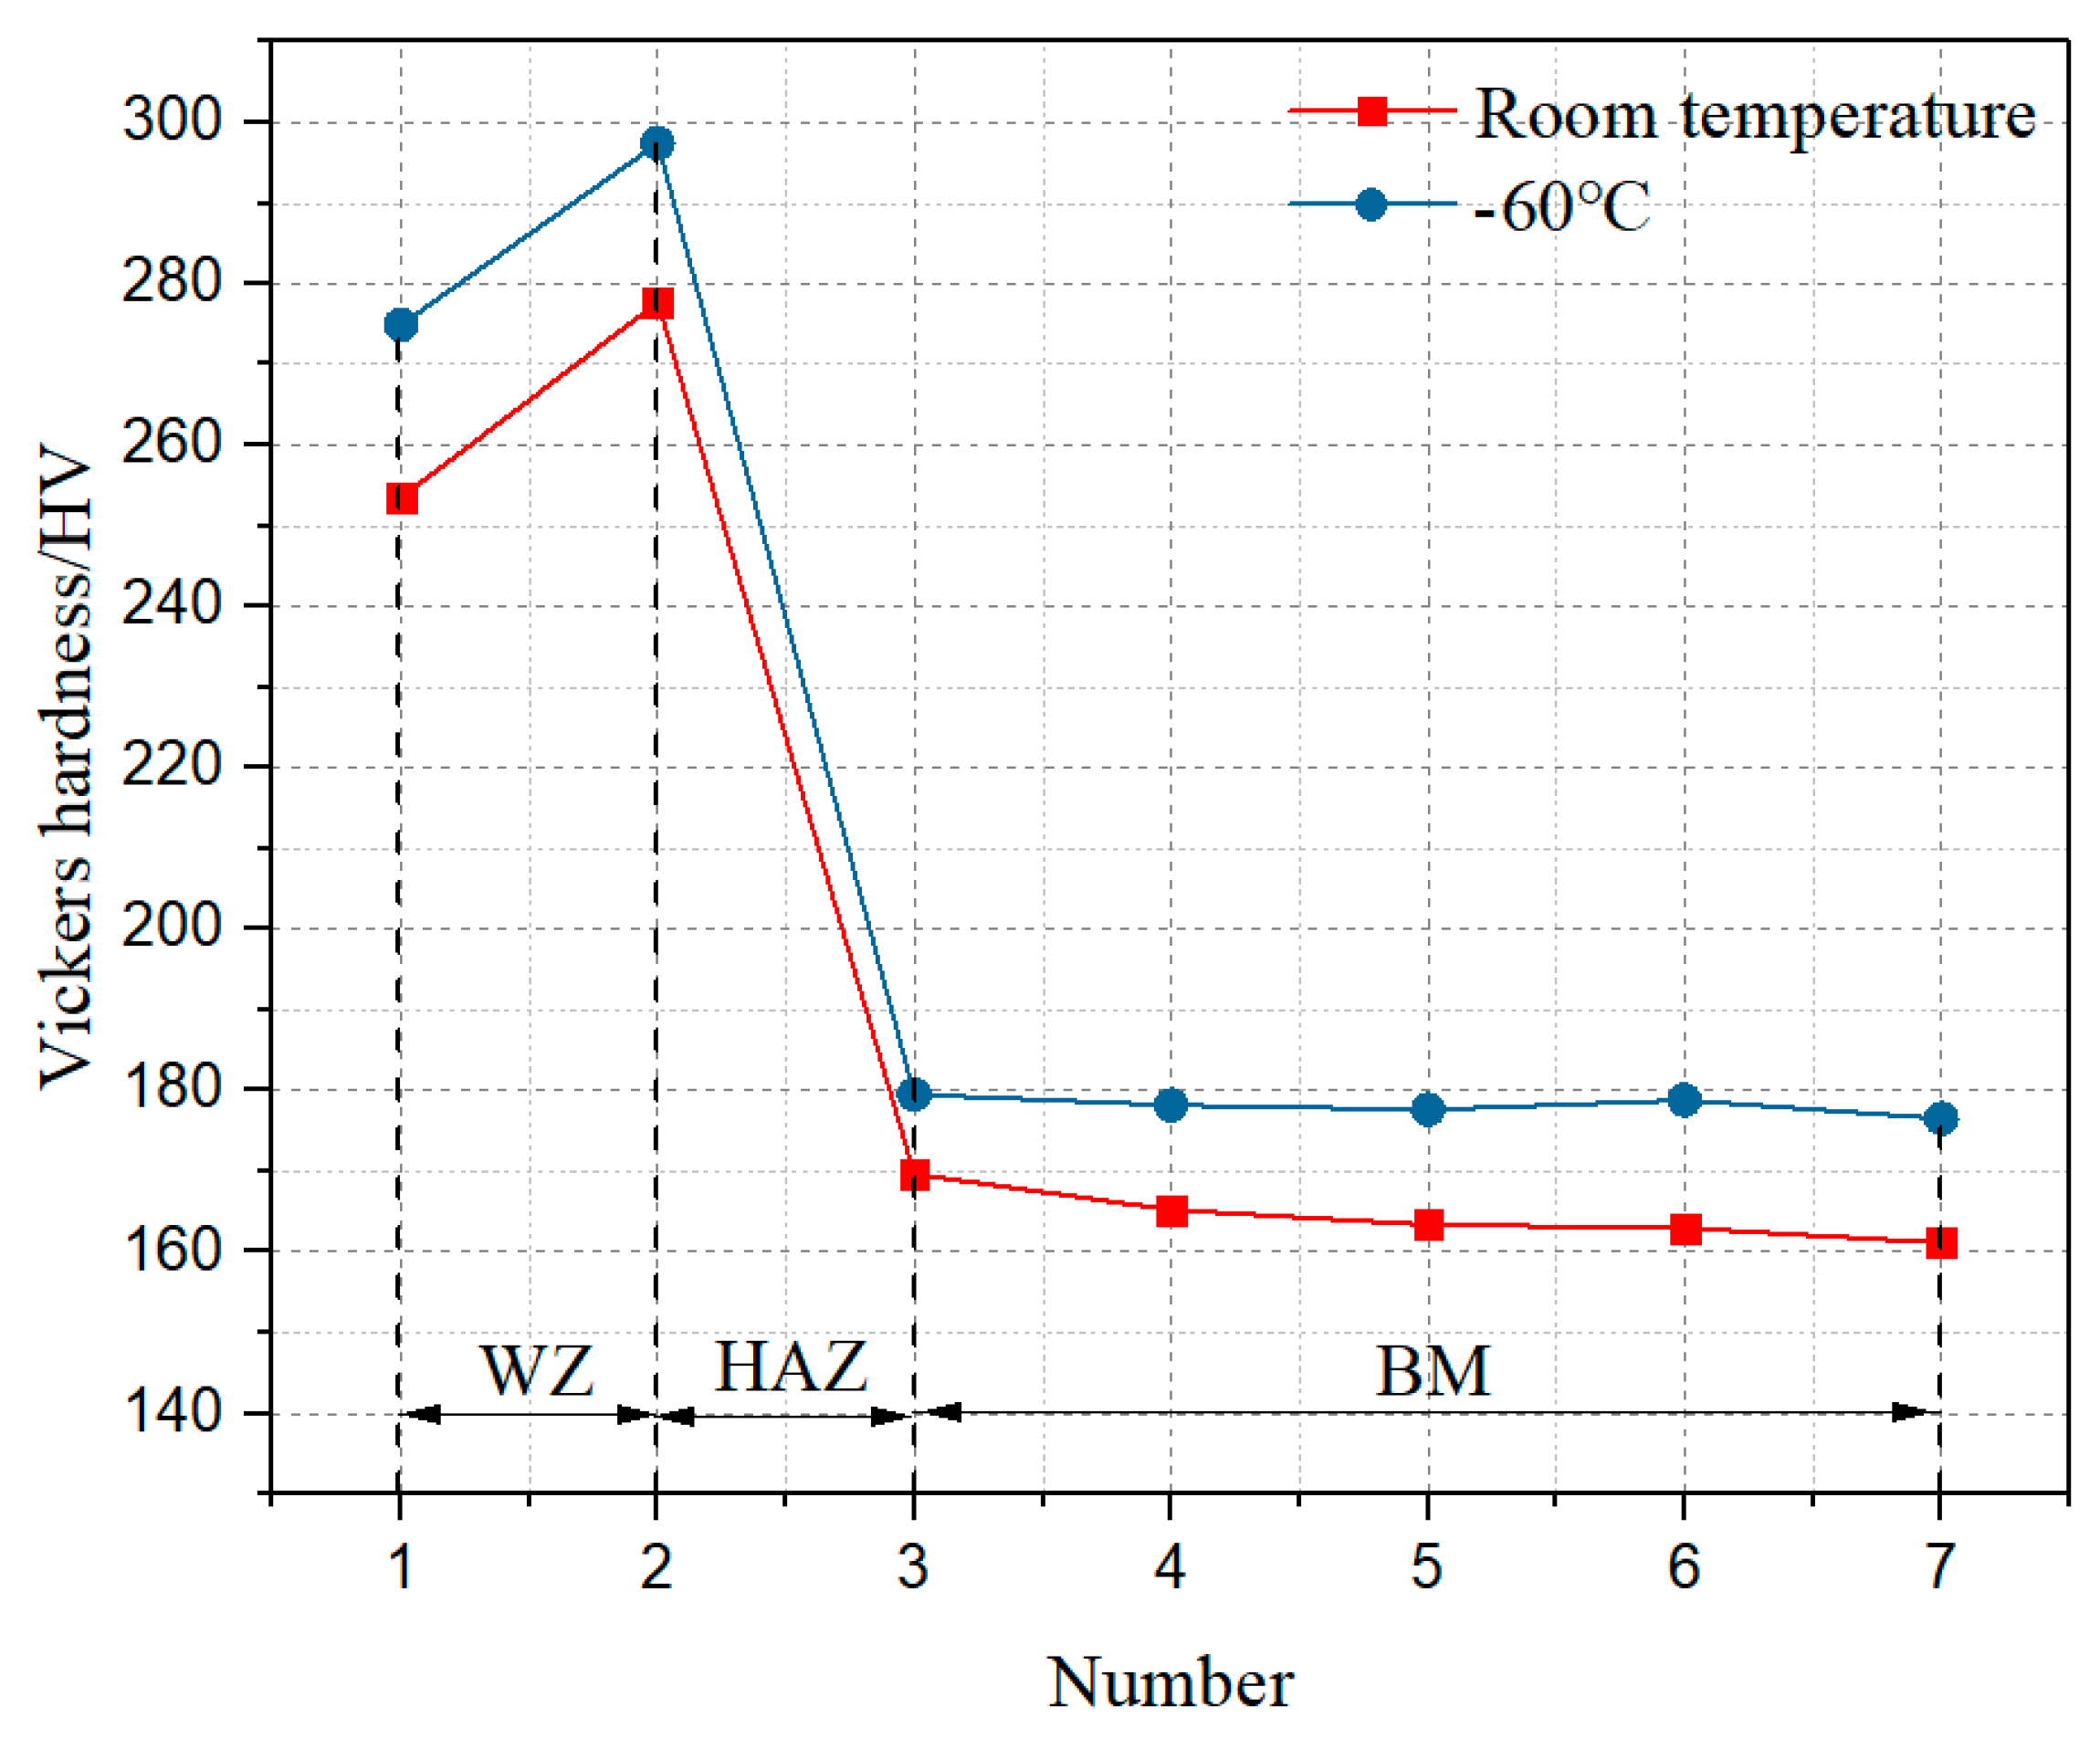
4.3. The Relationship between Fatigue Properties and Hardness Profiles
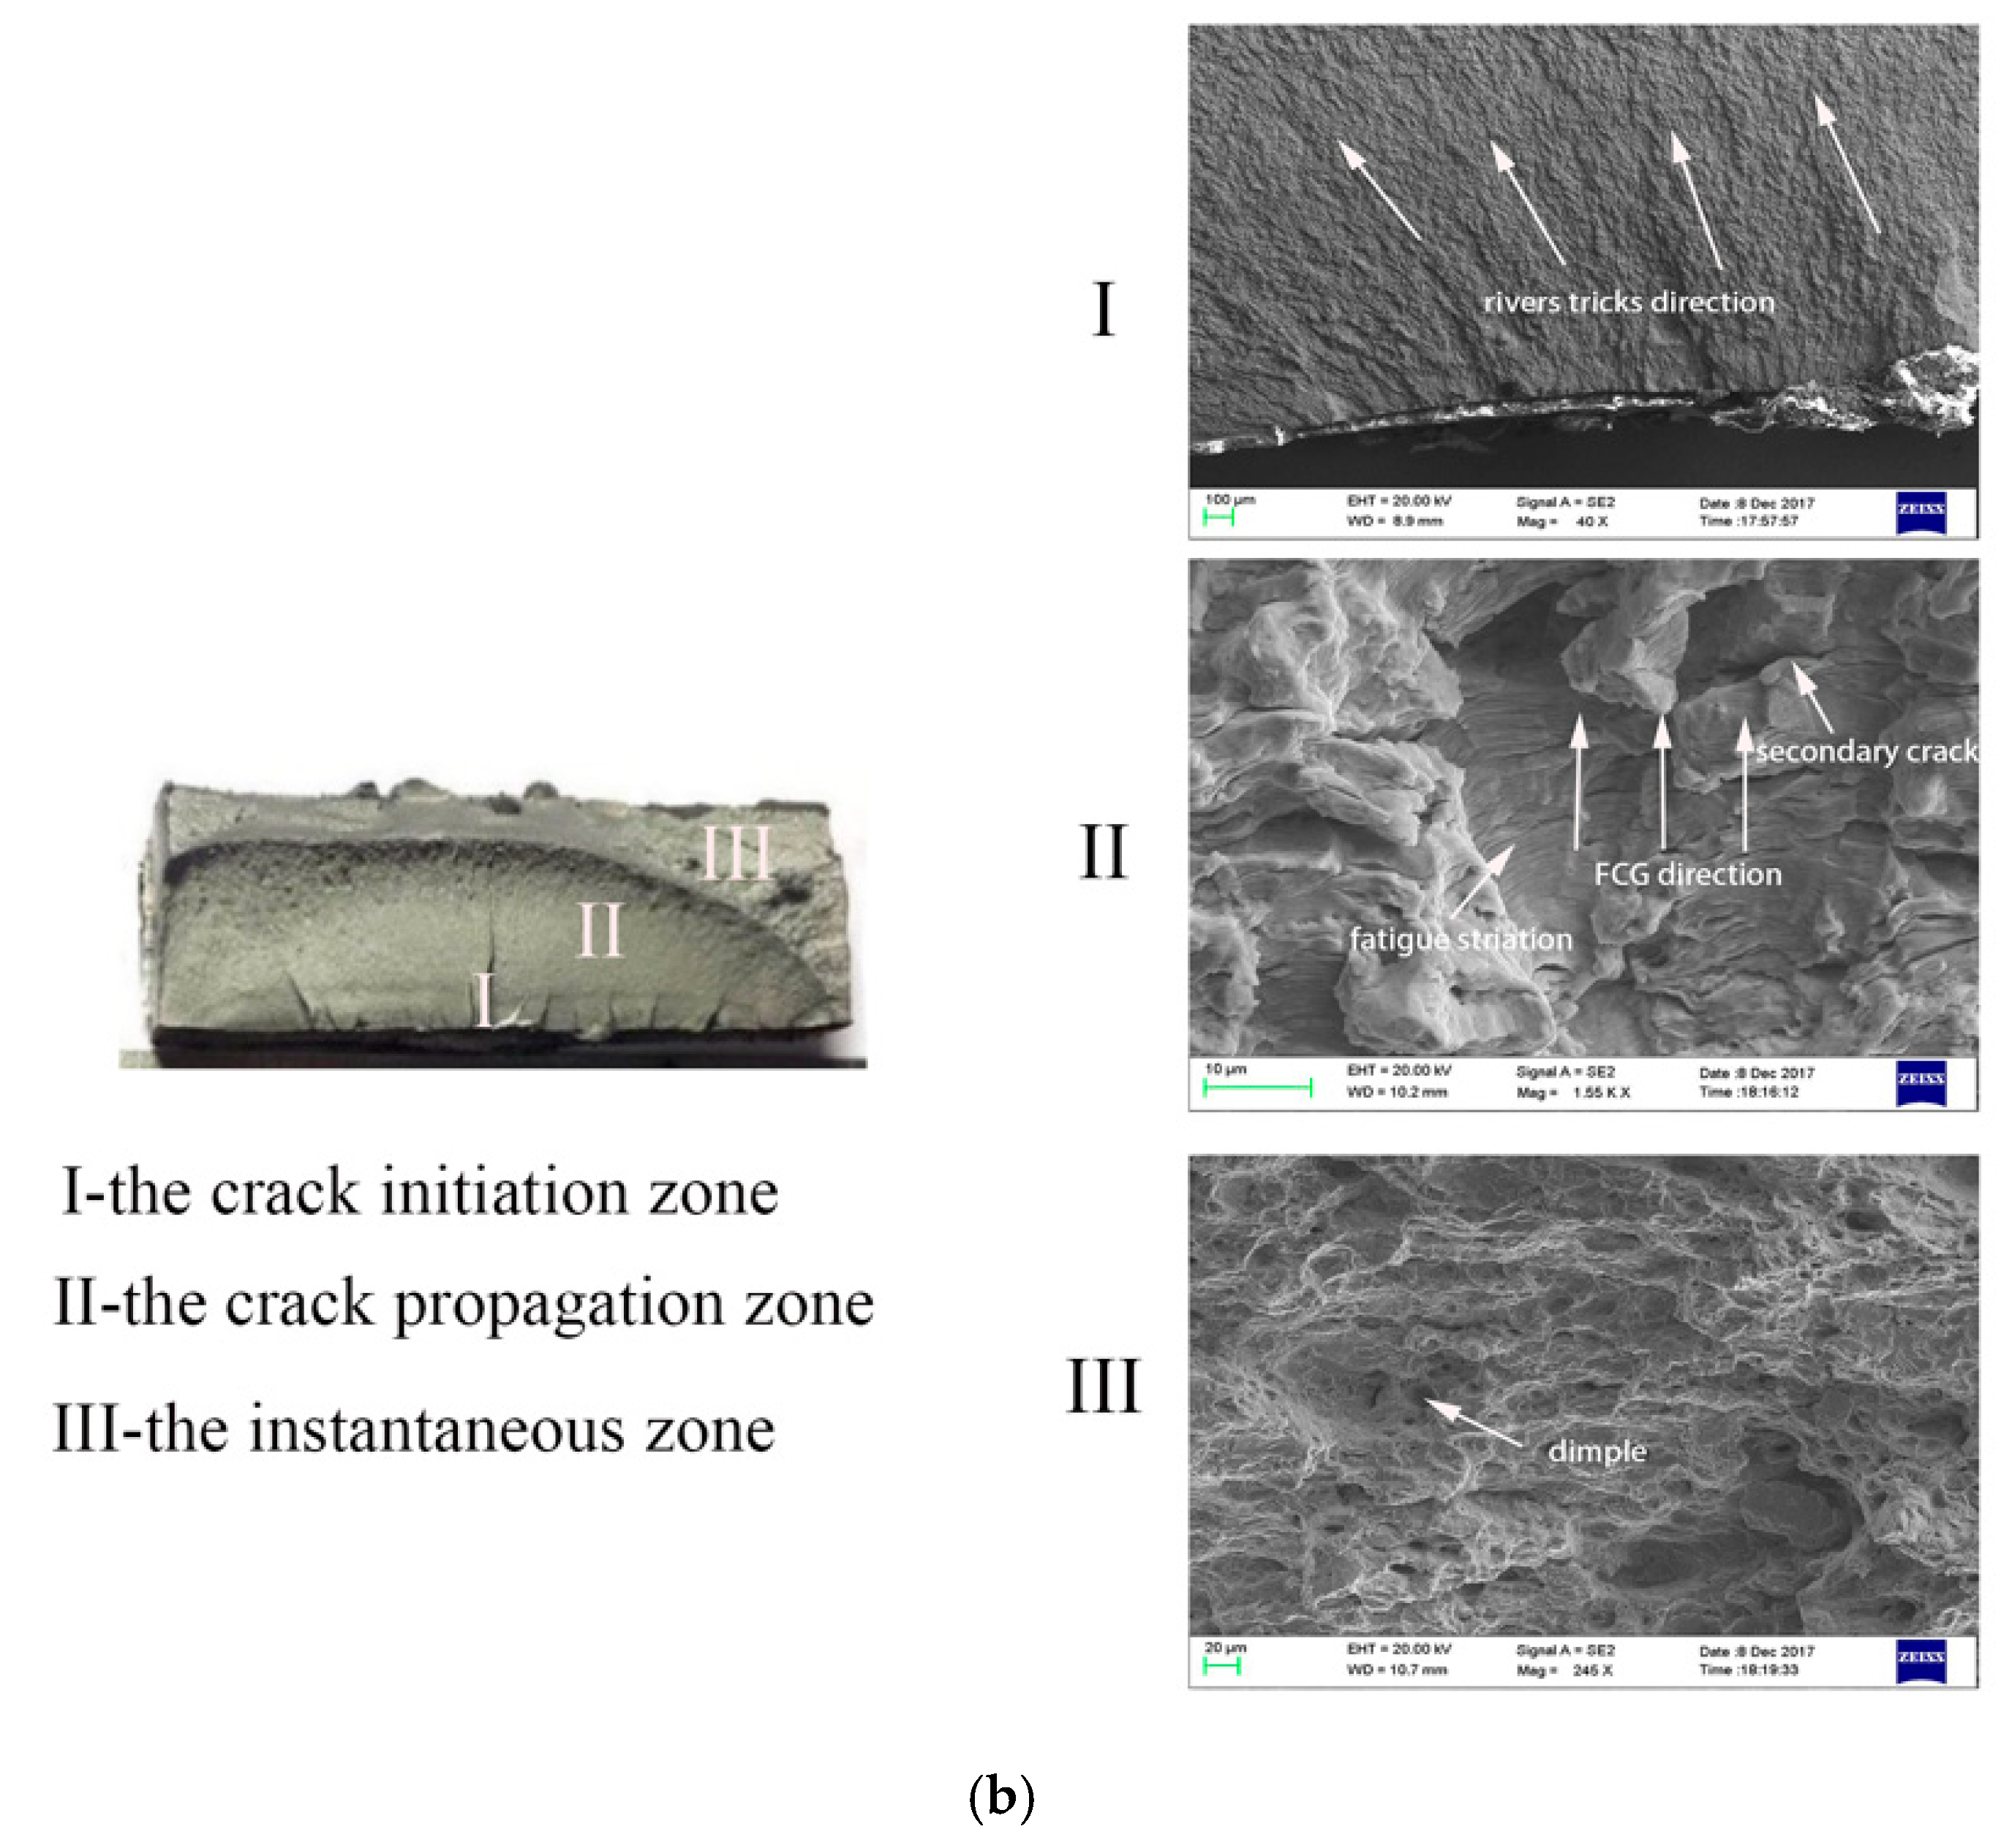
The difference in fatigue properties of T-welded and cruciform welded joints can also be analyzed from a material perspective [40]. Research has shown that fatigue properties of a material are related to hardness [18,41,42,43]. In general, the fatigue properties increase with increasing hardness. In this study, the relationship between fatigue properties and hardness of welded Dh36 steel at −60 °C is discussed.
For the measurement at −60 °C, the specimen was placed in a low environment chamber and incubated at −60 °C for 1 h. Then, the hardness of the specimen was measured using a Vickers hardness tester. The surface temperature of the specimen was monitored throughout the measurement process. If the temperature changed by more than 5 °C, the measurement was invalid. The positions of the measurement points were determined by referring to “GB/T 2654-2008 Hardness Test Method on Welded Joints” [44]. The distribution of the measurement points in this study is shown in Figure 12.
Since the failure zone was located at the HAZ in this paper, the Vickers hardness in the HAZ of the T-welded and cruciform welded joints is mainly discussed here. The Vickers hardness profiles of the T-welded and cruciform welded joints at −60 °C are presented in Figure 13. It can be seen that the Vickers hardness in the HAZ of the T-welded joints is higher (178 HV) than that of the cruciform welded joints (163.8 HV).
In general, Vickers hardness and fatigue properties show good consistency, that is, without considering inclusions and defects, plastic deformation preferentially occurs at the position with low Vickers hardness and high stress, and the specimen eventually fails in this zone. In this study, the Vickers hardness of the T-welded joints was determined to be approximately 14.2 HV higher than that of the cruciform welded joints in the failure zone. Meantime, the stress range level of T-welded joints in the failure zone was lower than that of cruciform welded joints, as shown in Figure 14. Therefore, the difference in fatigue properties between T-welded and cruciform welded joints can be attributed to the difference in hardness and stress range level of the failure zone in this study.

4.4. Fractography

First, the fracture morphology was examined using a magnifying glass, and an obvious crack initiation zone, crack propagation zone, and instantaneous fracture zone [14] were observed. In Figure 15a,b, I is the crack initiation zone, II is the crack propagation zone, and the size of the crack propagation zone is related to the material toughness and the load level. III is the instantaneous fracture zone, which is the fresh section formed by the instantaneous fracture after the crack expands to a certain size [45]. Most cracks are generated in zones with defects or high stress [46]. The crack propagation zone was smooth and flat and appeared as a “beach mark” in the zone. The instantaneous fracture zone was rough and white.
For the fracture of the T-welded joints, stress concentration was present in one side, and there was no stress concentration in the other side; therefore, the crack was generated in the side (I) with stress concentration and expanded downward in the form of an ellipse until it was broken, as shown in Figure 15a. For the fracture of the cruciform welded joints, since there was a strong stress concentration in both sides, the crack was preferentially generated on the side with defects. As shown in Figure 15b, cracks were generated in one side (I) and then expanded in the form of an ellipse until failure.
The fractography of T-welded and cruciform welded joints at −60 °C was also analyzed using SEM images. The morphology of the crack initiation zone, the crack propagation zone, and the instantaneous fracture zone clearly differed [47]. Some radiation stripes were observed in the crack initiation zone, as shown in zone I of Figure 15a,b. These stripes are steps formed by many tear planes that were parallel to each other but at different heights. In addition, the crack propagation zone contained obvious transgranular fatigue cracks (zone II of Figure 15a,b). The instantaneous fracture zone shows signs of ductile fracture (zone III of Figure 15a,b) [48].
(I) Crack initiation zone
The crack initiation zone consisted of a relatively large planar defect, and a number of microcracks were observed in the crack initiation zone [49]. These cracks were generated at the surface with stress concentration. There were more fatigue sources at the crack initiation zones of cruciform welded joints than those of T-welded joints, and the stress concentration factors of cruciform welded joints were higher than those of T-welded joints, as shown in zone I of Figure 15a,b. This phenomenon is consistent with the conclusion of Section 4.1.
(II) Crack propagation zone
At least 10 fatigue striation spacings were taken as the population from the crack propagation zone at Δ K = 30   MPa m and the mean of the striation spacing was obtained by averaging the population. The results showed that the striation spacings of cruciform weld joints were 0.84 μm, while the striation spacings of T-welded joints were 0.79 μm.
In the SEM images of the crack propagation zone, clear fatigue striations were observed in the crack propagation zone of the two welded joints, as shown in zone II of Figure 15a,b. According to the “plastic passivation model” proposed by Laird [46], the spacing of the fatigue striations represents the crack propagation of the stress cycle, which can reflect the fatigue crack growth rate d a / d N [50]. From the zone II of Figure 15a,b, the spacing of fatigue striations of T- welded joints was less than that of cruciform welded joints. This means that the crack propagation rate of the T-welded joints was lower than that of the cruciform welded joints.
(III) Instantaneous fracture zone
The instantaneous fracture zone was in the stage of crack instability. The instantaneous fracture zones of the two welded joints contained obvious dimples. However, the dimples of the cruciform welded joints were significantly smaller, as observed in Figure 15a,b. Combined with Figure 3c and Figure 4c, it can be observed that more lath-like martensite and less residual ferrite were observed in the HAZ of the T-welded joints than in the HAZ of the cruciform welded joints. The presence of lath-like martensite reduces the toughness of the material and makes the dimples shallow and small.

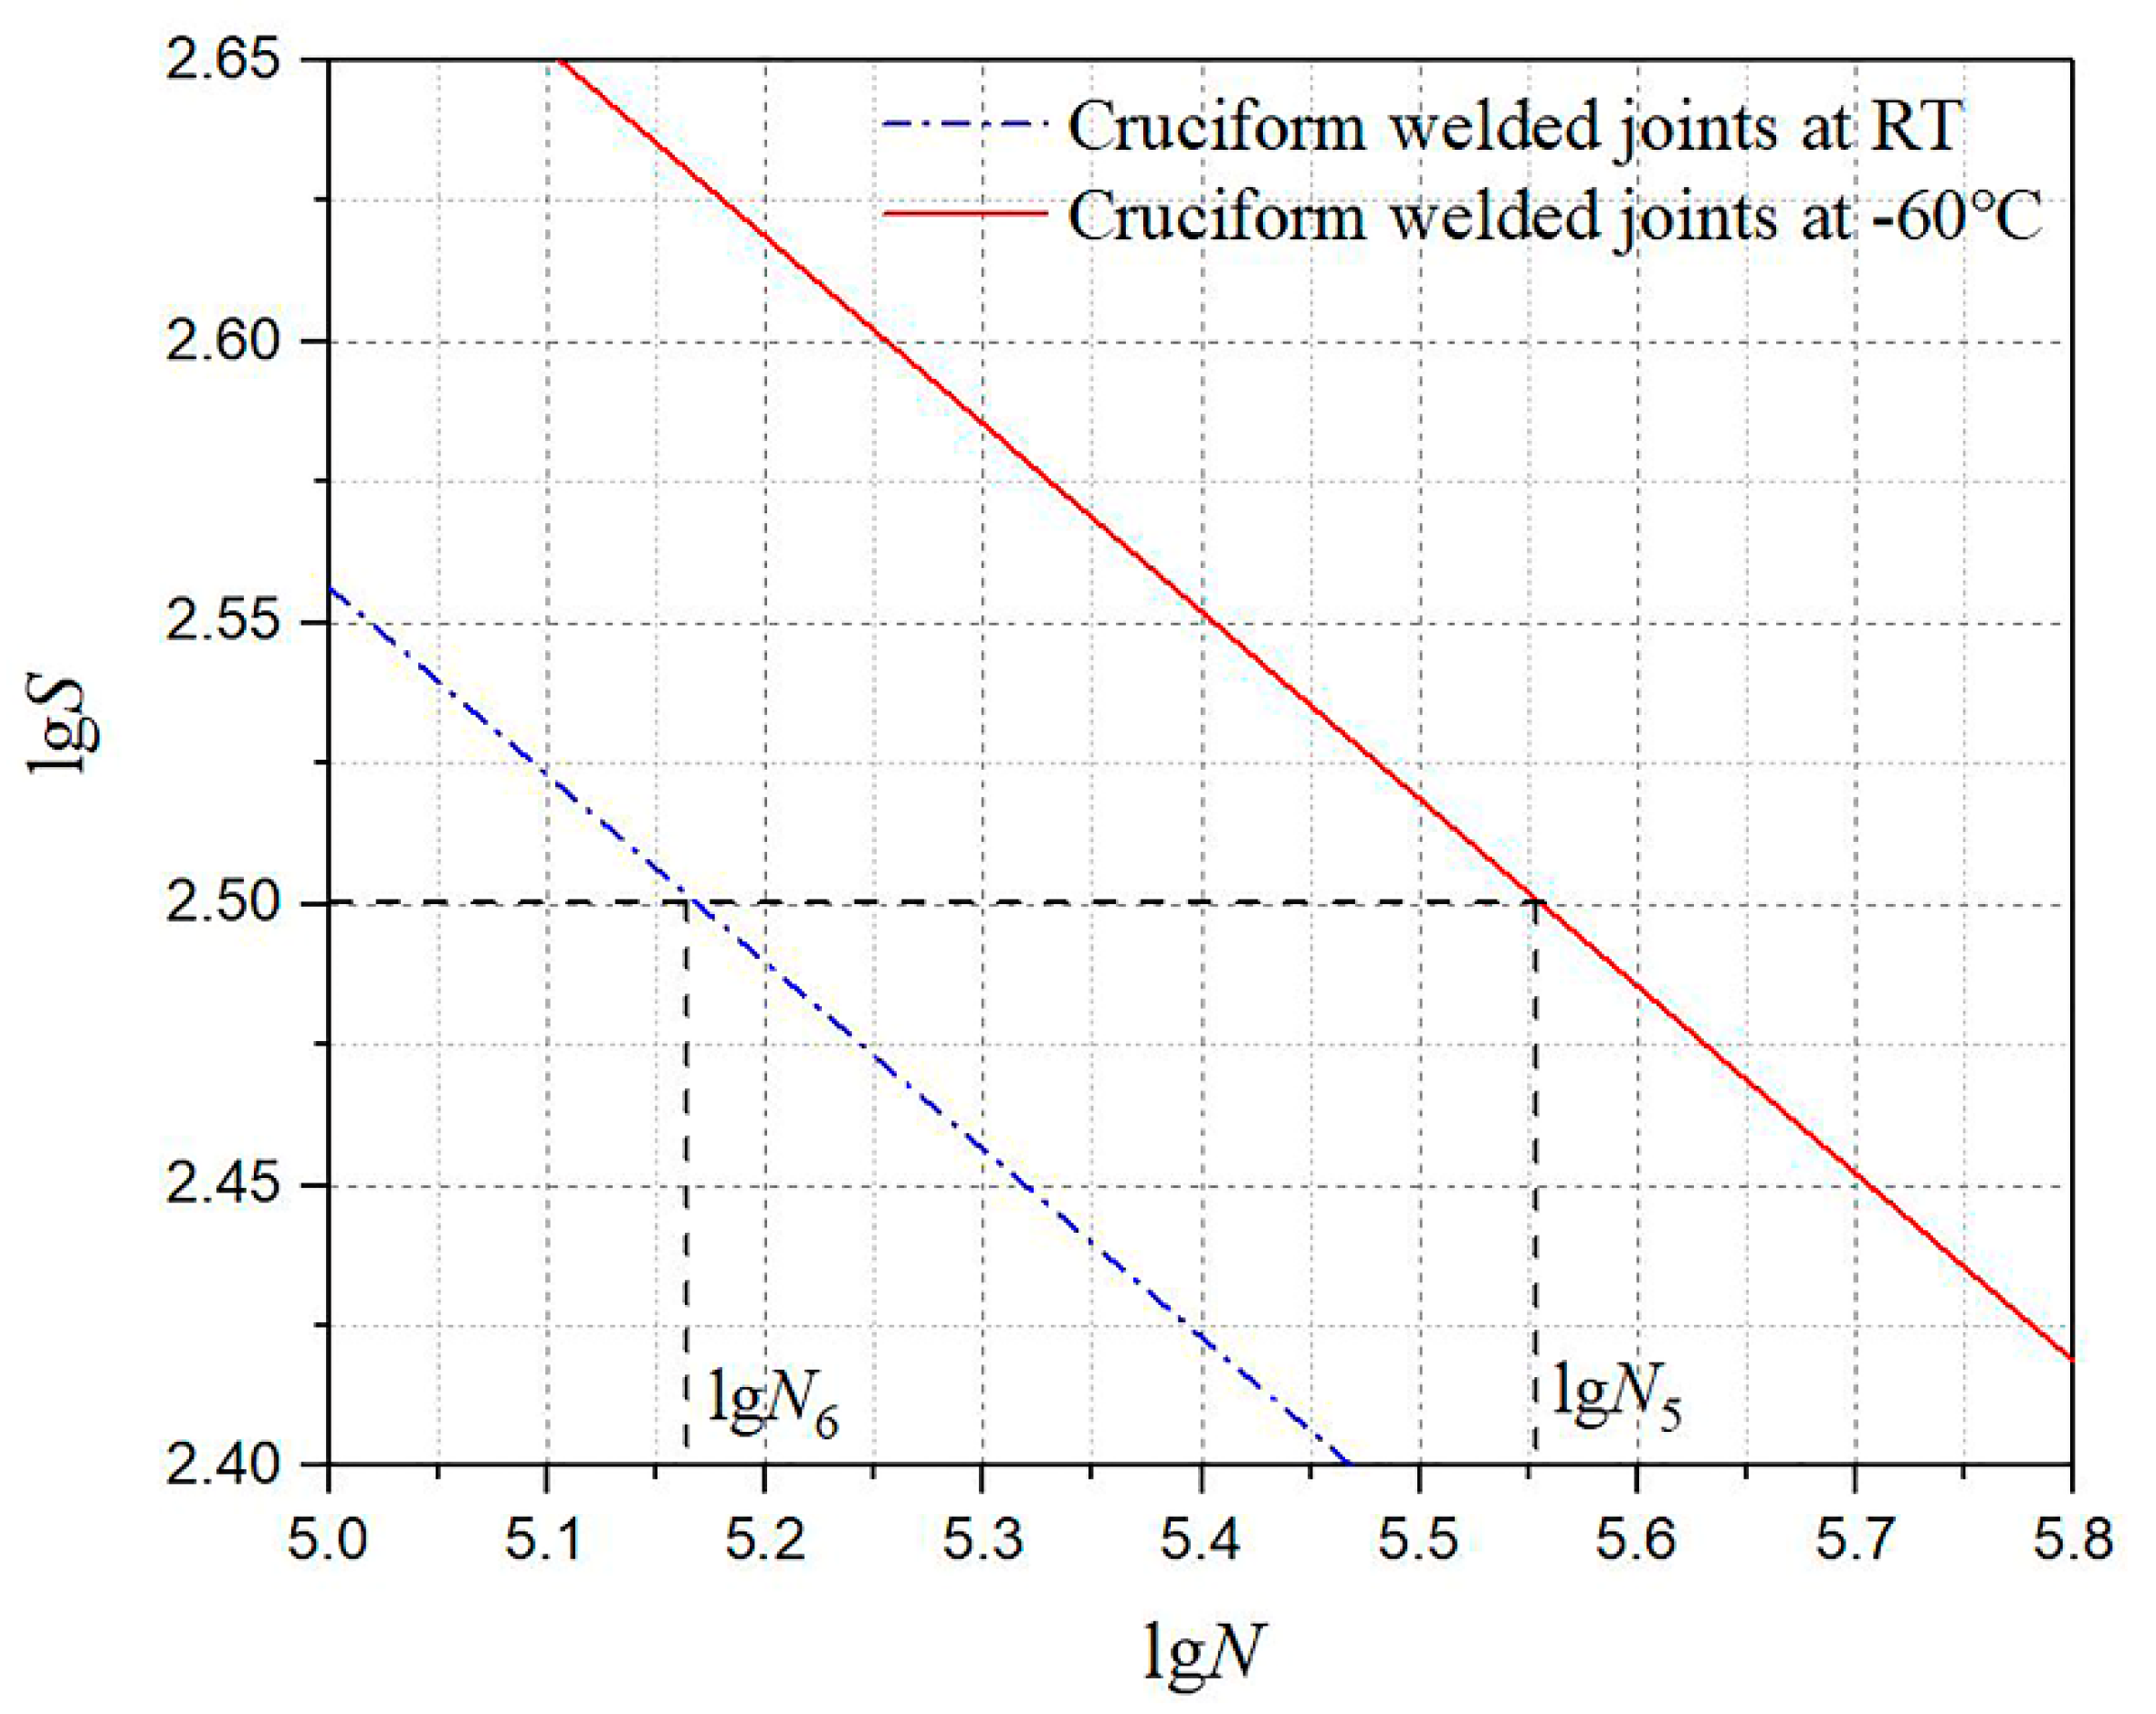
4.5. Effect of Low Temperature on Fatigue Properties of DH36 Welded Joints

Low temperature has a great influence on fatigue [51]. Here is an example of cruciform welded joints to discuss the effect of low temperature on the fatigue properties of welded DH36. The fatigue test results of cruciform welded joints of DH36 steel studied by Ph. P. Darcis [47] were cited and compared with the results at −60 °C in this paper, as shown in Figure 16.
At the same logarithmic stress range, the logarithmic fatigue life of cruciform welded joints at room temperature (RT) and −60 °C were different. For example, at the logarithmic stress range of 2.50 (316 MPa), the logarithmic fatigue life ( lg N 5 ) of cruciform welded joints at −60 °C was 5.55 (354,813 cycles), while the logarithmic fatigue life of cruciform welded joints ( lg N 6 ) at RT was 5.181 (151,808 cycles) which was almost three times that of room temperature. This means the fatigue properties of cruciform welded joints at −60 °C were better than at room temperature.
The effect of low temperature on fatigue properties can still be analyzed from the aspect of Vickers hardness. The Vickers hardness of cruciform welded joints at room temperature and −60 °C was put in one figure, as shown in Figure 17. It could be found that Vickers hardness profiles at −60 °C was higher than that of room temperature. In particular, the Vickers hardness at −60 °C was 12.17 HV higher than that of room temperature in the failure zone.
The low temperature raises the Vickers hardness of the welded joints, and the increase of hardness enhances the fatigue properties of the welded joints of DH36 steel. In this paper, the fatigue properties at low temperature were investigated from the aspect of hardness, and a more comprehensive and detailed study on the mechanism of fatigue at low temperature still needs to be carried out.

5. Conclusions

DH36 steel is often used in polar ships at low temperature. In this study, low temperature fatigue tests of T-welded and cruciform welded joints were performed, and the difference in the fatigue properties of the T-welded and cruciform welded joints was examined by analyzing the stress concentration, microstructure, Vickers hardness, and fractography. In addition, the effect of low temperature on DH36 welded joints was also analyzed in this study. The following conclusions can be drawn:
  • The fatigue properties of T-welded joints were almost 2–7% better than those of the cruciform welded joints at −60 °C. In this paper, the difference in fatigue properties between T-welded and cruciform welded joints can be attributed to the difference in hardness and stress range level of the failure zone.
  • The Vickers hardness at −60 °C was 12.17 HV higher than that of room temperature. Furthermore, the difference in hardness between T- and cruciform welded joints also showed different situations at −60 °C and room temperature. The Vickers hardness in the failure zone of T-welded joints was close to that in the failure zone of cruciform welded joints at room temperature. However, the Vickers hardness in the failure zone of the T-welded joints (168–174 HV) was higher than that in the failure zone of the cruciform welded joints (159–165 HV) at −60 °C.
  • The spacing of fatigue striations of cruciform welded joints in the HAZ was larger than that of T-welded joints in the crack propagation zone which means the fatigue crack growth rate of the T-welded joints was lower than that of the cruciform welded joints. There were no significant differences in the crack initiation zone and instantaneous fracture zone.
  • Low temperature had a significant effect on the fatigue performance of welded DH36. The fatigue properties of cruciform welded joints at −60 °C were 57.215% better than those at room temperature.

Author Contributions

Data curation, W.L.; Supervision, H.R.; Writing—original draft, W.Z.; Writing—review & editing, G.F. All authors have read and agreed to the published version of the manuscript.

Funding

This paper was supported by the National Natural Science Foundation of China, Fund No. 51679050.

Conflicts of Interest

The authors declare no conflict of interest.

References

  1. Sangid, M.D. The physics of fatigue crack initiation. Int. J. Fatigue 2013, 57, 58–72. [Google Scholar] [CrossRef]
  2. Fricke, W.; von Lilienfeld-Toal, A.; Paetzold, H. Fatigue strength investigations of welded details of stiffened plate structures in steel ships. Int. J. Fatigue 2012, 34, 17–26. [Google Scholar] [CrossRef]
  3. Tran Nguyen, K.; Garbatov, Y.; Guedes Soares, C. Fatigue damage assessment of corroded oil tanker details based on global and local stress approaches. Int. J. Fatigue 2012, 43, 197–206. [Google Scholar] [CrossRef]
  4. Sun, D.; Gan, J.; Wang, Z.; Luo, P.; Wu, W. Experimental and analytical investigation of fatigue crack propagation of T-welded joints considering the effect of boundary condition. Fatigue Fract. Eng. Mater. Struct. 2017, 40, 894–908. [Google Scholar] [CrossRef]
  5. Krishnadev, M.R.; Ghosh, R.; Galibois, A. Effect of Low-Temperature on The Fatigue Properties of Two Hsla (High Strength Low Alloy) Pipeline Steels. Fatigue Fract. Eng. Mater. Struct. 2010, 2, 107–119. [Google Scholar] [CrossRef]
  6. Chai, W.; Leira, B.J.; Naess, A. Short-term extreme ice loads prediction and fatigue damage evaluation for an icebreaker. Ships Offshore Struct. 2018, 13, 127–137. [Google Scholar] [CrossRef]
  7. Alvaro, A.; Akselsen, O.M.; Ren, X.; Kaneko, A. Fundamental Aspects of Fatigue of Steel in Arctic Applications. In Proceedings of the Twenty-Fourth International Ocean and Polar Engineering Conference, Busan, Korea, 15–20 June 2014; p. 8. [Google Scholar]
  8. China Classification Society. Rules and Regulations for the Construction and Classification of Sea-Going Steel Ships; China Classification Society: Beijing, China, 2018; Volume 8. [Google Scholar]
  9. Det Norske Veritas. Rules For Classification Of Ships; Part 3-Chapter 3. In Newbuildings-Hull And Equipment-Main Class-Hull Equipment And Safety; DNV: Augsburg, Germany, 2008. [Google Scholar]
  10. Carpinteri, A.; Brighenti, R. Fracture and fatigue properties of metallic alloys S275 J2 and Al7075 T6 at low temperatures. J. Mater. Sci. 2008, 43, 4780–4788. [Google Scholar] [CrossRef]
  11. Jeong, D.; Park, T.; Lee, J.; Kim, S. Ambient and cryogenic S-N fatigue behavior of Fe15Mn steel and its weld. Met. Mater. Int. 2015, 21, 453–460. [Google Scholar] [CrossRef]
  12. Antonio Alvaro, O.M.A.; Xiaobo, R.; Kane, A. Fatigue Properties of a 420 MPa Structural Steel at Low Temperature. In Proceedings of the Twenty-fifth International Ocean and Polar Engineering Conference, Kona, HI, USA, 21–26 June 2015. [Google Scholar]
  13. Zhao, W.; Feng, G.; Zhang, M.; Ren, H.; Sinsabvarodom, C. Effect of low temperature on fatigue crack propagation rates of DH36 steel and its butt weld. Ocean Eng. 2020, 196, 106803. [Google Scholar] [CrossRef]
  14. Zhao, W.; Feng, G.; Ren, H.; Leira, B.J.; Zhang, M. Temperature-dependent characteristics of DH36 steel fatigue crack propagation. Fatigue Fract. Eng. Mater. Struct. 2020, 43, 617–627. [Google Scholar] [CrossRef]
  15. Almaraz, G.M.D.; Mora, R.P. Ultrasonic fatigue testing on high strength steel: Effect of stress concentration factors associated with corrosion pitting holes. Int. J. Damage Mech. 2012, 22, 860–877. [Google Scholar] [CrossRef]
  16. Brennan, F.P.; Peleties, P.; Hellier, A.K. Predicting weld toe stress concentration factors for T and skewed T-joint plate connections. Int. J. Fatigue 2000, 22, 573–584. [Google Scholar] [CrossRef]
  17. Zhang, C.; Hu, X.; Lu, P. Fatigue and hardness effects of a thin buffer layer on the heat affected zone of a weld repaired Bisplate80. J. Mater. Process. Technol. 2012, 212, 393–401. [Google Scholar] [CrossRef]
  18. Casagrande, A.; Cammarota, G.P.; Micele, L. Relationship between fatigue limit and Vickers hardness in steels. Mater. Sci. Eng. A 2011, 528, 3468–3473. [Google Scholar] [CrossRef]
  19. Kramer, H.S.; Starke, P.; Klein, M.; Eifler, D. Cyclic hardness test PHYBALCHT–Short-time procedure to evaluate fatigue properties of metallic materials. Int. J. Fatigue 2014, 63, 78–84. [Google Scholar] [CrossRef]
  20. Koyama, M.; Yamamura, Y.; Sawaguchi, T.; Tsuzaki, K.; Noguchi, H. Microstructural hardness heterogeneity triggers fatigue crack non-propagation in as-hot-rolled Fe-30Mn-3Si-3Al twinning-induced plasticity steel. Int. J. Fatigue 2018, 108, 18–24. [Google Scholar] [CrossRef]
  21. Dudrova, E.; Kabátova, M. A review of failure of sintered steels: Fractography of static and dynamic crack nucleation, coalescence, growth and propagation. Powder Metall. 2016, 59, 148–167. [Google Scholar] [CrossRef]
  22. International Organization for Standardization. Welding Consumables—Covered Electrodes for Manual Metal Arc Welding of Non-Alloy and Fine Grain Steels—Classification; ISO: Geneva, Switzerland, 2009; Volume 2560. [Google Scholar]
  23. Zhang, Z.; Wang, Z.; Wang, W.; Yan, Z.; Dong, P.; Du, H.; Ding, M. Microstructure evolution in heat affected zone of T4003 ferritic stainless steel. Mater. Des. 2015, 68, 114–120. [Google Scholar] [CrossRef]
  24. Andrey, B. Microstructure and Mechanical Properties of Structural Metals and Alloys. Met. Mater. Int. 2018, 8, 676. [Google Scholar]
  25. Oshida, Y.; Deguchi, A. Martensite Formation and The Related Toughness in 304 Stainless Steel during Low Temperature Fatigue. Fatigue Fract. Eng. Mater. Struct. 2010, 10, 363–372. [Google Scholar] [CrossRef]
  26. Zhang, C.; Song, X.; Lu, P.; Hu, X. Effect of microstructure on mechanical properties in weld-repaired high strength low alloy steel. Mater. Des. 2012, 36, 233–242. [Google Scholar] [CrossRef]
  27. Mueller, I.; Rementeria, R.; Caballero, F.G.; Kuntz, M.; Sourmail, T.; Kerscher, E. A Constitutive Relationship between Fatigue Limit and Microstructure in Nanostructured Bainitic Steels. Materials 2016, 9, 831. [Google Scholar] [CrossRef] [PubMed] [Green Version]
  28. Shin, J.-C.; Lee, S.; Hwa Ryu, J. Correlation of microstructure and fatigue properties of two high-strength spring steels. Int. J. Fatigue 1999, 21, 571–579. [Google Scholar] [CrossRef]
  29. Oh, J.; Kim, N.J.; Lee, S.; Lee, E.W. Correlation of fatigue properties and microstructure in investment cast Ti-6Al-4V welds. Mater. Sci. Eng. A 2003, 340, 232–242. [Google Scholar] [CrossRef]
  30. Yaojian, Q.; Tiezheng, Z.; Rang, Y. Relationships Between Fatigue Strength and Microstructure of 55SiMnVB Steel. In Low Cycle Fatigue and Elasto-Plastic Behaviour of Materials; Rie, K.T., Ed.; Springer: Dordrecht, The Netherlands, 1987; pp. 89–94. [Google Scholar]
  31. ASTM. Standard Practice for Conducting Constant Amplitude Axial Fatigue Tests of Metallic Materials; ASTM: West Conshohocken, PA, USA, 2015. [Google Scholar]
  32. Cappa, P. Random errors caused by temperature in magnitude of principal strains evaluated ith 3-element strain gauge rosettes. Strain 2010, 25, 139–142. [Google Scholar] [CrossRef]
  33. Niemi, E.; Fricke, W.; Maddox, S.J. The Structural Hot-Spot Stress Approach to Fatigue Analysis; Springer Nature Singapore Private Limited: Singapore, 2018; pp. 4–11. [Google Scholar]
  34. Mishra, S.K.; Dutta, K.; Ray, K.K. Fatigue life estimation in presence of ratcheting phenomenon for AISI 304LN stainless steel tested under uniaxial cyclic loading. Int. J. Damage Mech. 2015, 25, 431–444. [Google Scholar] [CrossRef]
  35. Stenberg, T.; Barsoum, Z.; Balawi, S.O.M. Comparison of local stress based concepts—Effects of low-and high cycle fatigue and weld quality. Eng. Fail. Anal. 2015, 57, 323–333. [Google Scholar] [CrossRef]
  36. International Institute of Welding. Recommendations for Fatigue Design of Welded Joints and Components; IIW: Paris, France, 2003. [Google Scholar]
  37. BSI. Guide to fatigue design and assessment of steel products; BSI Standards: Paris, France, 2015; Volume 7608. [Google Scholar]
  38. ASTM. Standard Practice for Statistical Analysis of Linearized Stress-Life (S-N) and Strain-Life(ε-N) Fatigue Data; ASTM: West Conshohocken, PA, USA, 2015. [Google Scholar]
  39. Zhao, W.; Cao, J.; Feng, G.; Ren, H. Investigation on Temperature Dependence of Yielding Strength for Marine DH36 Steel. Shipbuild. China 2018, 59, 108–115. [Google Scholar]
  40. Fatih Hayat, H.U. Effect of Heat Treatment on Microstructure, Mechanical Properties and Fracture Behaviour of Ship and Dual Phase Steels. J. Iron Steel Res. 2011, 18, 65–72. [Google Scholar] [CrossRef]
  41. Li, J.; Shi, Y.; Wu, X. Effect of initial hardness on the thermal fatigue behavior of AISI H13 steel by experimental sand numerical investigations. Fatigue Fract. Eng. Mater. Struct. 2018, 41, 1260–1274. [Google Scholar] [CrossRef]
  42. Lee, K.-S.; Song, J.-H. Estimation methods for strain-life fatigue properties from hardness. Int. J. Fatigue 2006, 28, 386–400. [Google Scholar] [CrossRef]
  43. Zubko, P.; Pešek, L. Correlation between Hardness and Fatigue Properties. Key Eng. Mater. 2015, 662, 197–200. [Google Scholar] [CrossRef]
  44. ISO. Hardness Test Method on Welded Joints; ISO: Beijing, China, 2008; Volume GB/T 2654-2008. [Google Scholar]
  45. Dong, Y.; Guedes Soares, C. Stress distribution and fatigue crack propagation analyses in welded joints. Fatigue Fract. Eng. Mater. Struct. 2019, 42, 69–83. [Google Scholar] [CrossRef] [Green Version]
  46. Laird, C.; Krause, A.R. A theory of crack nucleation in high strain fatigue. Int. J. Fract. 1968, 4, 219–231. [Google Scholar] [CrossRef]
  47. Darcis, P.P.; Katsumoto, H.; Payares-Asprino, M.C.; Liu, S.; Siewert, T.A. Cruciform fillet welded joint fatigue strength improvements by weld metal phase transformations. Fatigue Fract. Eng. Mater. Struct. 2010, 31, 125–136. [Google Scholar] [CrossRef]
  48. Walters, C.L. The Effect of Low Temperatures on the Fatigue of High-strength Structural Grade Steels. Procedia Mater. Sci. 2014, 3, 209–214. [Google Scholar] [CrossRef] [Green Version]
  49. Pandey, C.; Saini, N.; Mahapatra, M.M.; Kumar, P. Study of the fracture surface morphology of impact and tensile tested cast and forged (C&F) Grade 91 steel at room temperature for different heat treatment regimes. Eng. Fail. Anal. 2017, 71, 131–147. [Google Scholar] [CrossRef]
  50. Richter-Trummer, V.; Miranda, R.; Albuquerque, C.; de Castro, P.M. Fatigue Crack Striation Spacing for Welded and Base Material CT Steel Specimens. Mater. Sci. Forum 2013, 730, 793. [Google Scholar] [CrossRef]
  51. Li, Z.; Zhang, D.; Wu, H.; Huang, F.; Hong, W.; Zang, X. Fatigue properties of welded Q420 high strength steel at room and low temperatures. Constr. Build. Mater. 2018, 189, 955–966. [Google Scholar] [CrossRef]
Figure 1. The metallographic samples: (a) T-welded joints and (b) cruciform welded joints.
Applsci 10 03742 g001
Figure 2. The profile of T-and cruciform welded joints: (a) T-welded joints and (b) cruciform welded joints (BM: Base Metal, FZ: Fusion Zone, WZ: Weld Zone, HAZ: Heat Affected Zone).
Applsci 10 03742 g002
Figure 3. Microstructure of T-welded joints: (a) WZ, (b) FZ, (c) HAZ, and (d) BM.
Applsci 10 03742 g003aApplsci 10 03742 g003b
Figure 4. Microstructure of cruciform welded joints (the spherical particles in the figures are residual polished sand): (a) WZ, (b) FZ, (c) HAZ, and (d) BM.
Applsci 10 03742 g004
Figure 5. T-welded joint (unit: mm).
Applsci 10 03742 g005
Figure 6. Cruciform welded joint (unit: mm).
Applsci 10 03742 g006
Figure 7. Detail of the test equipment: (a) testing set-up, (b) calibration of low environmental chamber, (c) diagrammatic sketch of half-bridge circuit, and (d) physical sketch of half-bridge circuit.
Applsci 10 03742 g007
Figure 8. Position of strain gauges.
Applsci 10 03742 g008
Figure 9. The normality test of T- and cruciform welded joints at one stress level (percent is a normal distribution cumulative distribution function): (a) T-welded joints and (b) cruciform welded joints.
Applsci 10 03742 g009
Figure 10. S–N curves of two welded joints at low temperature: (a) 50% confidence level and (b) 95% confidence level.
Applsci 10 03742 g010
Figure 11. The distribution of stress: (a) T-welded joints and (b) cruciform welded joints.
Applsci 10 03742 g011
Figure 12. Vickers hardness measurement locations.
Applsci 10 03742 g012
Figure 13. Vickers hardness profiles at −60 °C.
Applsci 10 03742 g013
Figure 14. The stress and Vickers hardness in the failure zone.
Applsci 10 03742 g014
Figure 15. The fractography of two welded joints: (a) the fractography of T-welded joints and (b) the fractography of cruciform welded joints.
Applsci 10 03742 g015aApplsci 10 03742 g015b
Figure 16. The logarithmic S-N curves of cruciform welded joints at room temperature and −60 °C.
Applsci 10 03742 g016
Figure 17. The Vickers hardness of cruciform welded joints at room temperature and −60 °C.
Applsci 10 03742 g017
Table 1. Chemical compositions of DH36 steel.
DH36Chemical Compositions, %
CSiMnPSAlsCr
0.170.201.160.0180.00340.0230.02
NbVTiMoNiCuCeq
0.0150.0020.01700.010.020.37
Table 2. Chemical compositions of filler metal.
CHE50Chemical Compositions, %
CSiMnPSCrNiMoCu
0.240.351.50.0450.050.30.30.30.3
Table 3. Welding conditions.
ParametersUnitValue
Preheat temperature°C100
Filler diametermm1
Welding currentAmps120
Arc voltageVolts22
Heat inputKJ/cm15
Welding processGas metal arc welding (GMAW)
Shielding gasCarbon dioxide
Table 4. The loading condition of fatigue tests.
Mean Stress Levels/MPaThe Number of Specimens
T-Welded JointsCruciform Welded Joints
12033
14066
16066
Table 5. Double logarithmic S–N curve with confidence level.
T-welded joints Applsci 10 03742 i001
50% confidence level lg N = 13.131 3 lg S
95% confidence level lg N = 13.084 3 lg S
Cruciform welded joints Applsci 10 03742 i002
50% confidence level lg N = 13.119 3 lg S
95% confidence level lg N = 13.057 3 lg S
Table 6. Comparison of stress concentration factors between the finite element method (FEM) and tests.
Welded JointsThe Hot-Spot Stress by FEM/MPaThe Nominal Stress by FEM/MPaThe SCF by FEMThe Hot-Spot Stress by Tests/MPaThe Nominal Stress by Tests/MPaThe SCF by Tests
T-welded joints342.188312.51.095352.656313.4681.125
Cruciform welded joints370.522313.471.182387.5315.1791.24

