Article

Investigation of the Correlation between Factors Influencing the Spectrum of Center of Pressure Measurements Using Dynamic Controlled Models of the Upright Stand and Subject Measurements

1
Institute of Electrical Systems and Energy Logistics, Faculty of Mechanical Engineering, Electrical and Energy Systems, Brandenburg University of Technology Cottbus-Senftenberg, 01968 Senftenberg, Germany
2
University Center for Orthopedic and Trauma Surgery, Faculty of Medicine Carl Gustav Carus, Technische Universität Dresden, 01307 Dresden, Germany
*
Author to whom correspondence should be addressed.
Appl. Sci. 2020, 10(11), 3741; https://doi.org/10.3390/app10113741
Submission received: 29 April 2020 / Revised: 18 May 2020 / Accepted: 19 May 2020 / Published: 28 May 2020

Abstract

:
Measuring of the center of pressure (CoP) is one of the most frequently used quantitative methods for quantifying postural performance. The aim of the study is to describe differentiation criteria in the CoP-track for the clinical picture of chronic unspecific back pain. In this study, dynamic models loaded with multi-variable controls are used to determine whether biomechanical questions for upright posture can be answered. These models are particularly well suited for investigating the kinematics and the influence of the influencing disturbance variables. These investigations are extended by power density spectrum (PSD) analyses of CoP measurements on 590 subjects with and without chronic non-specific back pain. Pain patients show an average of 0.5 Nm2 more area under the spectrum than the pain-free reference group. In the power density spectrum different frequency ranges can be assigned to specific body oscillation. Among others, the frequency range between 0.5–0.8 Hz corresponds to the hip movement. In the range around 0.2 Hz, the movements are reflected in the upper body. Patients with back pain experience less activity in certain, individual areas.

1. Introduction

Standing upright is a demanding motor task, which has been in the scientific focus for more than four decades [1,2,3]. Considering that the upright position is more dynamic than static, scientific attention is focused, among other things, on the acting degrees of freedom, the relevant biomechanical parameters and their physical description. Simplifying the interplay of the joint moments in a follow-up reaction as a function of the horizontal center of pressure (CoP) displacement is the common approach in the modelling of postural stability. The resulting model corresponds to a mathematical inverted pendulum, which is still considered as the scientific consensus today [4,5,6,7,8]. The natural frequency of the body when oscillating around the ankle axis is 0.2–0.3 Hz. What speaks against the pendulum model is that the amplitude of the oscillation and the occurring frequency are independent of size and weight [9,10]. Furthermore, it can be assumed that the movements of the head are about the same as those of the hip. There are indications that a reduction of the biomechanical modelling of the immobile stance on the ankle joint is not sufficient enough to fully describe the movement sequence [11,12]. Studies have shown that not only does the ankle joint form a degree of freedom when standing still, but also the knee and hip joints fluctuate depending on the plane of observation (frontal or sagittal plane) [13,14,15]. Furthermore, it could be shown that the hip joint and ankle joint strategy primarily contributes to a calm stance [16,17]. The knee joint especially seems to play an important role in postural counter-reactions [18]. Based on this thesis, a two-pendulum model was proposed [3] (see Figure 1). In fact, under certain pathological conditions, the mechanics of the body fluctuations can be described remarkably well with this [19]. In recent years, various studies have shown that standing upright is a multiple joint process. When this is integrated into a better model concept, a multiple joint process occurs [14,15,20,21,22]. For this purpose, double and triple inverted pendulum models are assumed (see Figure 1). In this, a mechanical system that is inherently unstable (multiple inverted pendulum) is represented as a self-stabilizing system with a very high degree of stiffness in the joints [23,24,25]. However, it is very unlikely that the human muscle apparatus behaves in the same way [15,26,27]. This means that to be able to resist gravity in an upright position, it is necessary to actively influence all mechanical degrees of freedom of the joints. By comparing the spectra of the multi-joint models (Figure 1) with the human spectra, characteristic frequency patterns can be identified. The various models reliably reflect real human balance behavior only within certain limits. However, models based on the multiple joint approach in particular can be used to investigate and explain various phenomena.
Various parameters can be determined from the CoP, such as the distance as the sum of the CoP distance over time [29,30], the speed of the pressure center point [31] and the area enclosed by it. More rarely, the sagittal and lateral center of gravity movements [32] are examined. An effective means of analyzing and displaying these is the frequency analysis or power spectral density (PSD) [33].
The resulting frequency spectra can be altered by changes in the frequency ranges that occur in various cases as ascribed [34]. Thus, a correlation between vestibular disorders and spectral changes in the range of 0.2 Hz, as well as the occurrence of proprioceptive induced fluctuations in the frequency band of 0.5 up to 1.0 Hz, are proven [35]. In various experiments by Kohe-Raz [36], vestibular dysfunction could also be shown. For this purpose, they investigated the spectrum between 0 and 3 Hz, which is divided into eight frequency ranges. The method can localize vestibular disorders in the low frequency range.
In the higher frequency ranges, proprioceptive or central disorders are localized [34,36]. An increased occurrence of frequencies below 0.1 Hz indicates a change in visual labyrinthine control. In contrast, an above-average occurrence of frequencies in the band from 0.2 to 1 Hz leads to problems of somatosensory control circuits cerebellar damage or mobilization of the stretch reflex [34]. Nashner et al., were able to show an increase in movements with frequencies in the range of 0.1 to 0.3 Hz through loss of visual and somatosensory stimuli [33].
It is therefore assumed that individual main frequency ranges can be assigned to specific interference causes [37,38]. However, the results of this approach have not yet been sufficiently evaluated [39].
To further investigate this approach, this study will use a dynamic, controlled model of the upright human stand to perform a spectral analysis to identify and further specify significant peaks in the relevant spectrum. The results of this investigation are to be verified in a test person study.

2. Materials and Methods

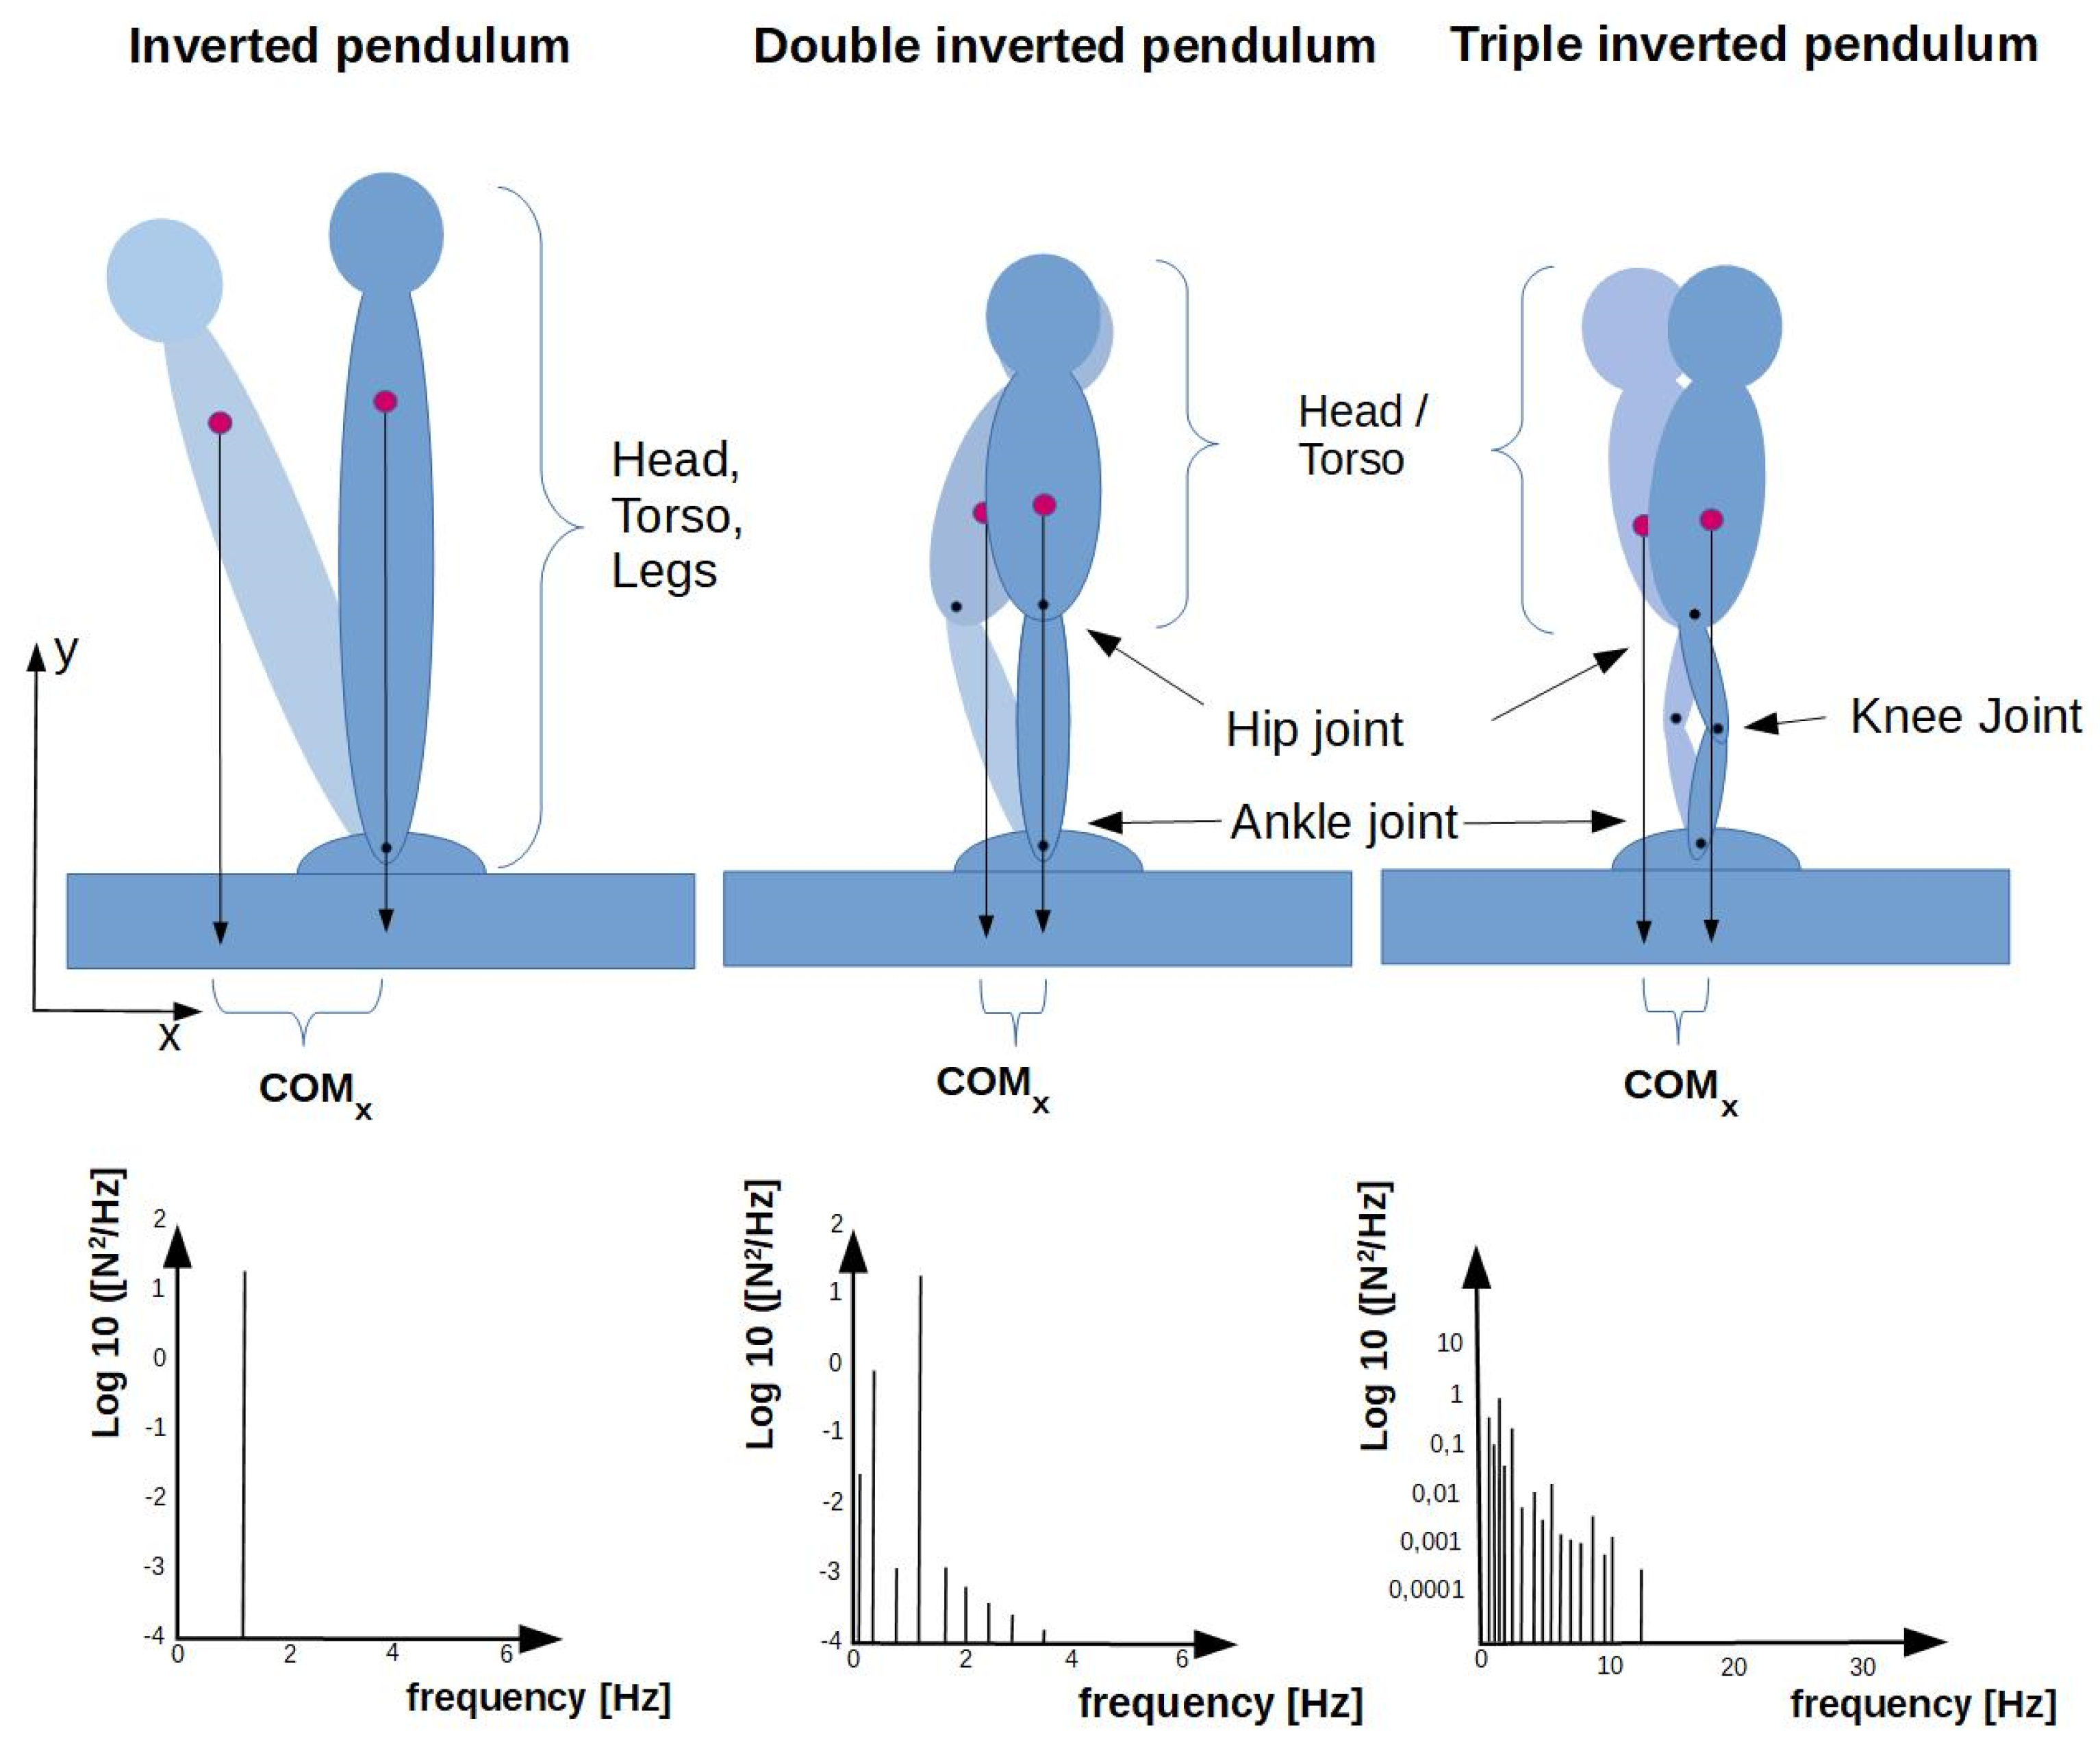
2.1. Structure of the Triple Inverted Pendulum

For a better description of the frequencies acting in the frequency spectrum, the well-known approach of the triple inverted pendulum (TIP, see Figure 1) with a control of the individual joints is developed. The model is developed with the model language Modelica in the Dymola environment. The Modelica standard libraries “Mechanics/Multibody” and “Modelica_LinearSystems2” are used. For the parameterization, a human being with a size of 180 cm and a mass of 75 kg is assumed. The weight distribution on the individual elements was calculated based on the percentage weight distribution in the body according to Saziorski et al. [40]. For mechanical stabilization and approximation of the muscular physiology, spring-damper systems act on the joints. The design of the damping systems in the joints and muscles was adapted from the publication by Günter et al. [28]. The essential change, compared to the models of Günther et al., is the extension of the inverted pendulum by a control structure that actively influences the joint movement. This also offers the possibility to let the gravity vector run in the normal direction. The model can stand upright against gravity. The positioning forces of the muscles are simulated by moments acting on the joints. The starting position of the joints is selected so that the force vector of the center of mass CoM passes through the hip joint behind the knee and in front of the ankle joint [41]. This results in an angle of 150° between the lower and upper thigh. Furthermore, the upper body is inclined by 3° in x direction. Thus, the plumb line in the model of the CoM runs as theoretically described for humans.
The model (see Figure 2) is controlled by a multi-variable controller with 4 input variables and 3 output variables. The input variables are the joint angles measured in the model, which are physiologically equivalent to golgi receptors. In addition, the visual influence on the control is realized by means of a distance measurement to a fixed point in space. The aim of this regulator is that the hip flexion should provide an upright and calm position of the head. For this purpose, a master controller is designed for the control of the hip angle based on the distance measurement, which calculates a setpoint for the hip angle control. The knee and ankle joint controls are designed as simple angle controls. The outputs of the 3 controllers are each connected to the other controllers as disturbance variables. Furthermore, two disorders attack the upper body rod in x direction, oscillating as a disturbance of 7 N with 0.3 Hz which represents respiration and is expressed in z direction as a disturbance of 1 N with 1.3 Hz, which symbolizes the running pulse wave. For comparison and evaluation of the results the TIP model was simplified to the double inverted pendulum model (DIP). For this purpose, the knee joint was removed from the model and the regulation was adjusted accordingly. For the examination a power density spectrum derived from the acting moment in the ankle joint.

2.2. Studies on Test Persons

This study is part of a national study on low back pain. In this context, a number of studies were carried out with the participating probands. These include measurements with the Kistler plate. For this purpose, various stands were recorded in monopedal and bipedal stands. The following is an excerpt of this. These analyses are using 590 subjects that were examined, of which there were 155 men and 272 women without significant back pain and 77 men and 86 women with back pain with a Korff degree of pain [42] higher than 4. The anthropometric data of the volunteers are summarised in Table 1. A plausibility check of the data sets excluded 12 incomplete and 3 damaged or implausible data sets from the statistical analysis. For the study, the subjects stood on a Kistler plate in a bipedal position for 15 s. A Kistler plate type 9260AA was used for the examination. The data acquisition was done at 1 kHz. The control of the experimental setup was implemented using LabVIEW.
For the measurements with test persons, fixed position marks were placed on the Kistler plate for the test persons feet and the test person was instructed in the correct posture. All tests were done without shoes. In addition, the measuring station was provided with an optical marker at a distance of three meters, which the test person was to fix with his eyes during measurement conditions one to three. Instructions on the set-up and execution of the test were given by the test director. The standardized instruction on the test procedure with test subjects included a brief instruction on how to carry out the test and an explanation of the conditions under which the test was stopped (posture of the arms, changes in foot position, putting one leg down in the monopedal position or knee flexion in the monopedal position). A fixed sequence of the measurement program is specified by the software and is given step by step on the screen.

2.3. Data Analysis

The data evaluation is done with the software tool LabVIEW from National Instruments. The filtering is done with a 3rd order Butterworth filter and a cut-off frequency of 14 Hz.
The cut-off frequency for filtering was calculated using the method presented by Koltermann et al. 2019 [43]. During the evaluation, the first 3 s and the last 2 s of the measurement series were cut off. The first 3 s were removed to remove the filter influence. The last 2 s were removed to remove possible deflections at the end of the measurement.
For the statistical analysis of the data, the CoP track points over time in cm was calculated from the sensor raw data and then the power density spectra were calculated for each measurement run. To investigate differences between the measurement groups knee.flexion/knee.without.flexion was examined with a single factor ANOVA. To analyses the differences between the measurement groups man/woman and pain/no pain, was tested with a multifactorial ANOVA. To confirm possible effects, the power and eta2 were calculated. The statistical evaluation was carried out using R version 3.6.3.

3. Results

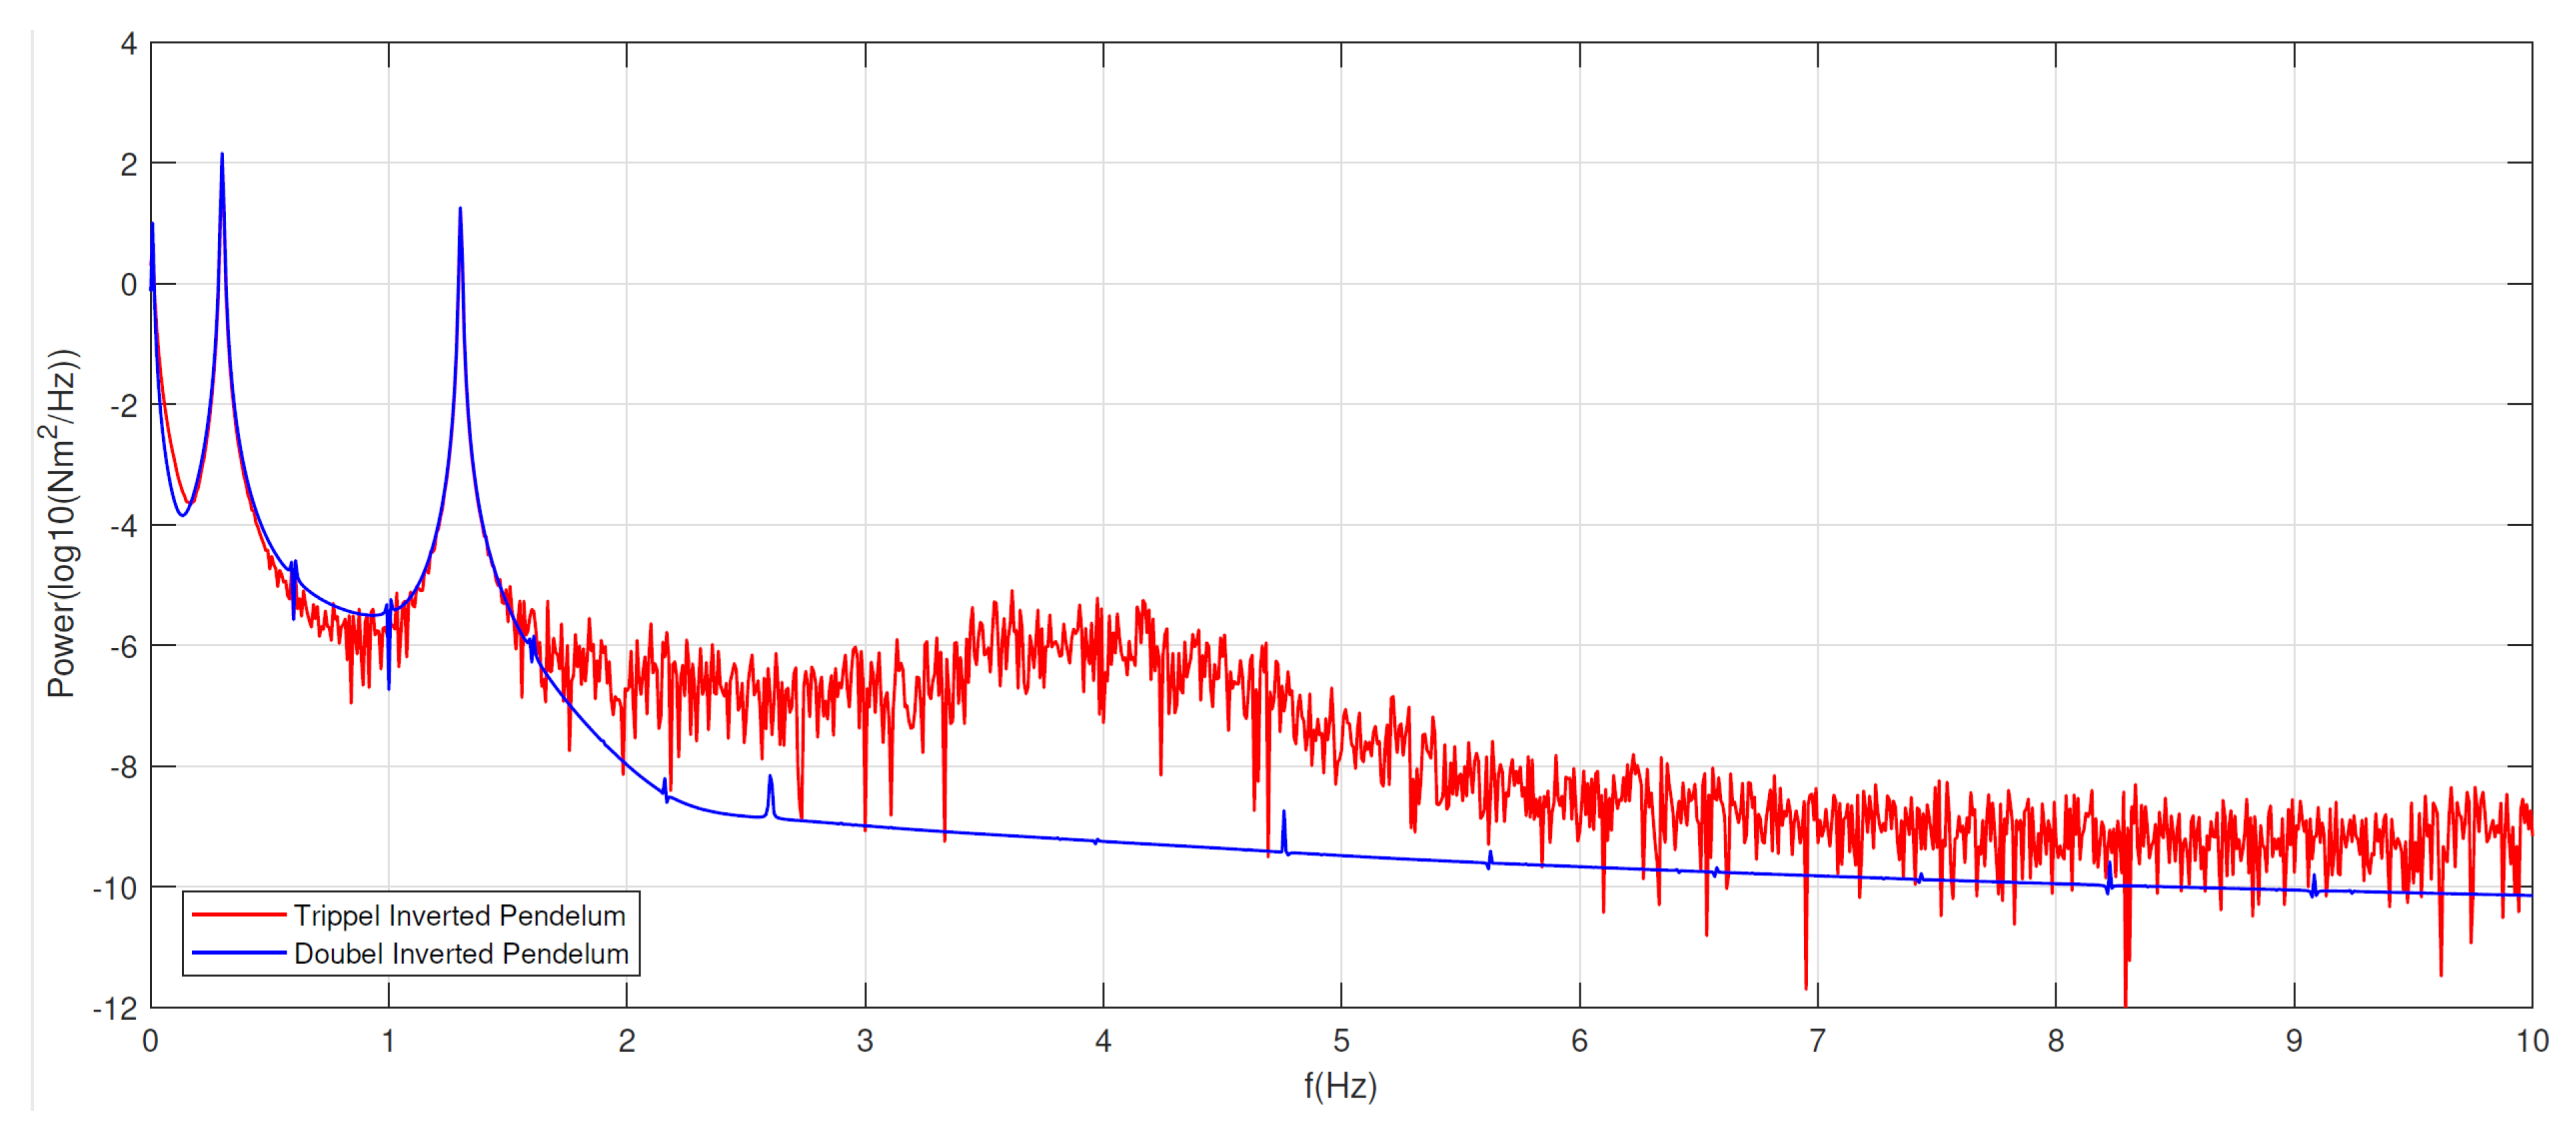
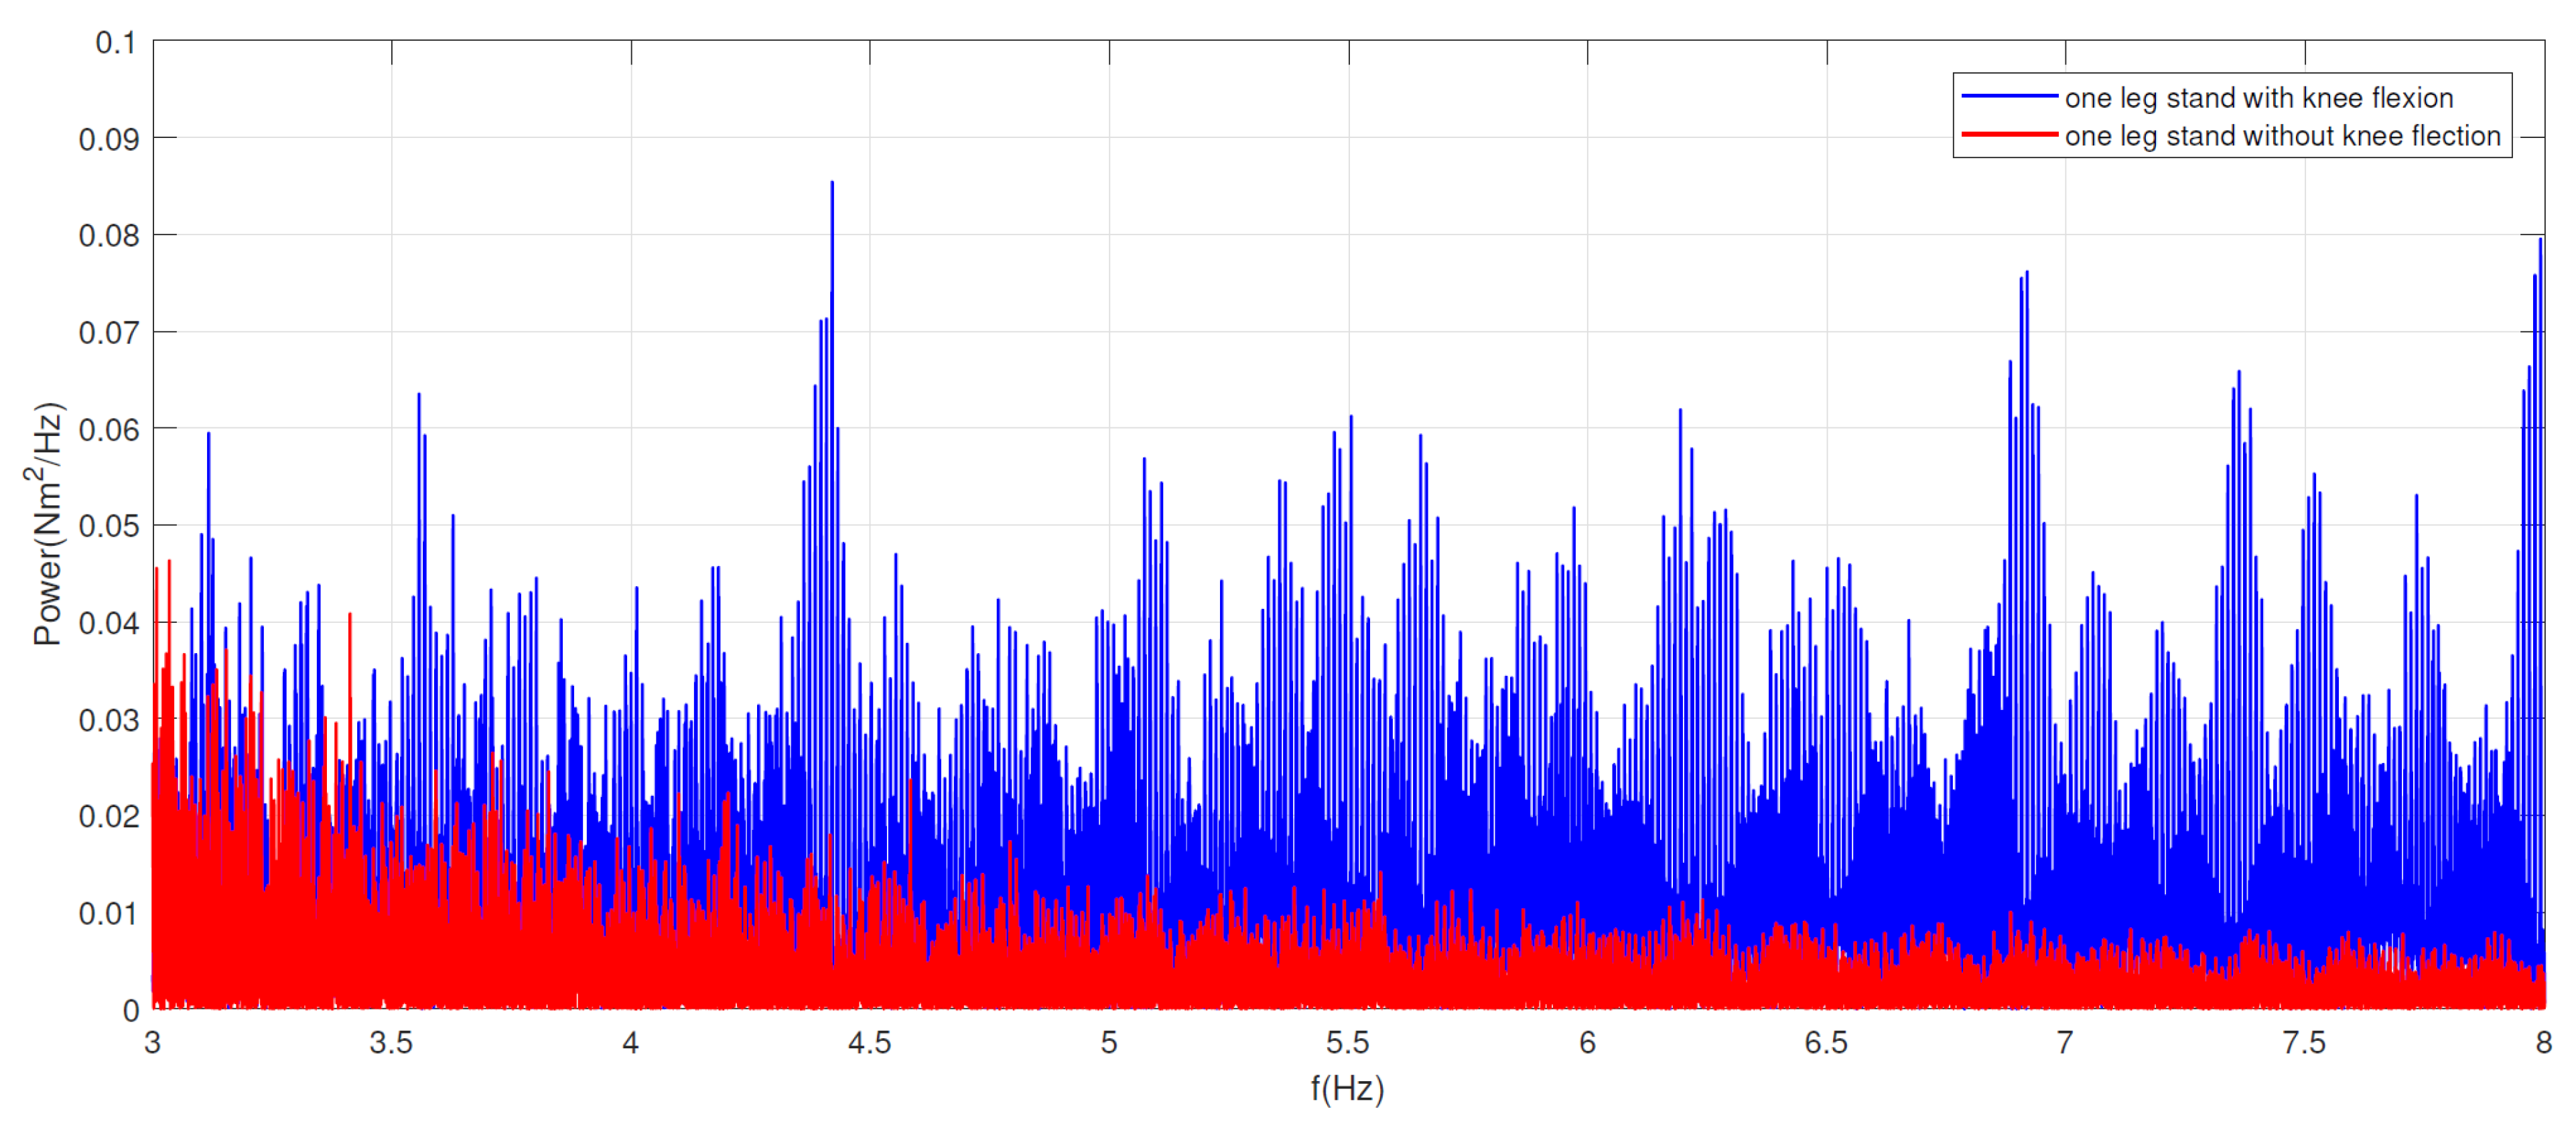
3.1. Frequency Analysis Model Versus Healthy Subjects

The tests with the TIP (see Figure 3) model show very clearly the effects of the connected Interference. The prominent peak at 0.3 Hz originates from the connected disturbance from the movement of the thorax in the respiratory process. The second prominent peak at 1.3 Hz results from the connected disturbance of the circulating pulse wave. The collection of frequencies from 0 to 0.2 Hz can be explained by a very slow drift in the hip joint. In the model, the hip joint and the position of the upper body were changed by 1.5° within 20 s.
In addition, a large number of smaller irregular peaks in the range around 4 Hz can be determined. Comparing the TIP model with the DIP model they cannot be identified, and the entire spectrum has a significantly stronger attenuation from 1.5 Hz. These higher power components are due to the movements of the knee joint, which oscillates minimally in conjunction with the spring-damper system. The difference between the areas under the spectrum is 12.845 Nm2. However, in the range 0–1.5 Hz the characteristics of the spectra are similar and the areas under the spectrum differ by 0.36 Nm2.
From this finding, the question arises whether this behavior can also be shown on the spectrum in test persons. During the test person measurement in the main study, it could be shown that some test persons could not fully push through the knee when standing on one leg, and thus could only stand with a slight knee flexion. To answer this question, the tracks of the test persons in whom this behavior was observed are compared with CoP tracks of comparable test persons without this observation.
Table 2 shows that the mean value of the area under the spectrum in the range of 4–8 Hz is increased in subjects with knee flexion and the group shows greater variability. The result of this investigation is shown in Figure 4 as an average spectrum. In picture part A “Test persons with knee flexion”, it can be seen clearly that in the range above 4 Hz increased peaks can be observed. In contrast, the spectrum of the group without knee flexion greater than 3 Hz shows only minor frequency components.
The relationship shown in Figure 4 was examined for its statistical significance. The results are shown in Table 3. From the results it can be shown that there is a statistically significant difference in the area under the spectrum in the range of 4–8 Hz for the two groups investigated. The subjects without knee flexion have a lower power level in this area of the spectrum.

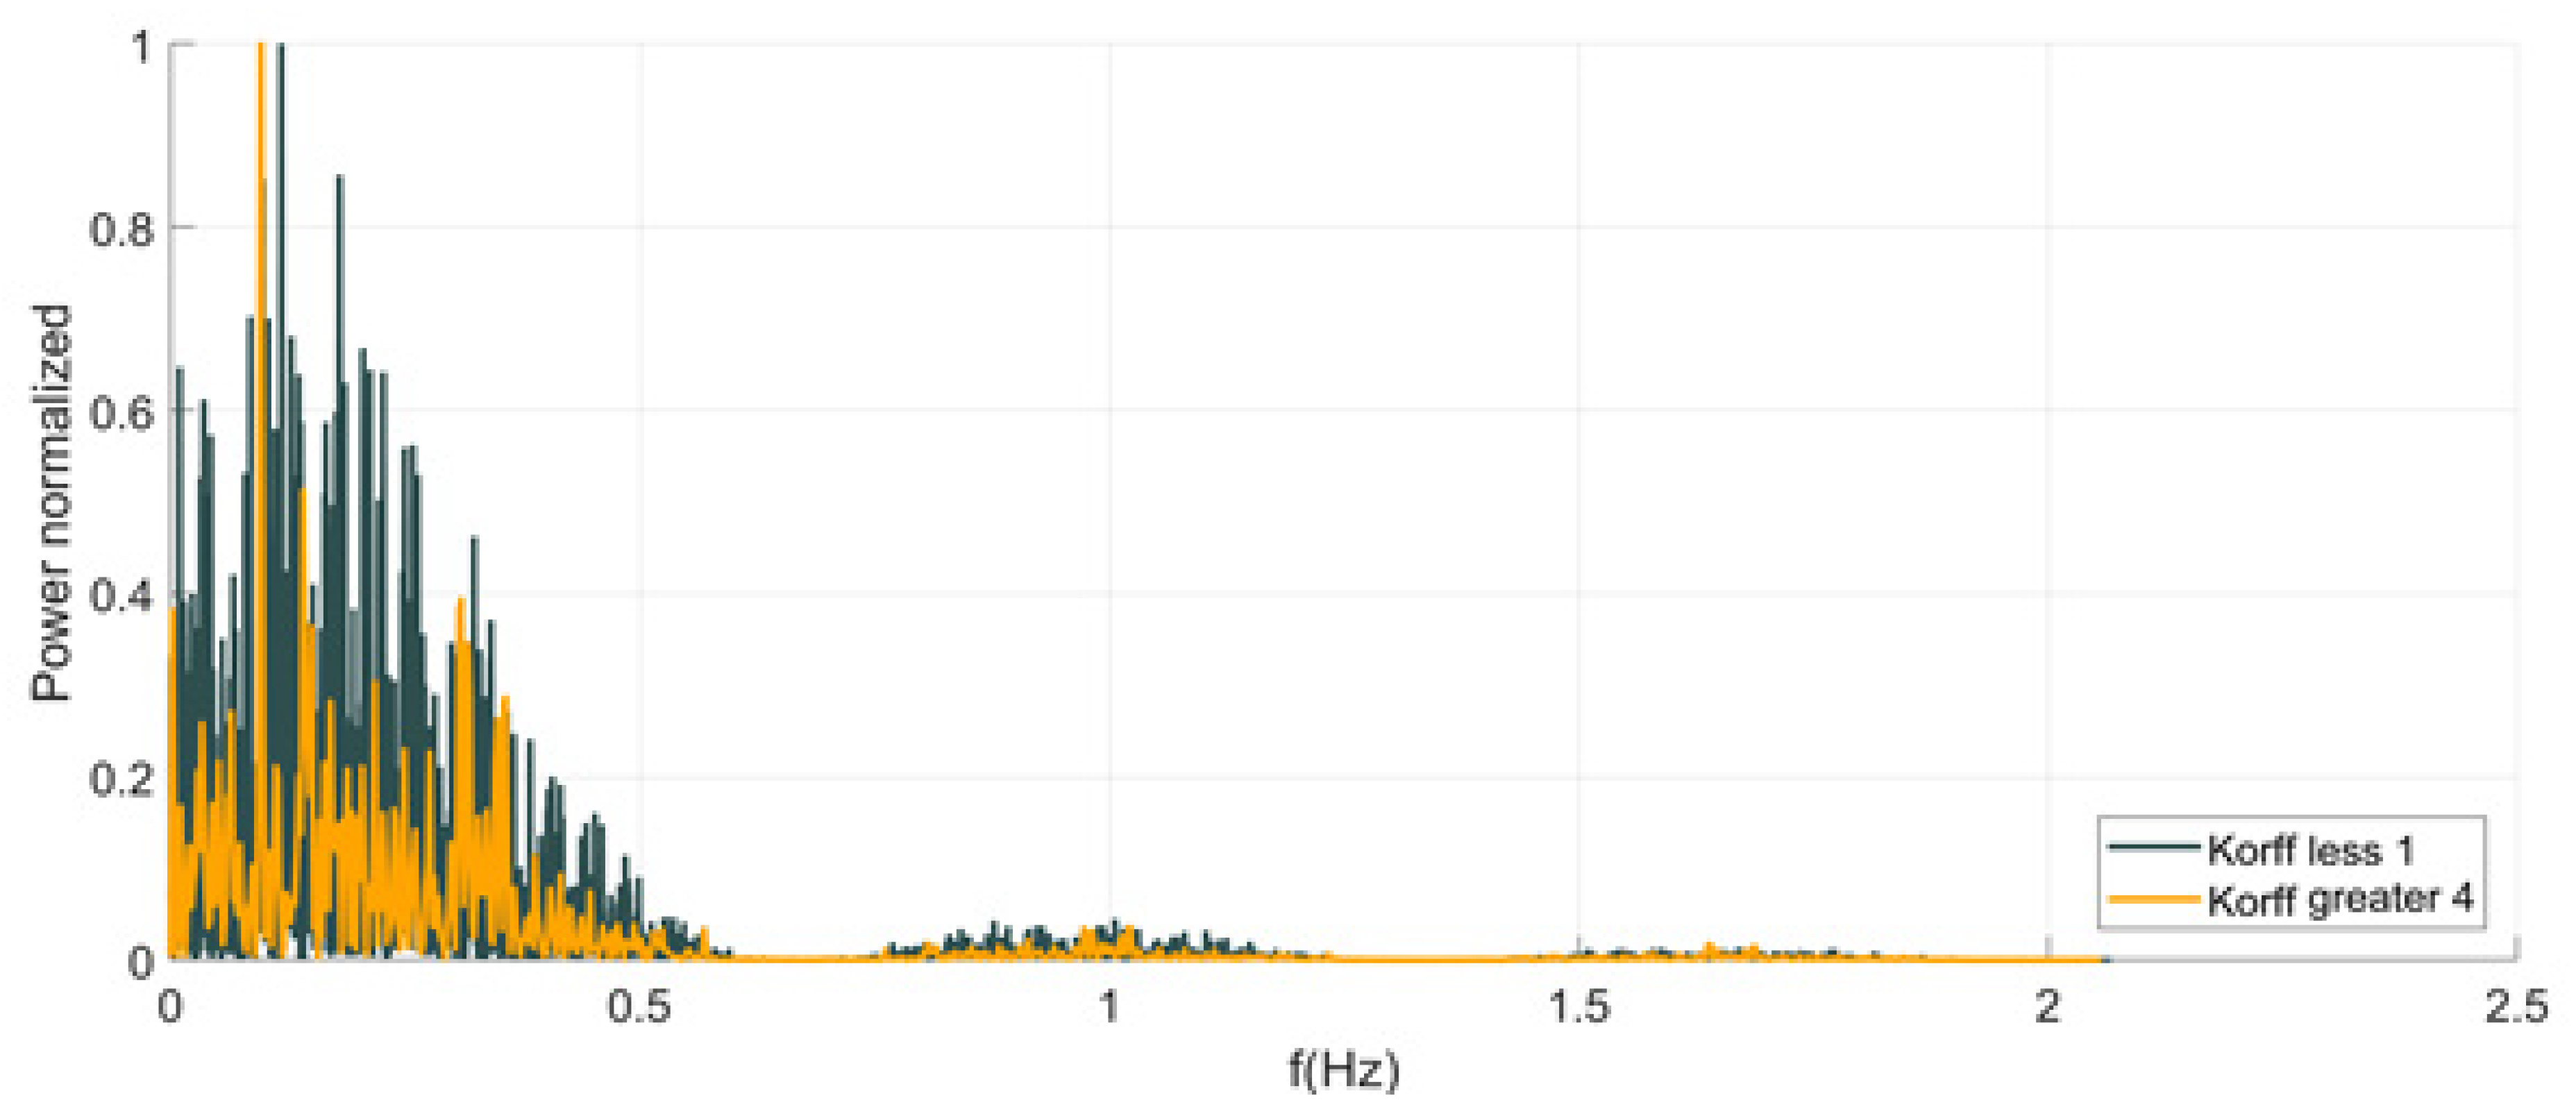
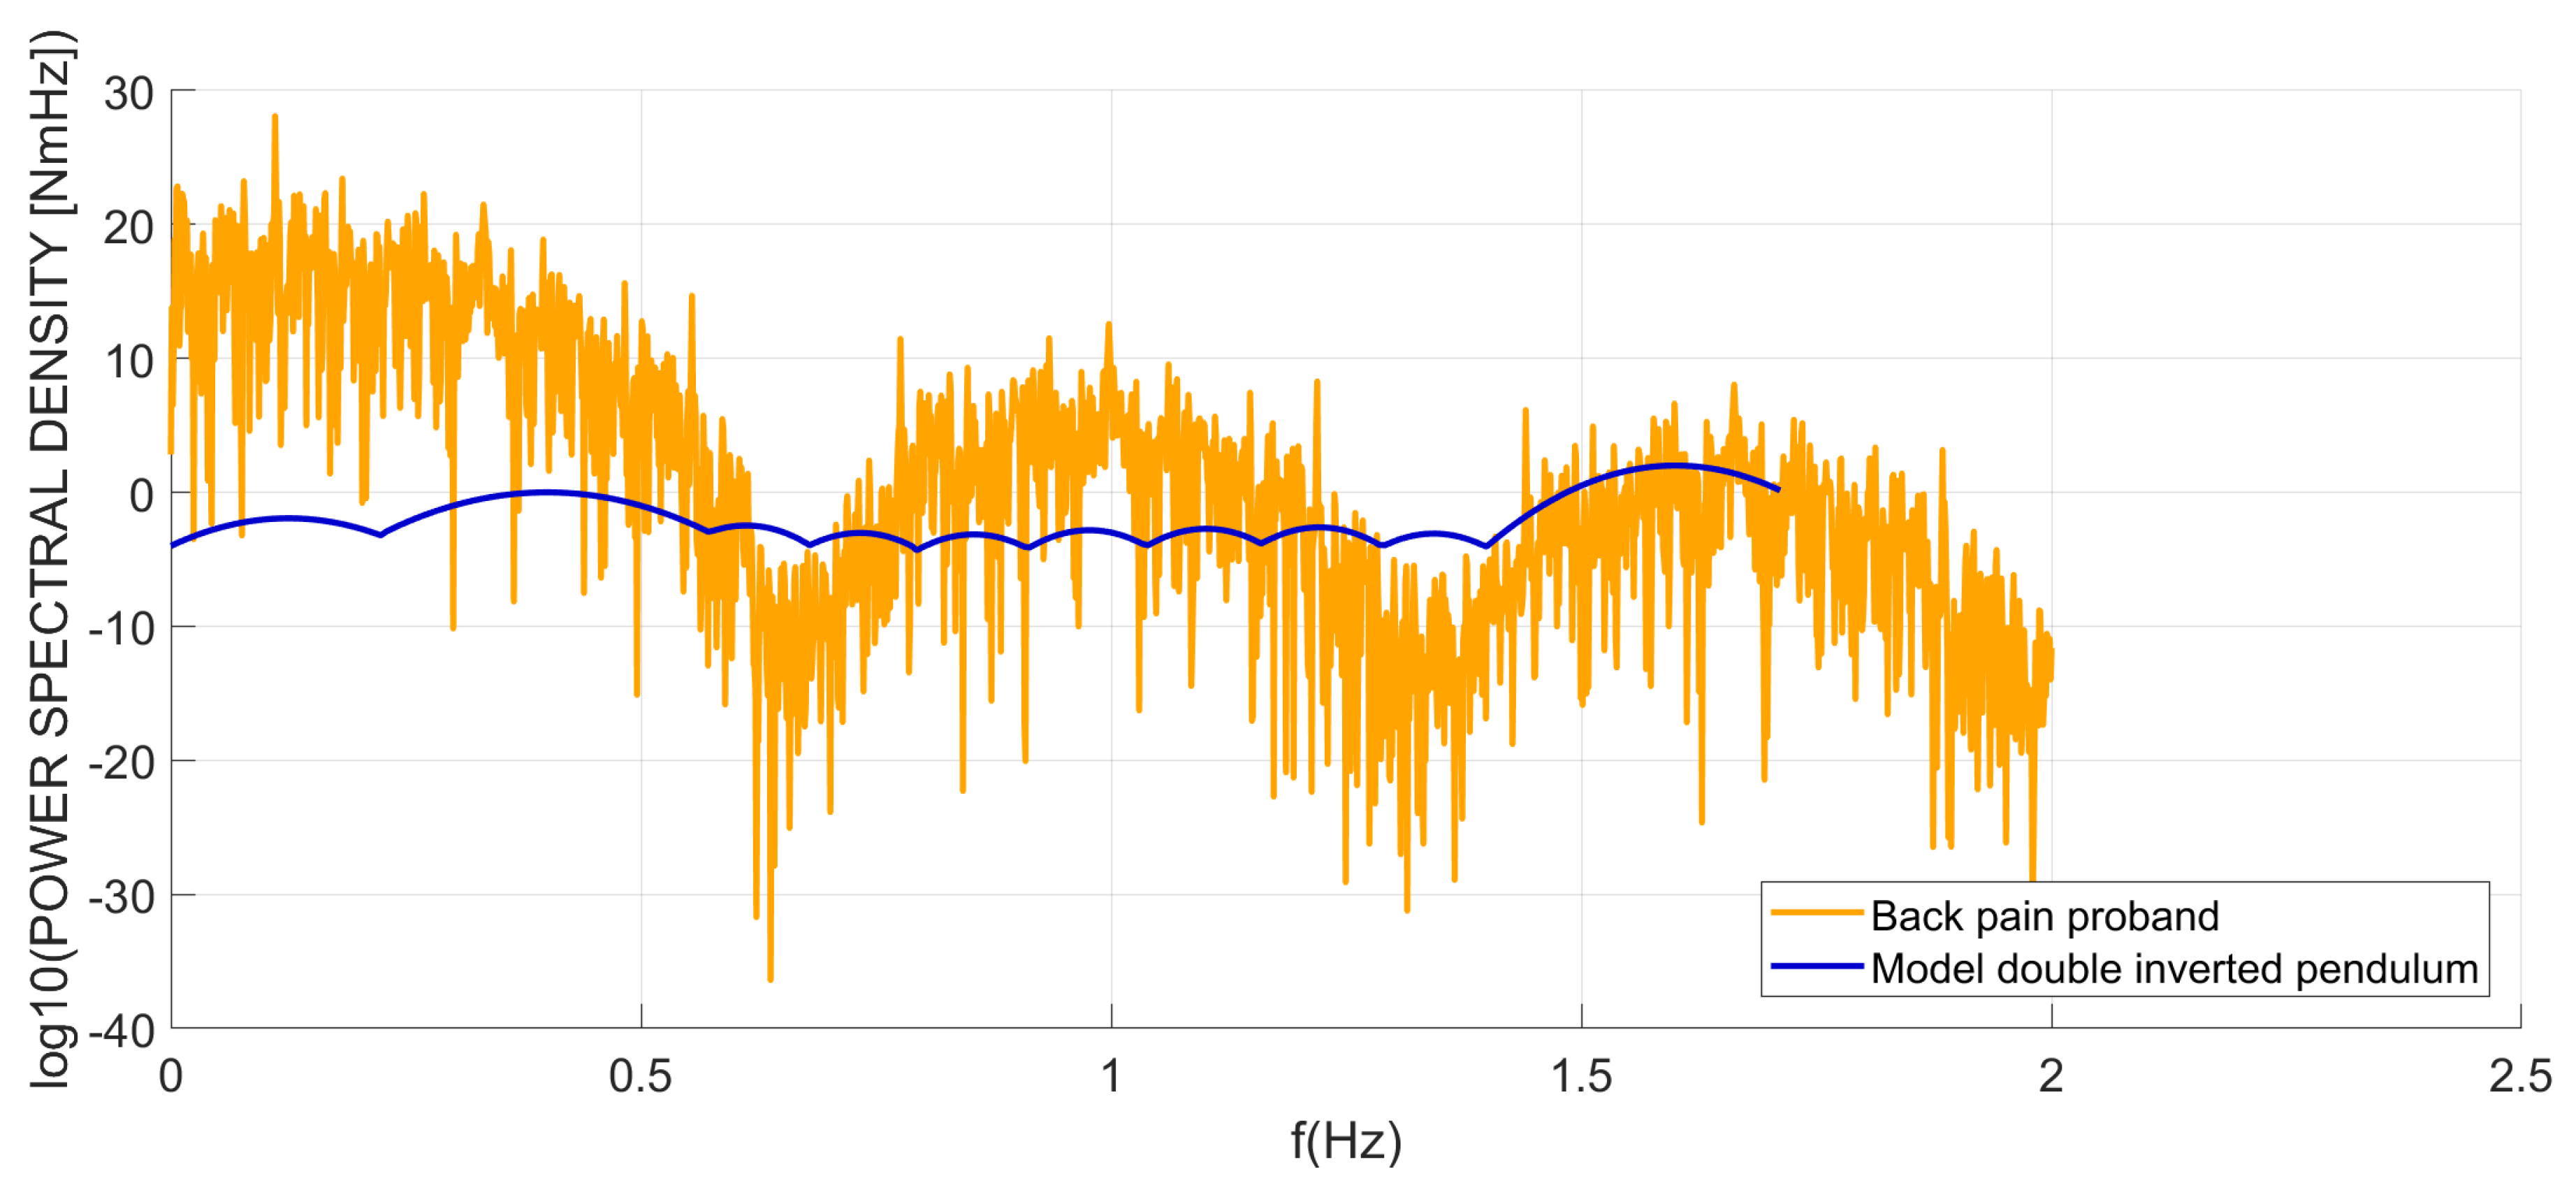
3.2. Test Persons with Back Pain

To analyze the influence of back pain on the CoP track, the test persons are divided into two groups according to the Korff degrees that they have indicated. All test persons who are pain-free form the reference group and all those who gave a Korff value of 4 or higher form the pain group. From each CoP measurement a PSD was calculated. For statistical evaluation of the spectrum, the envelope of each spectrum was formed and the area under it was calculated. The results, separated by gender and degree of pain, are shown in Table 4. Pain patients show an average 0.5 Nm2 higher area under the spectrum than the pain-free reference group. Furthermore, it can be observed that the standard deviation and variance for the group of pain patients decreases.
Figure 5 shows one group spectrum of the power spectral density Analysis for each of the two categories. It is shown that the group of test persons without back pain has a higher performance turnover in the displayed spectrum than the pain patients.
For the statistical examination, the two groups established for the first examination are again divided into men and women and the area under the spectrum is calculated for each subject. The data collected for the groups woman/man with and without pain were compared by means of ANOVA. The result is shown in Table 4.
The ANOVA shows here the difference between the sexes with a p value of 0.4 at a very small power and a very small value for the effect power. For the difference between the degrees of pain the p value is 0.002 with a power of 0.87 and an effect strength of 0.018.

4. Discussion

4.1. Frequency Distribution in Healthy Volunteers

In the CoP spectrum, the neurological phenomena also reflect and classify physiological and mechanical processes. From the literature and investigations carried out in this study, different spectral line ranges in the spectrum are assigned to functional processes in connection with postural control.
From the study of the influence of knee movement (Table 2), subjects with a slight knee flexion (0.67 Nm2 ± 0.24) have an almost 4 times higher power conversion in the range between 4–8 Hz than subjects without knee flexion (0.16 Nm2 ±0.13). The further statistical examination of these results (Table 3) shows that this effect is statistically evident. The calculated effect etasq is 0.63 and has a power of 1. It can be assumed that the movement of the knee has an influence on the posturography measurement result. The calm upright position is a quasi-static state, which is characterized by spontaneous fluctuations of small amplitude. These fluctuations must be continuously balanced. The fluctuating movements are primarily balanced by the ankle joint strategy and proportionally by the hip joint strategy. By the shifting of mass and an effective lever arm from fulcrum to mass point, an applied momentum will result at the supporting surface, which again will be compensated. One of the main causes of relative mass shifts in the body are physiological processes such as respiration and blood circulation.
If biomechanical and motor compensation processes are effective, it can be assumed that these compensatory movements can be detected in the spectrum. According to Hodges et al. [44] (see Figure 6) the dominant frequency component in the range around 0.2 Hz is mainly due to movements in the upper body caused by the breathing process. In their investigations, they recorded the interaction between respiratory frequency and muscle activity of neck, hip, knee and ankle and compared it with the resulting CoP spectrum. This shows an influence of the respiratory frequency on the activity of the stabilizing muscles and that the respiratory frequency can be directly mapped on its corresponding spectral line in the spectrum of the CoP [44].
In an upright position, a vertical force vector of the weight force is generated by the stand, and an equivalent counter force is generated by the stand surface, ignoring external excitations. Both forces are constant and equal in a steady state [5]. If the body is aligned to be absolutely vertical along the longitudinal axis, the weight force and the counter force have the same line of action. As a result, the CoP and CoG (center of gravity) applied to the support area are the same. However, this postural situation is a special case. Instead, a slightly anteriorly displaced position prevails. Here, the force vector of the CoM passes through the hip joint, behind the knee and in front of the ankle joint [41]. This position offers the greatest possible number of degrees of freedom of movement [45]. By simplifying this postural state under the conditions of a postural substitute model based on an inverted pendulum, conclusions can be drawn about the next relevant peak at 0.5–0.8 Hz. Under the assumption that the locomotor system behaves under certain conditions as a simple inverted pendulum, the following equation applies.
f = 1 2 π · g l
The test persons in the underlying spectrum have an average leg length of 0.85 m If this is inserted into the equation, the frequency is 0.54 Hz. This model can be used to map the pendulum movements of the hip in the spectrum from 0.5–0.8 Hz.
Another peak of the spectral lines is at about 1.5 Hz. For this, it can be concluded from the literature that it reflects the influence of cardioactivity. In 1980, Strüm and colleagues examined the measurability of the running pulse wave in the cardiological system for postural stability. Their results show that the running pulse wave has a measurable influence on the measurement result with a force plate that records the force effect in the Z-direction [46] (see Figure 7).
A further component in the description of the spectrum is the classification of the activity of the lower extremities. To maintain the alignment of the body, tonic innervation of M. Soleus and M. Gastrocnemius is performed in addition to the activation of the anti-gravity muscles along the body axis.
However, the body is not able to keep the muscle power constant over a longer period due to the way the muscles are activated. Even small changes in the force effect cause counterforces with corresponding desensitization moments. In the case where the knee is not stiff due to flexion, the ankle strategy and the hip strategy to maintain balance are used in this state. This thesis coincides with the results of the literature analysis. Here it could be shown that compared to test persons without knee flexion, a change in the spectrum can be observed with slight knee flexion (increased power conversion in the range of 4–8 Hz). All results are summarized in Figure 8 below.
For the measurements with test persons, fixed position marks for the test persons’ feet were placed on the test objects and the test person was instructed in the correct body posture. Instructions were given to the test supervisor on how to set up and conduct the test. The standardized instruction for the test procedure with test persons included a short briefing on how to carry out the test as well as an explanation of the termination conditions (posture of the arms, changes in the foot position, putting one leg down in the monpedal position, etc.). A fixed sequence of the measuring program is preset by the software and is presented step by step on the screen to the person performing the test. Since each standing position is only completed once and all are completed in short succession, it can be assumed that there are no learning effects. To prevent fatigue, the test persons are required to perform short movement units between the individual measurements and the sequence is structured so that monopedal measurements alternate with bipedal measurements. The measures taken make it possible to conclude that differences that arise when several different persons perform the measurements were not to be expected.

4.2. Test Persons with Low Back Pain

The results in Table 4 show a difference in the mean values of both genders for different degrees of pain. This difference was investigated using ANOVA. The results show that there is a difference between the pain levels. The determination of the effect size (Table 5) shows at partial.etasq = 0.018 and omegasq = 0.016. A key disadvantage of the partial eta square is that it always overestimates the resolved variance. The distortion becomes smaller the larger the sample size becomes. For small samples, omega-square should be preferred as a measure of variance elucidation [47]. With a value of 0.016 it can be assumed according to Ellis that a small effect is present [48]. Furthermore, if the power is 0.87, it can be assumed that the false null hypothesis was correctly rejected and that the effect actually exists.
The results show that test persons who give a Korff value (4 or higher) for back pain have a lower power conversion in the spectrum. This allows the conclusion that pain patients have lower vibration amplitudes and stand more rigidly. From the literature it is known that back pain often occurs in top athletes and people with poorly trained back muscles [49]. In scientific discourse, the connection between structural changes in the spinal column and back pain has not been clarified to date. In addition to functional diagnostics, imaging procedures such as magnetic resonance tomography are also used in diagnostics [50]. Another component in diagnostics is the measurement of postural control. Here it is true that back pain subjects have a reduced postural control [51]. Electromyography analyses of the trunk musculature revealed differences between people with back pain and healthy people [52,53]. Increased latencies or a reduced level of muscular activity on a disturbance stimulus were found here [52,54]. A further approach in diagnostics can be the consideration of the frequency spectrum of the posturographic measurement. The results showed that the spectrum of subjects with back pain differed from those without back pain (see Table 4). Comparing the spectrum of the back pain group with the spectrum of a double inverted pendulum according to [15], which was excited in the upper segment with 8000 N, a similar course is obtained (see Figure 7). The power conversion in the spectrum of the group of test persons compared to the model is negligible for the consideration, since the model represents an idealization of the measurement condition, as well as a strong simplification of the test person, and experiences a unique extrinsic excitation. However, the characteristic maxima between 0 and 0.6 Hz, and at 1.6 Hz, are also present in the model (see Figure 9).
The controlled models presented here also show comparable characteristics. Furthermore, the difference in the range of 0–1.5 Hz with 0.36 Nm2 is similar to the difference of the male groups of Korff 1 vs. Korff > 4 (0.49 Nm2). This suggests that myosclerosis in the back, which often occurs in chronic unspecific back pain, causes the body to behave more like a double inverted pendulum than a triple inverted pendulum from a biomechanical point of view.
This can be seen as a further indication that back pain subjects have a partial restriction in one degree of freedom. This also indicates that the regulation or neurological muscular control has an additional influence. It also explains the increased latencies from the EMG measurements, as shown as the biomechanical equivalent of the significantly higher degrees of stiffness in the joints in simulation models [23,24,25].

5. Conclusions

In the investigation it was shown that by using different controlled models of the inverted pendulum, questions for the upright position can be answered. These models are particularly suitable for investigating the kinematics and the influence of the acting disturbance variables.
The study includes the evaluation of test person measurements with and without chronic unspecific back pain. The aim of the study is the description of differentiation criteria in the CoP-track for the clinical picture of chronic unspecific back pain in healthy individuals.
For a better understanding of how different processes in the body during upright standing affect the spectrum, four areas in the spectrum have been assigned from the literature and from the investigations of this work. The dominant peak in the 0.2 Hz range can be attributed mainly to movements in the upper body caused by breathing. Furthermore, the pendulum movements of the hip can be mapped in a spectrum between 0.5–0.8 Hz.
Another peak of the spectral lines is at about 1.5 Hz. This reflects the influence of cardio activity. Movements in the knee become visible in the spectrum between 4–7 Hz.
From the investigations of a measurement data set of test persons with and without back pain, it could be shown that the areas in the power density spectrum for back pain test persons (Korff 4 or higher) are smaller than for test persons with a Korff coefficient of zero. This reduced performance turnover can be taken as an indication of a loss of mobility. Further studies should investigate the changes in the spectrum in different ranges between zero and 10 Hz. This can provide information about the biomechanical cause of the complaints. Based on further results in this field, frequency analysis can usefully extend the quality of the CoP.
Including the results from the literature and the presented study, it would be useful to consider the influences in future studies. Therefore, it would be useful to include only the frequencies below 3 Hz in investigations concerning the interaction of hull and hips. In this way the influence of knee movement shown here can be minimized. It is also recommended to select more than the 10 s used in this study for CoP measurements in order to achieve a higher frequency density.

Author Contributions

J.J.K. and conceived and designed the experiments; J.J.K. performed the experiments; J.J.K., and M.B. analyzed the data; J.J.K., H.B. and M.B. contributed reagents/materials/analysis tools; J.J.K. and wrote the paper. All authors have read and agreed to the published version of the manuscript.

Funding

The present study was funded by the German Federal Institute of Sport Science (http://www.bisp.de). The research was realized within the project RAN Rücken (ZMVI1-080102A/11-18). Funding were received by PP. The funders had no role in study design, data collection and analysis, decision to publish, or preparation of the manuscript.

Conflicts of Interest

The authors declare no conflict of interest. The founding sponsors had no role in the design of the study; in the collection, analyses, or interpretation of data; in the writing of the manuscript, and in the decision to publish the results.

References

  1. Murray, M.; Seireg, A.; Scholz, R. Centre of gravity, centre of pressure and supportive. J. Appl. Physiol. 1967, 23, 831–838. [Google Scholar] [CrossRef] [PubMed]
  2. Gurfinkel, V.; Osevets, M. Dynamics of the vertical posture in man. Biophysics 1972, 17, 496–506. [Google Scholar]
  3. Geursen, J.; Altena, D.; Massen, C.; Verduin, M. model of standing man for the description. Agressologie 1976, 17, 63–69. [Google Scholar] [PubMed]
  4. Mergner, T.; Maurer, C.; Peterka, R. Controlling balance during quiet standing: Proportional and derivative controller generates preceding motor command to body sway position observed in experiments. Gait Posture 2006, 23, 164–172. [Google Scholar]
  5. Winter, D.; Patla, A.; Ishac, M.; Gage, W. Motor mechanisms of balance during quietstanding. J. Electromyogr. Kinesiol. 2003, 13, 49–456. [Google Scholar] [CrossRef]
  6. Gage, W.; Winter, D.; Frank, J.; Adkin, A. Kinematic and kinetic validity of the inverted pendulum model in quiet standing. Gait Posture 2004, 19, 124–132. [Google Scholar] [CrossRef]
  7. Kiemel, T.; Oie, K.; Jeka, J. Slow dynamics of postural sway are in the feedback loop. J. Neurophysiol. 2006, 95, 1410–1418. [Google Scholar] [CrossRef] [Green Version]
  8. Madigan, M.; Davidson, B.; Nussbaum, M. Postural sway and joint kinematics during quiet standing are affected by lumbar extensor fatigue. Hum. Mov. Sci. 2006, 25, 788–799. [Google Scholar] [CrossRef]
  9. Edwards, A.S. The measurement of static ataxia. Am. J. Psychol. 1941, 55, 171–188. [Google Scholar] [CrossRef]
  10. Kapteyn, T.S. Data processing of posturographic curves. Agressologie 1972, 13, 29–34. [Google Scholar]
  11. Loram, I.; Lakie, M. Human balancing of aninverted pendulum: Position control by small, ballistic-like, throw and catch movements. J. Physiol. 2002, 540, 1111–1124. [Google Scholar] [CrossRef] [PubMed]
  12. Loram, I.; Maganaris, C.; Lakie, M. Human postural sway results from frequent, ballistic bias impulses by soleus and gastrocnemius. J. Physiol. 2005, 564, 295–311. [Google Scholar] [CrossRef] [PubMed]
  13. Day, B.; Steiger, M.; Thompson, P.; Marsden, C. Effect of vision and stance width on human body motion when standing: Implications for afferent control of lateral sway. J. Physiol. 1993, 469, 479–499. [Google Scholar] [CrossRef]
  14. Hsu, W.; Scholz, J.; Schöner, G.; Jeka, J.; Kiemel, T. Control and estimation of posture during quiet stance depends on multi joint coordination. J. Neurophysiol. 2007, 97, 3024–3035. [Google Scholar] [CrossRef] [Green Version]
  15. Günther, M.; Müller, O.; Blickhan, R. Watching quiet human stance to shake off its straitjacket. Arch. Appl. Mech. 2011, 81, 283–302. [Google Scholar] [CrossRef]
  16. Nashner, L.; McCollum, G. The organization of human postural movements: A formal basis and experimental synthesis. Behav. Brain Sci. 1985, 8, 135–172. [Google Scholar] [CrossRef]
  17. Horak, F.; Nashner, L.M. Central programming of postural movements: Adaption to alteredsupport configurations. J. Neurophysiol. 1986, 55, 1369–1381. [Google Scholar] [CrossRef]
  18. Wilson, E.; Madigan, M.; Davidson, B.; Nussbaum, M. Postural strategy changes with fatigue of the lumbar extensor muscles. Gait Posture 2006, 23, 348–354. [Google Scholar] [CrossRef]
  19. Berger, W.; Dietz, V.; Hufschmidt, A.; Jung, R.; Mauritz, K.H.; Schmidtbleicher, D. Haltung und Bewegung beim Menschen: Physiologie, Pathophysiologie, Gangentwicklung und Sporttraining; Springer Verlag: Berlin/Heidelberg, Germany, 1984. [Google Scholar]
  20. Kuo, A. An optimal state estimation model of sensory integration in human postural balance. J. Neural. Eng. 2005, 2, 235–249. [Google Scholar] [CrossRef]
  21. Saffer, M.; Kiemel, T.; Jeka, J. Coherence analysis of muscle activity during quietstance. Exp. Brain Res. 2008, 185, 215–226. [Google Scholar] [CrossRef] [Green Version]
  22. Creath, R.; Kiemel, T.; Horak, F.; Peterka, R.; Jeka, J. unified view of quietand perturbed stance: Simultaneous co-existing excitable modes. Neurosci. Lett. 2005, 377, 75–80. [Google Scholar] [CrossRef] [PubMed]
  23. Edwards, W. Effect of joint stiffness on standing stability. Gait Posture 2007, 25, 432–439. [Google Scholar] [CrossRef] [PubMed]
  24. Grimmer, S.; Ernst, M.; Günther, M.; Blickhan, R. Running on uneven ground: Leg adjustment to vertical steps and self-stability. J. Exp. Biol. 2008, 211, 2989–3000. [Google Scholar] [CrossRef] [PubMed] [Green Version]
  25. Blickhan, R.; Seyfarth, A.; Geyer, H.; Grimmer, S.; Wagner, H.; Günther, M. Intelligence by mechanics. Philos. Trans. R. Soc. Lond. 2007, 365, 199–220. [Google Scholar] [CrossRef] [PubMed]
  26. van Soest, A.; Haenen, W.; Rozendaal, L. Stability of bipedal stance: The contribution of cocontraction and spindle feedback. Biol. Cybern. 2003, 8, 293–301. [Google Scholar] [CrossRef] [PubMed] [Green Version]
  27. Rozendaal, L.; van Soest, A. Joint Stiffness Requirements in a Multi-Segment Stance Mode. In Proceedings of the 20th Congress of the International Society of Biomechanics. Cleveland Clinic Foundation, Cleveland, OH, USA, 31 July–5 August 2005. [Google Scholar]
  28. Günther, M.; Wagner, H. Dynamics of quiet human stance: Computer simulations of a triple inverted pendulum model. Comput Methods Diomech Biomed Enfin 2016, 19, 819–834. [Google Scholar] [CrossRef]
  29. Stoll, W. Posturographie in der Vestibularisdiagnostik- Prinzip, Interpretation und klinische Erfahrung. Laryngol. Rhinol. Otol. Stuttg. 1985, 64, 590–594. [Google Scholar] [CrossRef]
  30. Norre, M.E.; Forrez, G. Posture testing (Posturography) in the diagnosis of peripheral-Vestibular Pathology. Vestib. Pathol. 1986, 243, 186–189. [Google Scholar] [CrossRef]
  31. Aalto, M.; Pyykko, I.; Starck, J. Computerized Posturography, a development of the measuring system. Acta Otolaryngol. Suppl. Stock. 1988, 449, 71–75. [Google Scholar] [CrossRef]
  32. Hytönen, M.; Pyykkö, I.; Aalto, H.; Juhola, M.; Ramsay, H. Vestibulo-Ocular and Vestibulo- Spinal Reflexes in Evaluation of Vestibular Lesions. Acta Otolaryngol. Suppl. Stock. 1989, 486, 231–234. [Google Scholar] [CrossRef]
  33. Nashner, L.; Berthoz, A. Visual contribution to rapid motor responses during posturalcontrol. Brain Res. 1978, 150, 403–407. [Google Scholar] [CrossRef]
  34. Kohen-Raz, R. Application of tetra-ataxiametric posturography in clinical and developmental diagnosis. Percept. Mot. Ski. 1991, 48, 635–665. [Google Scholar] [CrossRef] [PubMed]
  35. De Witt, G. Optic versus vestibular and propriozeption impulses, measured by posturometry. Aggressologie 1972, 13, 75–79. [Google Scholar]
  36. Kohen-Raz, R.; Himmelfarb, M.; Tzur, S.; Kohen-Raz, A.; Shub, Y. Perzeptual and Motor Skils An Initial Evaluation Of Work Fatigue And Circadian Changes By Multiplate Posturography. Percept. Mot. Ski. 1996, 82, 547–557. [Google Scholar] [CrossRef] [PubMed]
  37. Era, P.; Heikkinen, E. Postural sway during standing and unexpected disturbance of balance in random samples of men of different ages. J. Gerontol. 1985, 40, 287–295. [Google Scholar] [CrossRef]
  38. Maki, B.E.; Holliday, P.J.; Fernie, G.R. Aging and postural control. A comparison of spontaneous- and induced-sway balance tests. J. Am. Geriatr. Soc. 1990, 38, 1–9. [Google Scholar] [CrossRef]
  39. Basta, D. Posturografische Verfahren. In Gleichgewichtsstörungen; Basta, D., Ed.; Georg Thieme: Stuttgart, Germany, 2012. [Google Scholar]
  40. Saziorski, W.M.; Aruin, A.S.; Selujanow, W.M. Biomechanik des Menschlichen Bewegungsap-Parates; Sportverlag: Berlin, Germany, 1984. [Google Scholar]
  41. Basmajian, J.V.; De Luca, C.J. Muscles Alive: Their Functions Revealed by Electromyography; Lippincott Williams & Wilkins: Baltimore, MD, USA, 1985. [Google Scholar]
  42. von Korff, M.; Ormel, J.; Keefe, F.J. Grading the severity of chronic pain. Pain 1992, 50, 133–149. [Google Scholar] [CrossRef]
  43. Koltermann, J.J.; Gerber, M.; Beck, H.; Beck, M. Validation of Different Filters for Center of Pressure Measurements by a Cross-Section Study. Technologies 2019, 7, 68. [Google Scholar] [CrossRef] [Green Version]
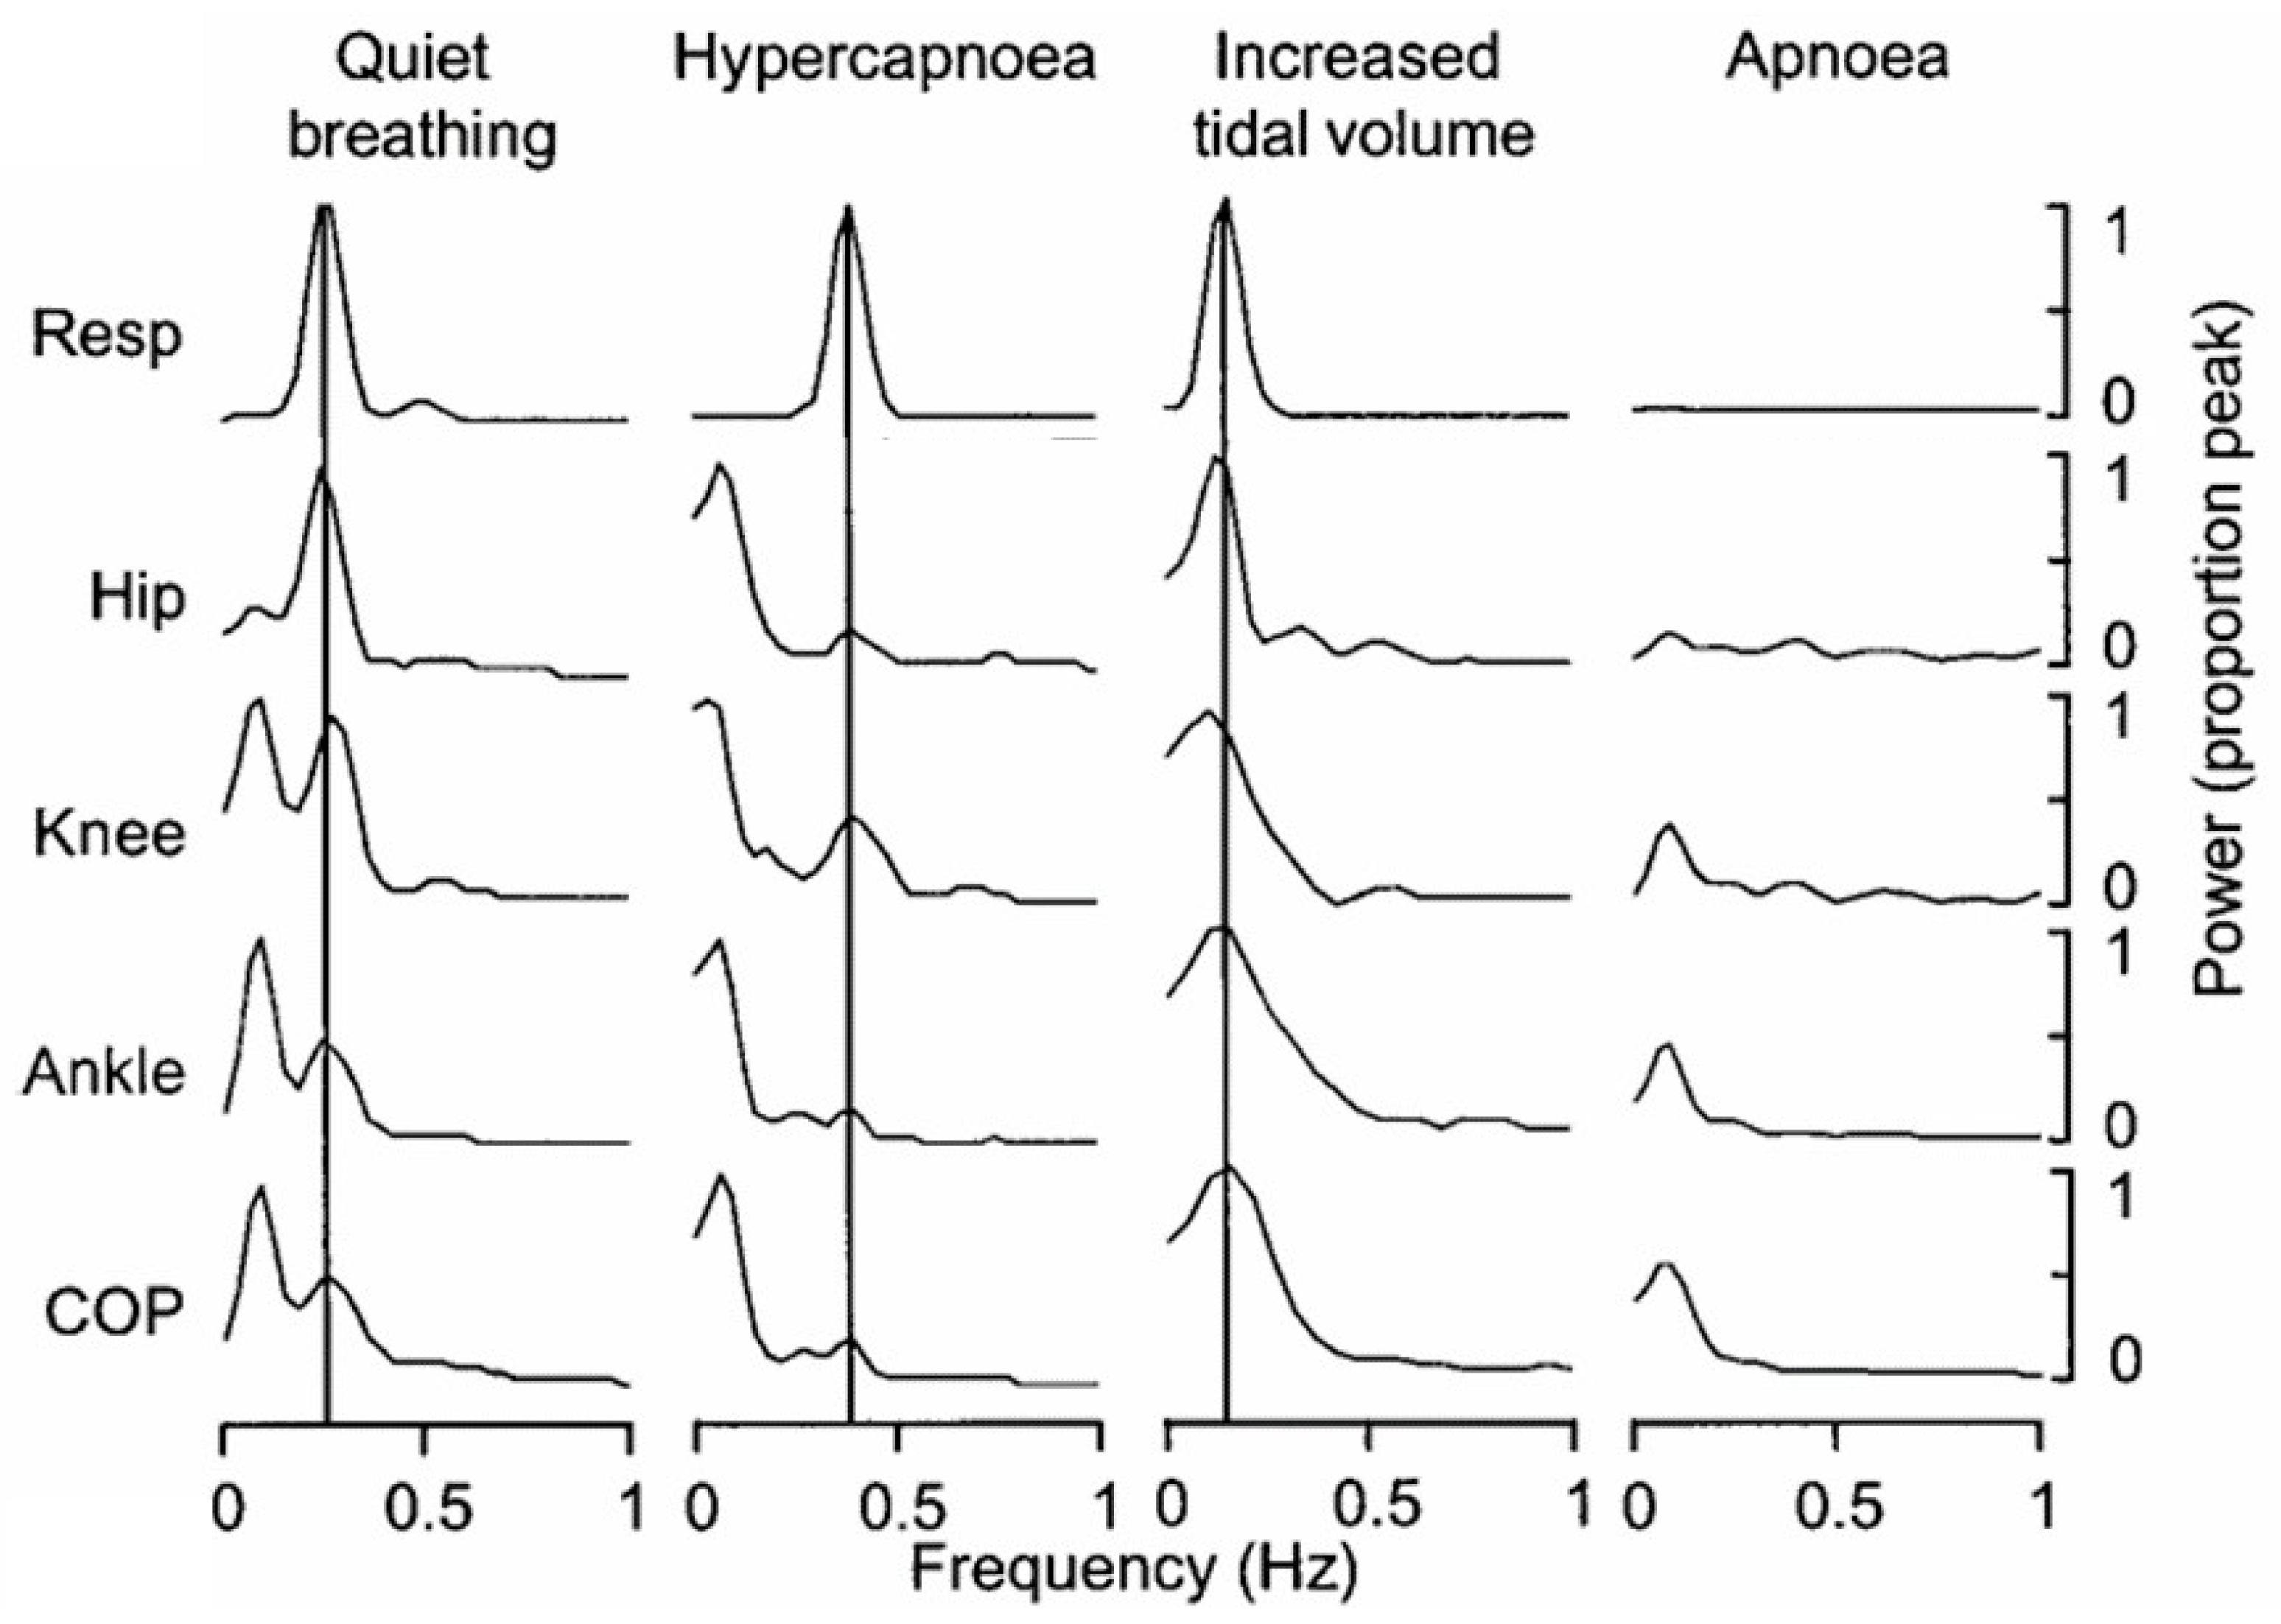
  44. Hodges, P.W.; Gurfinkel, V.S.; Brumagne, S.; Smith, T.C.; Cordo, P.C. Coexistence of stability and mobility in postural control: Evidence from postural compensation for respiration. Exp. Brain Res. 2002, 144, 293–302. [Google Scholar] [CrossRef]
  45. Chen, C.L.; Lou, S.Z.; Wu, H.W.; Wu, S.K.; Yeung, K.T.; Su, F.C. Effects of the type and direction of support surface perturbation on postural responses. J. Neuroeng. Rehabil. 2014, 11, 1–12. [Google Scholar] [CrossRef] [Green Version]
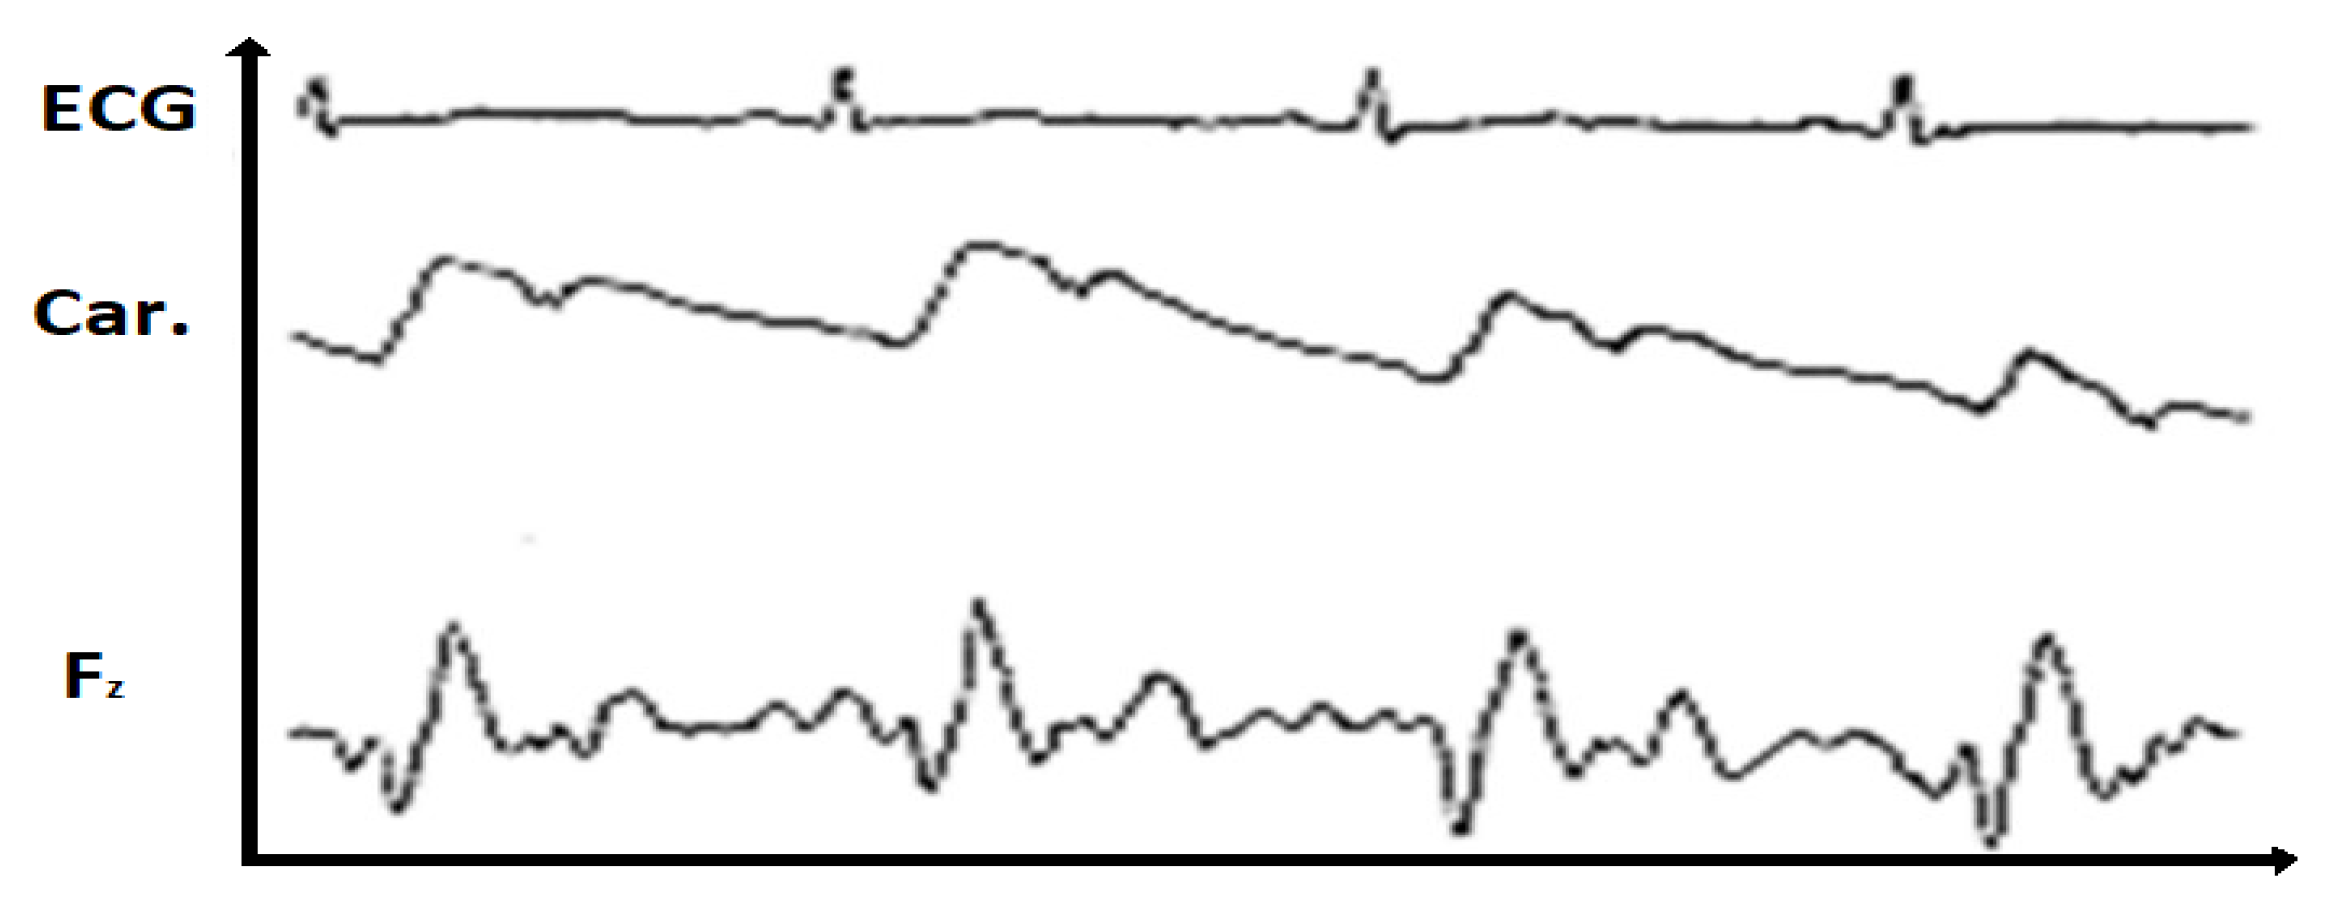
  46. Stürm, R.; Nigg, B.; Koller, E.A. The impact of cardiac activity on triaxially recorded endogenous microvibrations of the body. Eur. J. Appl. Physiol. Occup. Physiol. 1980, 44, 83–96. [Google Scholar] [CrossRef] [PubMed]
  47. Keppel, G. Design and Analysis: A Researcher’s Handbook, 3rd ed.; Prentice-Hall, Inc.: New York City, NY, USA, 1991. [Google Scholar]
  48. Ellis, P.D. The Essential Guide to Effect Sizes: Statistical Power, Meta-Analysis, and the Interpretation of Research Results; Cambridge University Press: Cambridge, NY, USA, 2010. [Google Scholar]
  49. Baker, R.J.; Patel, D. Lower back pain in the athlete: Common conditions and treatment. Prim. Care 2005, 32, 201–229. [Google Scholar] [CrossRef] [PubMed]
  50. Fries, E.; Hesse, J.; Hellhammer, J.; Hellhammer, D.H. A new view on hypocortisolism. Psychoneuroendocrinology 2005, 30, 1010–1016. [Google Scholar] [CrossRef]
  51. Bono, C.M. Low-back pain in athletes. Bone Jt. Surg. Am. 2004, 86, 382–396. [Google Scholar] [CrossRef] [PubMed]
  52. Barr, K.P.; Griggs, M.; Cadby, T. Lumbar stabilization: Core concepts and current literature, Part 1. Am. J. Phys. Med. Rehabil. 2005, 84, 473–480. [Google Scholar] [CrossRef]
  53. George, S.Z.; Childs, J.D.; Teyhen, D.S.; Wu, S.S.; Wright, A.C.; Dugan, J.L.; Robinson, M.E. Rationale, design, and protocol for the prevention of low back pain in the military. BMC Musculoskelet Disord 2007, 14, 92. [Google Scholar]
  54. Atkinson, G.; Nevill, A.M. Statistical methods for assessing measurement error (reliability) in variables relevant to sports medicine. Sports Med. 1998, 26, 217–238. [Google Scholar] [CrossRef]
Figure 1. Representation of different models for approximating the upright position based on the inverted pendulum with mechanically inert joints to represent the physiological properties of the muscles. Left: Inverted Pendulum with one free joint; center: double inverted pendulum (DIP) with two free joints (ankle and hip); right: triple inverted pendulum (TIP) with three free joints (ankle, knee and hip) [15,28].
Applsci 10 03741 g001
Figure 2. Left: Structure of the TIP model with Modelica; right: animation of the model (green: force vector gravitational acceleration 9.81 m/s; yellow: direction of action of the disturbances.
Applsci 10 03741 g002
Figure 3. Comparison of the spectrum of a controlled TIP- (red) and DIP-model (blue).
Applsci 10 03741 g003
Figure 4. Comparison of center of pressure (CoP) measurements with and without knee flexion. Blue: power spectral density (PSD) spectrum of the test persons with knee flexion; red: PSD spectrum of the test persons without knee flexion.
Applsci 10 03741 g004
Figure 5. Display of the spectra of the reference group (black) and the pain group.
Applsci 10 03741 g005
Figure 6. Investigation of the influence of respiration on the activity of the neck, hip, knee and ankle and the resulting effect on the CoP (adapted by Hodges et al., 2002).
Applsci 10 03741 g006
Figure 7. Effect of the positive wave (Car.) on the results of Electrocardiography and force plate measurements (adapted by Stürm et al., 1980).
Applsci 10 03741 g007
Figure 8. CoP spectrum with assignment of different functional sections. Red: respiration; yellow: pendulum movement around the hip; blue: cardioactivity; green: activities of the lower extremities.
Applsci 10 03741 g008
Figure 9. Logarithmic representation of the power density spectrum of the back pain group (Korff > 4) and a double inverted pendulum (DIP model shown in the range of 0–1.7 Hz) adapted from Günther et al. 2011 page 296 and 297 [15].
Applsci 10 03741 g009
Table 1. Anthropometric data of the volunteers, broken down by gender.
Total GroupMale (52%)Female (48%)
Age (J.)39.9 ± 17.540.4 ± 16.640.54 ± 17.66
Weight (kg)75.8 ± 15.683.9 ± 13.766.13 ± 11.93
Size (cm)171.5 ± 25.8180.9 ± 7.7160.30 ± 34.21
Shoe size (EU)42.8 ± 2.742.5 ± 5.538.9 ± 1.5
Table 2. Overview of the results of the assessment for knee flexion and without.
ConditionArea MeanArea sdArea var
Knee.flexion0.670.240.06
Knee.without.flexion0.160.130.01
Table 3. Result of the ANOVA of the observation groups one Leg stand with knee flexion and one leg stand without knee flexion.
Test Quantity (F)p ValueEtasqPower
condition34.82500.6351
Table 4. Overview of the results of the PSD analysis separated by gender and degree of pain.
GenderDegree of PainArea.Mean (Nm2)Area.sdArea.var
MaleKorff 13.981.923.69
MaleKorff > 43.481.662.78
FemaleKorff 14.082.124.51
FemaleKorff > 43.411.622.63
Table 5. Result of the ANOVA of the two observation groups Men/women with and without pain.
Test Quantity (F)p ValueEtasqPartial.EtasqPartial.OmegasqPower
Gender0.6640.4160.0010.001−0.0010.129
Degre of Pain9.7330.0020.0180.0180.0160.877
Gender: Degree of Pain0.1930.6600.0000.000−0.0010.072

