Article

THz-TDS for Detecting Glycol Contamination in Engine Oil

by
Oday M. Abdulmunem
1,†,
Ali Mazin Abdul-Munaim
2,*,†,
Mario Mendez Aller
3,
Sascha Preu
3,* and
Dennis G. Watson
4
1
Department of Physics, College of Science, Mustansiriyah University, Baghdad 10071, Iraq
2
Department of Agricultural Machines and Equipment, College of Agricultural Engineering Sciences, University of Baghdad, Baghdad 10071, Iraq
3
Terahertz Devices and Systems, Technical University of Darmstadt, 64283 Darmstadt, Germany
4
Agricultural Systems, College of Agricultural Sciences, Southern Illinois University, Carbondale, IL 62901, USA
*
Authors to whom correspondence should be addressed.
These authors have contributed equally.
Appl. Sci. 2020, 10(11), 3738; https://doi.org/10.3390/app10113738
Submission received: 26 April 2020 / Revised: 15 May 2020 / Accepted: 20 May 2020 / Published: 28 May 2020
(This article belongs to the Special Issue THz Spectroscopy: Basic Science and Application)

Abstract

:

Featured Application

The ability of the THz-TDS to detect engine oil contamination with glycol at low concentrations.

Abstract

There continues to be a need for an in-situ sensor system to monitor the engine oil of internal combustion engines. Engine oil needs to be monitored for contaminants and depletion of additives. While various sensor systems have been designed and evaluated, there is still a need to develop and evaluate new sensing technologies. This study evaluated Terahertz time-domain spectroscopy (THz-TDS) for the identification and estimation of the glycol contamination of automotive engine oil. Glycol contamination is a result of a gasket or seal leak allowing coolant to enter an engine and mix with the engine oil. An engine oil intended for use in both diesel and gasoline engines was obtained. Fresh engine oil samples were contaminated with four levels of glycol (0 ppm, 150 ppm, 300 ppm, and 500 ppm). The samples were analyzed with THz-TDS and converted to frequency domain parameters of refractive index and absorption coefficient. While both parameters showed potential, the absorption coefficient had the best potential and was able to statistically discriminate among the four contamination levels.

1. Introduction

Combustion engine users frequently replace engine oil that is still usable or keep using engine oil that is contaminated and no longer suitable for use. Engine oil is exposed to various contaminants and oxidation that affect lubricant efficiency, and thus the oil has a limited life. Additives for engine oils reduce the effect of contaminants, oxidation, and prevent corrosion [1]. For practical reasons, designers of internal combustion engines recommend changing engine oils after a specified period of operation, even though they know working conditions and failures of identical engines systems are not the same. For instance, two identical engines may even be operating under the same load and external conditions, but the second engine has a gasket failure allowing coolant (containing glycol) to leak into the engine and mix with the engine oil. While the life of the first engine will probably not be reduced by waiting for the designer-specified oil change, the second engine may require a very expensive complete renewing process due to poor lubrication and bearing failure prior to the specified schedule of oil exchange. Engine oil is contaminated by glycol due to leakage from an engine’s cooling system into the lubricating system, typically caused by a damaged gasket or seal [2]. Glycol mixes with engine oil and reduces lubricity [3] due to glycol oxidation [4] causing sludge in the engine oil and varnish deposits on piston rings and valves [5], plugged lubricant screens [4], and possible engine seizure [6]. A general, acceptable limit of glycol in engine oil has not been determined so far. Booser [7] reported that 150 ppm of glycol did not damage engine oil. Wang [8] found that 500 ppm of glycol was not detrimental to engine oil. However, any glycol contamination of engine oil is a concern since it generally originates from a leak and contamination generally increases.
Contamination and aging of engine oil can be determined by using established methods, such as ASTM International (ASTM) standards and methods. Used engine oil samples may be collected and sent to one of several labs that will analyze the oil using ASTM or modified-ASTM procedures and provide a report summarizing the contaminants. While some industrial users make regular use of such services, most vehicle owners do not, as it would be too cumbersome and time-consuming. Engine users worldwide would benefit from in-situ technology for real-time engine oil analysis to alert users of contaminants or aged engine oil. Since glycol has low molecular weight and volatility but a high polarity, it is difficult to detect and quantify in engine oil. Hyperspectral [9], electromechanical [10], infrared spectroscopy [11], and resonating sensors [12] were assessed for potential in in-situ sensor systems. These sensors are designed to monitor oil conditions in terms of viscosity [13], acidity [14], antioxidants [15], and water or freezing contaminants [16]. However, none of these sensors could identify all the contaminants, and multiple sensors were recommended to monitor oil conditions [17]. While many recent automobiles have some indicator of when to change engine oil, the sensor systems are primarily based on mileage rather than the direct sensing of oil contaminants. New technologies should continue to be designed and evaluated for potential future in-situ engine oil monitoring. Scientists continue to develop sensors, including spectral analysis and, most notably, terahertz spectroscopy, which has been applied to many applications [18,19].
THz-time-domain spectroscopy (THz-TDS) has been used for characterizing or analyzing petroleum products and contaminants, including: several grades of lubricating oils [20,21], several lubricating grease types [22], solidifying point for diesel fuel [23], diesel and gasoline fuel [24], different grades of gasoline engine oil [25], three different levels of water contaminations in diesel engine oil [26], four different levels of fuel contaminations in gasoline engine oil [27], four different periods of oxidation for gasoline engine oil [28], six different periods of oxidation for diesel engine oil [29]. Previous studies have not assessed the ability of the THz-TDS to detect engine oil contamination with glycol.
This research aimed to determine the ability of THz-TDS to identify four different levels of glycol contamination in parts per million (ppm) units with (0 ppm, 150 ppm, 300 ppm and 500 ppm) in engine oil (5W-30) intended for diesel and gasoline engines. While THz-TDS is not envisioned as an in-situ system, it was used to evaluate the appropriate/optimum frequency ranges for glycol concentration determination. A final in-situ system could be a miniaturized, cost-effective electronic system, operating in a narrow frequency range.

2. Materials and Methods

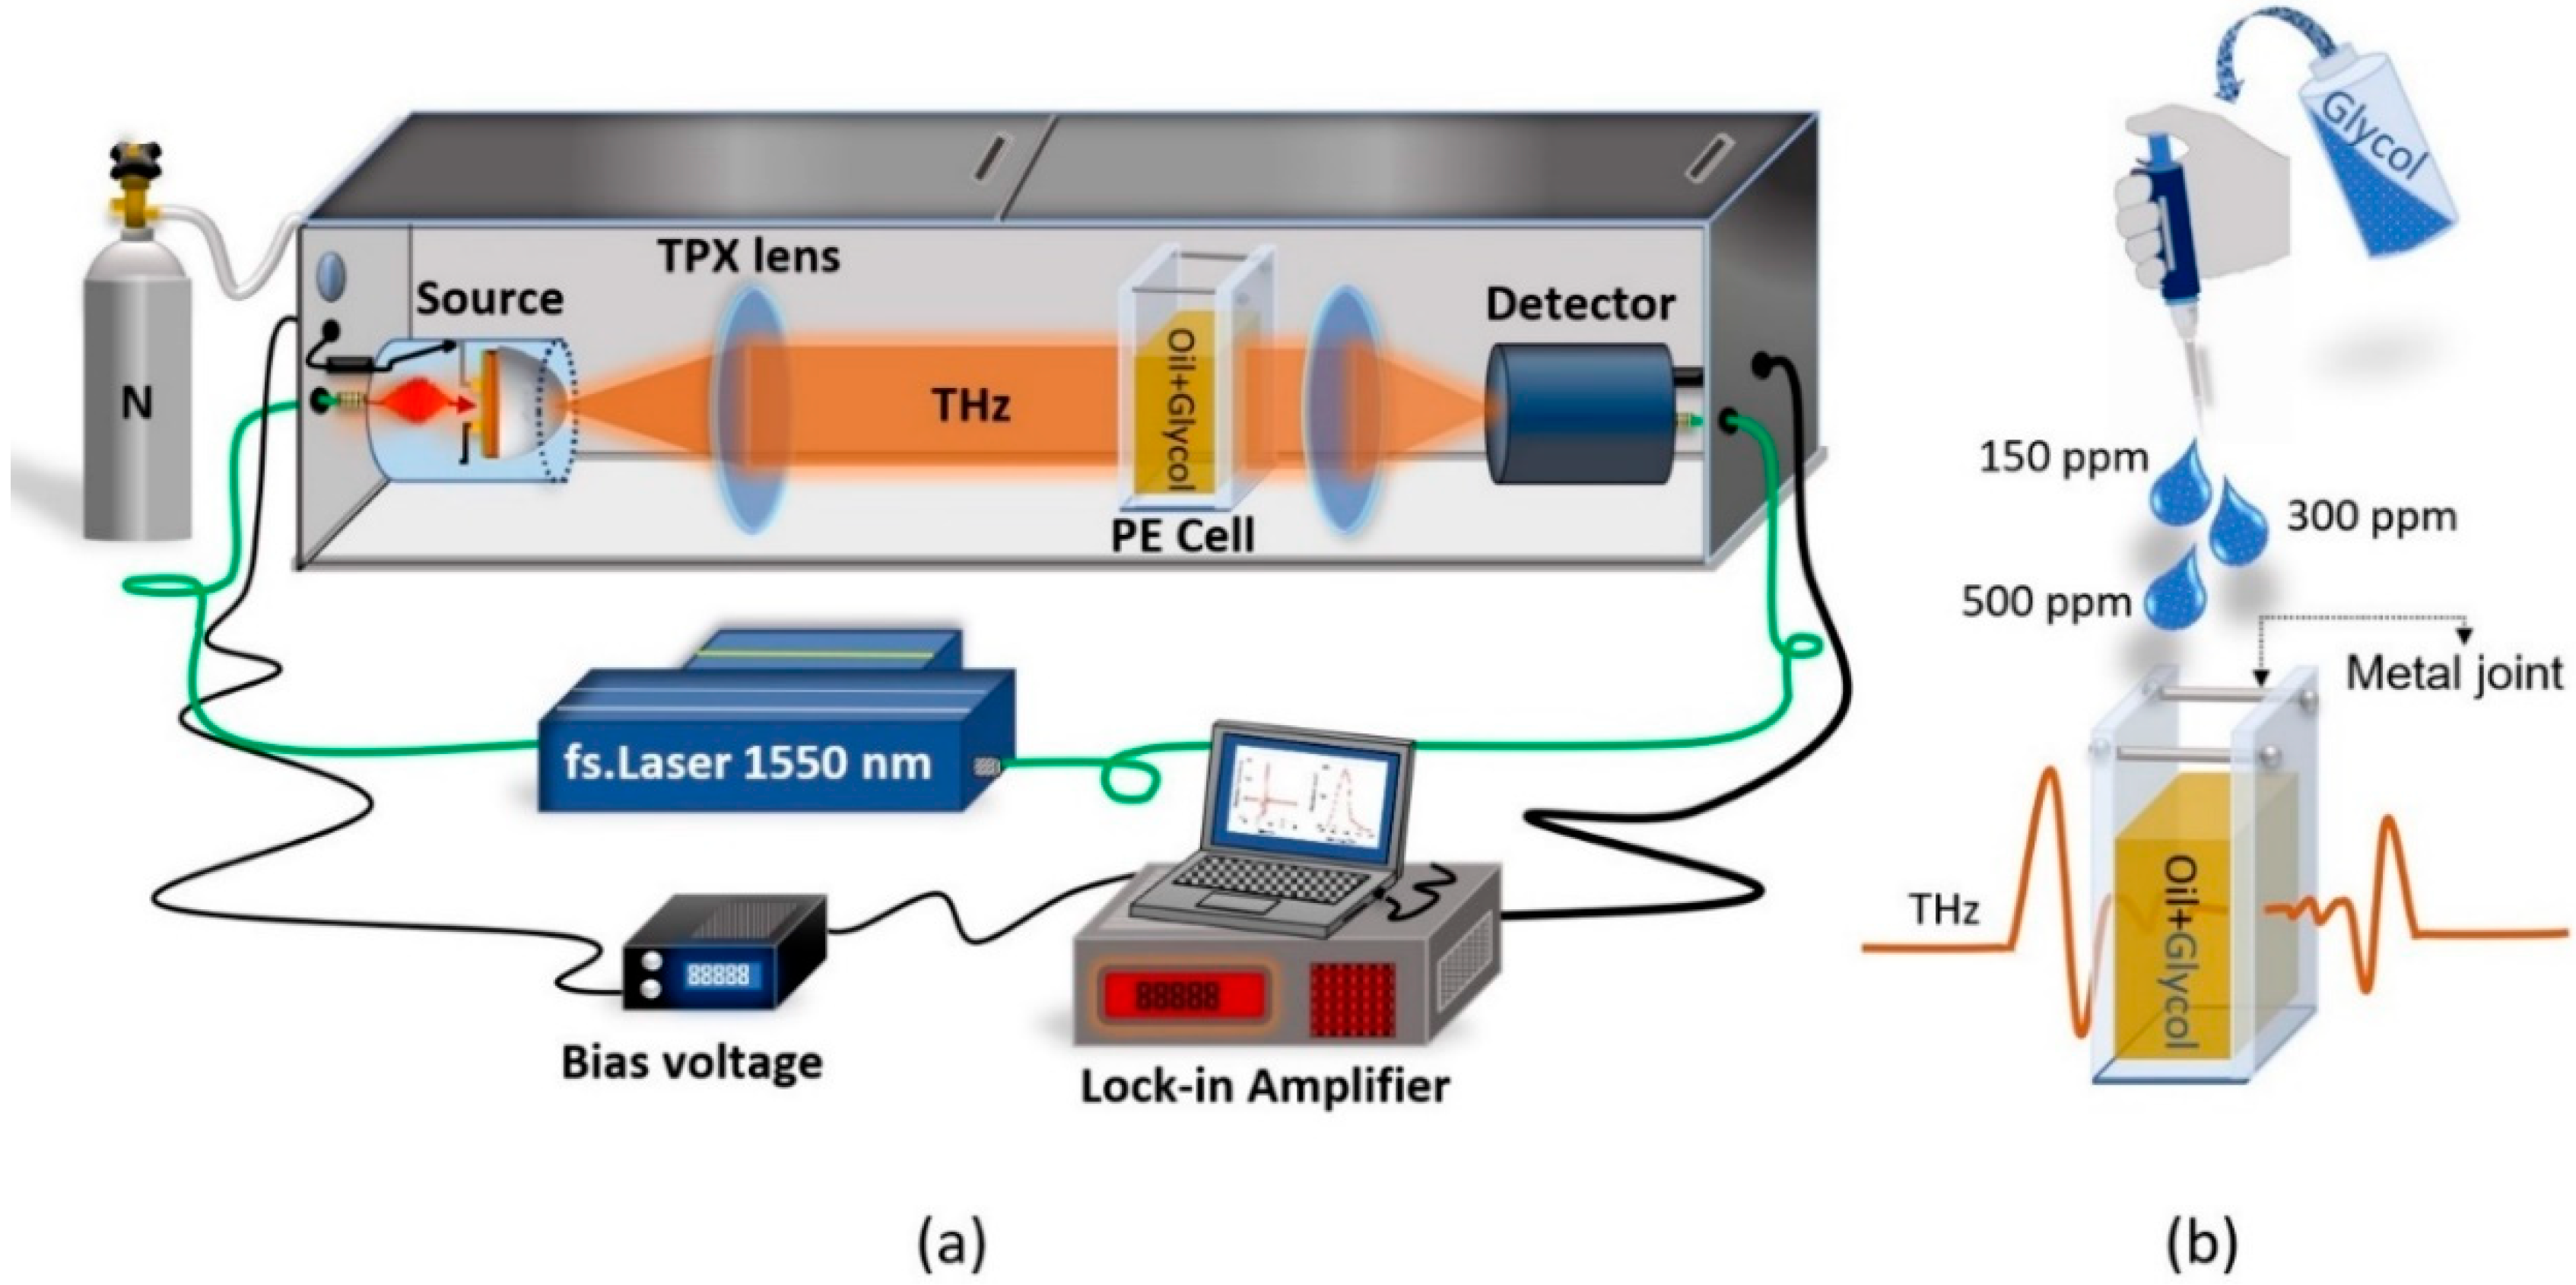
2.1. THz-TDS Spectrometer

The THz time domain spectrometer (Menlo Systems GmbH, Martinsried, Germany) (Figure 1) consisted of an ultrafast fiber laser system at 1550 nm with ~90 femtosecond pulse duration and 100 MHz repetition rate. The laser signal was split in two. A delay stage caused a temporal delay between the laser signal driving the THz detector photoconductor and that driving the THz source photoconductor. Both photoconductors were from the Fraunhofer Heinrich Hertz Institute, Berlin, Germany. The peak dynamic range was 78 dB at 0.34 THz and decreased to 37 dB at 2.5 THz. An encapsulated chamber holds the sample being submitted to THz-TDS. After each sample cell was fitted in the chamber, it was filled with dry nitrogen to minimize humidity, removing water vapor features from the Terahertz signal. The temperature in the lab was controlled to be 22 °C. Due to the pulsed nature of THz-TDS, the temperature change in the sample was considered to be negligible.

2.2. Sample Preparation

A 1 L bottle of full synthetic SAE 5W-30 grade engine oil (Top Tec 4600, LiquiMoly GmbH, Ulm, Germany; API SN/CF service category) marketed for both gasoline and diesel engines was purchased from a local market in Mannheim, Germany. Four samples of engine oil were prepared by pouring 50 mL of the fresh oil into separate 60 mL amber Boston round glass bottles (Qorpak GLC-01909, Fisher Scientific, Waltham, MA, USA). A 1.5 L container of antifreeze (Kühler Frostschutz Konzentrat, Gut & Günstig, Germany) containing ethandiol (glycol) was also purchased from a local retailer in Mannheim, Germany. For each oil sample, an appropriate oil volume was removed by pipette and replaced with the same volume of glycol via pipette to create contaminated samples with 0 ppm, 150 ppm, 300 ppm, and 500 ppm of glycol. The removed/replaced volumes were 7.5 µL, 15 µL, and 25 µL for 150 ppm, 300 ppm, and 500 ppm, respectively. The sample bottles were shipped to Technische Universität Darmstadt (TUD), Germany for THz-TDS analysis. Prior to THz-TDS analysis, all samples were shaken by hand for 60 s and let stand for 24 h to allow air bubbles to dissipate, after which all the samples appeared homogeneous to the human eye.

2.3. THz Time-Domain Spectroscopy

All measurements were made using a cell with two 3-mm-thick polyethylene (PE) windows separated by metal joints, resulting in a permissible THz path length through the oil sample of 15.25 mm of the probe volume, based on prior research [27]. The open aperture of the probe volume was 35 × 35 mm, large enough to accommodate the THz beam without any noticeable truncation. A tightly enclosed external metal frame surrounded the windows to ensure the integrity of the windows and maintain a fixed cell size. Before measuring any sample, a reference spectrum of the empty cell was recorded. Each glycol concentration was measured five times, and both the refractive index and the absorption were recorded. Between each measurement, the PE cell was cleaned and dried to remove all traces of the prior oil sample in the cell. This procedure was adopted for all treatments and replications in this experiment. Division of the spectra obtained from the oil measurement by the reference spectrum largely removes any contribution of the plastic windows and spectral shape and responsivity of source and receiver, respectively, resulting in a strong reduction in the measurement error. An error analysis of such a measurement system has been performed in [28].

2.4. Data Analysis of THz-TDS

The study was carried out using a completely randomized design, with four treatments of glycol contamination (0 ppm, 150 ppm, 300 ppm, 500 ppm) into 5W-30 engine oil, with five replications for each treatment (20 experimental units). Descriptive statistics of mean, variance, standard deviation, and 95% confidence interval were calculated for refractive index and absorption coefficient for each THz frequency. The THz frequencies reported were derived from Fourier transform calculations. One-way analysis of variance (ANOVA) was used to determine if there were significant differences among the four treatments for refractive index and absorption coefficient at each frequency. A probability (p) of ≤ 0.05 was used to indicate significant differences. Fisher’s least significant difference (LSD) was used to determine significant differences between means at each frequency. Linear regression analysis was conducted to predict the best model, based on the coefficient of determination (R2), for the glycol contamination level in engine oil for multiple THz frequencies.

3. Results and Discussion

Refractive index, as well as absorption coefficient, were obtained using the THz time domain spectrometer. The range of the spectral characteristics—refractive index and absorption coefficient—was 0.25 to 2.5 THz, with a resolution of approximately 7 GHz or 615 frequencies.

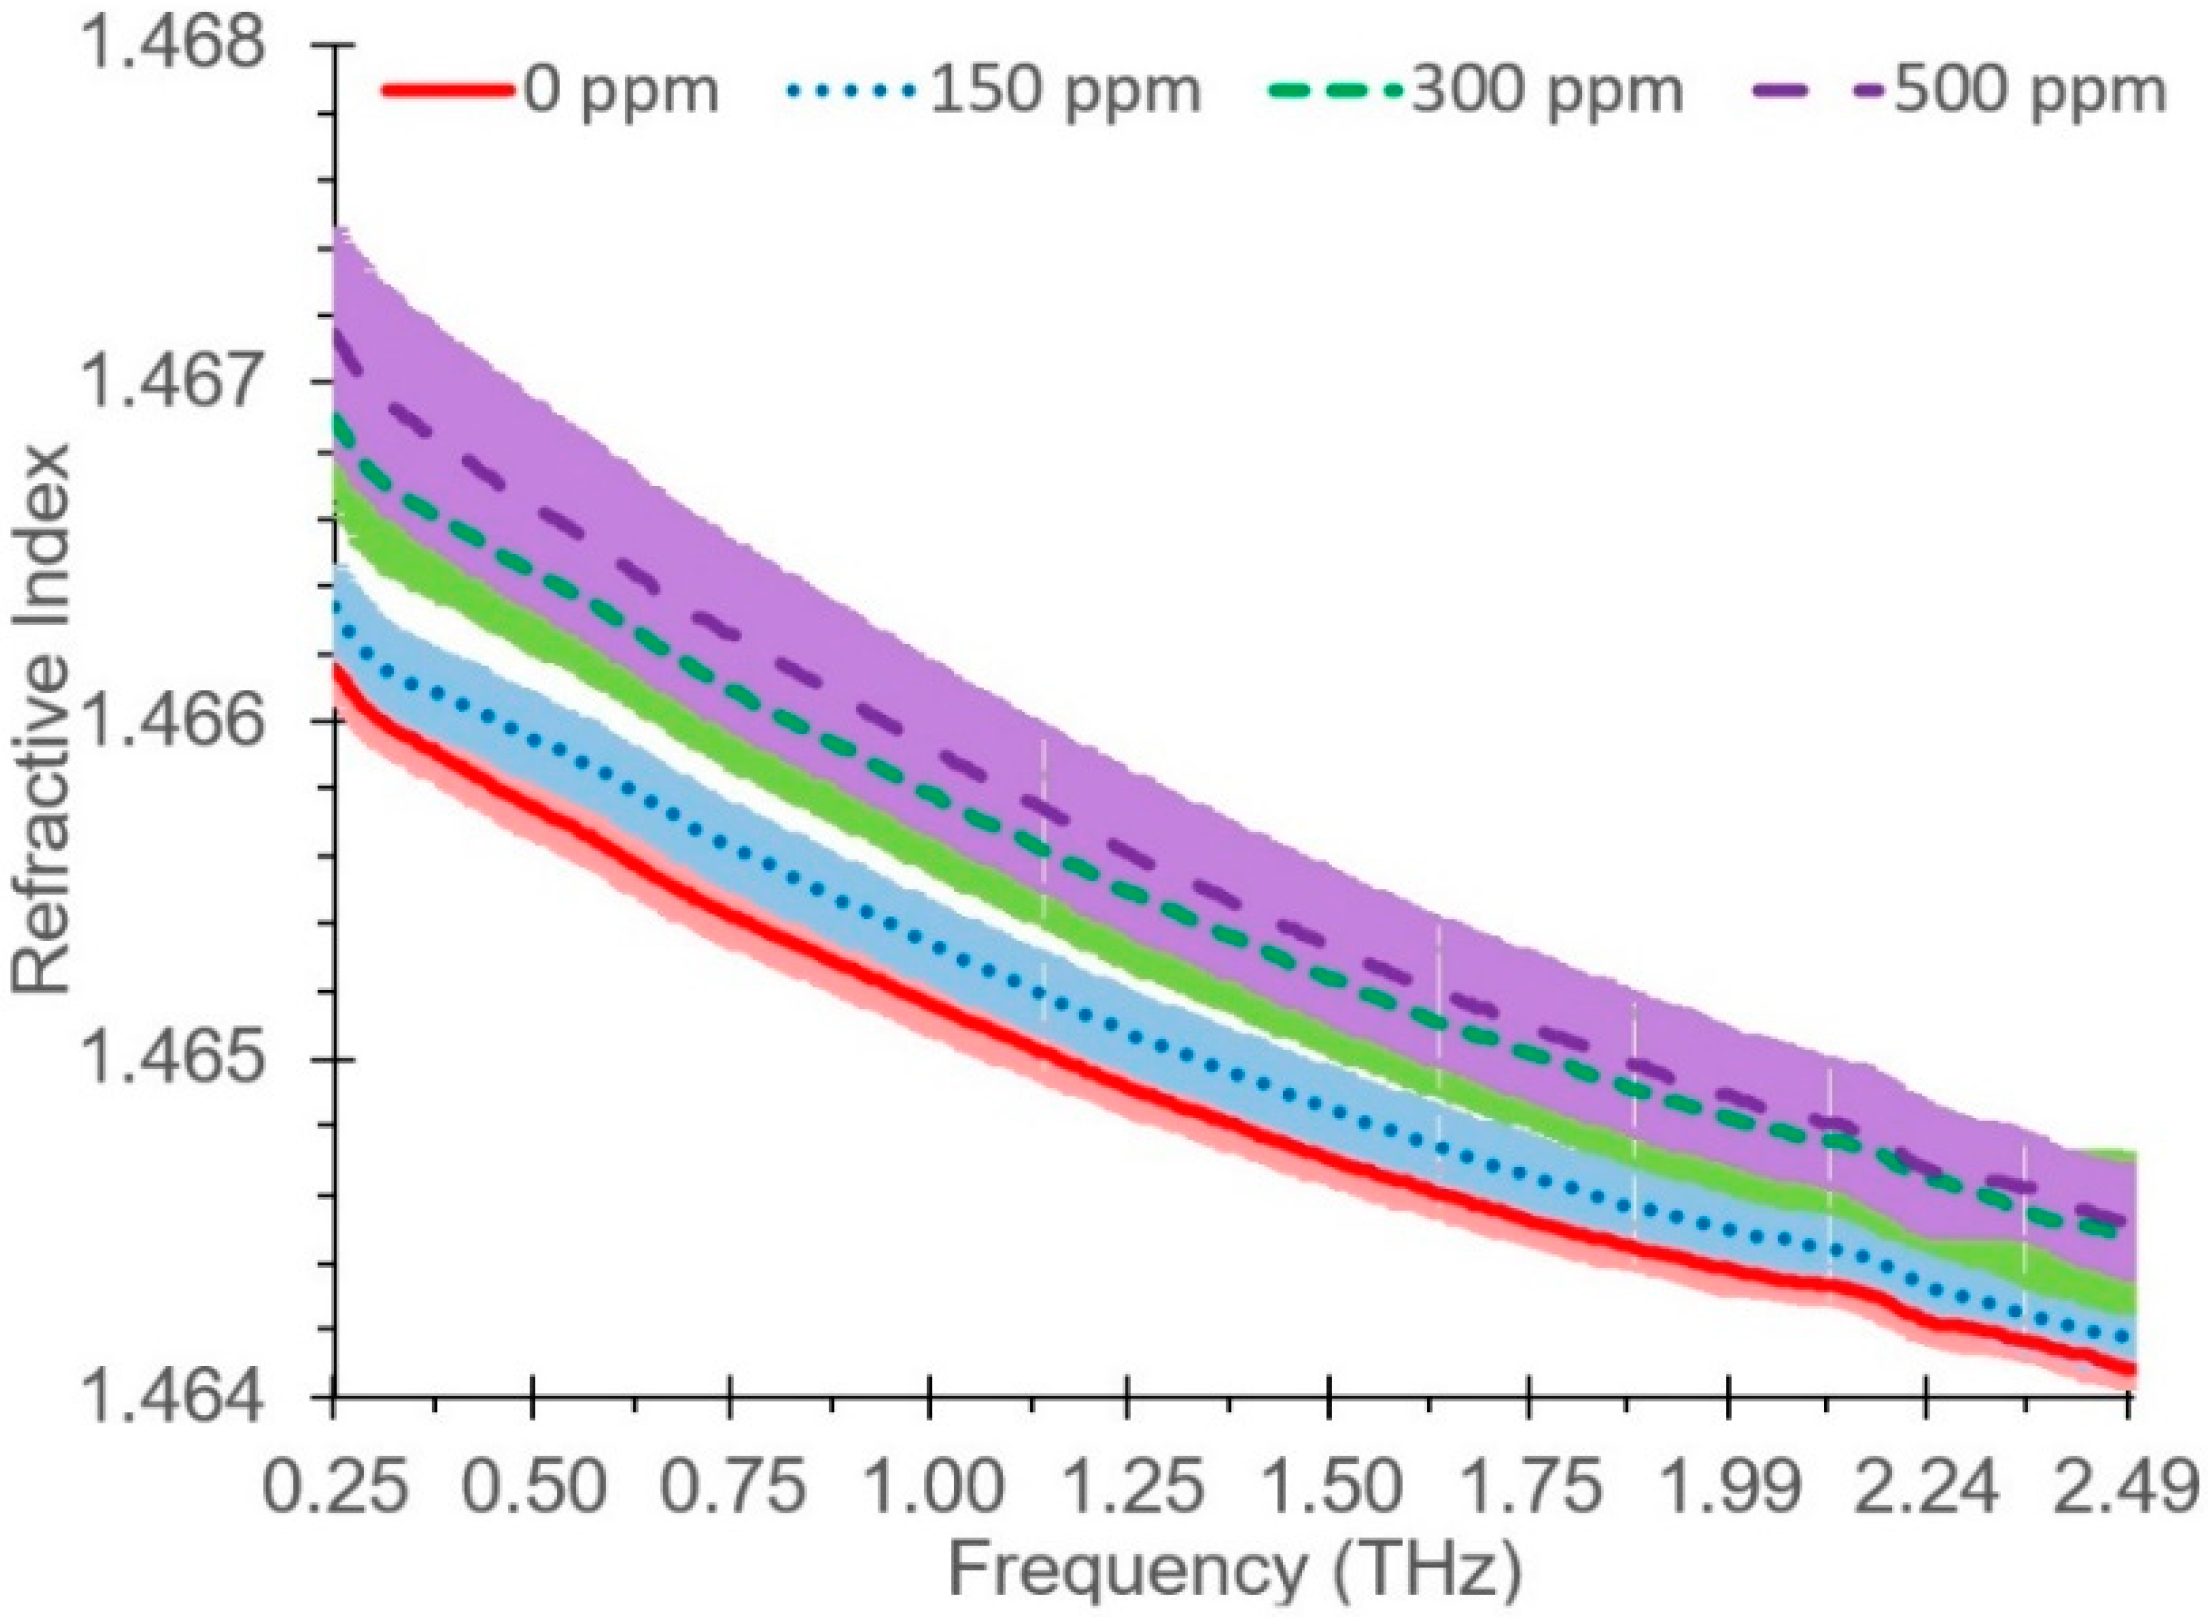
3.1. Refractive Index

Figure 2 illustrates the refractive indices of the glycol contamination—four levels—in the glycol engine oil. From 0.25 to 2.5 THz, the mean refractive index range started at 1.467 (1) (0.25 THz for 500 ppm) and ended at 1.464 (1) (2.5 THz for 0 ppm). The refractive index decreased with an increase in terahertz frequency, which was similar to previous research with other oils [20,22,25]. While refractive index was measured at all 615 frequencies, Table 1 detailed data for refractive indices at 0.25 THz intervals. We note that these errors (standard deviations) do not include any systematic errors caused by the THz system, but represent relative errors between successive measurements. The direction of change (increase in refractive index with increase in glycol contamination in the engine oil) was similar to the effect of increased oxidation [28,29] or water contamination [26], but the opposite of increased gasoline fuel contamination [27]. There was a relatively consistent spacing among the four curves of the refractive index along the 0.25 to 2.5 THz range.
The highest refractive index was obtained at the level of 500 ppm glycol contamination; the lowest refractive index was obtained at the level of 0 ppm glycol contamination. Figure 2 demonstrated the overlap in 95% confidence intervals between two pairs of glycol contamination levels, creating one grouping of 0 ppm and 150 ppm and a second grouping of 300 ppm and 500 ppm. In general, this confidence interval was consistent across the frequency range. The curve shapes showed a difference among the four levels of glycol contamination. From the frequency 0.25–2.5 THz, the one-way ANOVA presented highly significant differences (p < 0.01) in the refractive index among the levels of glycol contamination. Based on LSD, the glycol contamination concentrations of 300 ppm and 500 ppm were significantly different from the concentrations of 0 ppm and 150 ppm glycol contamination for frequencies from 0.25 to 2.5 THz. The uncontaminated sample (0 ppm) and the 500 ppm contamination were clearly discernible. Although Wang [8] found that 500 ppm was not detrimental, this finding clearly shows that THz-TDS is capable of determining significant contamination of 300 ppm and beyond, at least under laboratory conditions.

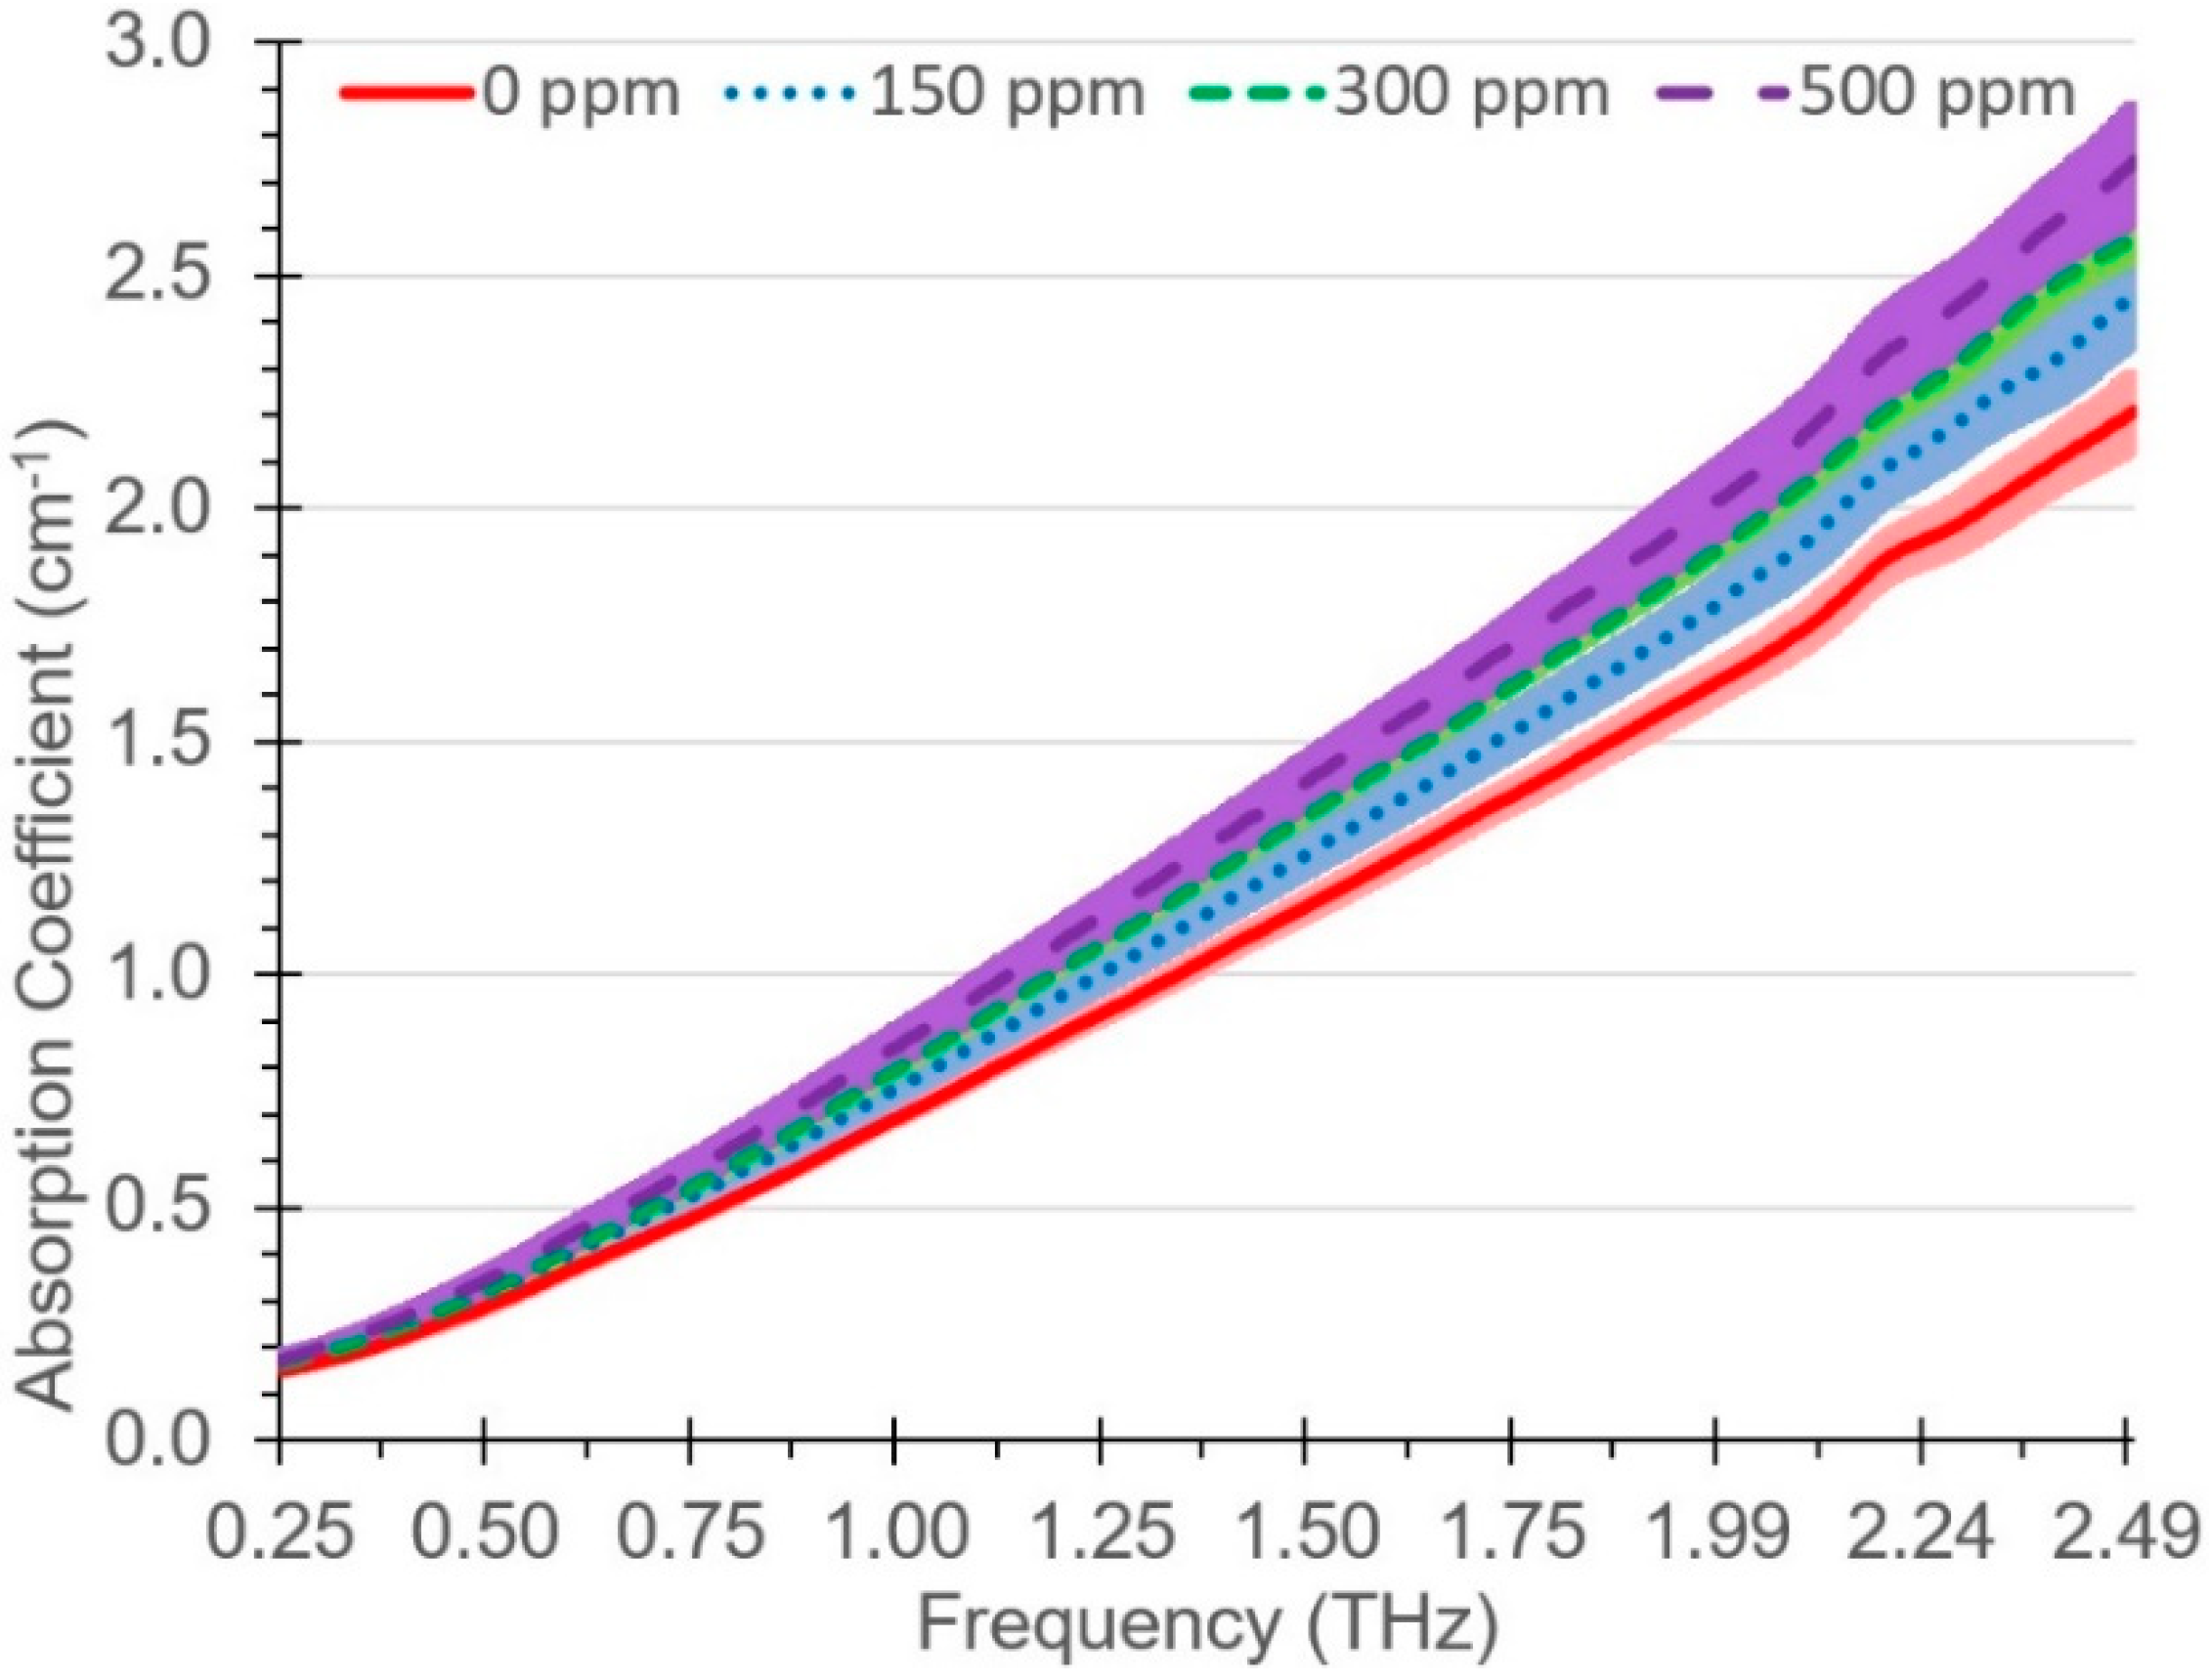
3.2. Absorption Coefficient

Figure 3 shows the absorption coefficients of the four levels of glycol contamination in the SAE 5W-30 engine oil. The mean absorption coefficient for all glycol levels increased with frequency, starting at a low of 0.148 cm−1 for 0 ppm at 0.25 THz and reaching a high of 2.743 cm−1 for 500 ppm at 2.5 THz. At each frequency, the absorption coefficient increased with an increase in glycol contamination, with the exception that below 0.35 THz 150 ppm, there was a slightly higher absorption coefficient than 300 ppm. Differences among the curves of the absorption coefficients increased with frequency, with the difference between 0 ppm and 500 ppm increasing from 0.023 cm−1 at 0.25 THz to 0.534 cm−1 at 2.5 THz. While the absorption coefficient was measured at all 615 frequencies, Table 1 detailed data for absorption coefficients at 0.25 THz intervals. The increase in absorption coefficient with an increase in frequency was similar to previous research with other oils [20,22,25]. The increase in absorption coefficient with greater contamination levels was similar to the effect of water contamination [26] and gasoline fuel contamination [27], and was expected, as all these species were or contained polar molecules with strong THz absorption.
The 95% confidence intervals increased gradually with frequency, but the difference among means increased at a greater rate. While there was overlap among the 95% confidence intervals at 0.25 THz, the overlap decreased as frequency increased. Based on ANOVA, there were significant differences (p < 0.05) among contamination levels of glycol across the 0.355–2.5 THz range, with highly significant differences (p < 0.01) across the 0.476–2.5 THz range. Based on LSD results, the only statistically significant difference among means from 0.355–0.428 THz was that 500 ppm had a significantly higher absorption coefficient than 0 ppm. Commencing with 0.432 THz, 300 ppm was also significantly different from 0 ppm. Beginning at 0.458 THz, 150 ppm was also significantly different from 500 ppm. Starting at 0.604 THz, 150 ppm was also significantly different from 0 ppm. Beginning with 0.754 THz, 500 ppm was significantly different from each of the other contamination levels. From 1.01–2.471 THz, each contamination level was significantly different from each other. Thus, the range of 1.01–2.471 THz was found to be able to discriminate all levels of glycol contamination. Although Wang et al. [8] stated 500 ppm was not detrimental in engine oil, this study clearly showed that THz absorption coefficient was a decent discriminator for glycol contamination, by discriminating between each of the contamination levels. The sensitivity of THz at 150 ppm was better than that Borin and Poppi [16] found with a mid-infrared spectroscopy model developed from glycol-contaminated oil samples of 14–9990 ppm and then validated with glycol contamination differences as low as 800 ppm. ASTM standard practice specifies 1000 ppm as the sensitivity of Fourier-transform infrared spectroscopy (FTIR) [6].

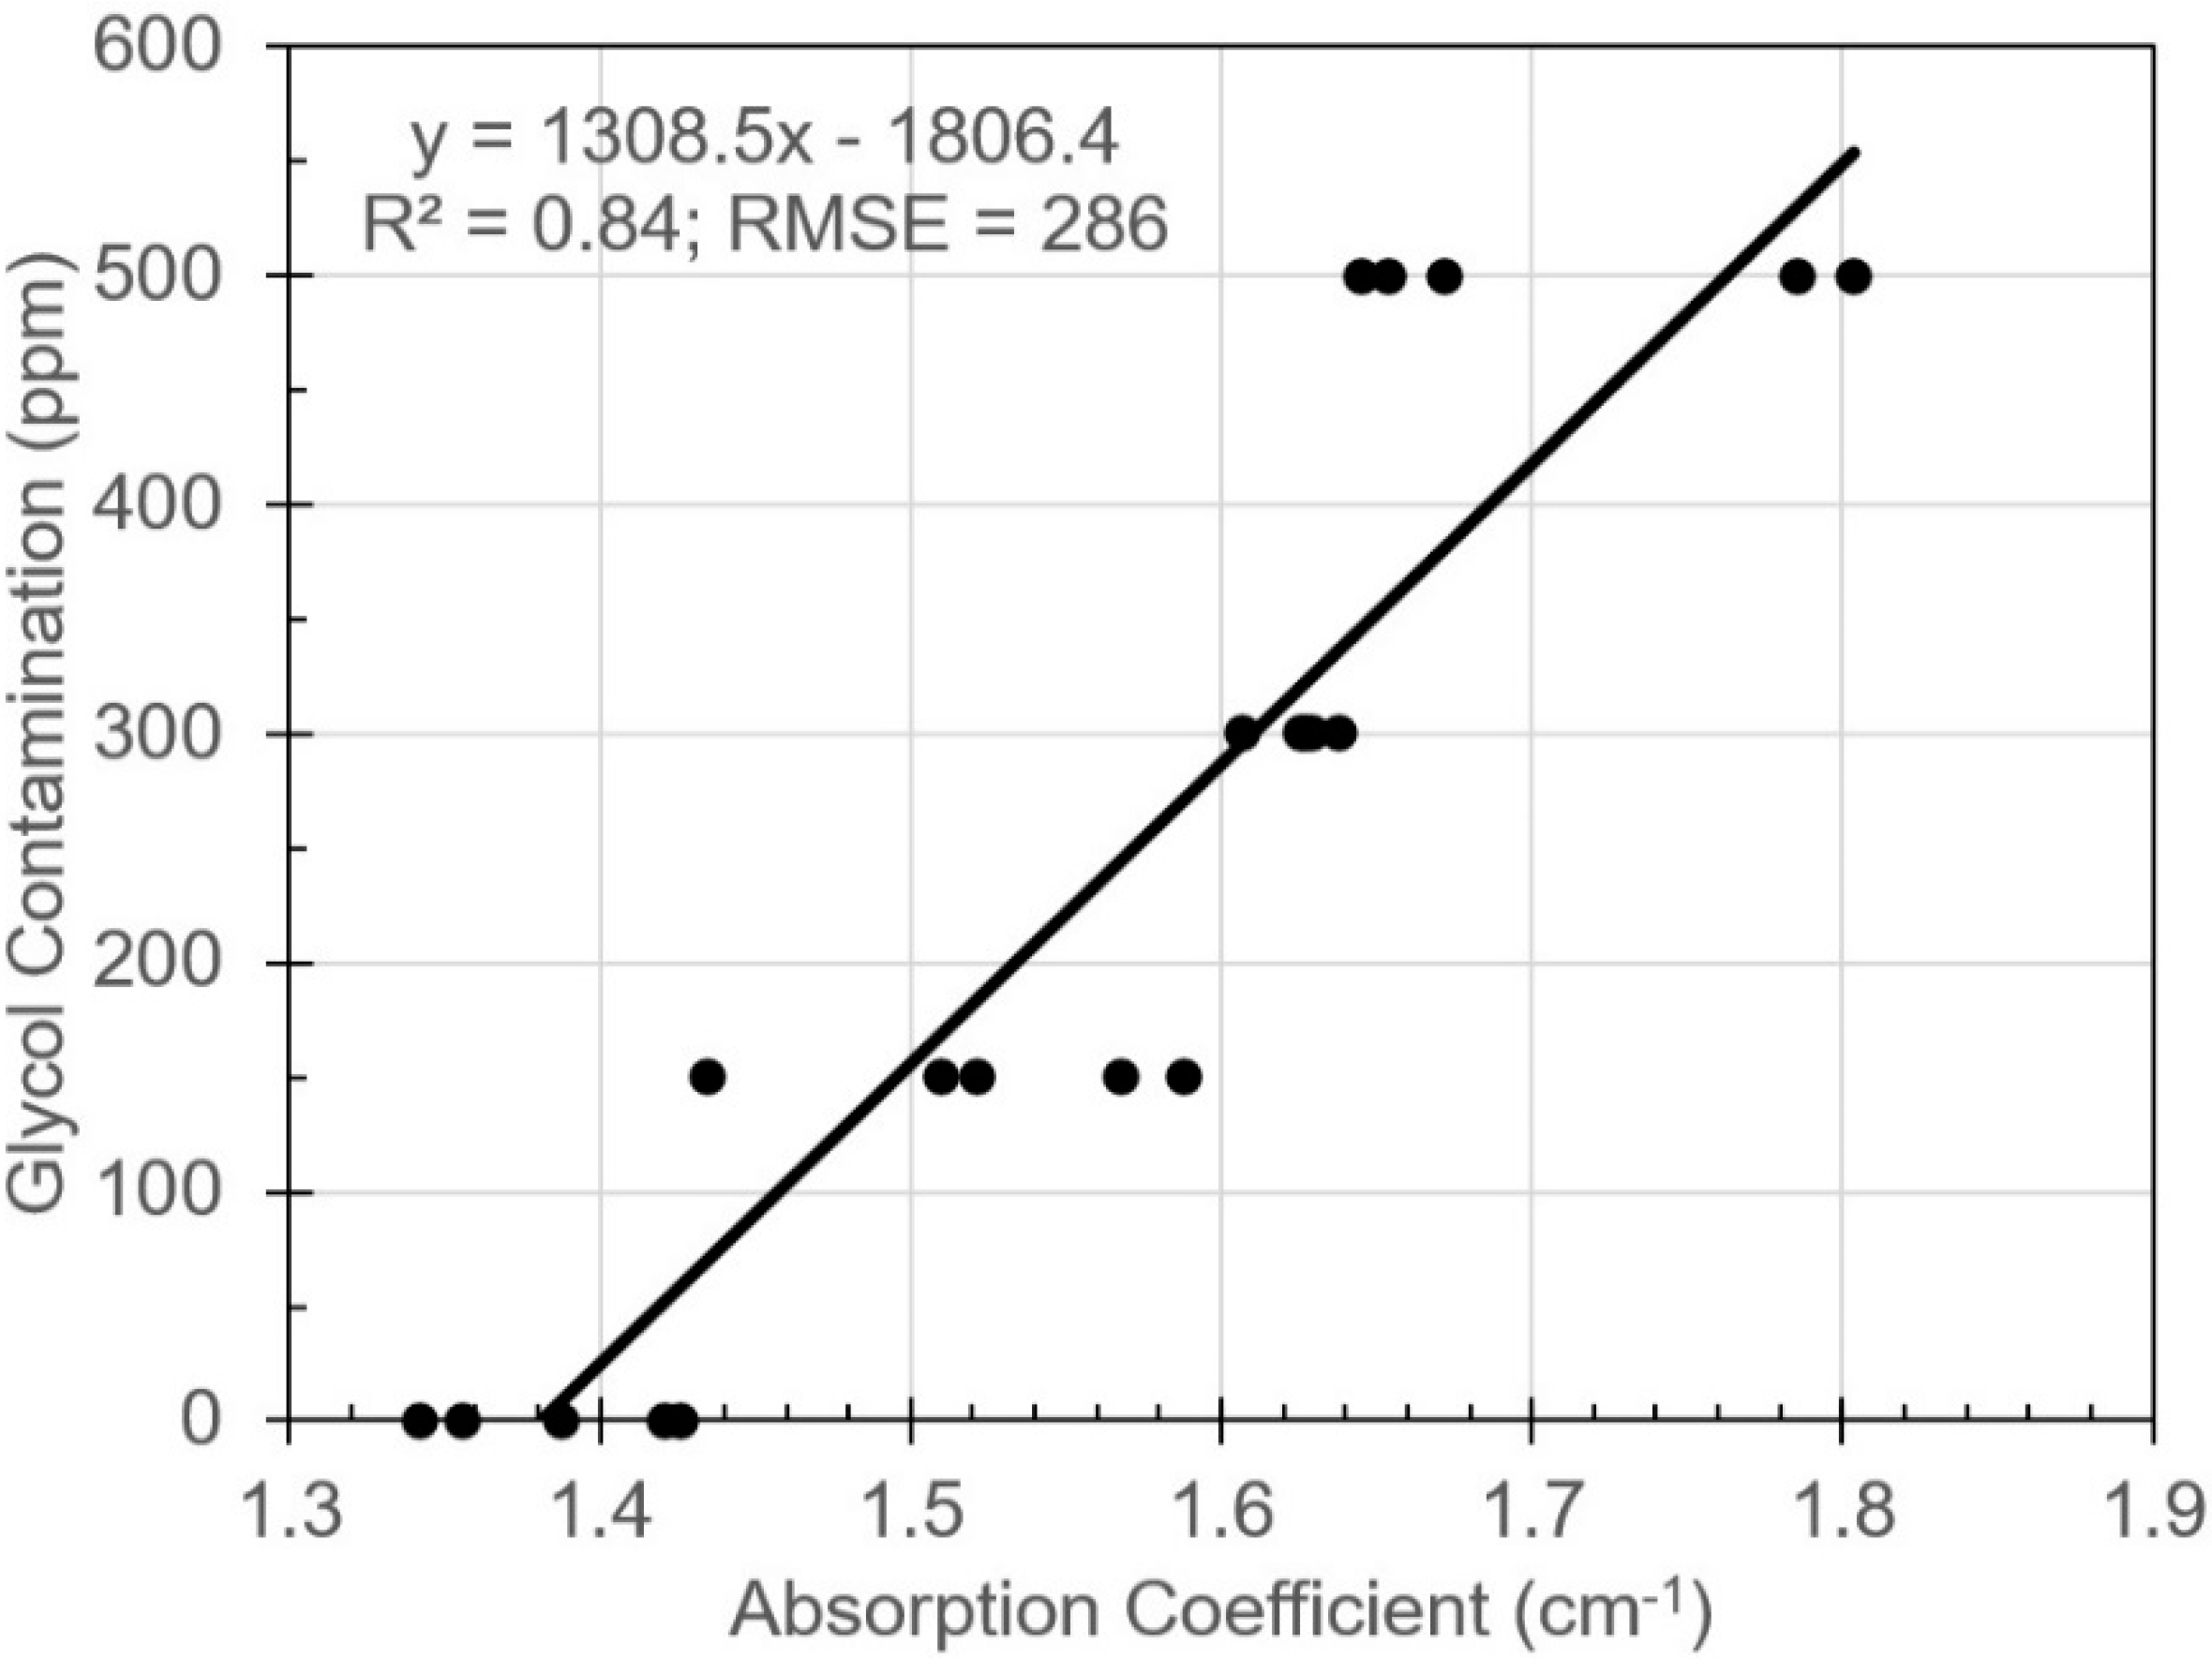
3.3. Regression Models

Absorption coefficient values in the range of 1.0–2.5 THz in 0.25 THz increments were selected for regression analysis to be close to the 1.014–2.471 THz range, for which each glycol contamination level was significantly different from each of the others. The linear regression provided a tentative relationship of absorption coefficient to glycol contamination based on this study. The coefficient of determination (R2) values for the seven models started at 0.79 at 1.0 THz, increased to a peak of 0.84 at 1.75 THz, and dropped to 0.77 at 2.5 THz. Slope values ranged from a high of 2613 ppm × cm at 1.0 THz, and decreased with each frequency increase to a low of 746 ppm × cm at 2.5 THz. X-intercepts increased with frequency from 0.68 cm−1 at 1.0 THz to 1.92 cm−1 at 2.5 THz. The linear model at 1.75 THz was the best model based on R2 (Figure 4). Although the range of absorption coefficient values for some contamination levels was wider than the others, none of the absorption coefficient ranges among the glycol contamination levels overlapped, and the absorption coefficient means of each contamination level were significantly different from all other contamination levels.

4. Conclusions

Based on this experiment, the refractive index from THz-TDS identified glycol contamination levels of 300+ ppm from uncontaminated oil. While no glycol from coolant should be present in engine oil [7], the 300 ppm contamination level was below the 500 level that was not found to cause engine damage [8]. Thus, a critical leak of engine coolant—including glycol into engine oil—could be detected by THz-TDS before engine damage and signal the need to reject the engine oil and perform cooling system repairs. The difference in mean refractive index was greatest at the lowest frequency, but still near the limit of detection for THz-TDS. While a THz-TDS system may reliably detect this difference, each THz-TDS system may result in a slightly different range of refractive index values and may require calibration to determine an engine oil reject level for glycol contamination based on refractive index.
The absorption coefficient results from THz-TDS showed better potential for distinguishing differences in glycol contamination levels (0 ppm, 150 ppm, 300 ppm, and 500 ppm) of 5W-30 gasoline/diesel engine oil. Across the frequency range of 1.01–2.471 THz, each of the four contamination levels was significantly different from the other three levels. The mean differences between contamination levels were all over 0.1 cm−1 and well within the limits of detection for absorption coefficient. Based on the results of this study, THz-TDS demonstrated sensitivity to identify glycol contamination in engine oil. While this indicates potential, a subsequent study would be required to determine the ability of THz-TDS to discriminate levels of coolant (glycol and water mixtures) contamination in engine oil. Further studies will require investigation of the discrimination of different contaminants at the same time. As no resonant glycol-specific features were found, a final sensor system for detecting multiple contaminants at the same time may require different methods—possibly a multi-spectral system. This paper has shown that a compactified THz sensing element could be part of such a sensor concept.

Author Contributions

Conceptualization, O.M.A., A.M.A.-M. and D.G.W.; methodology, O.M.A., A.M.A.-M. and M.M.A.; formal analysis, O.M.A., A.M.A.-M. and D.G.W.; resources, O.M.A. and S.P.; writing—original draft preparation, O.M.A. and A.M.A.-M.; writing—reviewing and editing, S.P. and D.G.W. All authors have read and agreed to the published version of the manuscript.

Funding

This research received no external funding.

Acknowledgments

The authors would like to extend their thanks to the physics faculty at the Technische Universität Darmstadt (TUD), Germany, where the THz-TDS work was performed in the laboratory of Sascha Preu.

Conflicts of Interest

The authors declare no conflict of interest.

References

  1. Mackney, D.; Clague, N.; Brown, G.; Fish, G.; Durham, J. Automotive Lubricants. In Automotive Lubricants and Testing; Tung, S.C., Totten, G.E., Eds.; ASTM: West Conshohocken, PA, USA, 2012; pp. 23–46. [Google Scholar]
  2. Lansdown, A.R. Lubrication and Lubricant Selection A Practical Guide, 3rd ed.; Professional Engineering Publishing: London, UK, 2004. [Google Scholar]
  3. Liddell, G.J.; Marshall, R. A Test for Antifreeze Contamination in Crankcase Oil; SAE Technical Paper, (No. 520054); SAE: Warrendale, PA, USA, 1952; pp. 1–8. [Google Scholar]
  4. Deere & Company. Fuels, Lubricants, Coolants, and Filters; Deere & Company: Moline, IL, USA, 2008. [Google Scholar]
  5. Bonner, D.W. The Problem of Coolant Contamination. Ind. Lubr. Tribol. 1974, 26, 133–135. [Google Scholar] [CrossRef]
  6. ASTM. ASTM D2982-07 Standard Test Methods for Detecting Glycol-Base Antifreeze in Used Lubricating Oils; ASTM: West Conshohocken, PA, USA, 2013. [Google Scholar] [CrossRef]
  7. Booser, E.R. CRC Handbook of Lubrication and Tribology, Volume III: Monitoring, Materials, Synthetic Lubricants, and Applications, Volume III; CRC Press: Boca Raton, FL, USA, 1993. [Google Scholar]
  8. Wang, S.S.; Lee, H.S. The application of ac impedance technique for detecting glycol contamination in engine oil. Sens. Actuators B Chem. 1997, 40, 193–197. [Google Scholar] [CrossRef]
  9. Lulu, J.; Xinjie, Y.; Yong, H. Identification of automobile transmission fluid using hyperspectral imaging technology. Int. J. Agric. Biol. Eng. 2014, 7, 81–85. [Google Scholar] [CrossRef]
  10. Soleimani, M.; Sophocleous, M.; Glanc, M.; Atkinson, J.; Wang, L.; Wood, R.J.K.; Taylor, R.I. Engine oil acidity detection using solid state ion selective electrodes. Tribol. Int. 2013, 65, 48–56. [Google Scholar] [CrossRef] [Green Version]
  11. Kasberger, J.; Fromherz, T.; Saeed, A.; Jakoby, B. Miniaturized integrated evanescent field IR-absorption sensor: Design and experimental verification with deteriorated lubrication oil. Vib. Spectrosc. 2011, 56, 129–135. [Google Scholar] [CrossRef]
  12. Mohammed, A.J.; Hassan, M.A. Piezesensors for monitoring degradation of automotive engine oil. Sci. Tech. 2013, 3, 42–45. [Google Scholar] [CrossRef]
  13. Jakoby, B.; Scherer, M.; Buskies, M.; Eisenschmid, H. An automotive engine oil viscosity sensor. IEEE Sens. J. 2003, 3, 562–568. [Google Scholar] [CrossRef]
  14. Agoston, A.; Ötsch, C.; Jakoby, B. Viscosity sensors for engine oil condition monitoring-Application and interpretation of results. Sens. Actuators A Phys. 2005, 121, 327–332. [Google Scholar] [CrossRef]
  15. Price, R.J.; Clarke, L.J. Chemical sensing of amine antioxidants in turbine lubricants. Analyst 1991, 116, 1121–1123. [Google Scholar] [CrossRef]
  16. Borin, A.; Poppi, R.J. Application of mid infrared spectroscopy and iPLS for the quantification of contaminants in lubricating oil. Vib. Spectrosc. 2005, 37, 27–32. [Google Scholar] [CrossRef]
  17. Schmitigal, J.; Moyer, S. Evaluation of Sensors for On-Board Diesel Oil Condition Monitoring of U.S. Army Ground Equipment; SAE: Warrendale, PA, USA, 2005; SAE Technical Paper 2005-01-1810. [Google Scholar]
  18. Jepsen, P.U.; Cooke, D.G.; Koch, M. Terahertz spectroscopy and imaging–Modern techniques and applications. Laser Photonics Rev. 2011, 5, 124–166. [Google Scholar] [CrossRef]
  19. Mathanker, S.K.; Weckler, P.R.; Wang, N. Terahertz (THz) applications in food and agriculture: A review. Trans. ASABE 2013, 56, 1213–1226. [Google Scholar] [CrossRef]
  20. Naftaly, M.; Foulds, A.P.; Miles, R.E.; Davies, A.G. Terahertz transmission spectroscopy of nonpolar materials and relationship with composition and properties. Int. J. Infrared Millim. Waves 2005, 26, 55–64. [Google Scholar] [CrossRef]
  21. Tian, L.; Zhou, Q.; Jin, B.; Zhao, K.; Zhao, S.; Shi, Y.; Zhang, C. Optical property and spectroscopy studies on the selected lubricating oil in the terahertz range. Sci. China Ser. G Phys. Mech. Astron. 2009, 52, 1938–1943. [Google Scholar] [CrossRef]
  22. Lu, T.; Qing-Li, Z.; Kun, Z.; Yu-Lei, S.; Dong-Mei, Z.; Song-Qing, Z.; Cun-Lin, Z. Consistency-dependent optical properties of lubricating grease studied by terahertz spectroscopy. Chin. Phys. B 2011, 20, 010703. [Google Scholar]
  23. Zhao, H.; Zhao, K.; Bao, R. Predicting cold flow properties of diesel by terahertz time-domain spectroscopy. ISRN Spectrosc. 2012, 1–4. [Google Scholar] [CrossRef] [Green Version]
  24. Arik, E.; Altan, H.; Esenturk, O. Dielectric properties of diesel and gasoline by terahertz spectroscopy. J. Infrared Millim. Terahertz Waves 2014, 35, 759–769. [Google Scholar] [CrossRef]
  25. Adbul-Munaim, A.M.; Reuter, M.; Koch, M.; Watson, D.G. Distinguishing gasoline engine oils of different viscosities using terahertz time-domain spectroscopy. J. Infrared Millim. Terahertz Waves 2015, 36, 687–696. [Google Scholar] [CrossRef] [Green Version]
  26. Abdul-Munaim, A.M.; Reuter, M.; Abdulmunem, O.M.; Balzer, J.C.; Koch, M.; Watson, D.G. Using terahertz time-domain spectroscopy to discriminate among water contamination levels in diesel engine oil. Trans. ASABE 2016, 59, 795–801. [Google Scholar] [CrossRef]
  27. Abdul-Munaim, A.M.; Aller, M.M.; Preu, S.; Watson, D.G. Discriminating gasoline fuel contamination in engine oil by terahertz time-domain spectroscopy. Tribol. Int. 2018, 119, 123–130. [Google Scholar] [CrossRef]
  28. Méndez Aller, M.; Abdul-Munaim, A.M.; Watson, D.G.; Preu, S. Error Sources and Distinctness of Materials Parameters Obtained by THz-Time Domain Spectroscopy Using an Example of Oxidized Engine Oil. Sensors 2018, 18, 2087. [Google Scholar] [CrossRef] [PubMed] [Green Version]
  29. Abdul-Munaim, A.M.; Ornik, J.; Koch, M.; Watson, D.G. Terahertz Time Domain Spectroscopy to Detect Different Oxidation Levels of Diesel Engine Oil. Lubricants 2019, 7, 18. [Google Scholar] [CrossRef] [Green Version]
Figure 1. Illustration of (a) THz time-domain spectrometer and (b) THz path through the contaminated oil samples. The glycol-contaminated samples were shaken prior to THz measurements in order to obtain a homogeneous mixture.
Applsci 10 03738 g001
Figure 2. Mean refractive index of each of four glycol contamination levels of 5W-30 gasoline/diesel engine oil with 95% confidence intervals (for clarity when hidden, 95% confidence intervals are the same above and below the mean).
Applsci 10 03738 g002
Figure 3. Mean absorption coefficient of each of four glycol contamination levels of 5W-30 gasoline/diesel engine oil with 95% confidence intervals (for clarity when hidden, 95% confidence intervals are the same above and below the mean).
Applsci 10 03738 g003
Figure 4. Absorption coefficient at 1.75 THz predicting glycol contamination (ppm) with a linear model.
Applsci 10 03738 g004
Table 1. Partial refractive index and absorption coefficient mean and standard deviation data from glycol contaminated engine oil samples at 0.25 THz intervals across the 0.253–2.5 THz range.
THzRefractive Index *Absorption Coefficient (cm−1) *
0 ppm150 ppm300 ppm500 ppm0 ppm150 ppm300 ppm500 ppm
0.251.4662 b
± 0.0001
1.4663 b
± 0.0001
1.4669 a
± 0.0003
1.4671 a
± 0.0004
0.148 a
± 0.009
0.168 a
± 0.028
0.162 a
± 0.008
0.171 a
± 0.017
0.501.4657 b
± 0.0001
1.4659 b
± 0.0001
1.4664 a
± 0.0003
1.4666 a
± 0.0003
0.286 c
± 0.012
0.310 bc
± 0.026
0.319 ab
± 0.015
0.343 a
± 0.029
0.751.4654 b
± 0.0001
1.4656 b
± 0.0001
1.4661 a
± 0.0003
1.4662 a
± 0.0003
0.477 c
± 0.009
0.521 b
± 0.029
0.544 ab
± 0.014
0.579 a
± 0.040
1.001.4652 b
± 0.0001
1.4653 b
± 0.0001
1.4658 a
± 0.0003
1.4659 a
± 0.0003
0.690 c
± 0.011
0.755 b
± 0.034 b
0.796 b
± 0.010
0.845 a
± 0.049
1.251.4649 b
± 0.0001
1.4651 b
± 0.0001
1.4655 a
± 0.0002
1.4656 a
± 0.0003
0.918 d
± 0.020
1.005 c
± 0.043
1.068 b
± 0.008
1.130 a
± 0.056
1.501.4647 b
± 0.0001
1.4648 b
± 0.0001
1.4652 a
± 0.0002
1.4653 a
± 0.0002
1.149 d
± 0.031
1.261 c
± 0.052
1.345 b
± 0.010
1.418 a
± 0.066
1.751.4645 b
± 0.0001
1.4647 b
± 0.0001
1.4650 a
± 0.0002
1.4651 a
± 0.0002
1.387 d
± 0.038
1.524 c
± 0.060
1.625 b
± 0.011
1.712 a
± 0.075
2.001.4644 b
± 0.0001
1.4645 b
± 0.0001
1.4648 a
± 0.0002
1.4649 a
± 0.0002
1.631 d
± 0.047
1.800 c
± 0.069
1.918 b
± 0.021
2.021 a
± 0.097
2.251.4642 b
± 0.0001
1.4643 b
± 0.0001
1.4646 a
± 0.0002
1.4647 a
± 0.0002
1.936 d
± 0.066
2.142 c
± 0.090
2.266 b
± 0.041
2.392 a
± 0.117
2.501.4641 b
± 0.0001
1.4642 b
± 0.0001
1.4645 a
± 0.0003
1.4645 a
± 0.0002
2.209 c
± 0.098
2.457 b
± 0.117
2.584 b
± 0.058
2.743 a
± 0.143
* Means, for the same parameter at the same frequency, with the same superscript letter are not significantly different.

