1. Introduction
Pedestrian crossing behavior and activities while using the road network have always been identified as causing factors associated with pedestrian accidents in urban and in rural areas. It has been claimed that over 70% of pedestrian fatalities occur while crossing roads away from a pedestrian crossing. Very few (0.5% of all killed or seriously injured) were observed on a refuge, central island or reservation. Pedestrian crossing behavior and critical gap analysis has been a focus of many transportation studies. Critical gap can be defined as the shortest gap that the pedestrian would accept when crossing a road. Many crossing locations in urban areas are not signalized. At these locations, pedestrians need to wait for a safe gap to cross the road. In these cases, each pedestrian has to assess each gap in traffic, reject one or more before accepting a convenient gap according to their physical ability, risk taking attitude, age, gender etc. A refuge island can be installed at some of these non-signalized crossing locations. The goal of these refuge islands is to ease the crossing process and to provide a halfway protection for pedestrians who are about to cross the road. In order to assess the usefulness of these refuge islands it is crucial to study the gap acceptance behavior of pedestrians at such locations. Understanding the gap acceptance behavior is also useful for cost–benefit analysis of road engineering projects. Pedestrian decision-making and risk-taking during road crossing can be studied through monitoring and observation of pedestrians’ behavior and crossing activities [
1,
2,
3,
4,
5,
6,
7,
8,
9]. See also [
10,
11,
12,
13,
14,
15,
16,
17] for further discussions of other factors affecting crossing behavior.
Many researchers have conducted research studies on pedestrian behavior and interactions of experimental, field and simulation approaches [
18,
19,
20,
21,
22]. Most other studies have employed discrete choice techniques including binary logistic regression, logit and probit models to assess gap acceptance behavior and to predict values for the critical gaps [
23,
24,
25,
26,
27]. These techniques, while robust and very widely applied in many fields, might not always produce efficient estimates in cases where there are repeated measurements. A known problem associated with pedestrians’ crossing decisions is the multiple rejected gaps and non-independence of observations because of prior strong assumptions associated with such models. A single pedestrian often rejects more than one gap, and analyzing each rejected gap as a separate observation does not account for the fact that it is rejected by the same person. This introduces a source of vagueness when using conventional discrete choice models, in particular logit-based models. Further prediction techniques could offer possible potential enhancements and flexibility to investigations of pedestrians’ crossing behavior. These alternative prediction techniques include genetic algorithms (GA), fuzzy logic (FL) and other artificial intelligence (AI) methods, and are increasingly used in many engineering applications [
28,
29,
30,
31].
Fuzzy logic systems are powerful prediction tools in dealing with complex problems. These models or groups are mathematical means of representing that vagueness and rough information. They have the ability of distinguishing, expressing, explaining and operating this information, which is vague and lacks preciseness. They can be designed to calculate a distinction between data sets by simulating processes to match those of human reasoning [
32]. The usefulness of fuzzy logic in this kind of investigation is evident since there is not a “standard” mathematical model available or one that can be derived from physical laws for adequately modelling pedestrians’ crossing behavior. Furthermore, fuzzy systems were originally proposed as a solution to imitate the decision-making processes of the human beings by weighing rules; therefore, it seems logical to use them for modeling human behavior. There are many applications of fuzzy logic in many fields, including transportation (see, for example, [
4,
31,
33,
34,
35]. However, there is a significant lack of applications of fuzzy logic systems in transportation in comparison with other fields.
An important feature of fuzzy logic analysis is the membership functions. There are different possible shapes for the membership functions, including triangular, trapezoidal, Gaussian, etc. (see [
33,
36,
37] for an investigation of the efficiency of estimation of different forms). The triangular and trapezoidal membership functions are often adopted in many applications because of their simplicity and the convivence of their computation. It is therefore reasonable to adopt a triangular form in any investigation as a first step. If the performance of the system is not satisfactory, other forms can be used.
Fuzzy logic system is a nonlinear mapping of input data sets to scalar output data [
32].
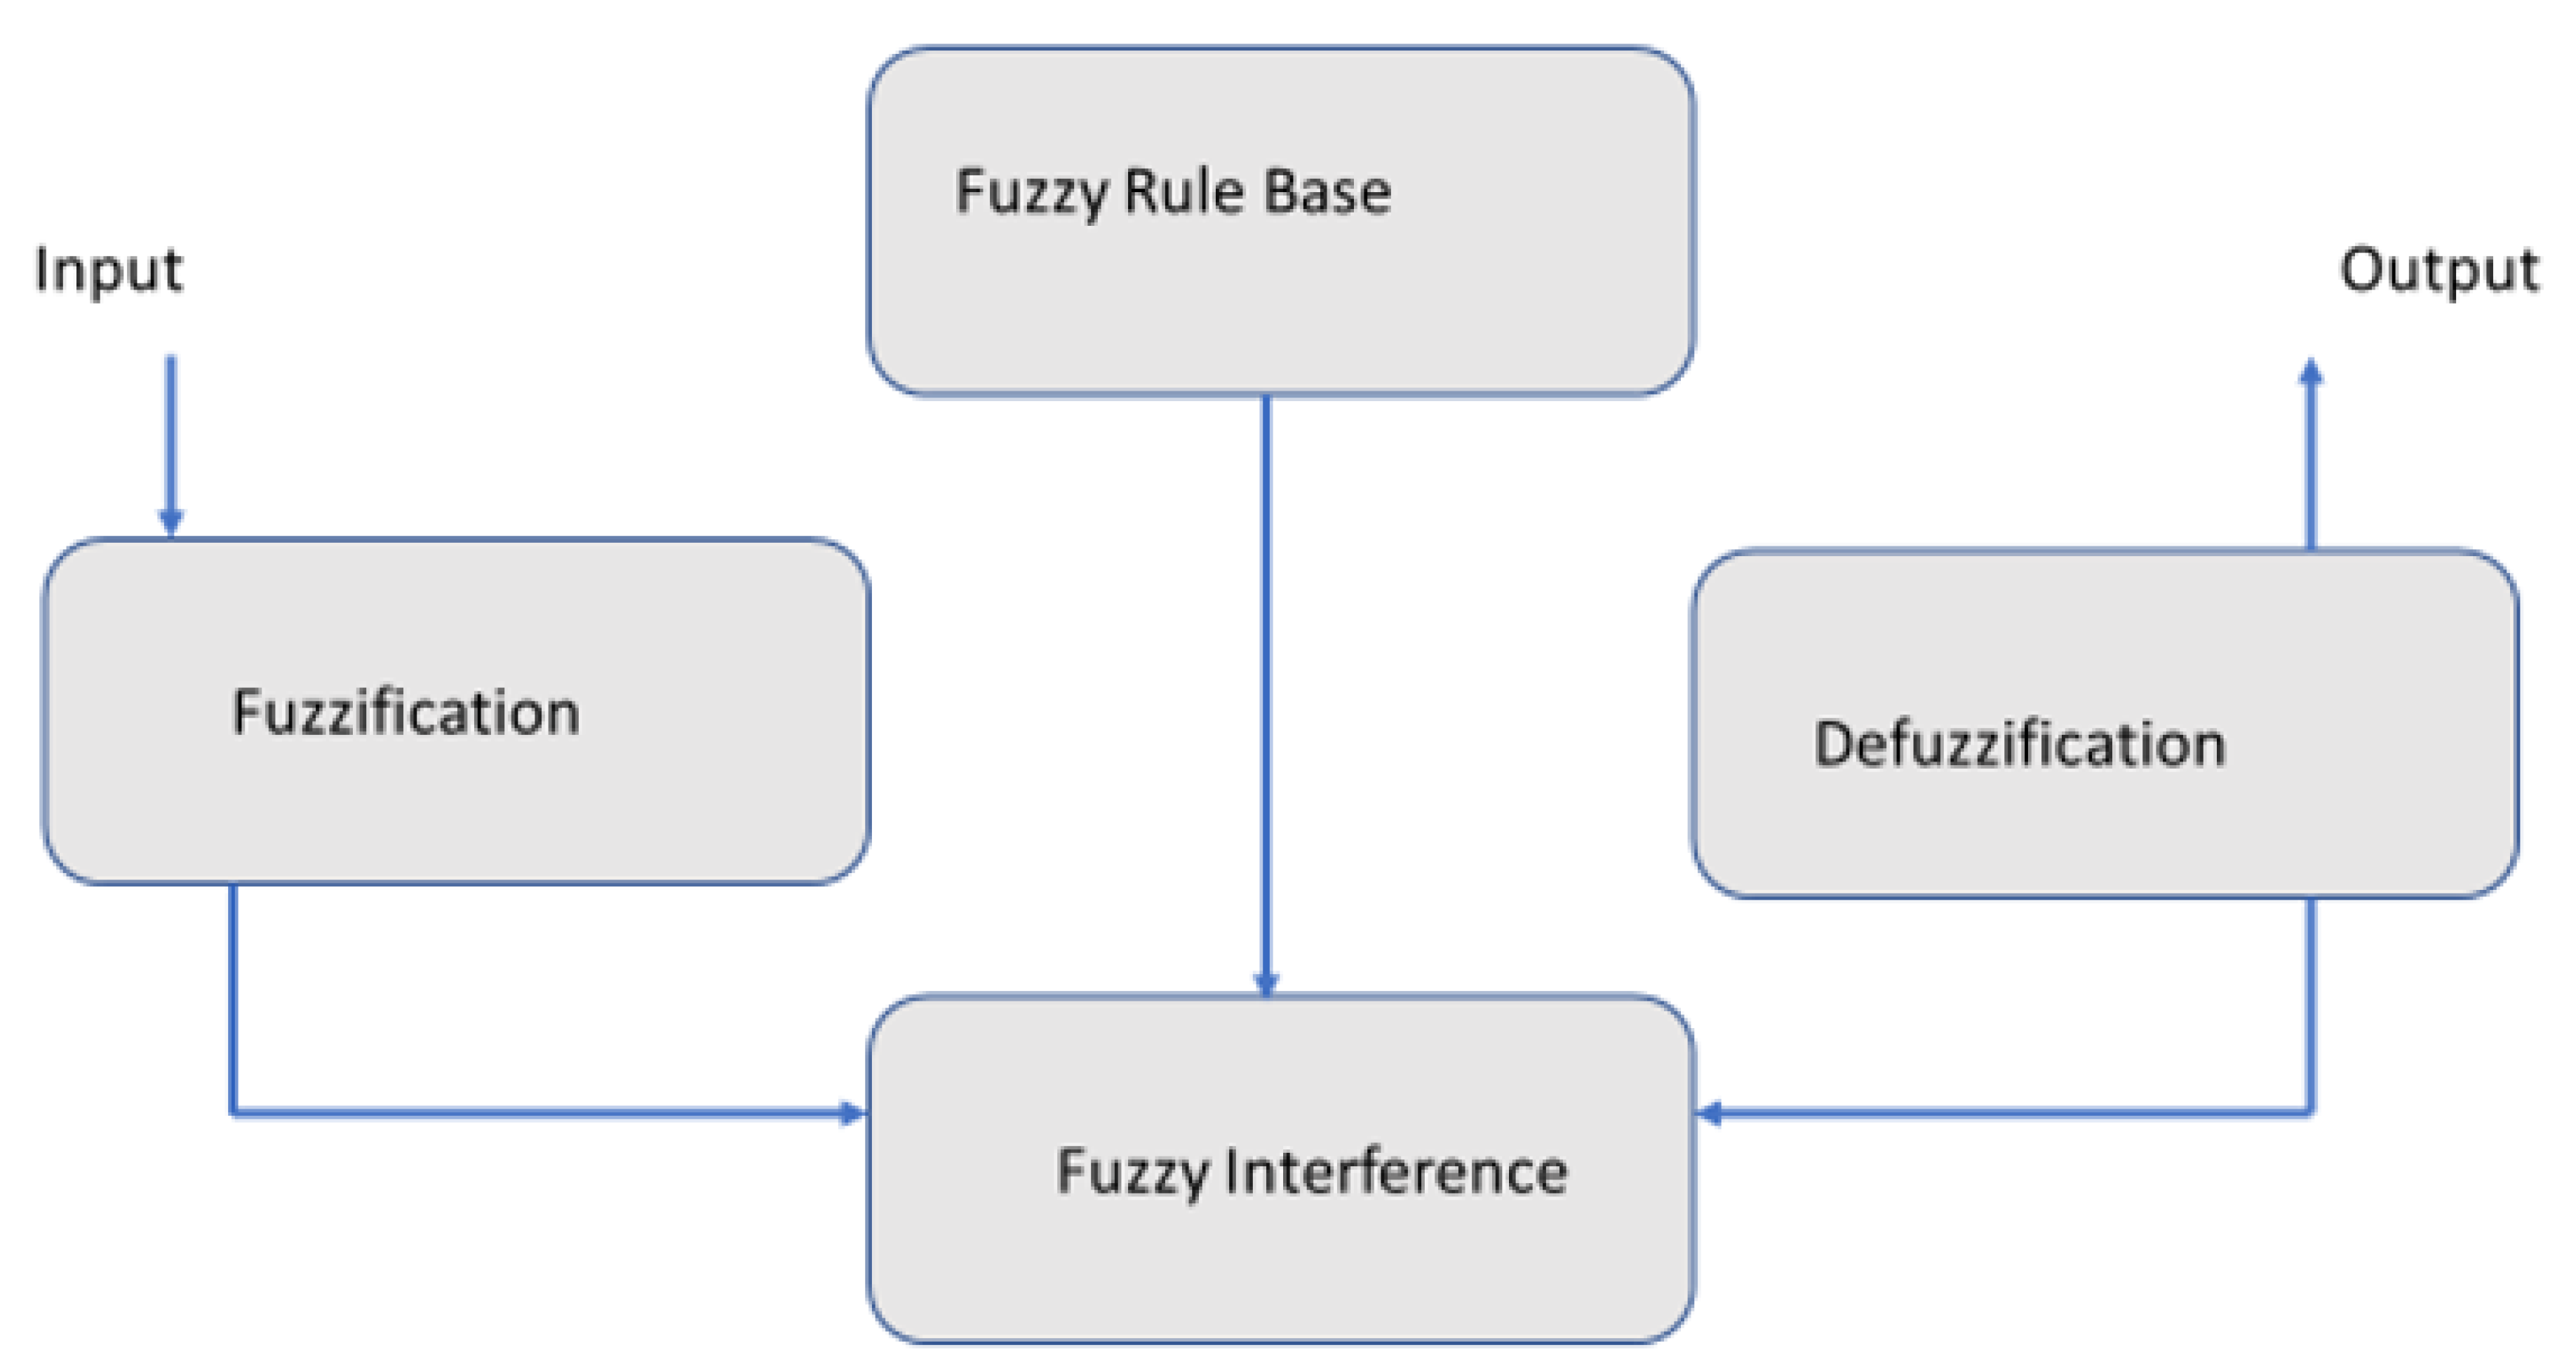
A fuzzifier and a defuzzifier, IF-THEN rules, and an inference engine are the main mechanisms of fuzzy system as illustrated in
Figure 1. The advantage of using fuzzy logic system is that it can handle problems with imprecise and incomplete data. They can also model nonlinear functions of an arbitrary or complex nature.
The main aim of this study is to test the ability to assess critical gap acceptance for pedestrian crossing behavior using fuzzy logic using real data. The outcome of the study could enhance our understanding of pedestrian crossing behavior and, therefore, could have implications that improve transport infrastructure planning and design.
2. Methodology
2.1. Critical Gap Analysis
The gap in the traffic is defined as the duration time between two consecutive vehicles arriving at the exact reference point [
38,
39]. Pedestrian crossing behavior is determined by a critical gap, which is defined as the shortest gap that the pedestrian would accept. Each pedestrian will have a certain value for their critical gap. Pedestrians monitor the gaps available to them and compare them to their critical gap; crossing is attempted when the available gap is equal to or greater than the critical gap [
38,
39]. Assessing the rejected gaps and accepted gaps for each individual pedestrian would allow the identification of the critical gap for that individual, and for the sample population. In this study, data was collected using video recording [
39]. Most previous research on pedestrian behavior has adopted interaction field experimentations and simulation approaches. Very few studies have adopted fuzzy logic controls.
2.2. Fuzzy Logic Analysis
The membership function is the fundamental component of a fuzzy logic system and the most important step in fuzzy set building; i.e., the fuzziness feature in a fuzzy set is controlled by its membership function. There are a number of possible shapes for the membership functions that include Gaussian, triangular, trapezoidal, as well as other forms. The one condition a membership function must actually satisfy is that it needs to vary between 0 and 1. The triangular and trapezoidal membership functions are often adopted in many applications because of their simplicity and ease of calculations over other function types, such as bell, sigmoidal, asymmetric, LR, and Gaussian, which may require more complicated arithmetic operations. In addition, a relatively smaller amount of data is needed to define a triangular and trapezoidal membership function. It is hence prudent to start with a triangular form in our case.
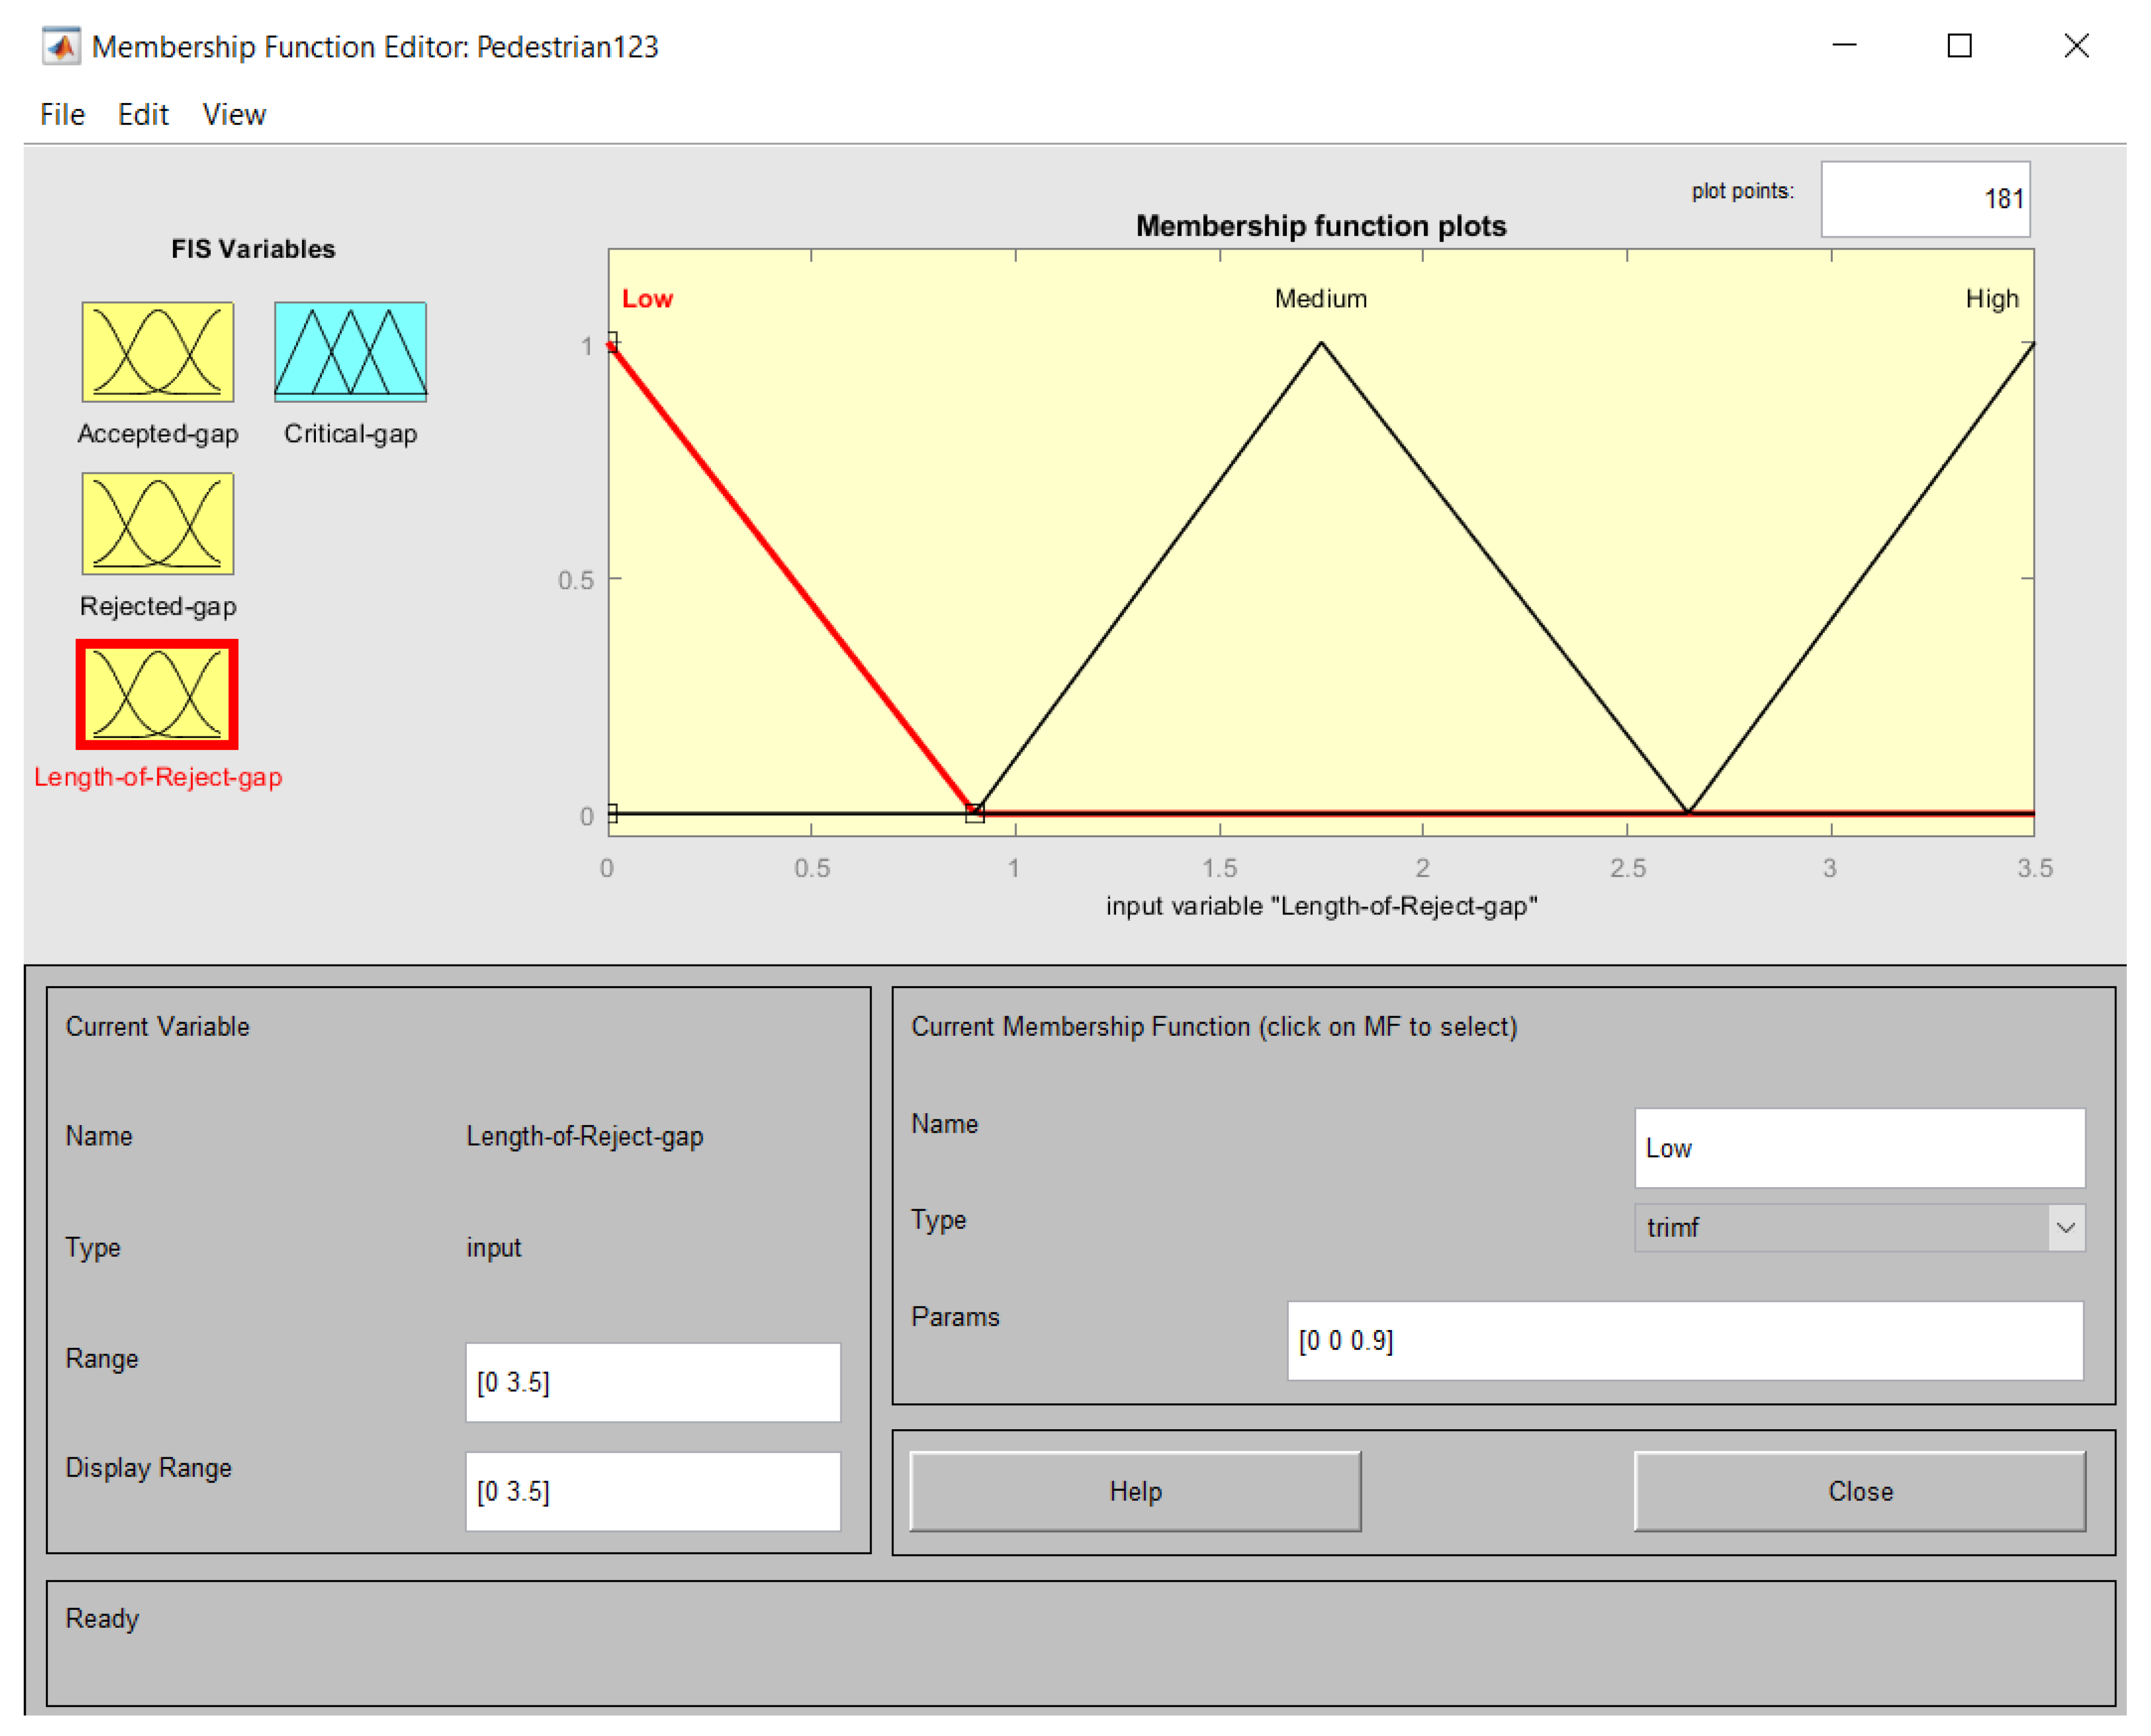
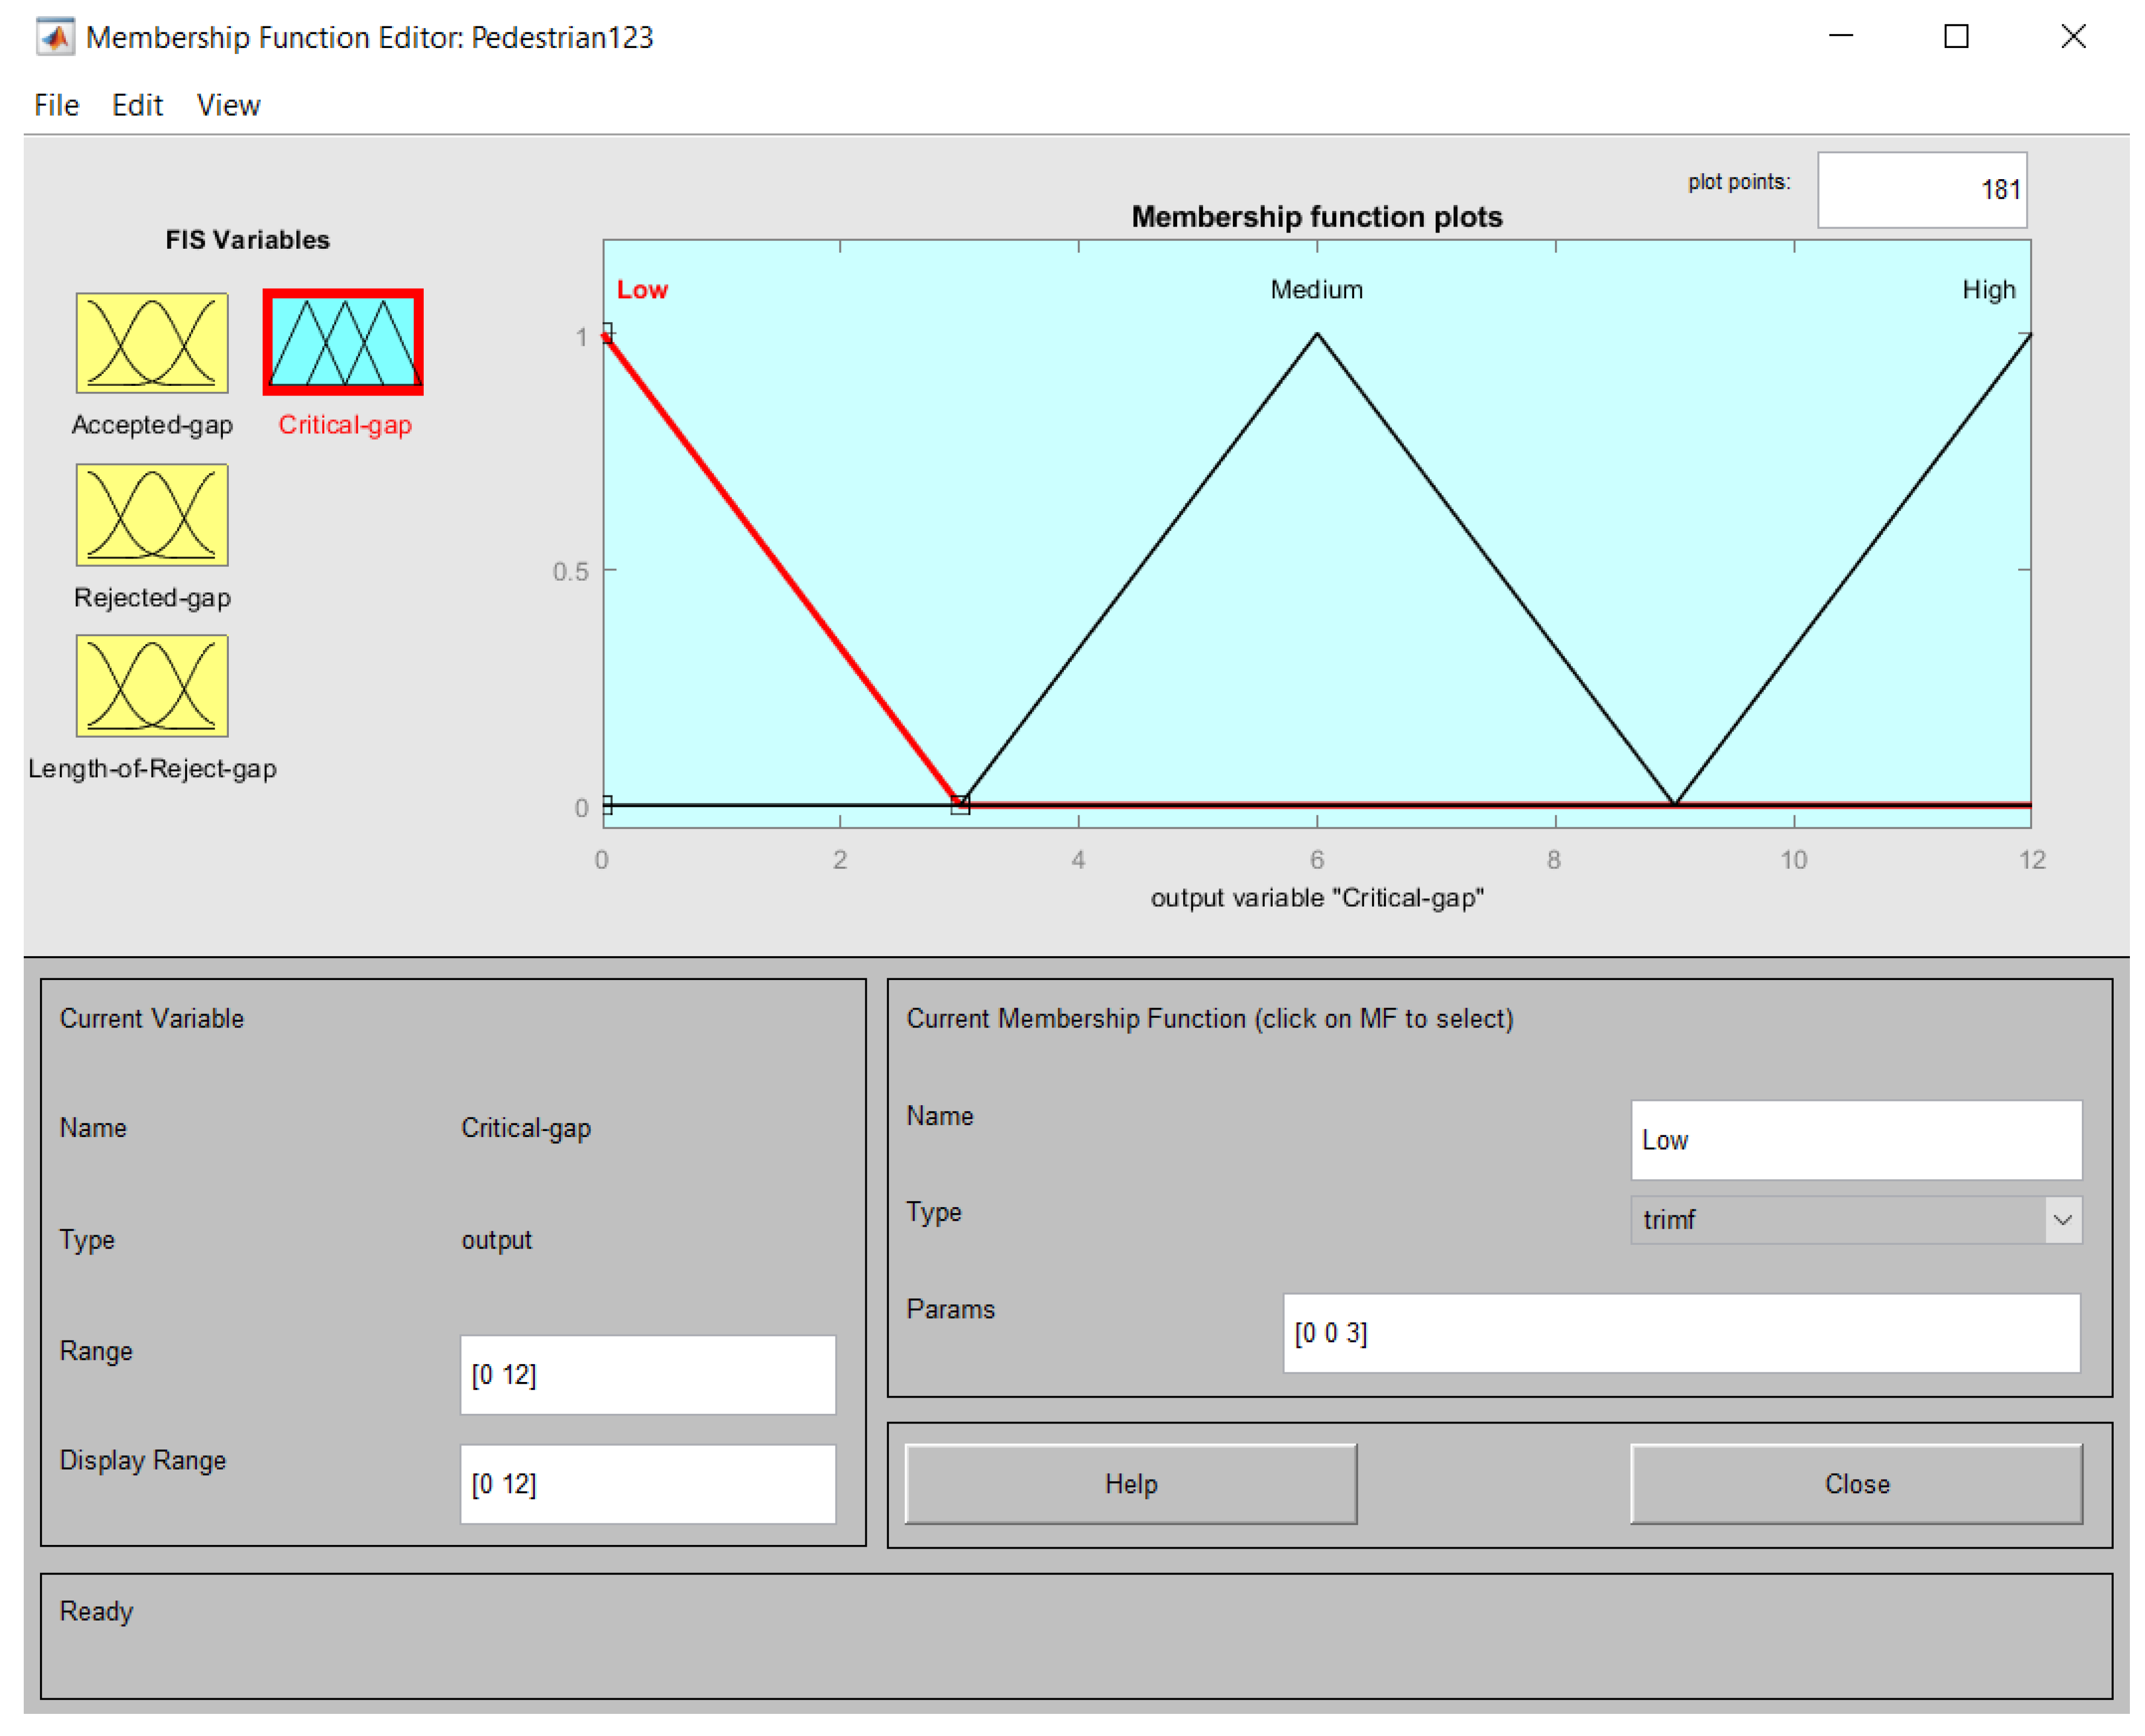
In this analysis, a triangular membership function was specified by three input parameters {a, b, c} to represent the number and lengths of accepted gaps and length of rejected gaps. These are the x coordinates of the three vertices of µ(x) in the fuzzy set A. The MATLAB software was used to build the fuzzy logic systems [
37,
40]. Each of the input variables was defined by three parameters (low, medium and high). Therefore, the three input variables are the number and lengths of rejected gaps and length of accepted gaps, and the output variable of the fuzzy logic system is the critical gap.
Table 1 below shows membership functions used, their names, and input variables with the parameters’ ranges. These values are calculated from real data collected at the selected site in Edinburgh.
2.3. Data Description
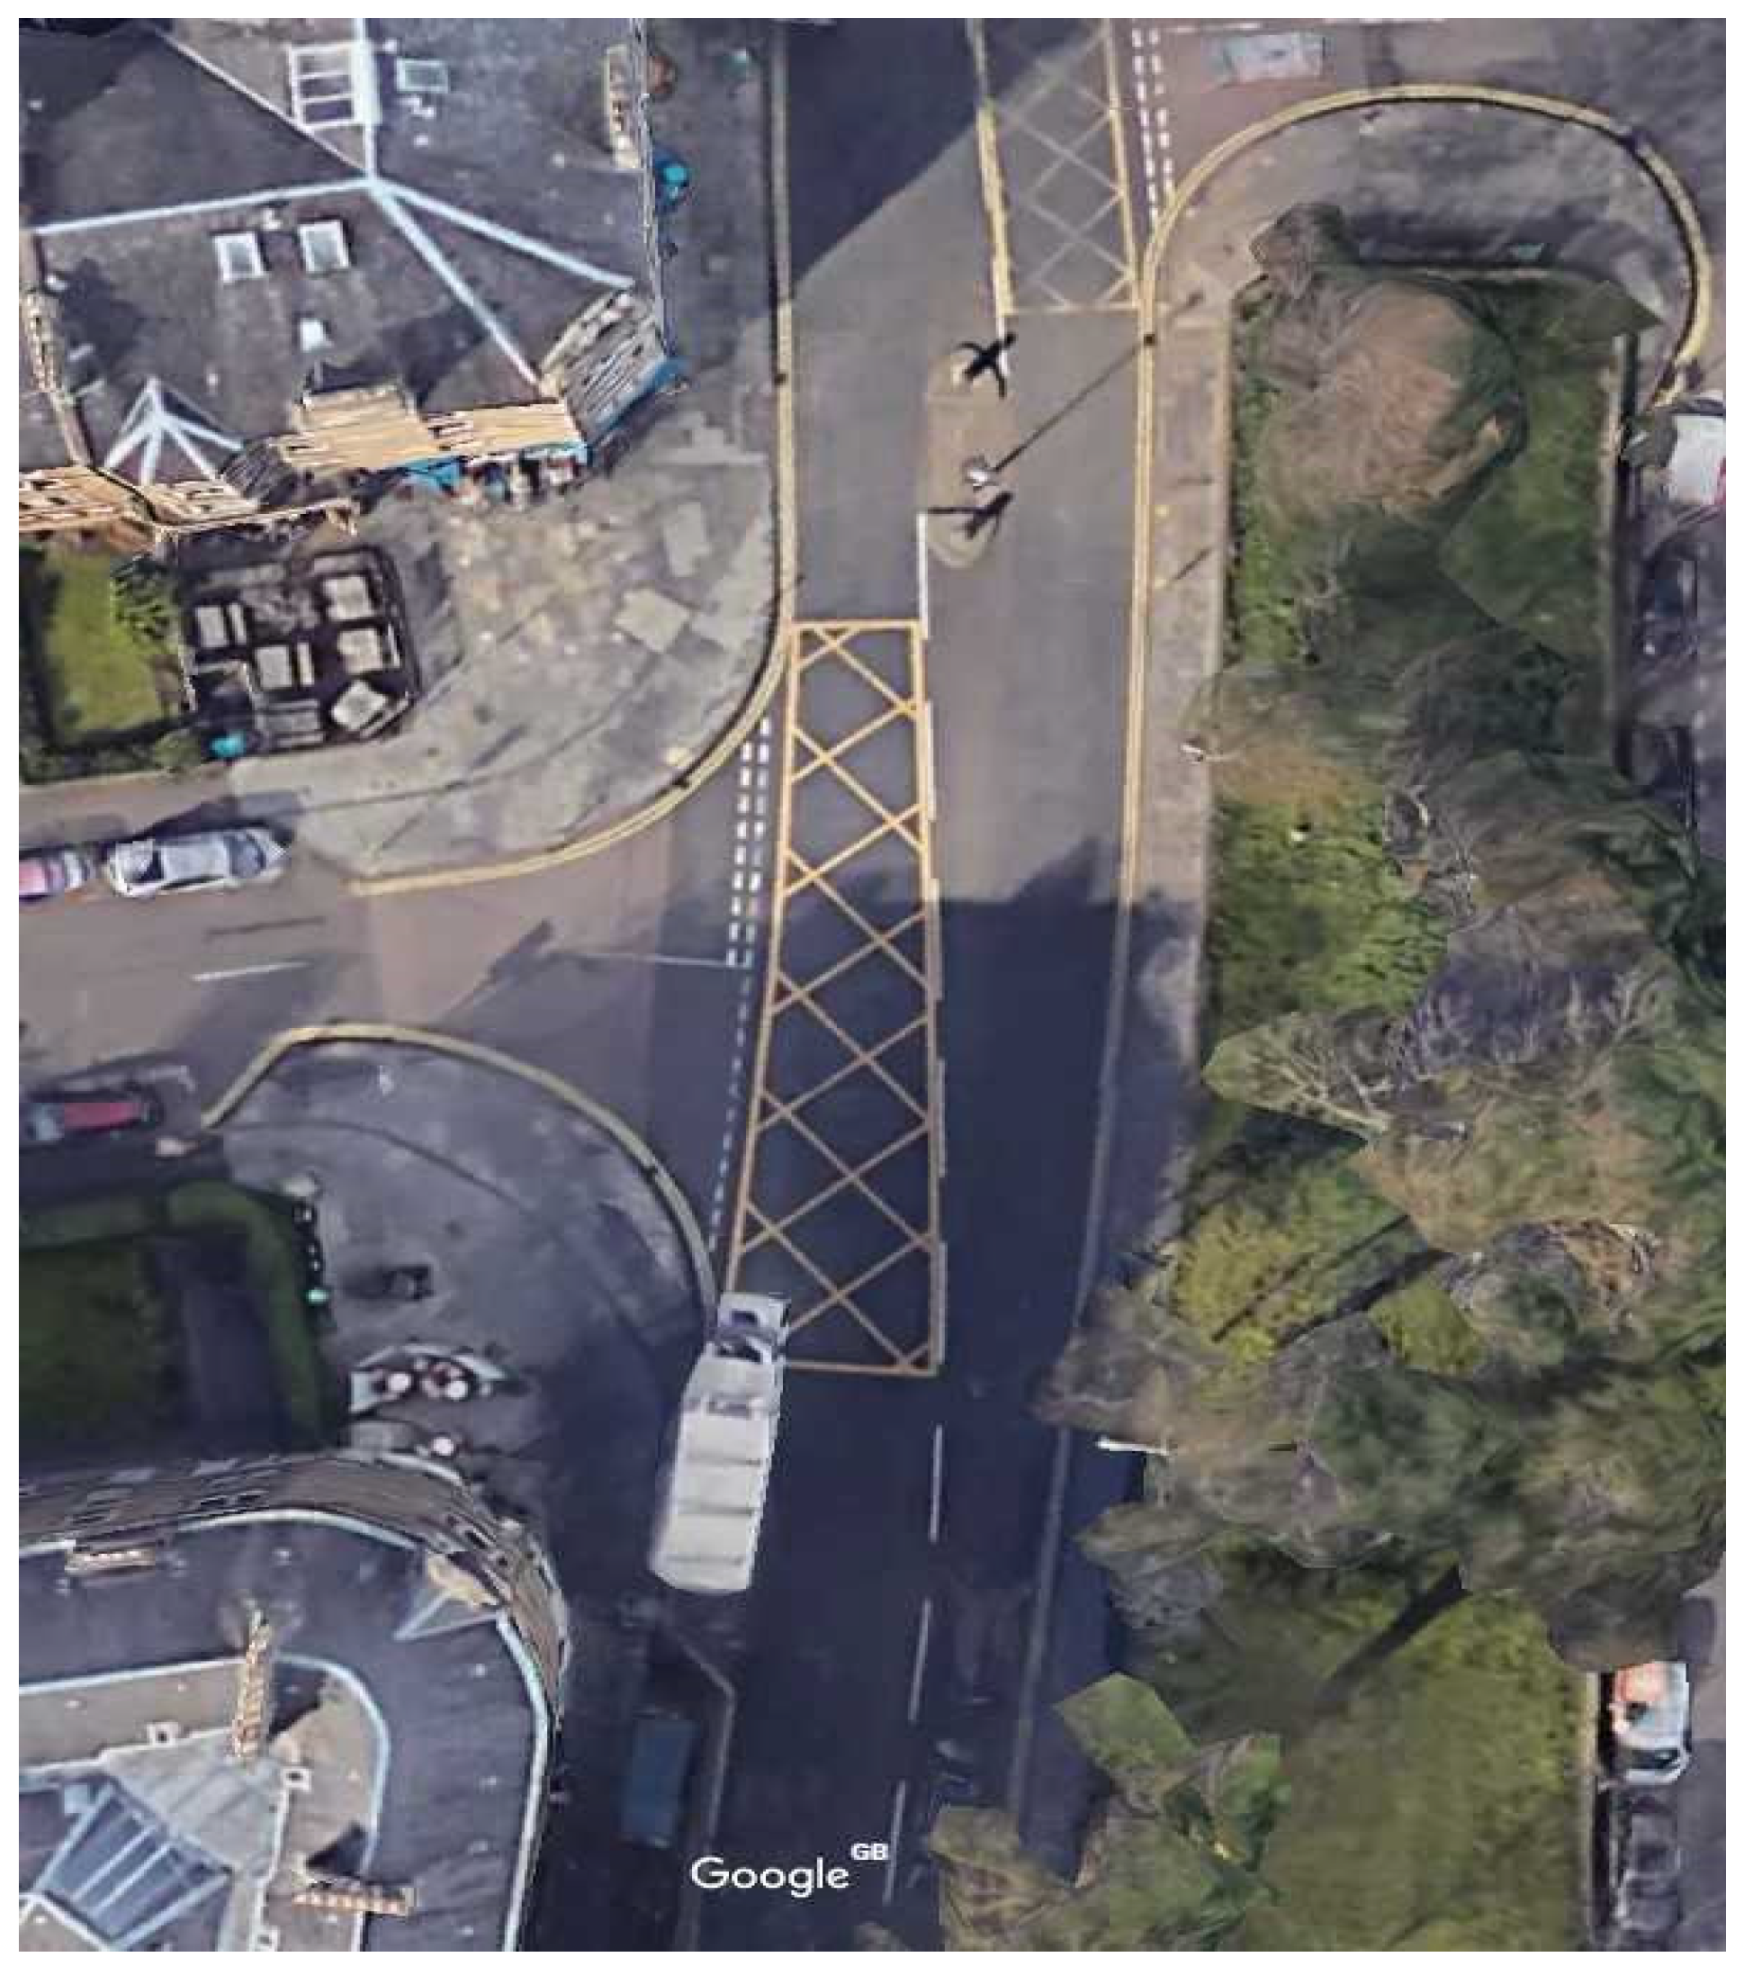
A dataset that was collected in 2017 in Edinburgh (UK) has been used to assess pedestrian critical gaps [
39]. The site is located on a two-way single-midblock crossing location in Edinburgh. It is a location where a two-stage pedestrian crossing exists (
Figure 2). Data was collected using two GoPro cameras, one camera for each traffic direction. The cameras were attached to high signposts at a level above the eyesight of the average adult pedestrian in order to mask them. The size of the cameras and their locations made them discreet so pedestrians were not observed to be paying attention to the cameras. A total of 500 observations were collected over a 3-day period of recording that was conducted from November 2017 to February 2018. In each record, data on pedestrian waiting time, number of rejected gaps and the lengths of all rejected and accepted gaps were obtained.
2.4. Detection of Critical Gaps Using Fuzzy System
The fuzzy system process that is implemented in this analysis follows the approach adopted by Mendel (1995), which includes three steps:
These are explained below.
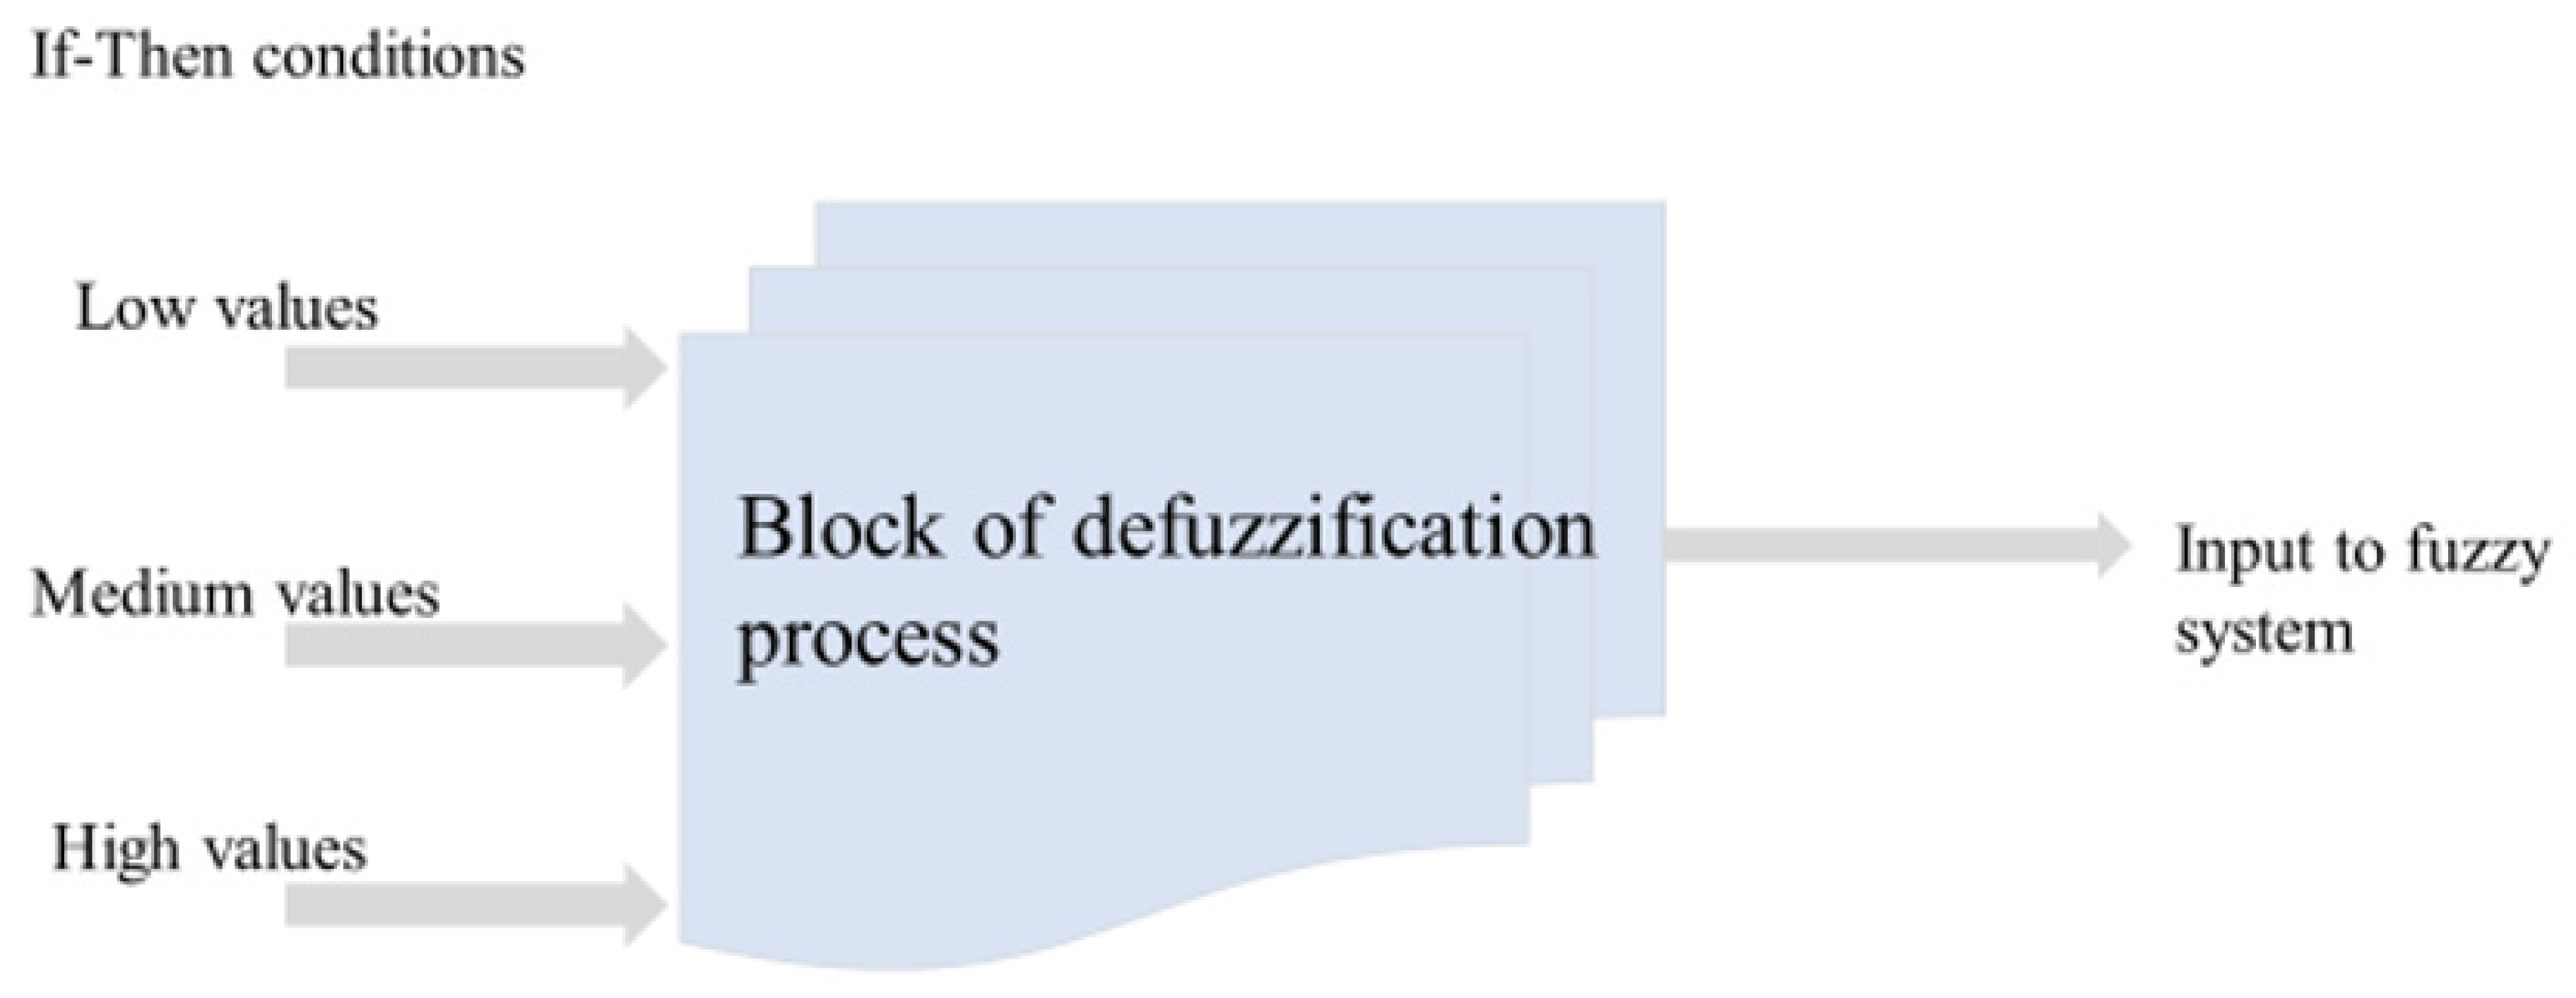
The first step is the fuzzification process, which can be achieved by converting the input data to a fuzzy set through fuzzy linguistic variables and membership functions. Then, based on IF-THEN rules, the inference process is carried out. Lastly, the defuzzification step is implemented, which is then completed using membership functions to crisp fuzzy outputs (
Figure 3). Each of these steps will be further illustrated below.
3. Fuzzification Process
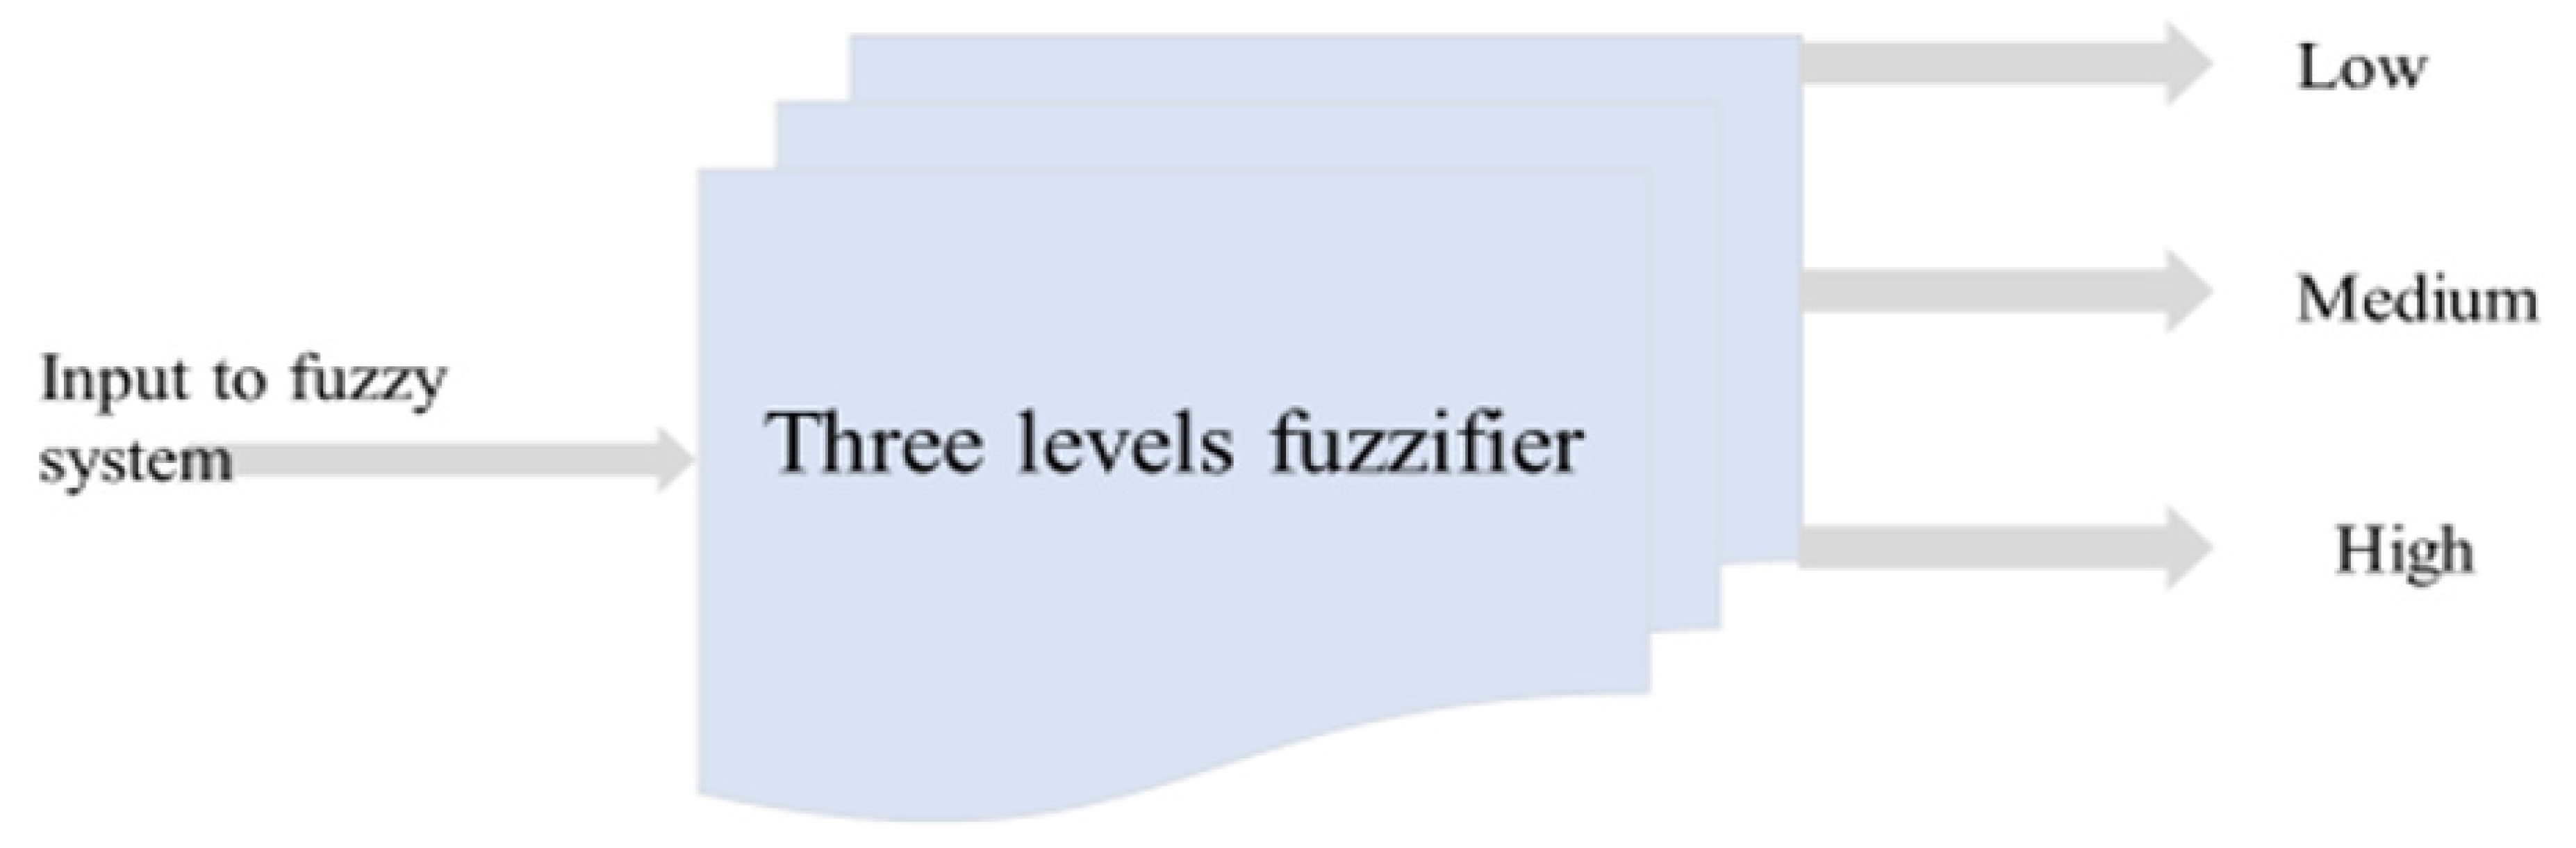
The fuzzification process is the first step in the fuzzy logic system. At this stage, converting the input data into a fuzzy set is implemented through fuzzy linguistic variables and membership functions. In order to fuzzify the input and output factors, it is common practice to adopt three to seven linguistic variables. Less than three values would be inefficient and would make it hard to differentiate the output after fuzzy inference [
30,
31]. More than seven would complicate the number of fuzzy rules used.
In this case, the membership function in the fuzzification process is constructed using three parameters {a, b, c} for each input and output variable, denoting low, medium and high values of each of the inputs, with variable ranges presented in
Table 1. The estimation toolbox included in MATLAB was adopted. The triangular membership function, which is specified by the three parameters a, b and c, represents the z coordinates of the three vertices in a fuzzy set L (a and c are the lower and upper boundaries, where membership degree is 0; b is the center, where membership degree is 1), as presented by the equation below:
Using this toolbox, the real-time data can then be matched with the adopted fuzzy model and have a mathematical justification for selecting a determined value for a rule, such as sum-of-squared-error minimization or any other suitable rule. The fuzzy system used for predicting the critical gap for pedestrians crossing is created from the knowledge of the inputs (number and lengths of rejected gaps and length of accepted gaps) and the output of the fuzzy logic system (the critical gaps).
The observed length of accepted gaps has been assigned to one of three ranges of membership functions: low (0–1.75 s), medium (1.75–5.62 s) or high (5.62–7.6 s). Similarly, this has been done for all input and output variables (
Table 1).
Table 1 and
Figure 4 show the values and structure of inputs, outputs and critical gap values for the three adopted ranges from the survey data.
Figure 5 and
Figure 6 show the three levels of inputs and the three levels of outputs in the fuzzy logic system and the ranges of membership functions for the inputs and outputs respectively.
As shown in the inputs and outputs of the fuzzy system, the used membership functions are of a triangle type. As discussed earlier, triangle membership functions constitute one amongst a range of possibilities yielding the optimal values of the introduced criteria. While the simplicity of this partition becomes evident, it does not preclude that one could construct some other partitions that are optimal in the sense of the assumed criteria for the input and output interface and simultaneously perform better when it comes to the optimization of the processing block itself.
4. Inference Process Based on IF-THEN Rules
Based on a wide-ranging number of IF-THEN rules, inference processes will be carried out using linguistic IF-THEN rules to shape the relationships between the input and output variables. The data used in this study provides information for each pedestrian on the number and lengths of the rejected gaps and the length of the accepted gaps. Fuzzy logic control system linguistic IF-THAN rules have been generated as part of the proposed fuzzy control or fuzzy decision step.
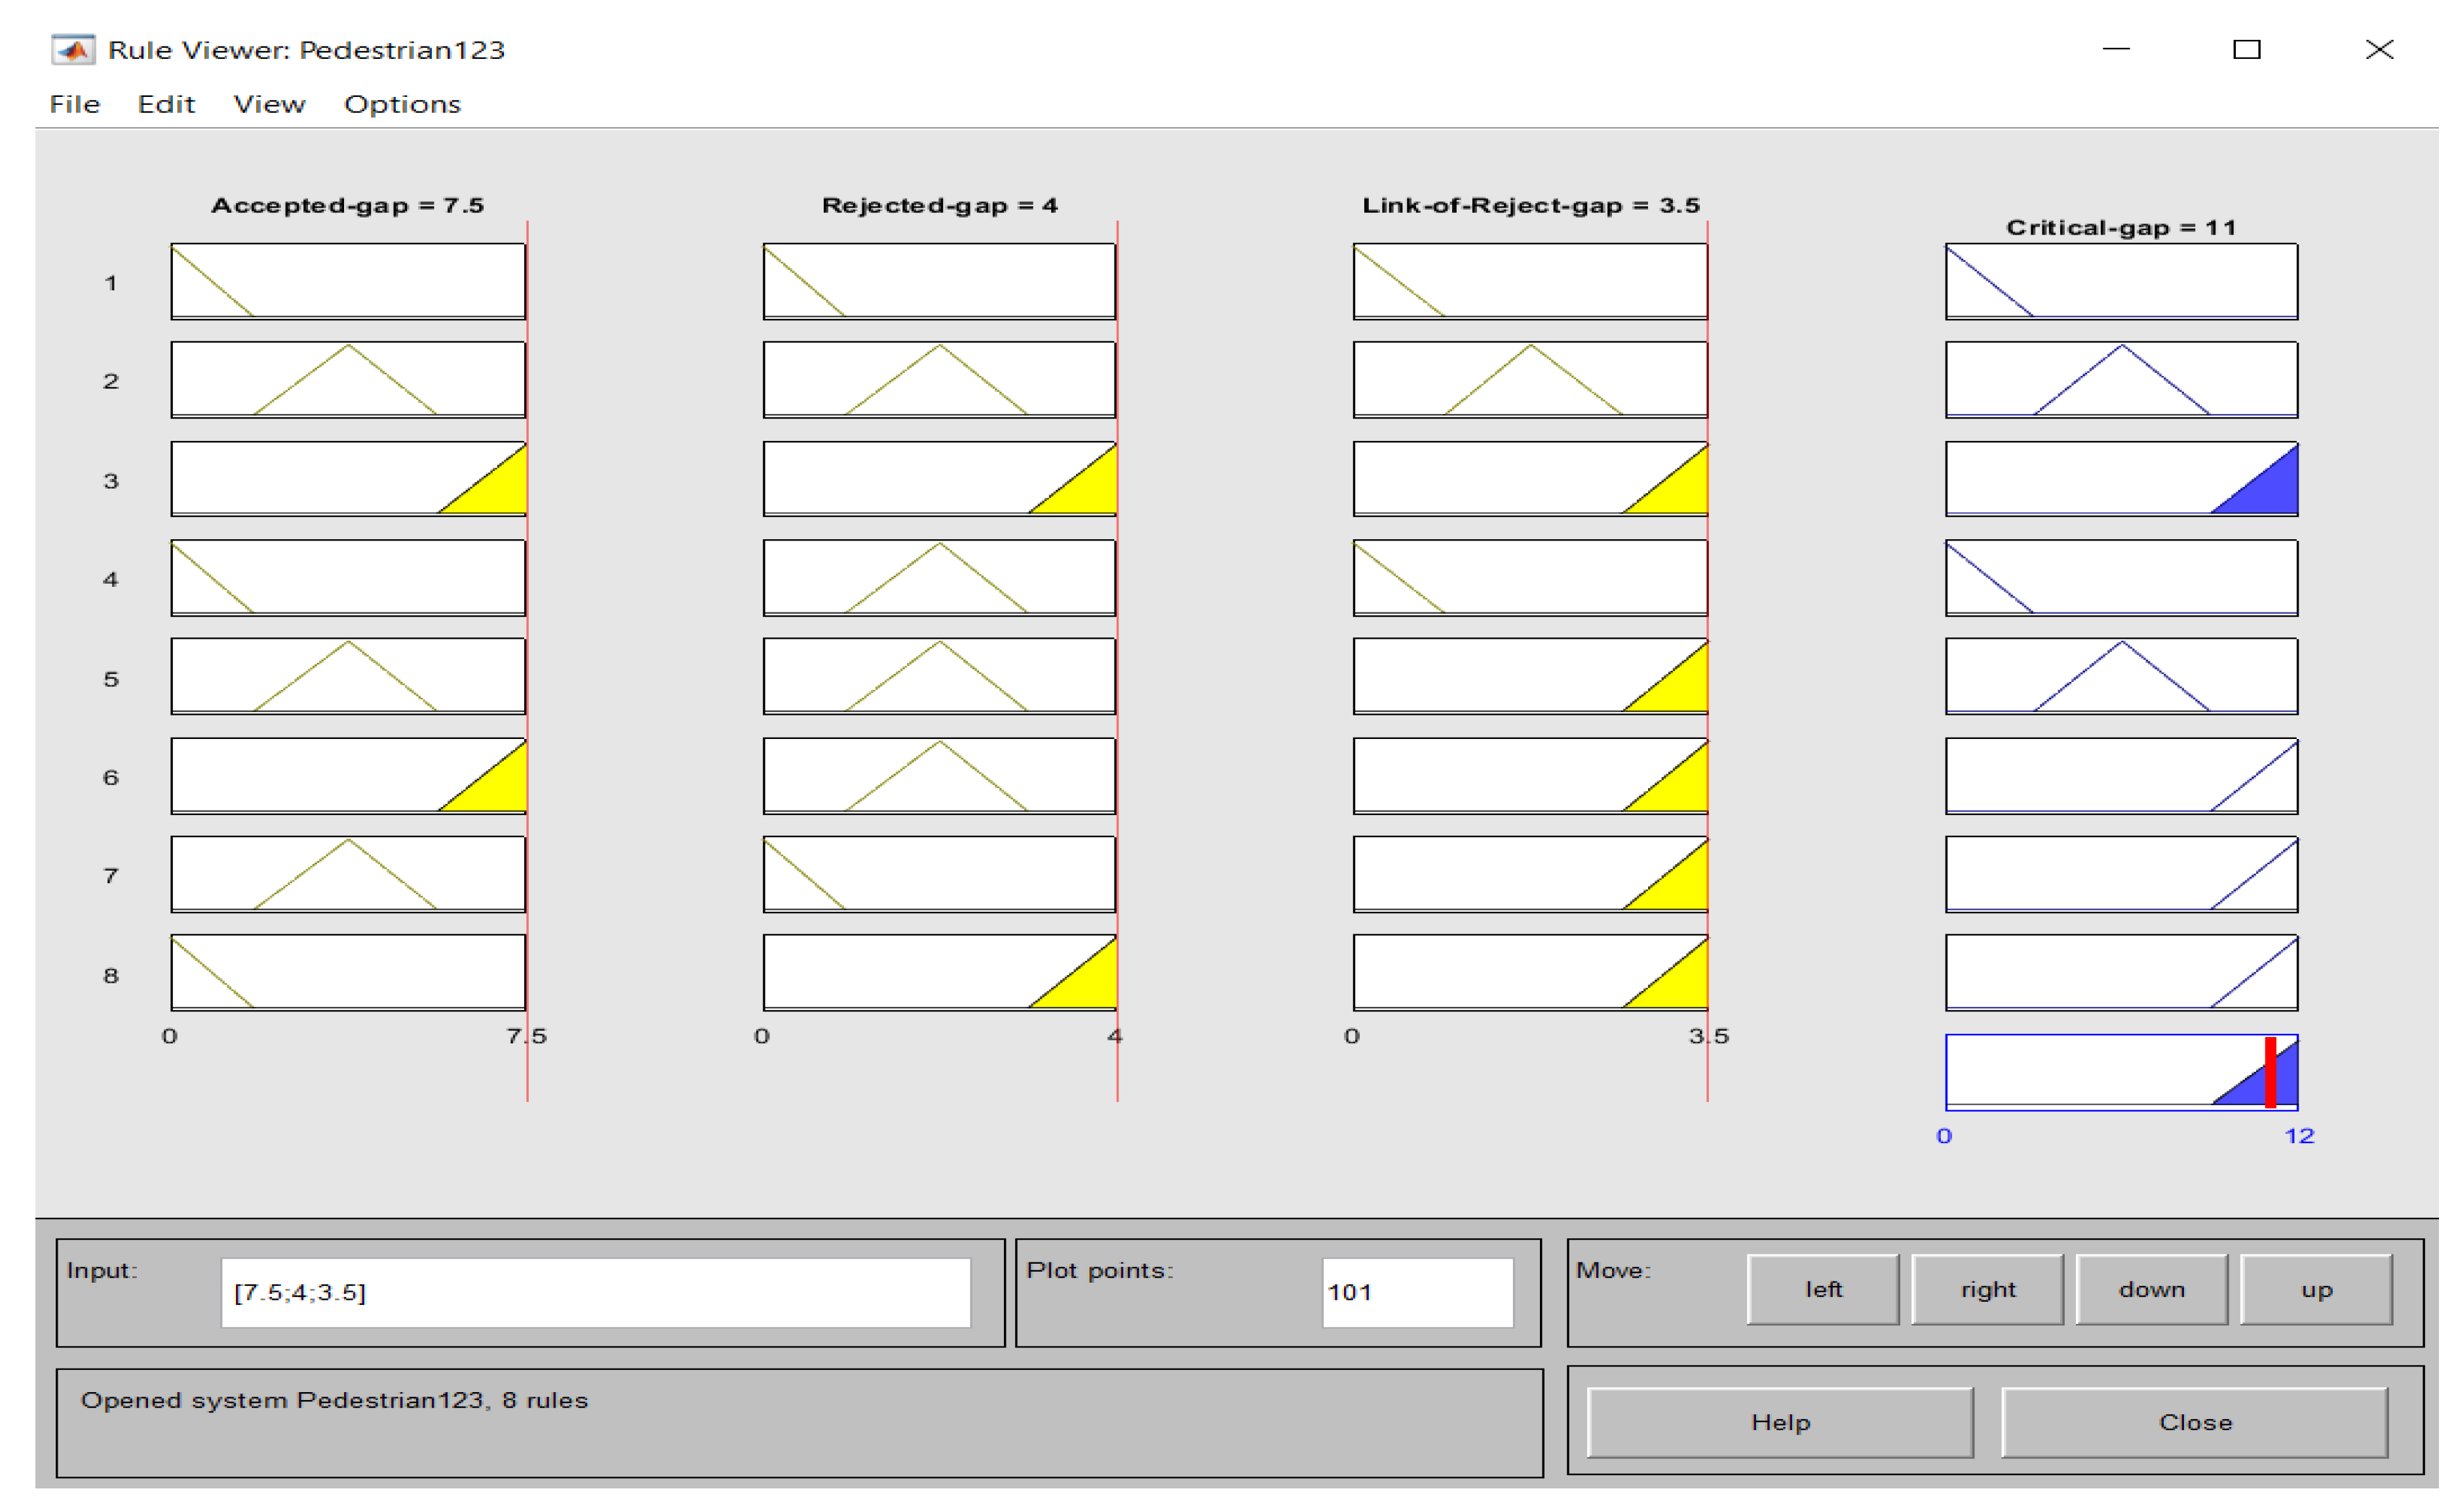
Table 2 below shows a few examples of IF-THEN rules that have been used in this investigation. In total, there are fifteen IF-THEN rules that have been used in this analysis in order to embrace all alternative options.
5. Defuzzification Step
The final step of the optimization process through the fuzzy control system is the process of the defuzzification. The defuzzification process is carried out based on the membership function of each individual as well as the computation of their decisions. If the performance is not acceptable according to the assessment criteria, then some fuzzy rules will need to be modified then re-run.
Figure 7 below shows a graphical representation of the defuzzification process. The results of the fuzzy system are shown in
Figure 8 and
Table 3. The results show that the critical gap values obtained using the proposed fuzzy logic system and using the input data ranges from 0.987 s to 11.00 s with an optimal value of 6.0 s. For the accepted gaps, the fuzzy logic system predicts an optimum value of 1.92 s while the range extends from 0.214 s to 7.5 s. The number of rejected gaps ranges from 0.892–4.0 with an optimum value of 1.93. Finally, the range of length of rejected gap is from 0.144 to 3.4 s with an optimum value of 0.554 s. These values are within acceptable span when compared with the input values. The outcomes look reasonable and are in agreement with findings from previous studies that applied conventional analytical methods. For example, some studies [
2,
32,
33,
34] estimated values of the critical gap to be 3–8 s. [
39] reported values of critical gap ranges from 5.75 s and 6.25 s using conventional statistical methods. Accordingly, the predicted critical gap values can be accepted as conceivable values.
6. Discussion of Results
Fuzzy logic analysis was adopted to predict critical gaps for pedestrians’ crossing using a fuzzy logic system. The fuzzy inputs (the lengths and number of rejected gaps and lengths of accepted gaps) were built each using three parameters (low, medium and high) in order to assess and calculate the critical gaps for each individual in the set. Triangular membership functions for each input were calibrated for each decision maker. A dataset of 500 observations that was collected in 2017 using two GoPro cameras in Edinburgh (UK) was used to assess pedestrian critical gaps. The site was located on a two-way midblock crossing location.
The results are encouraging and show a number of positive contributions. Firstly, the analysis presented in this paper shows that it is evidently possible to use fuzzy logic analysis to assess and predict pedestrians’ crossing behavior. This is a good outcome as it may offer opportunities to enhance understanding of pedestrians’ crossing behavior using other tools than those conventionally used.
Critical gap values obtained using the proposed fuzzy logic system range from 0.987 s to 11.00 s with an optimal value of 6.0 s. For the accepted gaps, the fuzzy logic system predicts an optimum value of 1.92 s while the range is 0.214 s to 7.5 s. Number of rejected gaps ranges from 0.892–4.0 with an optimum value of 1.93. Finally, length of rejected gap is ranging from 0.144 to 3.4 s with an optimum value of 0.554s. These values are within reasonable limits with the input values. The outcomes look reasonable and are in agreement with findings from previous studies that applied conventional analytical methods. For example, critical gap values were estimated in the range from 3–8 s in [
2]. [
39] also calibrated values of critical gap ranges from 5.75 s and 6.25 s using conventional statistical methods. Accordingly, the predicted critical gap value can be endorsed as reasonable. It should be noted here that no further validation of these values has been carried out and, therefore, this is suggested for further research. In addition, it is possible for future research to assume different membership function forms of fuzzy logic systems in the analysis, as well as including more variability by including pedestrians’ characteristics and waiting times. Further statistical analysis can also be adopted. For example, in the estimation toolbox included in MATLAB, the real-time data was matched with the adopted fuzzy model; other mathematical justifications can be used, such as sum-of-squared-error minimization or any other suitable rule. This could also be suggested for further research.
7. Conclusions
Most previous research on pedestrian behavior has adopted interaction field experimentation and simulation approaches. This current study adopts a fuzzy logic analysis approach. The critical gap, which is defined as the shortest gap that the pedestrian would accept, affects pedestrians’ decisions about when to cross a road, and has been assessed using fuzzy logic analysis. This has been achieved by assessing the number and length of rejected gaps and accepted gaps for each individual pedestrian.
Fuzzy logic analysis was then carried out to estimate the critical gap, which involved three steps. The fuzzification process was attained by translating the input data into fuzzy sets through fuzzy linguistic variables and membership functions. The inputs to the system included lengths and the number of rejected gaps for each individual at the crossing location and the length of the accepted gap. Three parameters were used for each input and output variable to identify the membership function (low, medium and high). Then, based on IF-THEN rules, the inference process was carried out. Lastly, a defuzzification step was functioned. In this case, the membership functions were used to calculate and produce fuzzy outputs. The output, the temporal critical gap, was found to be 6.0 s. This value is comparable with other values obtained using different statistical methods.
The experiment shows that the critical gap for pedestrian crossing is possible to predict using fuzzy logic analysis. These results could complement other conventional methods that have been reported in the literature, including the graphical method and discrete choice models. This is a valuable outcome that might have useful implications for transport planners and highway engineers. Further research in this area is definitely required, with larger numbers of locations as well as consideration of further attributes of pedestrians, including additional variables such as pedestrian waiting time as well as other demographic characteristics in the analysis. The current investigation adopted a triangular membership function in the fuzzification process. Other types of functions, such as trapezoidal or Gaussian, can be attempted and the results can be compared in future research.
Author Contributions
Conceptualization, W.S.S. and M.M.A.L.; methodology, W.S.S. and M.M.A.L.; software, W.S.S. and M.M.A.L.; validation, W.S.S. and M.M.A.L. formal analysis, W.S.S. and M.M.A.L.; investigation, W.S.S. and M.M.A.L.; writing—original draft preparation, W.S.S.; writing—review and editing, W.S.S.; visualization, W.S.S. and M.M.A.L.; supervision, W.S.S.; project administration, W.S.S. All authors have read and agreed to the published version of the manuscript.
Funding
This research was funded by the Deanship of Scientific Research at Princess Nourah bint Abdulrahman University through the Fast-track Research Funding Program. The work reported in this article has been conducted while the researcher is affiliated with Princess Nourah bint Abdulrahman University.
Acknowledgments
We thank to the Deanship of Scientific Research at Princess Nourah bint Abdulrahman University through the Fast-track Research Funding Program. The work reported in this article has been conducted while the researcher is affiliated with Princess Nourah bint Abdulrahman University.
Conflicts of Interest
The authors declare no conflict of interest.
References
- Papadimitriou, E.; Lassarre, S.; Yannis, G. Pedestrian risk taking while road crossing: A comparison of observed and declared behaviour. Transp. Res. Procedia 2016, 14, 4354–4363. [Google Scholar] [CrossRef]
- Digvijay, S.; Pawar Gopal, R. Patil Critical gap estimation for pedestrians at uncontrolled mid-block crossings on high-speed arterials. Saf. Sci. 2016, 86, 295–303. [Google Scholar]
- Das, S.; Manski, C.F.; Manuszak, M.D. Walk or wait? An empirical analysis of street crossing decisions. J. Appl. Econom. 2005, 20, 529–548. [Google Scholar] [CrossRef]
- Chen, C.; Xiupeng, S.; Yiik, D.W.; Meng, J.E.; Evan TMeng, G. Fuzzy logic-based observation and evaluation of pedestrians’ behavioral patterns by age and gender. Transp. Res. Part F Traffic Psychol. Behav. 2016, 40, 104–118. [Google Scholar]
- Wang, W.; Guo, H.; Gao, Z.; Bubb, H. Individual differences of pedestrian behaviour in midblock crosswalk and intersection. Int. J. Crashworthiness 2011, 16, 1–9. [Google Scholar] [CrossRef]
- Brewer, M.; Fitzpatrick, K.; Whitacre, J.; Lord, D. Exploration of pedestrian gap-acceptance behavior at selected locations. Transp. Res. Rec. J. Transp. Res. Board 2006, 1982, 132–140. [Google Scholar] [CrossRef]
- Hamed, M.M. Analysis of pedestrians’ behavior at pedestrian crossings. Saf. Sci. 2001, 38, 63–82. [Google Scholar] [CrossRef]
- Mamidipalli, S.V.; Sisiopiku, V.P.; Schroeder, B.J.; Elefteriadou, L.; Salamati, K.; Rouphail, N.M. Probit-Based Pedestrian Gap Acceptance Model for Midblock Crossing Locations. Transp. Res. Rec. J. Transp. Res. Board 2015, 2519, 128–136. [Google Scholar] [CrossRef]
- Chu, X.; Baltes, M.R. Pedestrian Mid-Block Crossing Difficulty; (No. NCTR-392-09); National Center for Transit Research, Center for Urban Transportation Research, University of South Florida: Tampa, FL, USA, 2001. [Google Scholar]
- Papadimitriou, E.; Lassarre, S.; Yannis, G. Human factors of pedestrian walking and crossing behaviour. Transp. Res. Procedia 2017, 25, 2007–2020. [Google Scholar] [CrossRef]
- Papadimitriou, E.; Yannis, G.; Golias, I. A critical assessment of pedestrian behaviour models Transp. Res. Part F Traffic Psychol. Behav. 2009, 12, 242–255. [Google Scholar] [CrossRef]
- Kadali, B.R.; Vedagiri, P. Modelling pedestrian road crossing behaviour under mixed traffic condition. Eur. Transp. 2013, 55, 1–17. [Google Scholar]
- Kadali, R.B.; Vedagiri, P. Effect of vehicular lanes on pedestrian gap acceptance behaviour. Procedia-Soc. Behav. Sci. 2013, 104, 678–687. [Google Scholar] [CrossRef]
- Kadali, R.B.; Vedagiri, P.; Rathi, N. Models for pedestrian gap acceptance behaviour analysis at unprotected mid-block crosswalks under mixed traffic conditions. Transp. Res. Part F 2015, 32, 114–126. [Google Scholar] [CrossRef]
- Oxley, J. Age Differences in Road Crossing Behaviour. Ph.D. Thesis, Monash University, Melbourne, Australia, 2000. [Google Scholar]
- Oxley, J.A.; Ihsen, E.; Fildes, B.N.; Charlton, J.L.; Day, R.H. Crossing roads safely: An experimental study of age differences in gap selection by pedestrians. Accid. Anal. Prev. 2005, 37, 962–971. [Google Scholar] [CrossRef]
- Lobjois, R.; Cavallo, V. Age-related differences in street-crossing decisions: The effects of vehicle speed and time constraints on gap selection in an estimation task. Accid. Anal. Prev. 2007, 39, 934–943. [Google Scholar] [CrossRef]
- Imprialou, M.; Quddus, M.; Pitfield, D.E. High accuracy crash mapping using fuzzy logic. Transp. Res. C (Emerg. Technol.) 2014, 42, 107–120. [Google Scholar] [CrossRef]
- Lv, W.; Song, W.G.; Ma, J.; Fang, Z.M. A Two-Dimensional Optimal Velocity Model for Unidirectional Pedestrian Flow Based on Pedestrian’s Visual Hindrance Field. IEEE Trans. Intell. Transp. Syst. 2013, 14, 1753–1763. [Google Scholar] [CrossRef]
- Lam, W.H.K.; Chan, K.S.; Goh, P.K. A Generalised Function for Modeling Bi-Directional Flow Effects on Indoor Walkways in Hong Kong. Transp. Res. Policy Pr. 2003, 37, 789–810. [Google Scholar] [CrossRef]
- Chattaraj, U.; Seyfried, A.; Chakroborty, P.; Biswal, M.K. Modelling Single File Pedestrian Motion Across Cultures. Procedia Soc. Behav. Sci. 2013, 104, 698–707. [Google Scholar] [CrossRef]
- Vanumu, L.D.; Ramachandra Rao, K.; Tiwari, G. Fundamental diagrams of pedestrian flow characteristics: A review. Eur. Transp. Res. Rev. 2017, 9. [Google Scholar] [CrossRef]
- Kaparias, I.; Bell, M.; Dong, W.; Sastrawinata, A.; Singh, A.; Wang, X.; Mount, B. Analysis of pedestrian-vehicle traffic conflicts in street designs with elements of shared space. Transp. Res. Rec. J. Transp. Res. Board 2013, 2393, 21–30. [Google Scholar] [CrossRef]
- Yannis, G.; Papadimitriou, E.; Theofilatos, A. Pedestrian gap acceptance for mid-block street crossing. Transp. Plan. Technol. 2013, 36, 450–462. [Google Scholar] [CrossRef]
- Cherry, C.; Donlon, B.; Yan, X.; Moore, S.E.; Xiong, J. Illegal mid-block pedestrian crossings in China: Gap acceptance, conflict and crossing path analysis. Int. J. Inj. Control Saf. Promot. 2012, 19, 320–330. [Google Scholar] [CrossRef] [PubMed]
- Holland, C.; Hill, R. The effect of age, gender and driver status on pedestrians’ intentions to cross the road in risky situations. Accid. Anal. Prev. 2007, 39, 224–237. [Google Scholar] [CrossRef] [PubMed]
- Ishaque, M.M.; Noland, R.B. Behavioural issues in pedestrian speed choice and street crossing behaviour: A review. Transp. Rev. 2008, 28, 61–85. [Google Scholar] [CrossRef]
- Askarzadeh, A. A novel metaheuristic method for solving constrained engineering optimization problems: Crow search algorithm. Comput. Struct. 2016, 169, 1–12. [Google Scholar] [CrossRef]
- Tomassetti, G.; Barboni, R.; Benedetti, M. Optimisation methodology for cryotanks. Comput. Struct. 2005, 83, 2293–2305. [Google Scholar] [CrossRef]
- Goedtel, A.; da Silva, I.N.; Serni, P.J.A. Load torque identification in induction motor using neural networks technique. Electr. Power Syst. Res. 2007, 77, 35–45. [Google Scholar] [CrossRef]
- Islam, N.; Haider, M.; Uddin, M.B. Fuzzy logic enhanced speed control system of a VSI-fed three phase induction motor. In Proceedings of the 2nd International Conference on Electrical and Electronics Engineering, Rome, Italy, 22–23 July 2019; pp. 296–301. [Google Scholar]
- Ansari, A. The Basics of Fuzzy Logic: A Tutorial Review, Computer Education; Computer Education Group: Stafford, UK, 1998; Volume 88, pp. 5–9. [Google Scholar]
- Lu, B.; Habetler, T.G.; Harley, R.G. A survey of efficiency estimation methods for in-service induction motors. IEEE Trans. Ind. Appl. 2006, 42, 924–933. [Google Scholar]
- Demiroz, Y.I.; Onelcin, P.; Alver, Y. Illegal road crossing behavior of pedestrians at overpass locations: Factors affecting gap acceptance, crossing times and overpass use. Accid. Anal. Prev. 2015, 80, 220–228. [Google Scholar] [CrossRef] [PubMed]
- Saady, G.E.; Sharaf, A.M.; Makky, A.; Sherbiny, M.K.; Mohamed, G. A high performance induction motor drive system using fuzzy logic controller. In Proceedings of the 7th Mediterranean Electrotechnical Conference, Antalya, Turkey, 12–14 April 1994; Volume 3, pp. 1058–1061. [Google Scholar]
- Wu, B.; Yan, X.; Wang, Y.; Guedes Soares, C. Selection of maritime safety control options for NUC ships using a hybrid group decision-making approach. Saf. Sci. 2016, 88, 108–122. [Google Scholar] [CrossRef]
- Hsien-Chung, W. The optimality conditions for optimisation problems with fuzzy-values objective functions. J. Optim. 2008, 57, 473–489. [Google Scholar]
- Parkin, J.; Clark, B.; Clayton, W.; Ricci, M.; Parkhurst, G. Understanding Interactions between Autonomous Vehicles and Other Road Users: A Literature Review; University of the West of England: Bristol, UK, 2016. [Google Scholar]
- Saleh, W.; Grigorova, M. Pedestrian road crossing at uncontrolled mid-block locations: An investigation of impact of refuge islands on crossing behaviour (Submitted to Journal of Sustainability). 2020. [Google Scholar]
- Pedrycz, W. Why Triangular Membership Function, Fuzzy Sets and Systems; Elsevier: Amsterdam, The Netherlands, 1993; Volume 64, pp. 21–30. [Google Scholar]
© 2020 by the authors. Licensee MDPI, Basel, Switzerland. This article is an open access article distributed under the terms and conditions of the Creative Commons Attribution (CC BY) license (http://creativecommons.org/licenses/by/4.0/).


