Overview of Clean Automotive Thermal Propulsion Options for India to 2030


1
Department of Mechanical, Aerospace & Civil Engineering, Brunel University London, CAPF—Centre of Advanced Powertrain and Fuels, Uxbridge, London UB8 3PH, UK
2
Metapower Limited, Ducks Hill Road, Northwood HA6 2NP, UK
3
CMT-Motores Térmicos, Universitat Politècnica de València, Camino de Vera s/n, 46022 Valencia, Spain
*
Author to whom correspondence should be addressed.
Appl. Sci. 2020, 10(10), 3604; https://doi.org/10.3390/app10103604
Submission received: 9 March 2020
/
Revised: 9 April 2020
/
Accepted: 13 April 2020
/
Published: 22 May 2020
Abstract
:This paper presents the evaluation of near-future advanced internal combustion engine technologies to reach near zero-emission in vehicles with in the Indian market. Extensive research was carried out to propose the rationalise the most promising, new ICE technologies which can be implemented in the vehicles to reduce CO2 emissions until the year 2030. A total of six technologies were considered that could be implemented in the Indian market. An initial market survey was carried out on the Indian automotive industry and electric vehicles in India, followed by an in-depth analysis and understanding of each technology through literature review. The main aim of the paper was to construct methods for a successful implementation of clean ICE technologies in the near future and to, also, predict a percentage reduction of CO2 tailpipe emissions from the vehicles. To do this, different objectives were laid out with a view to reducing the tailpipe CO2 emissions. Especially with the recent and legitimate focus on climate change in the world, this study aims to provide practical solutions pathway for India. Widespread research was carried out on all six technologies proposed within the automotive market in India and a set of main graphs represent CO2 emission reduction starting from 2020 until 2030. A significant reduction of CO2 was observed in the graph plot at the end of the paper and the technologies were successfully implemented for the Indian market to curb tailpipe CO2 emissions. A methodology based on calculating the vehicle fuel consumption was implemented and a graph was plotted showing the reduction of CO2 emissions until 2030. The starting point of the graph is 2020, when BS-VI comes into effect in India (April 2020). The CO2 limit taken into consideration here has been defined by the Government at 113 CO2 g/km. The paper fulfilled the aim of predicting the effects of implementing the technologies and the subsequent reductions of CO2 emissions for India.
1. Introduction
This research was inspired by the current situation with the diesel and gasoline emission issues in the world and the subsequent proposed ban of the internal combustion engines in the automotive field. Internal Combustion Engines (ICE) are the main source of propulsion in any automotive on-road as well as off-road vehicle such as passenger cars, light-duty transport vehicles and heavy-duty transport vehicles. According to Serrano [1], it is impossible to replace the internal combustion engines as the powertrain for a majority of ground transportation vehicles in the short-to-medium terms, in spite of the growth of Electric Vehicles (EVs). As there is an increase in demand for vehicles with every passing year, the urgency to develop cleaner, more efficient ICE technologies with lower CO2 emissions is growing every year. There are many arguments in support of ICEs, as they are the principal source of propulsion for ground transportation vehicles across the world.
The arguments against ICEs based on mass media announcements such as “end of oil era with its old-fashioned ICEs” may be capturing attention, however, new regulations are being enforced for much cleaner internal combustion powertrains which has made them smaller and cleaner through the use of adequate after-treatment systems. The poorly justified proposed bans that are motivated by a bad diagnosis of the situation, could bring an adverse effect on the industry that may risk the jobs of highly qualified personnel, as well as a significant increase in CO2 emissions.
The people supporting the electric and battery vehicle concept are the ones who believe that electric cars do not pollute at all but the so-called “magic” of the EV concept is not true. Electric motors and batteries are not 100% clean and are not free of problems. Discussed below are the five key insights from the customer point of view:
- Recharging the batteries is unacceptably long for the people who drive the vehicle out of the city on daily basis. The technology has been developed for Formula E that the battery can be charged within an hour, however the costs for that technology are high.
- Energy density is excessively low for out of the city driving. The power consumption grows as the speed of the vehicle increases. Correspondingly, in the hilly areas when the car needs more torque for up-hill driving the consumption of power from the batteries is relatively high.
- The carbon nanostructures in the anode and cathode of the batteries hold the ions once through the electron exchange and again in electric-to-chemical transformation. These processes impact the carbonaceous structure of the material which leaves less space for ions to be held which further reduces the battery capacity, leading to inefficiency. It was published that, production of a set of batteries for a certain model of a Tesla car emits more CO2 than a gasoline engine for seven years.
- A proper recycling technology must be developed for the used batteries [2]. It is a big challenge and an expensive process that makes any method of recycling tonnes of batteries from electric cars inefficient.
- More batteries mean more supply of raw materials used to make batteries. This creates geopolitical issues and supply insecurities which results in tense challenges. Only few countries such as Chile, Argentina, Bolivia, Australia and China have the largest Lithium proved reserves.
The second problem is that we are not emphasizing the technology of information and communication which is increasing data management and transmission. A topic which is avoided by many people such as journalists and politics. If the general public needs to understand gravity and friction losses in transportation technologies, then they should also be expected to understand the restrictions of the second law of thermodynamics. The challenge here is that the electricity must be ‘produced’. An average 90% of electricity must be produced from non-renewable sources with about 20% of losses incurred through transmission from one place to another. The renewable resources are only around 10% of the world mix of the sources available today and we do not have any mid-term forecast of the figure rising significantly. Countries like the USA, Germany and China still largely rely on coal. The real alternative for mass CO2 reduction is, fundamentally, the nuclear electricity producing technologies as used by France to account for the majority of their energy needs. It is clear from the actual world resource mix and from well-to-wheel analyses, that in present times it is not possible to reduce global CO2 emissions from electric powertrain technologies. Especially if it is not considered to generate electricity from nuclear power. This will only truly be possible when nuclear fusion can become available in an economical manner to the countries, as a feasible alternative to generate electricity. Only then, will this second large problem be mitigated.
The upcoming laws and limitations in noise emissions, gaseous pollutants and greenhouse gases emissions will be more severe and will force OEMs and automotive industries to invest in more sophisticated technologies for the reduction in pollutant emissions. Real Driving Emission (RDE) regulations being adopted in major countries bring additional challenges to OEMs. This greatly widens the ICE operating range, at which pollutant emissions must be kept below the homologation limits. Hybrid turbocharger technology, supercharger technology, and hybridization of the powertrain are the new elements of the ICE environment that are dedicated to maximizing power from liquid fossil fuels.
Looking at the current scenario in India, the pollution is at its highest in Delhi NCR leading to smog and a culmination of different harmful respiratory diseases. Thus, Delhi became infamous for its drastic rise in air pollution levels as stated by the Society of Indian Automotive Manufacturers [3]. This attracted the attention of the government leading to a conscious decision of leapfrogging Bharat Stage norms of emissions. It was proposed in the road map [4], which predicted the implementation of BS-IV norms across the country by April 2017 in a stepwise manner and BS-VI in 2020. Since India implemented the emissions regulations only in 1991, a gap in the implementation of these norms can be observed in comparison with Europe. Nonetheless, this gap helped India to supersede in advanced technologies that aided the Indian automotive industry in meeting the regulations at an affordable price for the local population.
Moreover, the automotive and oil industries are advised to partner together and help evolve the fuel quality standards and automotive technology to meet air quality requirements. To reduce the discrepancies of the emission rate in India there are a number of technologies that can be implemented. This paper addresses a thorough research on the relevance of ICEs and how their implementation will considerably reduce emissions. Based on the present research to document and record the different technologies that can be implemented for clean/zero emissions, we arrived at the most promising, following six technologies:
- Carbon Capture and Storage
- Waste Heat Recovery
- Split Cycle Engine
- Advanced Boosting
- Advanced Combustion and
- Regenerative Braking
The paper presents the results of implementation of the advanced, clean ICE technologies to future passenger and commercial vehicles in India to reduce CO2 emissions to near zero, hence making the ICEs environment-friendly. The papers deals with “thermal propulsion systems” only (i.e., ICEs) and does not delve into battery electric vehicles as the sole alternative or in parallel with hybrid solutions that incorporate such thermal propulsive element. It is purely an exploration of the feasible technological progress of ICEs as part of future hybridised powertrain solutions for the Indian market. In addition, hydrogen and Compressed Natural Gas as well as as a range of synthetic and bio-fuels can open the way for ICEs to become true zero-emission capable. Due to project restrictions and expertise, the road to zero through the exploration of fuels has not been discussed but it is a subject of future investigation. It is for this reason that system and component level on the engine have been considered only whereby the system refers to the engine and by exception the vehicle to encompass regenerative braking as being among those technologies that have a true capacity to effect a substantial reduction in CO2 emissions.
The methodology followed four principal steps: (1) the implementation of advanced clean technologies in vehicles to reduce CO2 emissions; (2) analysis of the commercially available alternative fuels in India for better and relatively low carbon-emitting exhaust emissions; (3) By outlining a timeline for the possible advanced future clean ICE technologies listed above, that can be implemented until the year 2030 and (4) by prediction of the reduced automotive CO2 emissions until the year 2030 for the Indian market.
2. The Current and Future Technological State-of-the-Art
The paper focuses on the key points of the Indian market scenario and the on-going trends of India, including the emission norms and emission levels in the country.
Based on the current research and development on ICEs, the Wissenschaftliche Gesellschaft für Kraftfahrzeug- und Motorentechnik e.V. [5], has drawn up comments on the future of IC Engines and has assessed the diesel engine situations which articulates:
- Internal Combustion Engines were the main driving force behind mobility and will continue to be its future, especially in heavy-duty transport and in passenger transport. The role of ICEs cannot be replaced by electric drives but can be made more efficient with fewer emissions that can be complemented with advanced drive system technology.
- In the future, there will not be scope for conflict because of new technology that guarantees low emissions from internal combustion engines and lessens the pollution concentration in the air due to diesel and gasoline engine. The recent technology already ensures us of low emissions and the pollution limits can be met without exception.
- The specific advantage of the combustion engines is in its flexible and efficient use of fossil fuels with a high energy density that has excellent storage and distribution capabilities since they are in liquid forms. This basic property of the engines has enabled us to reinvent it more frequently, taking into consideration the integrated systems which enable lesser CO2 emissions compared to alternative technologies (EVs). The flexibility of non-fossil fuels and hence CO2 neutral fuels is the best guarantee for a long-lasting and sustainable technology for the future.
From the arguments stated above by WMK, it also supports the introduction of RDE regulations in Europe through EURO6d, which represents the best opportunity to help restore lost confidence in ICEs. With the implementation of RDE regulations and instalment of particulate filters, the pollution can be further reduced. NOx pollution is decreasing since the last decade throughout Germany and can be reduced in a similar way across the world. There can be the assurance of sustainability using renewable electrical energy for a successful energy turnaround and ICEs are preferably suited for supporting this development. Also, it is predicted that there is a long-lasting need for ICEs worldwide and mostly for diesel engines.
Serrano [1] questions, whether the ICEs can be emission free as well? Yes, it can be achieved using synthetic fuels coming from CO2 Capture and Use (CCU) or CO2 Capture and Storage (CCS) technology. There are several projects in Saudi Arabia, Canada, Switzerland and in Germany focused on CCU, which are transforming CO2 captured from the atmosphere and converting into the fuel called e-Diesel which is done by hydrogenation and the CO Fisher-Tropsch process. The projects of Carbon Capture and Storage where CO2 is captured from power plants and is stored in the oil wells to convert the oil into CO2 neutral oil. There are even projects where cars capture their own CO2 from the tailpipe emissions and convert on-board fuel into carbon-neutral fuel.
2.1. India’s Transport Growth Journey
As per the report on Transforming India’s Mobility by Niti Aayog and Boston Consulting Group [6], India’s population and wealth growth have led to significant strain to the transportation infrastructure. The country’s population since 1980 has nearly doubled and is set to become the world’s most densely inhabited country in the following decade. The Gross Domestic Product (GDP) per capita has risen by more than five times, with the maximum growth recorded in the year 2000. Based on the research upon the relationship concerning transportation, population and wealth, the transportation demand in India has grown almost eight times since 1980.
This growth is extraordinary and much higher compared to any other Asian economy. However, this large growth, in the absence of general public transportation, has led to a substantial increase to the sales of private vehicle owners in India. The collective numbers of registered motor vehicles have grown up from 5.4 million in 1981 to 210 million in 2015. Nevertheless, due to a lack of integrated mobility planning in the urban cities, it has resulted in the most polluted places in the country which is the key challenge that has to be addressed.
The pollution level in major cities is considerably higher than the permissible PM2.5 limits. According to the WHO database 14 out of 15 most polluted cities in terms of PM2.5 concentrations are in India [7]. The city of Kanpur being most polluted with 173 micrograms per cubic meter and Delhi being sixth most polluted with 143 micrograms per cubic meter as per the database of PM2.5 levels by WHO until the year 2016. These levels of pollution have risen the risk of breathing diseases such as heart disease, lung cancer and chronic bronchitis.
However, the pollution levels in India are not just because of transportation. As the carbon emissions accounted by transportation was 11% in the year 2014 of total carbon emissions and has decreased considerably from 24% since 1971 according to the World Bank database [8], thanks to the emission norms that were introduced in 1991 and that of the Bharat Stage Emission Standards introduced in India since 2001.
Use of Compressed Natural Gas (CNG) as fuel in India has been the biggest move to curb CO2 emissions. As discussed by Gandhi [9], India has the highest number of buses running on CNG in the world. In the city of Delhi most of the commercial vehicles are mandated to run on CNG which has helped to reduce particulate matter (PM) emissions. India has 11.5% of the total world natural gas vehicle population and is in third position behind China and Iran accounting for 23% and 17%, respectively. The country has an aspiring plan to expand its CNG footprint making it available during the third phase of bidding by the Petroleum and Natural Gas Regulatory Board (PNGRB), which would increase the penetration of Natural Gas Vehicles in the country significantly. The authors suggests that in the near term the Indian roadmap must focus on renewable biofuels such as Compressed Natural Gas (CNG), Liquified Natural Gas (LNG), Biogas, as much as it does on new ICE technologies and EVs.
Recently [10], India has given an assurance on coexistence of Internal Combustion Engine Vehicles with EVs and was welcomed by the Society of Indian Automobile Manufacturers (SIAM) with the statement that "the assurance, completely in-line with SIAM’s recommendations, that all relevant technologies should co-exist in the journey towards sustainable mobility." Therefore, at government decision levels it is seen that the country has a market large enough for these vehicular technologies to be implemented and the policy to guarantee the growth of ICE-based vehicles and EVs. As such there is no need to speculate about the growth of either of the two technologies, at least in the short term. A report on Indian Automobile Industry by a seconded European Standardisation expert in India [11] states that the viewpoint of the industry is strong especially with India being projected towards becoming the third largest automobile manufacturing country in 2030 after China and the USA. The industrial experts believe that India will be ahead of the European automotive manufacturing countries by the year 2030 and the USA by 2035. Nonetheless, the Indian automotive industry will also be facing tough challenges in implementing the use of greener and cleaner, more fuel-efficient technologies that are affordable to the normal public as well as developing good road infrastructure throughout the country. From the above, it may be understood that there is a huge scope for implementing advanced clean ICE technologies to curb the CO2 emission levels in India and this is discussed henceforth.
2.2. Indian Automotive Market Overview
The automotive sector in India features a huge variation of vehicles being manufactured throughout the country categorised as two-wheelers and passenger vehicles, commercial vehicles and three-wheelers. According to the report on automobiles by India Brand Equity Foundation [12], India had become the fourth largest automotive market in 2017 with sales increasing 9.5% to 4.02 million units in 2017 (excluding two-wheelers). The production rate increased by 6.96% CAGR in 2013–2019 with 30.92 million vehicles being manufactured throughout the country in 2019. Commercial vehicle manufacturing recorded the fastest growth rate in domestic sales at 17.5% followed by three-wheelers at 10.27% in the year 2019 as shown in Figure 1 and Figure 2 below. The domestic Indian market is dominated by two-wheelers and passenger vehicles (Figure 3).
There are around 54 companies in the country manufacturing, assembling and producing all the segments of the vehicles. The main automotive manufacturing dominated regions include Delhi, Kolkata, Maharashtra, Chennai and Karnataka.
Some of the factors listed below prove that the Government of India has a clear vision to make India an automotive manufacturing hub, including the following points:
- Improvements in road infrastructure.
- High activity in the infrastructure sector demanding a high number of commercial vehicles.
- Initiatives like ‘Make in India’, ‘Automotive Mission Plan 2026’ and NEMMP 2020 gives a big boost in the Indian Automotive sector.
- In 2018 automotive manufacturers invested USD 491 million in India’s automotive start-ups.
- National Automotive Testing and R&D Infrastructure Project (NATRiP) in India is setting up R&D centres at a total cost of USD 388 million enabling the industry to be competitive at a global level with a total of five testing and research centres being established in India since 2015.
- Department of Heavy Industries and Public Enterprises has worked on reducing the excise duties on smaller cars and has increased budget allocation in R&D which increased to 200% from 150% (locally) and 175% from 125% (outsourced).
- The Automotive Mission Plan 2026 initiated in the year 2016 targets a 4-fold growth in the automotive sector that includes automotive manufacturers, auto components and the tractor industry in the next ten years.
These are some of the key points that motivate the manufacturers to invest in the country and keep the market stable as the demand for vehicles increases with the increasing infrastructure and population of India.
2.3. The Electric Vehicle Market in India
The Government of India has set an ambitious target of having 100% of EV on the Indian roads by 2030 to curb the vehicular emissions [11]. It has been taking several measures to promote the implementation of EVs all over the country. In spite of the substantial marketing campaign, the current EV penetration is hardly 0.1% in private cars, 0.2% in two-wheelers and zero in commercial vehicles. There are numerous issues that India must address to meet the goal of 100% EVs on the Indian:
- Lack of adequate public charging stations for EVs.
- Scarcity of battery manufacturing raw material.
- Longer battery charging time.
- Lack of consumer awareness and price sensitivity.
According to the report on Emerging Trends and Technologies in the Automotive Sector [13], the EV industry accounts for less than 1% of total vehicle sales. The roads in India are dominated by the ICE vehicles having just under 0.4 million two-wheelers and a few thousand cars. The EV industry has been setback due to multiple challenges similar to those faced by the global EV industry. The cost of batteries and expensive cars have been a big obstacle for the customer, regarding EV adoption in India. There is a lack of low-cost EV charging infrastructure, which has slowed growth of EVs in India. Despite achieving savings from an electric car compared to the conventional vehicles, an EV owner cannot recover from the high cost of ownership within an acceptable payback period. A normal electric car in India costs approximately 0.5 to 0.6 million Indian Rupees which is more than double the cost of any basic conventional ICE vehicle. Additionally, battery life of an EV is problematic, and the replacement costs for a potential customer are approximately 0.3 million Indian Rupees, that adds to the cost of the ownership. In addition, in the current energy, concluded in [14], it was found that EVs emit more CO2 (289 g/km) compared to CNG (171 g/km) followed by Diesel (180 g/km) and Petrol (174 g/km) Vehicles.
Looking at the market scenario for India there is a big opportunity in R&D as well as in manufacturing and infrastructure development. There are possibilities to implement new EV technologies in the medium to long term and more immediately employable advanced clean ICE technologies. Advanced ICE technologies are discussed in the following section.
2.4. Advanced Internal Combustion Engine Solutions for Near Zero Emissions
2.4.1. Carbon Capture and Storage
Carbon Capture and Storage is the technology used in industry, whereupon carbon dioxide is captured and disposed at a collection site and later isolated from the atmosphere.
As stated by Bernstein et al [15], CCS is a technology encompassing the capture of CO2 either before or after the occurrence of the combustion phenomenon, transportation of CO2 to a disposal site and finally its disposal by a method that will permanently isolate it from the atmosphere. One of the best examples of this would be, where CO2 is extensively being used for enhanced oil recovery (since 1986) where 24 million tonnes of CO2 have been accumulated. The long-term usage of this technology delivers assurance that this technology is feasible. CCS is practiced at industrial level, however, the technology can be miniaturised in order to be installed in vehicles. In an on-going project by Aramco [16], the vehicles are equipped with CCS, where they were able to capture 10% CO2 initially and are aiming to capture 85–96% in coming years. As per the IPCC Special Report on Carbon Dioxide Capture and Storage [17] the currently available technology can capture about 85–95% of the CO2 processed in any capture plant. This is located in a power plant resulting in the reduction of CO2 emission to the atmosphere by 80–90% approximately compared to a plant without CCS. As said by Ajay Pal Singh [18], the report from Intergovernmental Panel on Climate Change (IPCC) also determined that carbon capture and storage can contribute approximately 15–55% of the aggregate emission reduction towards 2100. This will play a major role in curbing carbon dioxide by implementing several technologies to be implemented to address climate change.
CCS comprises of a chain of processes to capture CO2 having three main carbon capturing options such as Post-combustion CO2 capture, Pre-combustion CO2 capture and Oxyfuel combustion CO2 capture processes. Wherein in Post-combustion process the CO2 can be captured from the gas emitted after burning the fossil fuel or biogas (the latter) widely used in coal plants and now being proposed and tested in internal combustion engines. In Pre-combustion process the fossil fuel, biogas is reformed to separate the hydrogen and carbon dioxide before burning them. The fuel conversion steps are sophisticated and expensive the high concentration of CO2 in the gas with high pressure makes the separation easier. The pre-combustion process is being used in manufacturing fertilizers and in hydrogen production, as this process, in the end, produces hydrogen and CO2 from which CO2 is separated. In the Oxyfuel combustion process, highly pure oxygen is extracted from the air which demands higher energy requirements and is used in the combustion process of fossil fuel or biogas. This results in a higher concentration of CO2 in the emitting gas that makes it easier to separate CO2 from the emitting gases as shown in [19].
Post-combustion CO2 capturing is a more economically attractive process in comparison, which captures CO2 from the emission of flue gases. The tailpipe emissions from an ICE emit a significant amount of exhaust gases and heat dissipated from the engine. This heat can be reused in the process of CO2 extraction from the exhaust by the means of a CO2 capturing device [20]. This can be installed in a vehicle and CO2 can be captured alongside generating electricity from a Thermal Electric Generator (TEG) built inside the heat exchanger. The TEG in this heat exchanger uses the principle of a temperature difference to generate the electricity. The flow diagram for this system is shown in Figure 4, below.
The heat exchanger works on the principle of heat conduction, as the exhaust gas passes through the heat exchanger, heat is extracted from the exhaust gas to cool down the exhaust gas that exits the heat exchanger. The first TEG is arranged to be coupled thermally with the exhaust gas chamber to the CO2 absorber fluid chamber in a manner effective to heat the fluid by the exhaust gas. This releases CO2 from the fluid and generates electricity in response to a temperature difference between the exhaust gas chamber and the absorber fluid chamber. Due to the temperature difference between the engine coolant chamber and the CO2 absorbing fluid the heat exchanger may advantageously include a second TEG configured to thermally couple the engine coolant chamber to the absorber fluid chamber. In a manner effective to heat the CO2 absorbent fluid by heat from the engine coolant to further release CO2 gas from the CO2 absorbent fluid and generate electricity in response to a temperature difference. The system fitted in a car would need an electrical converter which can be used in converting the required electrical energy from the TEG in a suitable form of electric energy to be used for the electrical systems in the vehicle, for example vehicle electronics or electric-assisted boosting systems. A basic version of this heat exchanger can be configured, wherein only CO2 can be captured from the exhaust gases and the facility of electricity generation is not required in this device [21].
Carbon Capture and Storage in India: Carbon Capture and Storage technology is still under development in India and there are in total three plants [22], that have implemented CCS to curb CO2 emissions which are urea producing plants [23]:
- Anola Urea Plant
- Jagdishpur- India Urea Plant
- Phulpur Urea Plant
These plants have CO2 absorption capacity of 450, 150 and 450 Tonnes per day, respectively, and they use post-combustion technology to capture CO2.
CCS in vehicles could be a revolutionary step for India towards curbing CO2 tail pipe emissions. As per the article “India Seeking Ways to Limit Climate Change after IPCC Report” [24], the experts at a climate change meeting accepted the implementation of CCS in India. If there were no new technologies to help reduce emissions significantly, they think CCS is still commercially unviable and a very challenging technology. Being a developing country there are numerous ways that the new technologies can be implemented to overcome the emissions.
However, India has good CCS opportunities as expressed by Kapila and Haszeldine [25] in that CCS can be implemented in the fertilizer producing plants where there is a shortage of CO2 as they tend to use all of the CO2 which is generated from ammonia producing urea plants. It has been observed that additional CO2 generating units were built to supply urea production. Secondly, the Government of India already has a plan for Enhanced Oil Recovery (EOR) offshore and onshore, where a facility at Hazira port, Gujarat is developed for EOR onshore site 70 km away and is estimated that 1200 tonnes of CO2 would be transported to this oil field on a day-to-day basis, which would maintain the pressure in the oil field. Implementing CCS in the Coal and Power sector, carbon saving could start with efficient generation technologies and it would, also, be possible to design new generation power plants in India such as Ultra Mega Power Projects (UMPPs) to be “carbon capture ready” empowering a future retrofit of CCS.
Exporting CO2 for foreign EOR activities could be a big business for the country, where the captured CO2 from vehicles and large industries can be transported to the neighbouring gulf countries from the planned UMPP projects situated on the coasts of India. Nations such as Qatar are major gas producers as they have established a huge LPG tanker traffic, these tankers maybe converted to take return loads of CO2 to be injected in the oil fields.
2.4.2. Waste Heat Recovery
Waste heat recovery is being investigated in the automotive industry to increase the efficiency of ICEs, as well as to reduce CO2 emissions by converting the thermal energy to electrical energy by using either thermal fluid systems via Organic Rankine Cycle (ORC) or Thermoelectric Generators (TEG). Avaritsioti [26] observed that the conversion of 20% of exhaust waste heat into electricity might increase fuel efficiency up to 10%. It was then showcased that the use of exhaust heat recovery by replacing the conventional alternator was a cost-effective way to reduce the greenhouse gases in the heavy-duty vehicles.
As observed in a Sankey’s energy flow diagram barely 25% of the fuel energy is used in the vehicle operation and the remaining 75% of energy is dissipated to the atmosphere. The other half is rejected by the coolant, lubrication and by the means of the charge-air heat exchangers [27]. It is also notable that even though it had been said that approximately 2/3 of the fuel energy is transformed into the waste heat, almost all this emitted thermal energy is an outcome of the limitation of the thermodynamic cycle of an engine. And hence, as a result, it is not feasible to reclaim all the thermal energy for the useful work without the laws of thermodynamics being violated. Some of the WHR options are discussed below.
Electric Turbocompounding: As the name suggests this technology helps in generating electricity from the energy extracted from the residual kinetic energy of the exhaust gases downstream the turbocharger typically in Diesel engines, by coupling an electric generator to a turbine. An additional electricity-generating turbine is installed downstream of the main turbocharger turbine as suggested by [27], however, due to low pressure gas at the end of the exhaust, the second (power) turbine has to recover relatively efficiently at low-pressure. Therefore, the residual amount of pressure is used to generate electricity. The power turbine then generates electricity to be used by the vehicle components or to be stored directly to the battery of the vehicle.
The electric turbo-compounding technology exhibited results of fuel economy gains between 3–10% depending upon the application. This system is typically installed on heavy duty diesel engines although increasingly electrified powertrains of any size can use this technology.
Thermo Electric Generators: As discussed earlier TEGs were used to generate the electricity required in vehicle components by the means of temperature difference. The technology can be implemented for Waste Heat Recovery systems where the generators convert exhaust heat energy directly to electric energy using the Seebeck principle in electronics in which electricity is generated between two semiconductors because of temperature difference. As suggested by [28], the implementation of TEGs in ICEs shows good results in reducing fuel consumption. However, this technology is still under research and development and is expensive compared to other technologies. The research in this technology so far has yielded up to 2% of the fuel efficiency improvement.
In a very special case of a hybridised boosted optimised system with turbo-compounding (HyBoost project [27]), a 1.0 L, four-cylinder downsized direct-injection gasoline engine was developed to deliver 116 kW and 240 Nm, offering 35% reduction in fuel consumption and CO2 emissions. The system was able to reduce carbon emissions from 169 g/km to 99.7 g/km on the new European Driving Cycle matching the 2.0 L engine performance, i.e., 50% downsizing was demonstrated. It was equipped with an electric supercharger for transient lag mitigation, electric turbocompound, efficient liquid charged air cooler and advanced knock mitigation technologies.
2.4.3. Split Cycle Engines
Split cycle engines separate the intake-compression and power-exhaust strokes, physically, by employing two separate chambers which are in communication. The technology claims very low NOx levels and carbon reduction of up to 15–17% [29]. Water can be used by injection into the compression cylinder as well as other versions that use Liquid Nitrogen with the technology claiming near zero-emission levels (for an ultimate zero emissions vehicle - ZEV) [29].
Another project claims an increase in engine efficiency from 48% to 53% [30]. Peak efficiencies of up to 60% using conventional fuels have also been reported [31] through accurate control of temperature at the start of the combustion being attained through separating the compression and expansion process and air-preheating. High efficiency is attained by reducing compression work with isothermal compression and intracycle waste heat recovery. Through this technology, very low emissions can be achieved by the reaction of the fuel in the dilute mixture at lower temperatures. Immediate cooling of the charge air for the combustion process to attain isothermal compression is the key factor to enable intra-cycle waste heat recovery and overall high efficiency of the cycle. This engine system uses a variant of the recuperated Brayton cycle having two main differences which are: (1) the process of compression is near isothermal and (2) reciprocating compressors and expanders are used instead of turbines which are commonly used in gas turbines. Intrinsically, the combustion process is irregular, allowing higher combustion temperatures to be sustained within material limits which caps the potential efficiency of the gas turbines. The isothermal process can be achieved in different ways such as multi-stage compression with intercooling, adding non-evaporating heat transfer fluid such as water in the compression stroke and addition of Liquid Nitrogen during compression cylinder in the compression stroke cycle [31]. It would be beneficial to introduce liquid nitrogen during this stage, as nitrogen will act as a diluent in the combustion chamber and will help in reducing the NOx emissions from the engine.
Several other types of split cycles engine exist with offering the potential in their optimised versions of achieving eventually, well above 60%, with power densities challenging or even exceeding in some cases those of electric motor drives in Electric Vehicles (e.g., the concentric rotary engine, SARM). The carbon emissions can be reduced significantly by this technology, wherein the alternative fuels such as biofuel, e-fuel, biogas, hydrogen or hythane appear to be compatible with its combustion process [32].
2.4.4. Advanced Boosting
Several boosting solutions have been developed over the last decade. One notable such technology is the electrically-assisted turbocharger [33], where a device based on variable turbine geometry turbocharger can be coupled with a Switched Reluctance (SR) electrical machine. This was accommodated in the bearing housing of the turbocharger and coupled with the turbocharger shaft. Such devices are well known as hybrid turbochargers. This device was evaluated based on transient and steady-state engine conditions with the turbocharger providing electric assist/electric generation, of which the response matched a stock 2-stage turbocharger on the same engine. Electric modification of the turbocharger can be applied to both fixed geometry or variable geometry turbines. The SR motor was designed to provide a peak power in excess of 5kW equally in motoring or generating the electricity. The stator in this device was cooled with engine coolant and not oil cooled that allowed greater output while maintaining temperatures not beyond the limit of winding material withstanding temperature.
In a similar case an electric turbocharger was tested in the project ‘Hybrid Petrol advance Combustion Engine’ (HyPACE) [34], where efforts were made to develop an engine with advanced electric boosting (e-boosting). These efforts are made to meet the CO2 emissions that need to be realized by 2025 to meet the requirements whilst at the same time satisfying the stricter forthcoming Euro7 emissions regulations. Real Driving Emissions (RDE) have been adopted in Europe since September 2017. This was mandated to make a correlation of emissions between the real driving conditions and the ones achieved under the controlled laboratory test conditions mandated to that point in time. In order to meet future CO2 requirements, it is required that the engines get improved technology with electric hybridisation in combination with additional measures and changes to the vehicle. The turbocharger used in this engine was a BorgWarner 48V eTurbo. This hybrid turbocharger improves boost response while allowing pre-turbine pressures at peak power and exhaust energy recovery with the turbocharger mounted on the integrated exhaust manifold. The eTurbo has a permanent magnet electric machine coupled with the turbine shaft in the turbocharger and is located inside the bearing housing as described earlier. This system of the hybrid turbocharger has two modes of operations (1) Electrical assist and (2) Electrical Regeneration modes. These can be used to recover the waste energy of the exhaust by generating electricity from the excess turbine power available. A 48V battery supplies the electricity to this turbocharger as well as to store the electricity when generated. The use of this hybrid turbocharger gives us the freedom to match the turbine size which enables a big sized turbine selection for ideal efficiency at high speed and load. This successively benefits a reduced rate of over-fuelling and improves the operation area achieved at stoichiometric air-fuel mixtures. The negative effects are usually linked to an oversized turbine in terms of reduced transient response and run-up line performance, which can be balanced using electrical assistance. This eTurbo has a built-in variable geometry turbine mechanism which has various advantages when compared with the conventional turbocharger. This turbocharger was claimed to be having a potential of maximum fuel saving of between 2 to 3%. As described by the authors [35], one of the main advantages of a VGT is that the area to radius ratio can be rapidly varied to obtain ideal turbine efficiency over the range of engine operation. E-turbos have been successfully introduced into production in the last few years.
2.4.5. Advanced Combustion
When compared to the other engine types the Diesel engines are the most efficient due to their higher compression ratios and overall fuel-lean combustion, which provides low carbon monoxide and hydrocarbon emissions when compared to gasoline engines. The main focus is on reducing nitrous oxides and particulate matter emissions because of high temperatures and fuel-rich regions respectively, as discussed in [36]. Four general methods are extensively being developed to satisfy emission standards and to overcome the NOx and PM emissions i.e., improvement of the combustion process, usage of alternative fuels, introduction of advanced combustion concepts and exhaust after-treatment devices. From the diesel combustion perspective, to reduce NOx and PM emissions, high temperature stoichiometric and fuel-rich regions should be averted, concurrently. Consequently, one of the most effective approaches is Low Temperature Combustion (LTC) which shows improvement in fuel atomization, lower equivalence ratios and decreased combustion temperature which decreases NOx and PM emissions instantaneously. This maintains high thermal efficiency complying with the emission standards and increasing in fuel demands.
Low Temperature Combustion: The concept of LTC reduces the flame temperature and permits adequate homogenous air-fuel mixture, leading to a simultaneous reduction of PM, NOx and smoke emissions [37]. As claimed by the [38], LTC was able to attain a very low NOx emission (<35 ppm) by using exhaust gas recirculation and PM (<0.05) by means of advanced fuel injection timing. Hence the technology has become a very popular research topic. LTC is an advanced combustion technology that is achieved by early fuel injection in the combustion chamber that improves the air-fuel mixing before the start of combustion inside the cylinder. By injecting the fuel nearer to the top dead centre (TDC) with EGR controlled combustion, dual fuel injection, the resultant air-fuel mixing avoids fuel-rich regions that lower the temperature below 2100K, which in turn reduces NOx and PM emissions. This type of combustion increases the engine efficiency and reduces emissions.
LTC is achieved through a variety of methods such as Homogenous Charge Compression Ignition (HCCI), Premixed Charge Compression Ignition (PCCI), Partially Premixed Combustion (PCC), Reactivity Controlled Compression Ignition (RCCI), Gasoline Compression Ignition (GCI), High Efficiency Clean Combustion (HECC) and Spark Assisted Compression Ignition (SACI). However, we will be briefly looking into HCCI and PCCI methods in this literature. Currently, numerous researchers are concentrating on reducing the use of conventional fuel, forming new alternative fuels and reformulating the fuels to reduce emissions such as a project on the effects of bio-diesel and binary blends in a turbocharged diesel engine [39].
Homogeneous Charge Compression Ignition (HCCI): The HCCI method was developed in 1979 using a gasoline engine to increase the combustion process stability for a 2-stroke engine. In HCCI a well premixed fuel-air mixture gets ignited at the end of the compression stroke devoid of any spark assistance. In this process, the combustion occurs at multiple places because of auto-ignition of the mixture which achieves its chemical initiation energy. Due to compression pressure and hot temperatures in the cylinder, the mixture ignites at different hot-spots inside the cylinder resulting in auto-ignition of the air-fuel mixture. This process reduces high flame fronts and maintains the in-cylinder temperatures at lower levels. In a study of HCCI and low temperature combustion with the aid of optics [40], it was demonstrated that near-zero NOx emissions were feasible due to low combustion temperature and high EGR attenuation. The overall homogenous lean air-fuel mixture also tends in avoiding the soot formation in emissions. Therefore, in HCCI engine technology the air-fuel mixture ignition is controlled by its composition and the in-cylinder temperatures. However, to attain homogenous mixture, several methods such as high fuel injection pressure with small nozzle holes, high boost pressure, and higher swirl ratios are used to increase the homogeneous mixture properties of the air-fuel mixture injected in the combustion chamber.
Premixed Charge Combustion Ignition (PCCI): PCCI was developed from HCCI due to the latter’s limiting operating range, high rise in pressure and inability of controlling the combustion parameters such as SOC [36]. This depends on several factors such as fuel auto-ignition qualities, fuel mixture homogenous characteristics, in-cylinder temperature and pressures etc. These challenges motivated the researchers to develop PCCI. This method is capable of reducing NOx and soot emissions simultaneously with improved engine efficiency. It was observed by the authors that there was 31% reduction in CO2 emissions with an increase in 14% of BSFC with the aid of diesel and ethanol-blended composition of the fuel. As per the authors in a review paper based on LTC for Bharat Stage VI standards [41], fuel mixing time is an important building block in low emission policy. As the mixing is increased there are lower possibilities of the formation of PM, HC, CO and NOx due to the increase in engine efficiency. The PCCI method of combustion has a requirement to obtain premixed charge before the start of combustion, achieved by ignition delay before SOC of high-temperature reactions. Some of the ignition delay methods are as discussed in HCCI, however, use of low cetane fuel with low compression ratio can also aid towards delaying in the ignition. The key in achieving successful implementation to PCCI lies in harmonizing the mixing and chemistry times, where prolonging the mixing time improves particulate matter emissions, for example. The time of mixing must be extended so that the ignition cannot occur before the desired level of mixing. Therefore, if the mixing rates can be increased by utilizing mixing related design constraints such as spray targeting techniques, swirl geometry, the necessary mixing timing and ignition delay can be reduced as a consequence of gaining control over the phase of combustion. In the case of PCCI, there are typically two types of injection strategies, that are adopted depending on when the fuel injection occurs relative to TDC [42].
2.4.6. Regenerative Braking
This technology was invented back in 1886 to convert kinetic energy into electric energy and store it in batteries or super-capacitors. The modern form of regenerative braking such as the Kinetic Energy Recovery System (KERS) uses the same principle to capture the kinetic energy from braking. KERS is being widely researched and implemented in hybrid and electric powertrain vehicles. It is successfully implemented in F1 and LMP1-H hybrid cars.
A new concept developed, known as electric KERS can store energy and provide it back to other systems by being connected to traction batteries or other electronics such as an electric turbocharger or an electric pump in the engine [43]. The technology of KERS was introduced in Formula 1 during the 2011 season and was mandated by the FIA in all the cars [44]. As per [43], most of the F1 and LMP1 hybrid-powertrain car companies such as Toyota and Porsche have shown a deep interest in harvesting the energy in every way possible.
Vehicles implementing this type of technology are more fuel-efficient and the fuel consumption reduction can reach 30–50% by a regenerative braking technology in any hybrid electric vehicle [45]. The technology is integrated with the powertrain of hybrid and electric cars such as Toyota Prius and Nissan Leaf. In passenger vehicles, there are very low decelerations and implementing KERS does not put any constraint on driving style. KERS has been integrated with petrol-powered engines in large-sized sedans to provide improvements in fuel economy of about 20–25% and improvements in fuel consumption may be achieved by coupling KERS in smaller diesel turbocharged engines [46]. The author stated that the results of the car fuel economy on the New European Driving Cycle validated vehicle model with a 1.6 L turbocharged direction injection engine which would normally require 0.0.35 kg of fuel to cover full cycle (4.7 L/100 km in urban sector cycle and 3.8 L/100 km in full cycle), required 3.5 L/100 km (0.12 kg) of fuel to cover the urban cycle and 3.2 L/100 km (0.29 kg) of fuel to cover full cycle, improving fuel efficiency by 25% and 17%, respectively. Therefore, it was concluded that KERS implemented with the high-speed flywheel with a CVT concept permits efficient regenerative braking and torque through considerable improvements in fuel efficiency, consequently reducing fuel consumption and CO2 emissions. Clark et al [47] suggests a fuel efficiency improvement of 29.4% in the rural driving cycle and 51.7% in urban conditions by implementing regenerative braking technology.
For road commercial heavy goods vehicles, claimed reduction of fuel consumption and CO2 by 15–25% have been published [48]. A case in India where regenerative braking is being implemented at the Delhi metro, which became the first rail project in the world to receive 0.4 million tonnes of carbon credits for the consecutive period of ten years from 2007 to 2017. By implementing regenerative braking in locomotives, the Delhi Metro was able to lower its energy usage by approximately 30% [49].
2.5. Alternative Fuels in India
Alternative fuels have increased their share in the overall fuel mix as a strategy in reducing the emissions from the automotive sector [50]. An increase in the number of CNG cars in India has been observed from 23,000 cars in 2001 to 44,000 cars in 2011. However, Delhi NCR had the highest share of CNG cars i.e. 64% followed by Gujarat 18% and Maharashtra 18%. As the national Biofuels policy declared in June 2018, the aim is to increase the use of biofuels in the transport and energy sectors of the country. This policy also aims to develop next generation biofuel conversion technologies. Presently, 2% of ethanol is blended in petrol and 0.1% of biodiesel is blended in the diesel, however by the year 2030 the policy aims to blend 20% of ethanol in petrol and 5% of biodiesel in diesel respectively.
Additionally, a report on India’s vehicle emissions control program [51] states that Delhi has been at the lead in implementing CNG heavy-duty vehicles in India. The city formed the world’s largest fleet of CNG powered vehicles when the number of private vehicles went up to all-time high, resulting in a substantial deterioration of air quality and serious public health concerns. In March 2001 an order was issued by the Supreme Court of India which required the entire bus fleet of Delhi to convert from diesel to CNG. Following Delhi’s leadership, major cities of India such as Agra, Mumbai, Pune, Kanpur, Lucknow, Indore, Ujjain converted their bus fleet into CNG to curb the emissions. Some of the advantages of natural gas in vehicles are as follows:
- (i)
- Significant reduction in PM and NOx in CNG powered LDV and HDV compared to conventional-fuel vehicles, no black smoke emission.
- (ii)
- 20% reduction of life cycle GHG when compared with conventional fuel vehicles.
- (iii)
- Cheaper compared to conventional fuels.
- (iv)
- Advanced CNG technologies installed with efficient after-treatment devices will comply with Euro VI norms worldwide.
In India, Natural Gas Vehicles will be a cost-effective way to regulate automotive emissions as low-sulphur fuels are not available in India. Moreover, India has good natural gas reserves compared to petroleum reserves, although the country imports both. Biofuels also refer to the fossil fuel additives and or alternative fuels that are produced from biological sources such as sugarcane which is used in producing ethanol and biodiesel from waste oil, animal fats. The advantages of biofuels include the displacement of conventional fuels and the fact that they can be produced from some of the renewable resources with low-carbon raw materials which in turn can reduce GHG emissions.
In India, alternative fuels are an attractive solution, since companies are already developing dual fuel hydrogen vehicle technology sponsored by the Ministry of New and Renewable Energy (MNRE) [52]. In addition, MNRE is promoting the use of Biogas with numerous benefits such as governmental financial help and concessions in import and excise duty for ten years. The Petroleum and Natural Gas Regulatory Board has been promoting a setup for the natural gas distribution infrastructure in different cities with small scale enterprises alongside numerous benefits to CNG companies. India in this way, has been in favour of producing and promoting alternative fuels in controlling the emissions to address climate change in recent years.
3. Methodology
The methodology implemented to carry out this investigation was based on the research of available and under-development, advanced ICE technologies to reduce CO2 emissions and on the calculation of the reduction in CO2 emissions. It, also, involved researching emission norms in India, diesel fuel specifications and calculating the emissions based on the fuel consumption by implementing various technologies as shown in Figure 5.
3.1. CO2 Reduction Values
Once CO2 reduction limits were obtained from literature, a calculation algorithm was implemented to plot the reduction of emissions obtained by implementing each proposed technology. The reduction in CO2 was then compared with vehicle data available through this literature review.
The percentage CO2 reductions in emissions were calculated by the amount of fuel consumed by the vehicle when a particular technology was being implemented within the vehicle. As suggested in the IPCC report [15] the CCS technology if implemented successfully can capture 85–95% of CO2 from the exhaust gases. However, as suggested by [16] currently it is able to capture 40% of CO2 from the exhaust gases of the vehicle and was aiming for 50% in the future. However, a range of 7–10% reduction in CO2 was considered for the calculations for the emission reductions. As the technology is under development and in India there have been no applications of CCS in vehicles as yet. It may take more time to implement this technology, in the country and, therefore, it was assumed to be implemented by the year 2028 following a normal development cycle.
As claimed by [53] a 10% improvement in fuel efficiency can be expected by ORCs in the short term and the same for TEG in the 2025–2030 timeframe. However, as suggested by [27], the use of electric turbocompounding can result in 3–10% of fuel savings, therefore it was considered that a 10% maximum and 7% minimum reduction in fuel consumption from the referenced vehicle and the CO2 reductions were calculated based upon those calculations. The waste heat recovery technology is more developed than most technologies, and hence further improvements in the technology would not consume much time and therefore has been proposed to be implemented in the year 2024.
Novel concept of split cycle engines have the potential of reducing CO2 emissions up to 25% [29]. Versions of the technology using pure water in the compression chamber (ThermoPower) and cryogenic liquid nitrogen technology in the compression chamber (CryoPower) in the same engine can result in very low NOx emissions. The values of carbon reduction are 18–24% for CryoPower and 15–20% for ThermoPower achieved in combination with a recuperated Brayton cycle. The split cycle engine technology is still under development and, therefore, the carbon reductions are expected from this technology to start by 2028 in India. Values considered were a 15% maximum and 5% minimum for the calculations of the emissions prediction.
A project on electric turbocharger for advanced boosting was carried out with an aim to reduce CO2 emissions and to reduce fuel consumption on small-sized passenger cars [54]. It was observed that a significant amount of CO2 reduction was achieved, and fuel-saving was achieved up to 4.6% for the NEDC. However, when tested according to the FHDS a drastic change was observed with 118 CO2 g/km that accounts for 22.29 km/L that is 4.4 L/100 km resulting in 6% of carbon reduction. The values for the FHDS cycle were considered for the calculations and were implemented in plotting the emission graph. The technology is already being implemented in engines and therefore is being proposed to be implemented by the year 2020.
Many projects are being carried out in India for different fuel blends in engines to reduce CO2 emissions. One such project uses advanced combustion, a method to reduce the emissions with different fuel blends during combustion and new combustion techniques being implemented for higher efficiency of engines. As seen earlier HCCI and PCCI techniques of combustion, that aid in CO2 reductions of up to 31% was achieved with the diesel-ethanol fuel blend in PCCI combustion system as suggested by [35]. It is one of the most important options of the Indian government for implementing alternative fuels to curb emissions. The technology is already in development in India and the percentages considered for the emission predictions in this project were 10% maximum and 6% minimum. As PCCI technology has already been tested in India, a prediction can be made that the technology may be implemented on Indian vehicles by 2026.
Regenerative braking is nowadays one of the most efficient technologies being implemented in sports such as F1 and LMP1 race cars. However, when applied to the normal vehicles it is, also, an efficient way to reduce fuel consumption. As claimed by [45], 25% fuel savings can be obtained through KERS while other were able to reduce CO2 emissions from 140 g/km to 108.4 g/km [46]. However, looking at the Indian scenario for the implementation of the technology, we need to take into consideration various factors like the conditions of the roads and weather. Despite these factors, a public adaptation of the technology in the next 10 years can reduce the emissions by 14%. Figures of 10% max and 4% min were considered for the calculations. The technology is already being implemented in some production vehicles such as Toyota Prius and Nissan Leaf. The technology can be implemented in the Indian vehicles in the year 2022.
3.2. CO2 Calculation Methodology
In some of the technologies, the percentage CO2 reduction was already available and was implemented in calculating the reduction of CO2. The reference CO2 g/km limit was considered as 113 CO2 g/km as implemented in the Bharat Stage VI standards from the year 2020 as per the report on LDV Fuel Economy Standards [55]. The reference vehicle data considered in calculating the emissions by implementing the technologies are shown in Table 1 below. The diesel fuel density was considered as 0.84 kg/L (840 kg/m3), however as suggested by [56], the diesel fuel specifications for emission norm BS VI allows for 820–860 kg/m3, therefore 0.84 kg/L was considered for the calculations.
The carbon emissions from the vehicle were calculated by following the steps [57] outlined below:
- Step 1: Calculating weight of carbon present per litre of fuel
A (g) × B (%) = C (g)
- Step 2: Calculating CO2 emitted by combusting per litre of fuel
D (g) + C (g) = E (g)
- Step 3: Calculating CO2 emissions from the average fuel consumption.
where,
- A = weight of 1 L diesel (g)
- B = carbon in diesel (%)
- C = weight carbon per litre (g)
- D = weight of O2 needed to combust carbon (g)
- E = weight CO2 per litre (g)
- F = Fuel consumption (L/100 km)
- G = CO2 emissions (CO2 g/km)
The calculations of CO2 reduction based on fuel consumption carried out for waste heat recovery, advanced boosting and regenerative braking were carried out on the basis of fuel consumption, whereas split cycle engine, carbon capture, and storage, and advanced combustion technologies carbon reduction was calculated on the basis of the carbon reduction percent available through published research data. The calculations for each technology on the basis of fuel consumption is given below in Table 2.
The calculations of CO2 reduction for every technology based on the percentage of CO2 reduction are as given in Table 3. The percentage reduction from each technology with corresponding minima and maxima were considered in order to plot the CO2 reduction graph. However, the technologies were considered upon the advancement of each technology in the country or the technology improvement in the current scenario.
The CO2 reduction graph plotted in the Results chapter was plotted with the historical diesel emissions limits of India [58], initially and then the emission predictions were plotted in the graph there onwards until 2030.
4. Results
The carbon emissions were calculated for every year until 2030 starting from 2020, the year of implementation of BS VI by the Indian Government. The limit decided by the government is 113 CO2 g/km, as already mentioned. The calculations for each technology until 2030 are as shown in Table 4, Table 5, Table 6, Table 7, Table 8 and Table 9 below:
The historic emission graph that shows the emissions produced due to transport vehicles in India, went down from 24% to 11% since 1971 to 2014. This drop is depicted in the graph below inspired by [59]. However, the emissions in India has increased but the graph plotted shows that the CO2 emissions in transportation have gone down by 13% in the span of 44 years. The graph for transportation emissions that is plotted consists of total transport emissions including Automotive, Railway, Aerospace, et al.
The graph shown in Figure 6 was plotted based on the CO2 emissions that are reducing since 1971 for the transport sector. This consists of total transport emissions including domestic aerospace, domestic railway, domestic road and navigation and not by automotive CO2 g/km consumption standards. It is a cumulative graph representing % CO2 emission decrease until the year 2014. It was illustrated to show that the emissions due to transport have decreased. The total Indian CO2 emissions have increased due to the factors such as electricity and heat production, manufacturing industries, construction and emissions in the sectors like commercial, residential and public services.
The values plotted on the graph are for the diesel emissions limits for India starting from 2007 to 2020. The calculated reduction of predicted emissions was plotted until the year 2030 and are illustrated in Figure 7.
Thorough research was done for the technologies to be implemented for the CO2 emission reduction from the vehicles which was inspired by [1]. The emissions plots were then calculated based upon the research and the vehicle efficiency values obtained from the research. The requirements of the objectives were fulfilled by calculating CO2 emission reduction percentages from each technology and was deducted from the BS VI limit that is going to be implemented from the year 2020. The proposed six technologies were plotted in the emission reduction graph along with the historical emission graph of India.
The research was conducted for each technology and studied in the context of the advancement of the technology in the current scenario of the automotive market. However, many challenges were faced while gathering the data and analysing each technology and understanding which technology can be implemented where and in which timeframe. As there are significant local capacity for R&D in India the proposed technologies are certainly of local developmental interest, not just an import opportunity to solve an environmental and health issue. However, by implementing the advanced technologies vehicle pricing will fluctuate as this advancement is still at a nascent stage in the country. Some technologies such as advanced boosting are being implemented in vehicles in the current market state, however, there is a need for implementing the rest of the technologies to curb the emissions until 2030 while the EV market is still at an early stage build-up particularly from an infrastructure point of view.
The results in Figure 7 were calculated and plotted progressively until 2030. The results look promising and resulted in the CO2 emissions roadmap for India until 2030 as shown above in Figure 8. Figure 9 depicts the limit of BS VI, to be implemented in 2020 as 113 g/km and hence the predictions of CO2 reductions can also be considered for the future BS VII norms in India, which has not yet been formulated. The BS VII regulations will be far more challenging than the current value of 113 g/km, however, no relevant data have been released from any consultation for a possible BS VII CO2 limits and hence the reductions achieved in this project can be suggested for the future reductions in the regulations to be laid in India. Corresponding reduction as indicated in Figure 7 are substantial and in-line or more challenging than the rate of reduction in recent Euro standards for example. As shown in the graph the future CO2 limit of 60 g/km for 2030 in the EU certainly within grasp unless the minimum scenario prevails comprehensively in which case at worst-case scenario it the Indian target will miss this target by 10%. In addition, there is no confirmation that the Indian BS VII will feature a similar standard, although it is safe to assume that it will probably be similarly strict, considering the jump in Indian emissions norms in order to mitigate the urgent urban pollution situation.
In Figure 8, starting from advanced boosting till carbon capture and storage, from popular to least popular technology, were proposed for implementation in India. The most promising technologies were regenerative braking, split cycle engine, advanced combustion, and carbon capture and storage having high percentages in reducing carbon emissions from the vehicles. However, the actual percentages of the technologies were not considered in reducing the emissions in a decade from 2020–2030 as they are not yet implemented in the Indian vehicles.
In the immediate future, if implemented appropriately, the technologies would be very beneficial in curbing CO2 emissions from the vehicles. As suggested by [16] CCS was able to reduce 40% of CO2 emissions from the test vehicle in 2018 and has proposed up to 50% reductions in the near future. Regenerative braking promises up to 25–50% carbon emission reduction as suggested by [46] and [47]. An emission reduction of 31% is suggested by [36] through PCCI method of combustion technology and 7.5–24% of carbon reductions in Split Cycle Engine Technology including CryoPower and ThermoPower as suggested by [29]. However, the percentages are quite high and optimistic to be considered for a conjectured implementation from 2020 to 2030 in the context of India. Therefore, this research has applied development coefficients, based on a thorough investigation of the ICE market. Factors such as climatic conditions and road conditions were also considered while calculating the reduction of emissions, besides the percentage while calculating the reduction of CO2 in India specifically, until 2030.
Regenerative braking, advanced boosting, and WHR were implemented in the first half of the decade as these technologies are already being implemented to some degree, in India. Advanced combustion, split cycle engine along with carbon capture and storage were proposed to be broadly implemented in the second half of the decade, since these technologies need extensive research before being put into production.
5. Conclusions
This research was carried out with the aim of implementing the most feasible advanced technology options for vehicles in the Indian market, without focussing specifically on fuels even though these are inevitably partially covered in the discussion. The target was to offer near-zero CO2 emissions, hence making the ICE both environment-friendly while allowing for the sustenance of the automotive industry and market until the advent of EVs as a major player in the local market. As a consequence of the extensive literature analysis, calculations and understanding on the subject, this research has resulted with the findings that the CO2 emissions, through the application of six selected advanced internal combustion engine technologies can be reduced up to 60% in MAX and 30% in MIN case from a baseline BS VI starting point of 113 g/km.
Plotting minima and maxima in terms of reductions of emissions with the historical diesel emission limits was the best way to depict the scenario until 2030, as one can comprehend the difference in the historic emissions and the margin of error for future predicted emissions. This comprehensive research was conducted and concluded with plotting the predictions of future emission reductions by implementing the proposed six advanced technologies for ICEs (boosting, regen braking, split cycle engine, combustion, waste heat recovery and CCS) in India until 2030. The outcome of the paper was a range of predictions and not actual figures so they have to be treated with caution, despite the high level of probability of a correct range of estimation. This type of report, will be interesting and hopefully useful, also from the policy perspective leading perhaps to BS VII.
Author Contributions
D.B.G. was the researcher responsible for conducting the investigation and writing the first draft. A.P. was responsible for data provision, methodological development and supervision of the work and J.R.S. advised on methodology and check the draft versions of the paper. All authors have read and agreed to the published version of the manuscript.
Funding
This research received no external funding.
Conflicts of Interest
The authors declare no conflict of interest.
Nomenclature
| Variables | |
| g | Grams |
| CO2g/km | CO2 emission grams per kilometer |
| L/100 km | Fuel Consumption liter per 100 km |
| % | Percentage |
| Abbreviations | |
| ICE | Internal Combustion Engine |
| CO2 | Carbon Dioxide |
| USA | United States of America |
| OEM | Original Equipment Manufacturer |
| NCR | National Capital Region |
| BS-VI | Bharat Stage VI |
| EVs | Electric Vehicles |
| NO2 | Nitrogen Dioxide |
| CCU | Carbon Capture and Use |
| CCS | Carbon Capture and Storage |
| GDP | Gross Domestic Product |
| WHO | World Health Organization |
| CNG | Compressed Natural Gas |
| PM | Particle Emission |
| LNG | Liquified Natural Gas |
| BEV | Battery Electric Vehicle |
| SIAM | Society of Indian Automotive Manufacturers |
| CAGR | Compound Annual Growth Rate |
| NEMMP | National Electric Mobility Mission Plan |
| USD | United States Dollars |
| R&D | Research and Development |
| SESI | Seconded European Standardisation Expert in India |
| IPCC | Intergovernmental Panel on Climate Change |
| TEG | Thermal Electric Generator |
| EOR | Enhanced Oil Recovery |
| UMPPs | Ultra-Mega Power Projects |
| LPG | Liquified Petroleum Gas |
| HyBoost | Hybridised Boosted Optimised System with Turbo-compounding |
| NOx | Nitrogen Oxide and Nitrogen Dioxide |
| ZEV | Zero Emission Vehicle |
| SR | Switched Reluctance |
| HyPACE | Hybrid Petrol Advance Combustion Engine |
| LTC | Low Temperature Combustion |
| TDC | Top Dead Centre |
| RDE | Real Driving Emissions |
| HCCI | Homogenous Charge Compression Ignition |
| PCCI | Premixed Charge Compression Ignition |
| PCC | Partially Premixed Combustion |
| RCCI | Reactivity Controlled Compression Ignition |
| GCI | Gasoline Compression Ignition |
| HECC | High Efficiency Clean Combustion |
| SACI | Spark Assisted Compression Ignition |
| EGR | Exhaust Gas Recovery |
| BMEP | Brake Mean Effective Pressure |
| KERS | Kinetic Energy Recovery System |
| FIA | International Automotive Federation |
| HEV | Hybrid Electric Vehicle |
| TDI | Turbocharged Direct Injection |
| CVT | Continuously Variable Transmission |
| LDV | Light Duty Vehicle |
| HDV | Heavy Duty Vehicle |
| GHG | Green House Gas |
| MNRE | The Ministry of New and Renewable Energy |
| NEDC | New European Driving Cycle |
| LMP1 | Le Mans Prototype 1 |
| FY | Financial Year |
| EU | European Union |
| FCA | Fiat Chrysler Automobiles |
| WHR | Waste Heat Recovery |
| MAX | Maximum |
| MIN | Minimum |
References
- Serrano, J.R. Imagining the Future of the Internal Combustion Engine for Ground Transport in the Current Context. Appl. Sci. 2017, 7, 1001. [Google Scholar] [CrossRef] [Green Version]
- Gardiner, J. The Guardian. Available online: https://www.theguardian.com/sustainable-business/2017/aug/10/electric-cars-big-battery-waste-problem-lithium-recycling (accessed on 24 May 2019).
- SIAM. Technical Regulations, Emission Norms. Available online: http://www.siamindia.com/technical-regulation.aspx?mpgid=31&pgidtrail=33 (accessed on 28 May 2019).
- Diesel Net. Available online: https://www.dieselnet.com/standards/in/ (accessed on 20 May 2019).
- WKM. Wissenschaftliche Gesellschaft für Kraftfahrzeug- und Motorentechnik e.V. Available online: https://www.wkm-ev.de/de/aktuelles.html (accessed on 28 May 2019).
- Juyal, S.; Saxena, A.; Sharma, S.; Srivastava, A.; Jain, R.; Ritolia, R.; Sankar, N.; Sinaha, J.; The Boston Consulting Group. Transforming India’s Mobility: A Perspective; Government of India: New Delhi, India, 2018.
- TOI. 14 of World’s 15 Most Polluted Cities in India. Available online: https://timesofindia.indiatimes.com/city/delhi/14-of-worlds-15-most-polluted-cities-in-india/articleshow/63993356.cms (accessed on 1 July 2019).
- TWB Group. CO2 Emissions from Transport (% of Total Fuel Combustion). Available online: https://data.worldbank.org/indicator/EN.CO2.TRAN.ZS?end=2014&locations=IN&name_desc=false&start=1971&view=chart (accessed on 1 August 2019).
- Gandhi, K.K. How India can Drive Towards and Emission Free Future. Available online: https://www.autocarpro.in/opinion-column/how-india-can-drive-towards-an-emissionfree-future-41288 (accessed on 1 August 2019).
- Auto, E. SIAM Welcomes PM Modi’s Assurance on Co-Existence of ICE Vehicles and EVs. Available online: https://auto.economictimes.indiatimes.com/news/industry/siam-welcomes-pm-modis-assurance-on-co-existence-of-ice-vehicles-and-evs/70673440 (accessed on 12 August 2019).
- SESI. Seconded European Standardization Expert in India; Indian Automobile Industry: New Delhi, India, 2018. [Google Scholar]
- IBEF. Automobiles; India Brand Equity Foundation: New Delhi, India, 2019. [Google Scholar]
- KPMG. Emerging Trends and Technologies in the Automotive Sector; KPMG International Cooperative: Amstelveen, The Netherlands, 2015. [Google Scholar]
- Mehra, V. Springer Link: Lifetime CO2 Emissions in Different Indian Vehicles. Available online: https://link.springer.com/article/10.1365/s40112-015-1005-7 (accessed on 16 July 2019).
- Lenny Bernstein, A.L.S.C. Carbon Dioxide Capture and Storage: A Status Report. Clim. Policy 2006, 6, 241–246. [Google Scholar] [CrossRef]
- Traver, D.M. International Transport Forum. Available online: https://www.itf-oecd.org/lower-carbon-technologies-road-freight-transport (accessed on 3 September 2019).
- IPCC Special Report on Carbon Dioxide Capture and Storage. Available online: https://www.researchgate.net/publication/239877190_IPCC_Special_Report_on_Carbon_dioxide_Capture_and_Storage (accessed on 1 August 2019).
- Chabba, A.P.S. Carbon Capture Storage Technology and India. Available online: https://en.reset.org/knowledge/carbon-capture-storage-technology-and-india (accessed on 7 August 2019).
- Hamad, E.Z.; Wajdi, I.A.-S. Apparatus and Method for Oxy-Combustion of Fuels in Internal Combuston Engines; 2013/0247886 A1; USPTO: Dhahran, Arabia, 2013.
- Mayers, B.A.; Ihms, D.W. Heat Exchanger Equipped with Thermal Electric Device for Engine Exhaust Carbon Doxde Collection System. U.S. Patent No. 9,267,415 B2, 23 February 2016. [Google Scholar]
- Mayers, B.A.; Ihms, D.W. Vehicle System to Separate and Store Carbon Dioxide from Engine Exhaust. U.S. Patent No. 8,480,798 B1, 9 July 2013. [Google Scholar]
- Sood, A.; Vyas, S. A review: Carbon capture and sequestration (CCS) in India. Int. J. Mech. Eng. Technol. (IJMET) 2017, 8, 1–7. [Google Scholar]
- ZEROCO2 Energy & Climate Change—Policy and Progress. Available online: http://www.zeroco2.no/projects/countries/india (accessed on 1 August 2019).
- Gupta, J. The Third Pole. Available online: https://www.thethirdpole.net/en/2018/10/29/india-seeking-ways-to-limit-climate-change-after-ipcc-report/ (accessed on 1 August 2019).
- Kapila, R.V.; Haszeldine, S.R. Opportunities in India for Carbon Capture and Storage as a form of climate change mitigation. Energy Procedia 2009, 1, 4527–4534. [Google Scholar] [CrossRef] [Green Version]
- Avaritsioti, E. Environmental and Economic Benefits of Car Exhaust Heat Recovery. Transp. Res. Arena TRA 2016, 14, 1003–1012. [Google Scholar] [CrossRef]
- Rajoo, S.; Romagnoli, A.; Ricardo, M.-B.; Pesyridis, A.; Copeland, C.; Mamat, A.M.I.B. Automotive Exhaust Waste Heat Recovery Technologies. In Automotive Exhaust Emissions and Energy Recovery; Pesiridis, A., Ed.; NOVA Science Publishers: New York, NY, USA, 2014. [Google Scholar]
- Fairbanks, J.W. The 60 Percent Efficient Diesel Engine; Probable, Possible, or Just A Fantasy? U.S. Department of Energy: Chicago, IL, USA, 2005.
- Owen, N. CryoPower-A Long Haul Truck Engine with Near Zero Emissions and High Efficiency; FPC: Solihull, UK, 2019. [Google Scholar]
- Dong, G.; Morgan, R.E.; Heikal, M.R. Thermodynamic Analysis and System Design of a Novel Split Cycle Engine Concept. Energy 2016, 102, 567–585. [Google Scholar] [CrossRef] [Green Version]
- Morgan, R.E.; Jackson, N.; Atkins, A. The Recuperated Split Cycle—Experimental Combustion. SAE Int. J. Engines 2017, 10, 2596–2605. [Google Scholar] [CrossRef] [Green Version]
- Description of a Novel Concentric Rotary Engine. Available online: https://www.sae.org/publications/technical-papers/content/2018-01-0365/ (accessed on 4 September 2019).
- Winward, E.; Rutledge, J.; Carter, J.; Costall, A.; Stobart, R.; Zhao, D.; Yang, Z. Performance Testing of an Electrically Assisted Turbocharger on a Heavy Duty Diesel Engine. In Proceedings of the 12th International Conference on Turbochargers and Turbocharging, London, UK, 17–18 May 2016. [Google Scholar]
- Cooper, A.; Bassett, M.; Hall, J.; Harrington, A. Sae Mobilus. Available online: https://doi.org/10.4271/2019-01-0325 (accessed on 30 May 2019).
- Tang, H.; Pennycott, A.; Akehurst, S.; Brace, C.J. A review of the application of variable geometry turbines to the downsized gasoline engine. Int. J. Engine Res. 2015, 16, 810–825. [Google Scholar] [CrossRef]
- Pachiannan, T.; Zhong, W.; Rajkumar, S.; He, Z.; Leng, X.; Wang, Q. A literature review of fuel effects on performance and emission characteristics of low-temperature combustion strategies. Appl. Energy 2019, 251, 113380. [Google Scholar] [CrossRef]
- Ramesh, N.; Mallikarjuna, J.M. Evaluation of in-cylinder mixture homogeneity in a diesel HCCI engine—A CFD analysis. Eng. Sci. Technol. Int. J. 2016, 19, 917–925. [Google Scholar] [CrossRef] [Green Version]
- Benajes, J.; García-Oliver, J.M.; Novella, R.; Kolodziej, C. Increased particle emissions from early fuel injection timing Diesel low temperature combustion. Fuel 2011, 94, 184–190. [Google Scholar] [CrossRef]
- Rajkumar, S.; Thangaraja, J. Effect of biodiesel, biodiesel binary blends, hydrogenated biodiesel and injection parameters on NOx and soot emissions in a turbocharged diesel engine. Fuel 2018, 240, 101–118. [Google Scholar] [CrossRef]
- Jin, C.; Zheng, Z. A Review on Homogeneous Charge Compression Ignition and Low Temperature Combustion by Optical Diagnostics. Hindawi J. Chem. 2015, 2015, 1–23. [Google Scholar] [CrossRef] [Green Version]
- Dev, S.; Chaudhari, B.H.; Gothekar, S.; Juttu, S.; Walke, N.H.; Marathe, N.V. Review on Advanced Low Temperature Combustion Approach for BS VI. SAE Tech. Pap. 2017. [Google Scholar] [CrossRef]
- Stanton, D. Systematic Development of Highly Efficient and Clean Engines to Meet Future Commercial Vehicle Greenhouse Gas Regulations. SAE Int. J. Engines 2013, 6, 1395–1480. [Google Scholar] [CrossRef]
- Boretti, A.; Al-Zubaidy, S. E-KERS Energy Management Crucial to Improved Fuel Economy. SAE Tech. Pap. 2016. [Google Scholar] [CrossRef]
- Metz, L. Potential for Passenger Car Energy Recovery through the Use of Kinetic Energy Recovery Systems (KERS). SAE Tech. Pap. 2013. [Google Scholar] [CrossRef]
- Kim, J.S.; Kim, S.M.; Jeong, J.H.; Jeong, S.C.; Lee, J.W. Effect of regenerative braking energy on battery current balance in a parallel hybrid gasoline-electric vehicle under ftp-75 driving mode. Int. J. Automot. Technol. 2016, 17, 865–872. [Google Scholar] [CrossRef]
- Boretti, A. Improvements of Vehicle Fuel Economy Using Mechanical Regenerative Braking. SAE Tech. Pap. 2010. [Google Scholar] [CrossRef]
- Clarke, P.; Muneer, T.; Cullinane, K. Cutting vehicle emissions with regenerative braking. Transp. Res. Part D 2010, 15, 160–167. [Google Scholar] [CrossRef]
- Fleet, C. Commercial Fleet. Available online: https://www.commercialfleet.org/news/truck-news/2015/09/02/kers-system-developed-for-road-freight-trucks (accessed on 4 September 2019).
- Aggarwal, P.; Jain, S. Energy demand and CO2 emissions from urban on-road transport in Delhi: Current and future projections under various policy measures. J. Clean. Prod. 2014, 128, 48–61. [Google Scholar] [CrossRef]
- MoEFCC. Second Biennial Update Report to the United Nations Framework Convention on Climate Change, Government of India; Government of India: New Delhi, India, 2018.
- Bansal, G.; Bandivadekar, A. Overview of India’s Vehicle Emissions Control Program—Past Successes and Future Prospects; International Council on Clean Transportation: Washington, DC, USA, 2013. [Google Scholar]
- Kanikdale, T.; Venugopal, S. Future Scenarios for Automotive Engines in India. SAE Tech. Pap. 2015. [Google Scholar] [CrossRef]
- Saidur, R.; Rezaei, M.; Muzammil, W.K.; Hassan, M.H.; Paria, S.; Hasanuzzaman, M. Technologies to recover exhaust heat from internal combustion engines. Renew. Sustain. Energy Rev. 2012, 16, 5649–5659. [Google Scholar] [CrossRef]
- Arsie, I.; Cricchio, A.; Pianese, C.; De Cesare, M.; Nesci, W. A Comprehensive Powertrain Model to Evaluate the Benefits of Electric Turbo Compound (ETC) in Reducing CO2 Emissions from Small Diesel Passenger Cars. SAE Tech. Pap. 2014. [Google Scholar] [CrossRef]
- Yang, Z.; Bandivadekar, A. 2017 Global Update: Light-Duty Vehicle Greenhouse Gas and Fuel Economy Standards; ICCT: Washington, DC, USA, 2017. [Google Scholar]
- Dallmann, T.; Bandivadekar, A. Technical Background on India BS VI Fuel Specifications; ICCT: Washington, DC, USA, 2016. [Google Scholar]
- EcoScore. Available online: http://ecoscore.be/en/info/ecoscore/co2 (accessed on 2 September 2019).
- Yang, Z. Compliance with India’s First Fuel-Consumption Standards for New Passenger Cars (FY 2017–2018); ICCT: Washington, DC, USA, 2018. [Google Scholar]
- Ritchie, H.; Roser, M. CO₂ and Greenhouse Gas Emissions. Available online: https://ourworldindata.org/co2-and-other-greenhouse-gas-emissions (accessed on 5 September 2019).
Figure 1.
Number of Automobiles Produced in India from 2013 to 2019.

Figure 2.
Number of Automobiles Sold in India from 2013 to 2019.

Figure 3.
Segment Wise Market Share of Vehicles in 2019.

Figure 4.
CCS Equipment Flow Diagram.
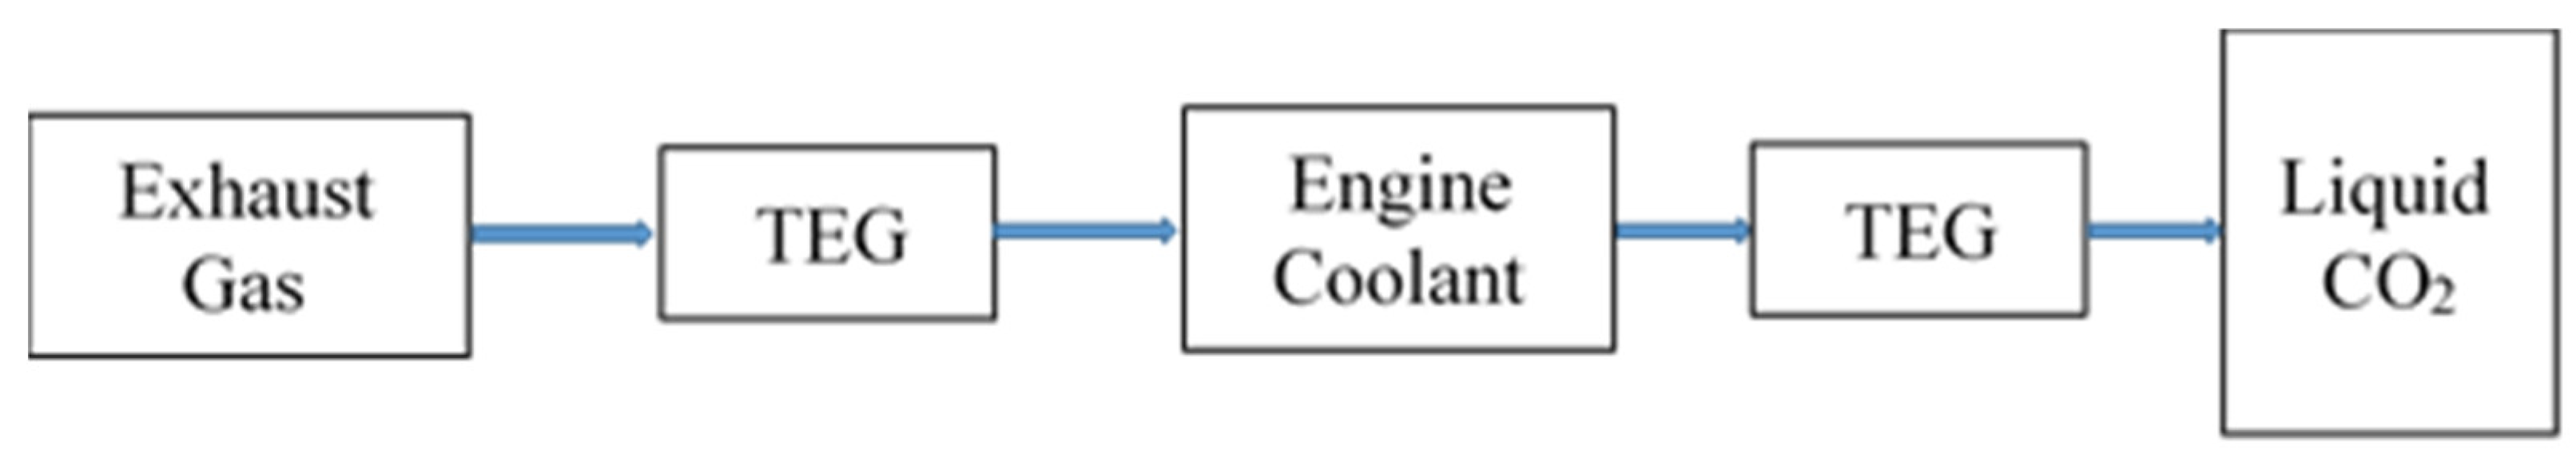
Figure 5.
Methodology.

Figure 6.
Historic CO2 emissions for transportation in India.

Figure 7.
CO2 Emission Predictions for India.

Figure 8.
Indian Automotive CO2 Emissions Roadmap for 2020–2030.

Figure 9.
Historic CO2 g/km emission levels in India.


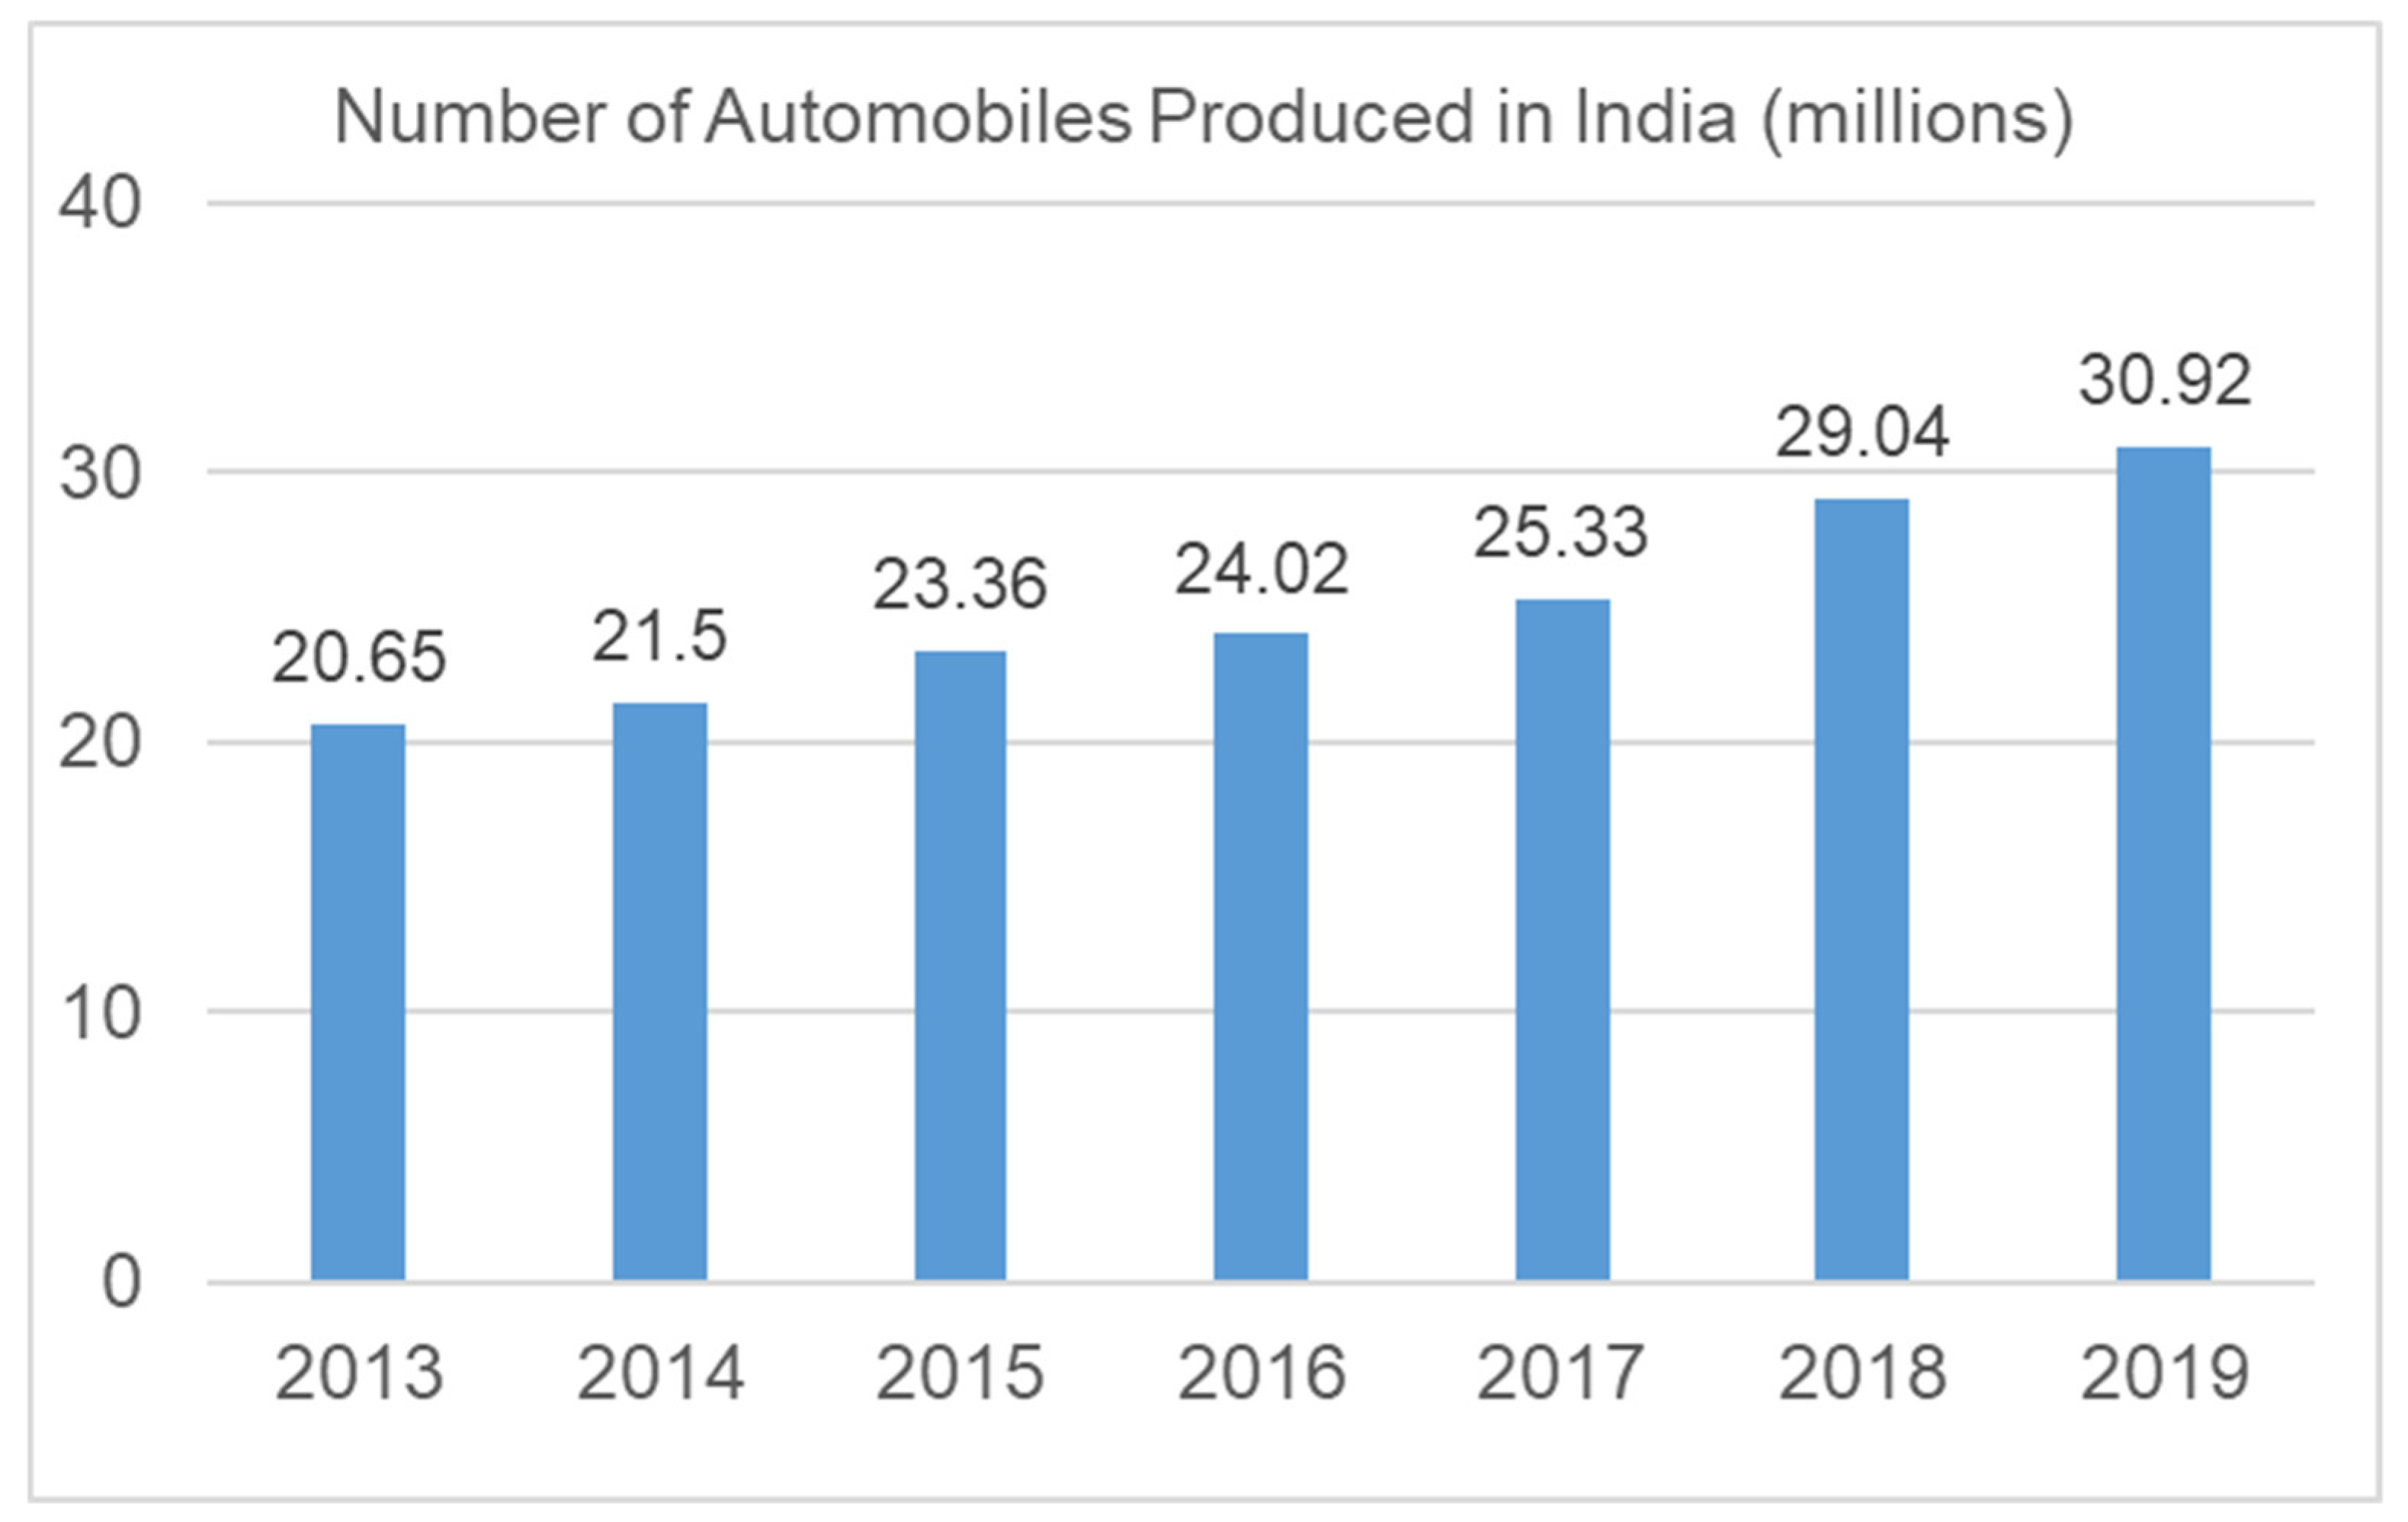
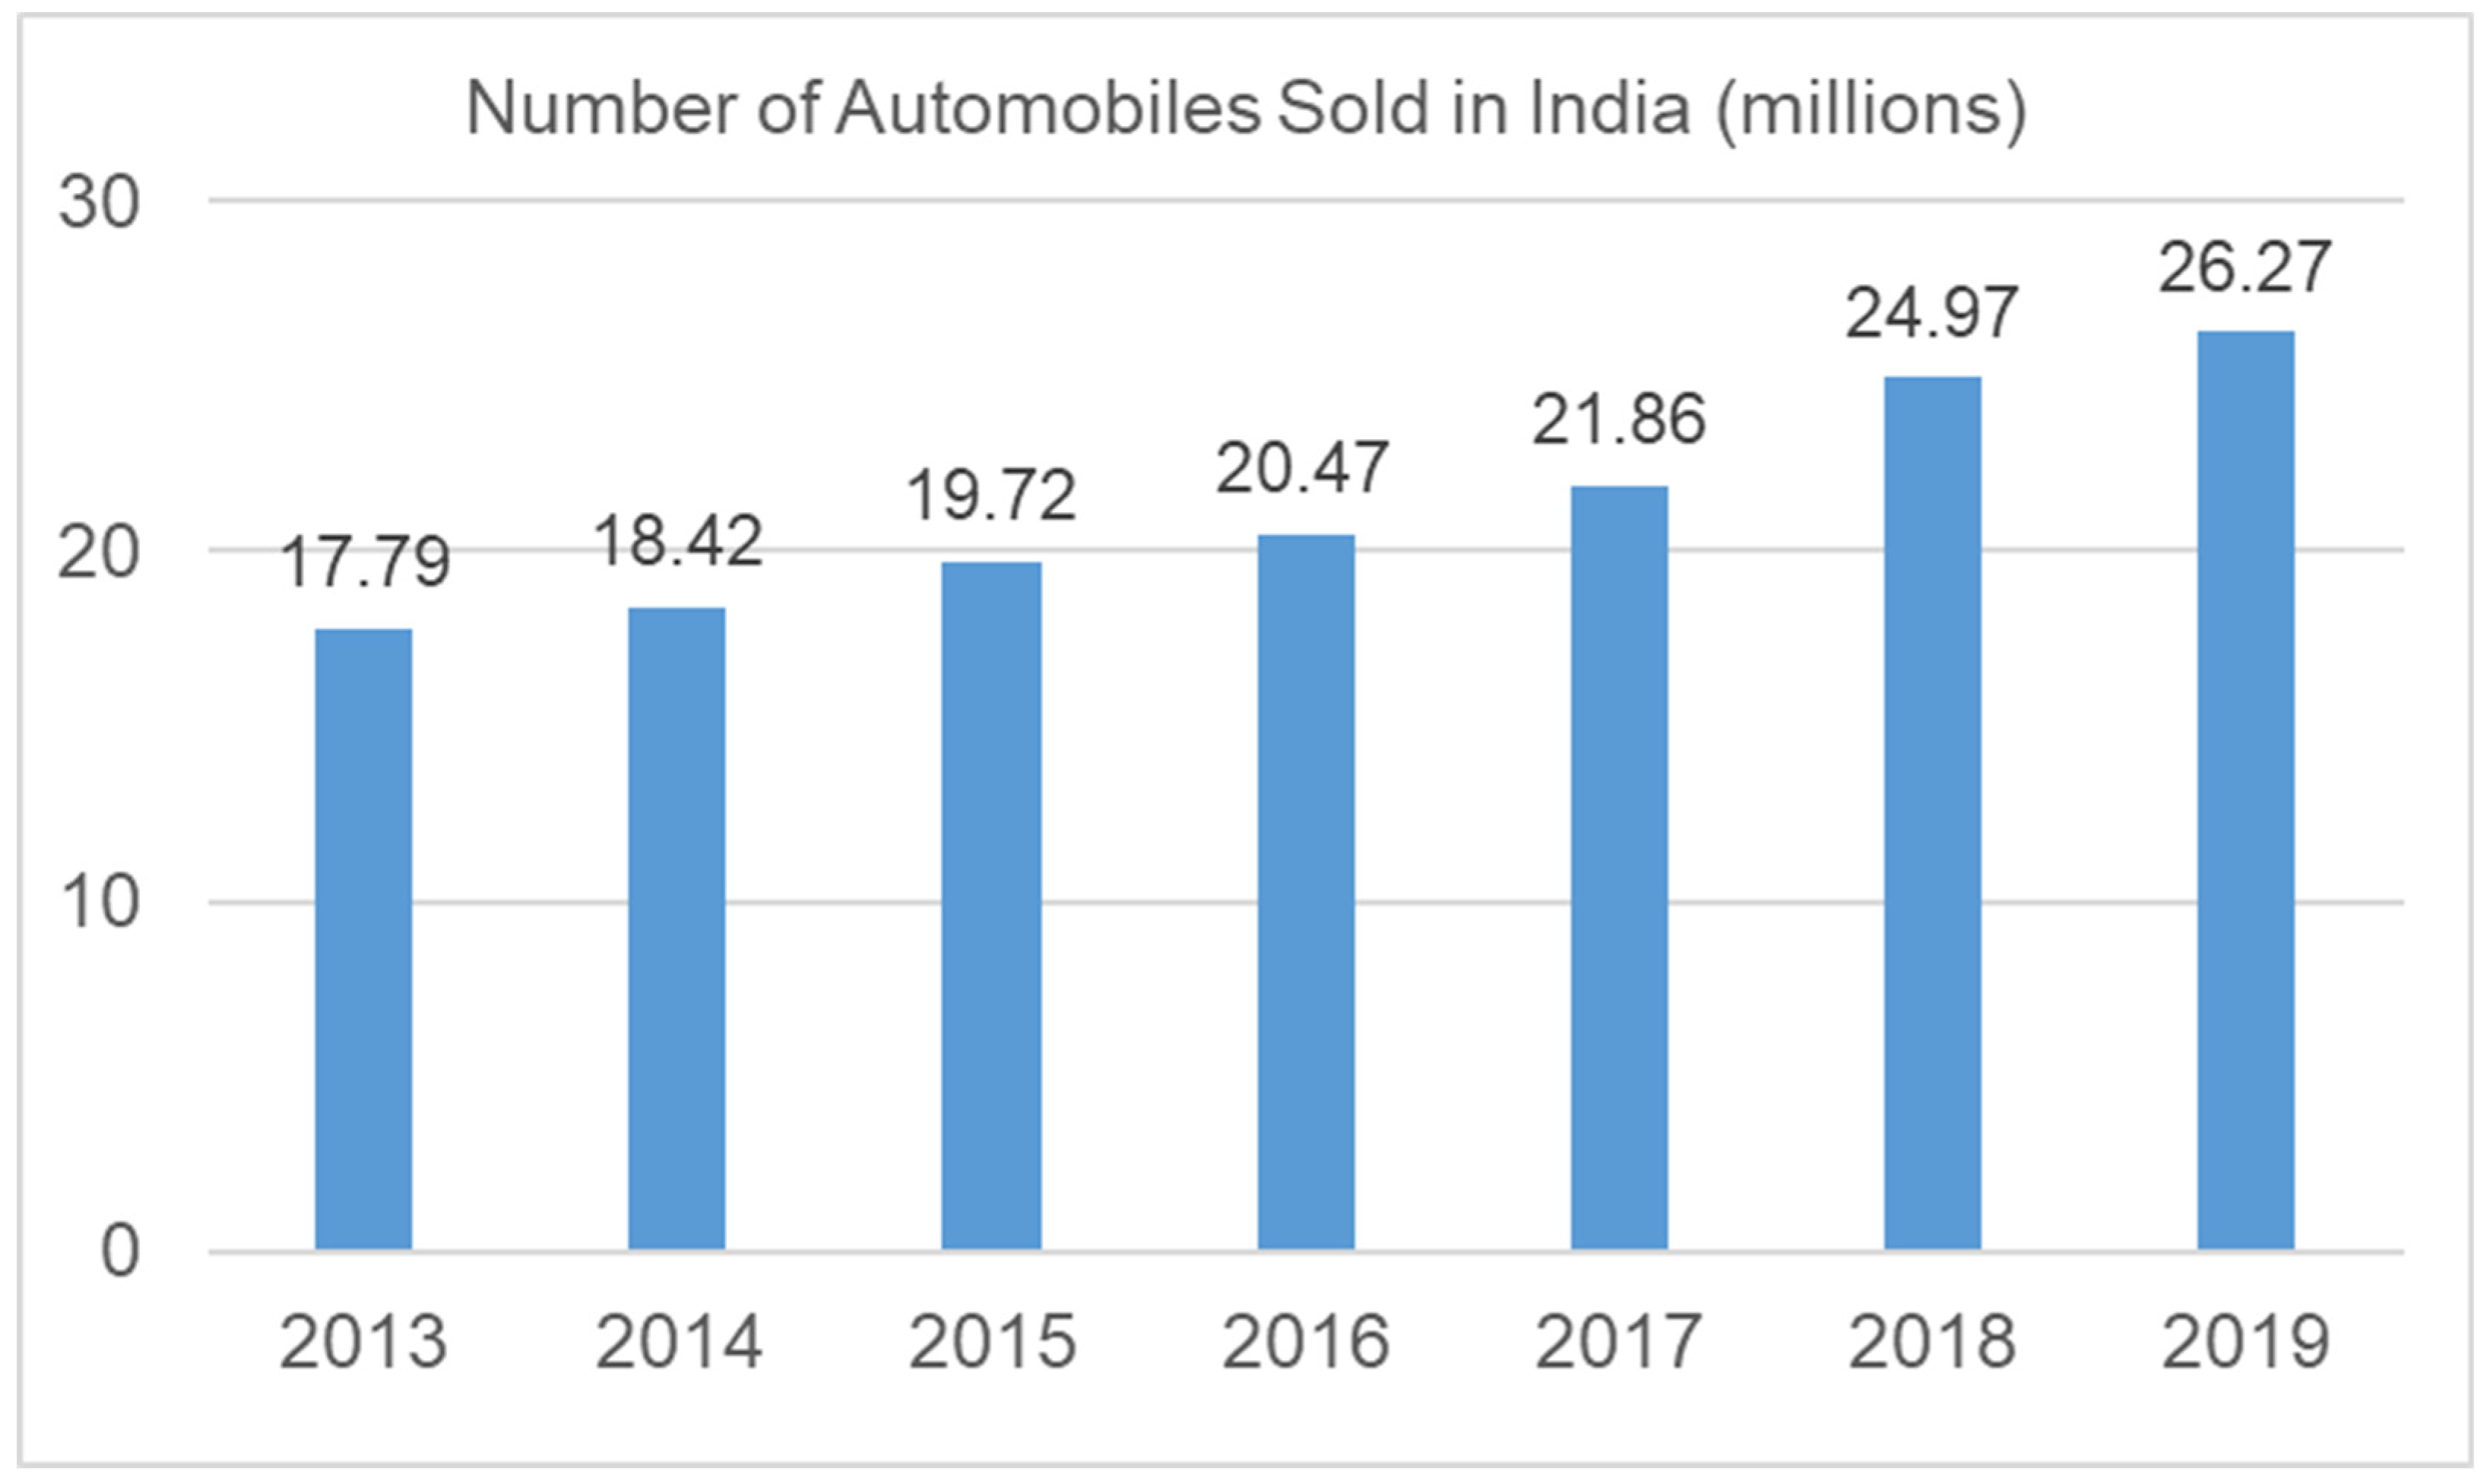
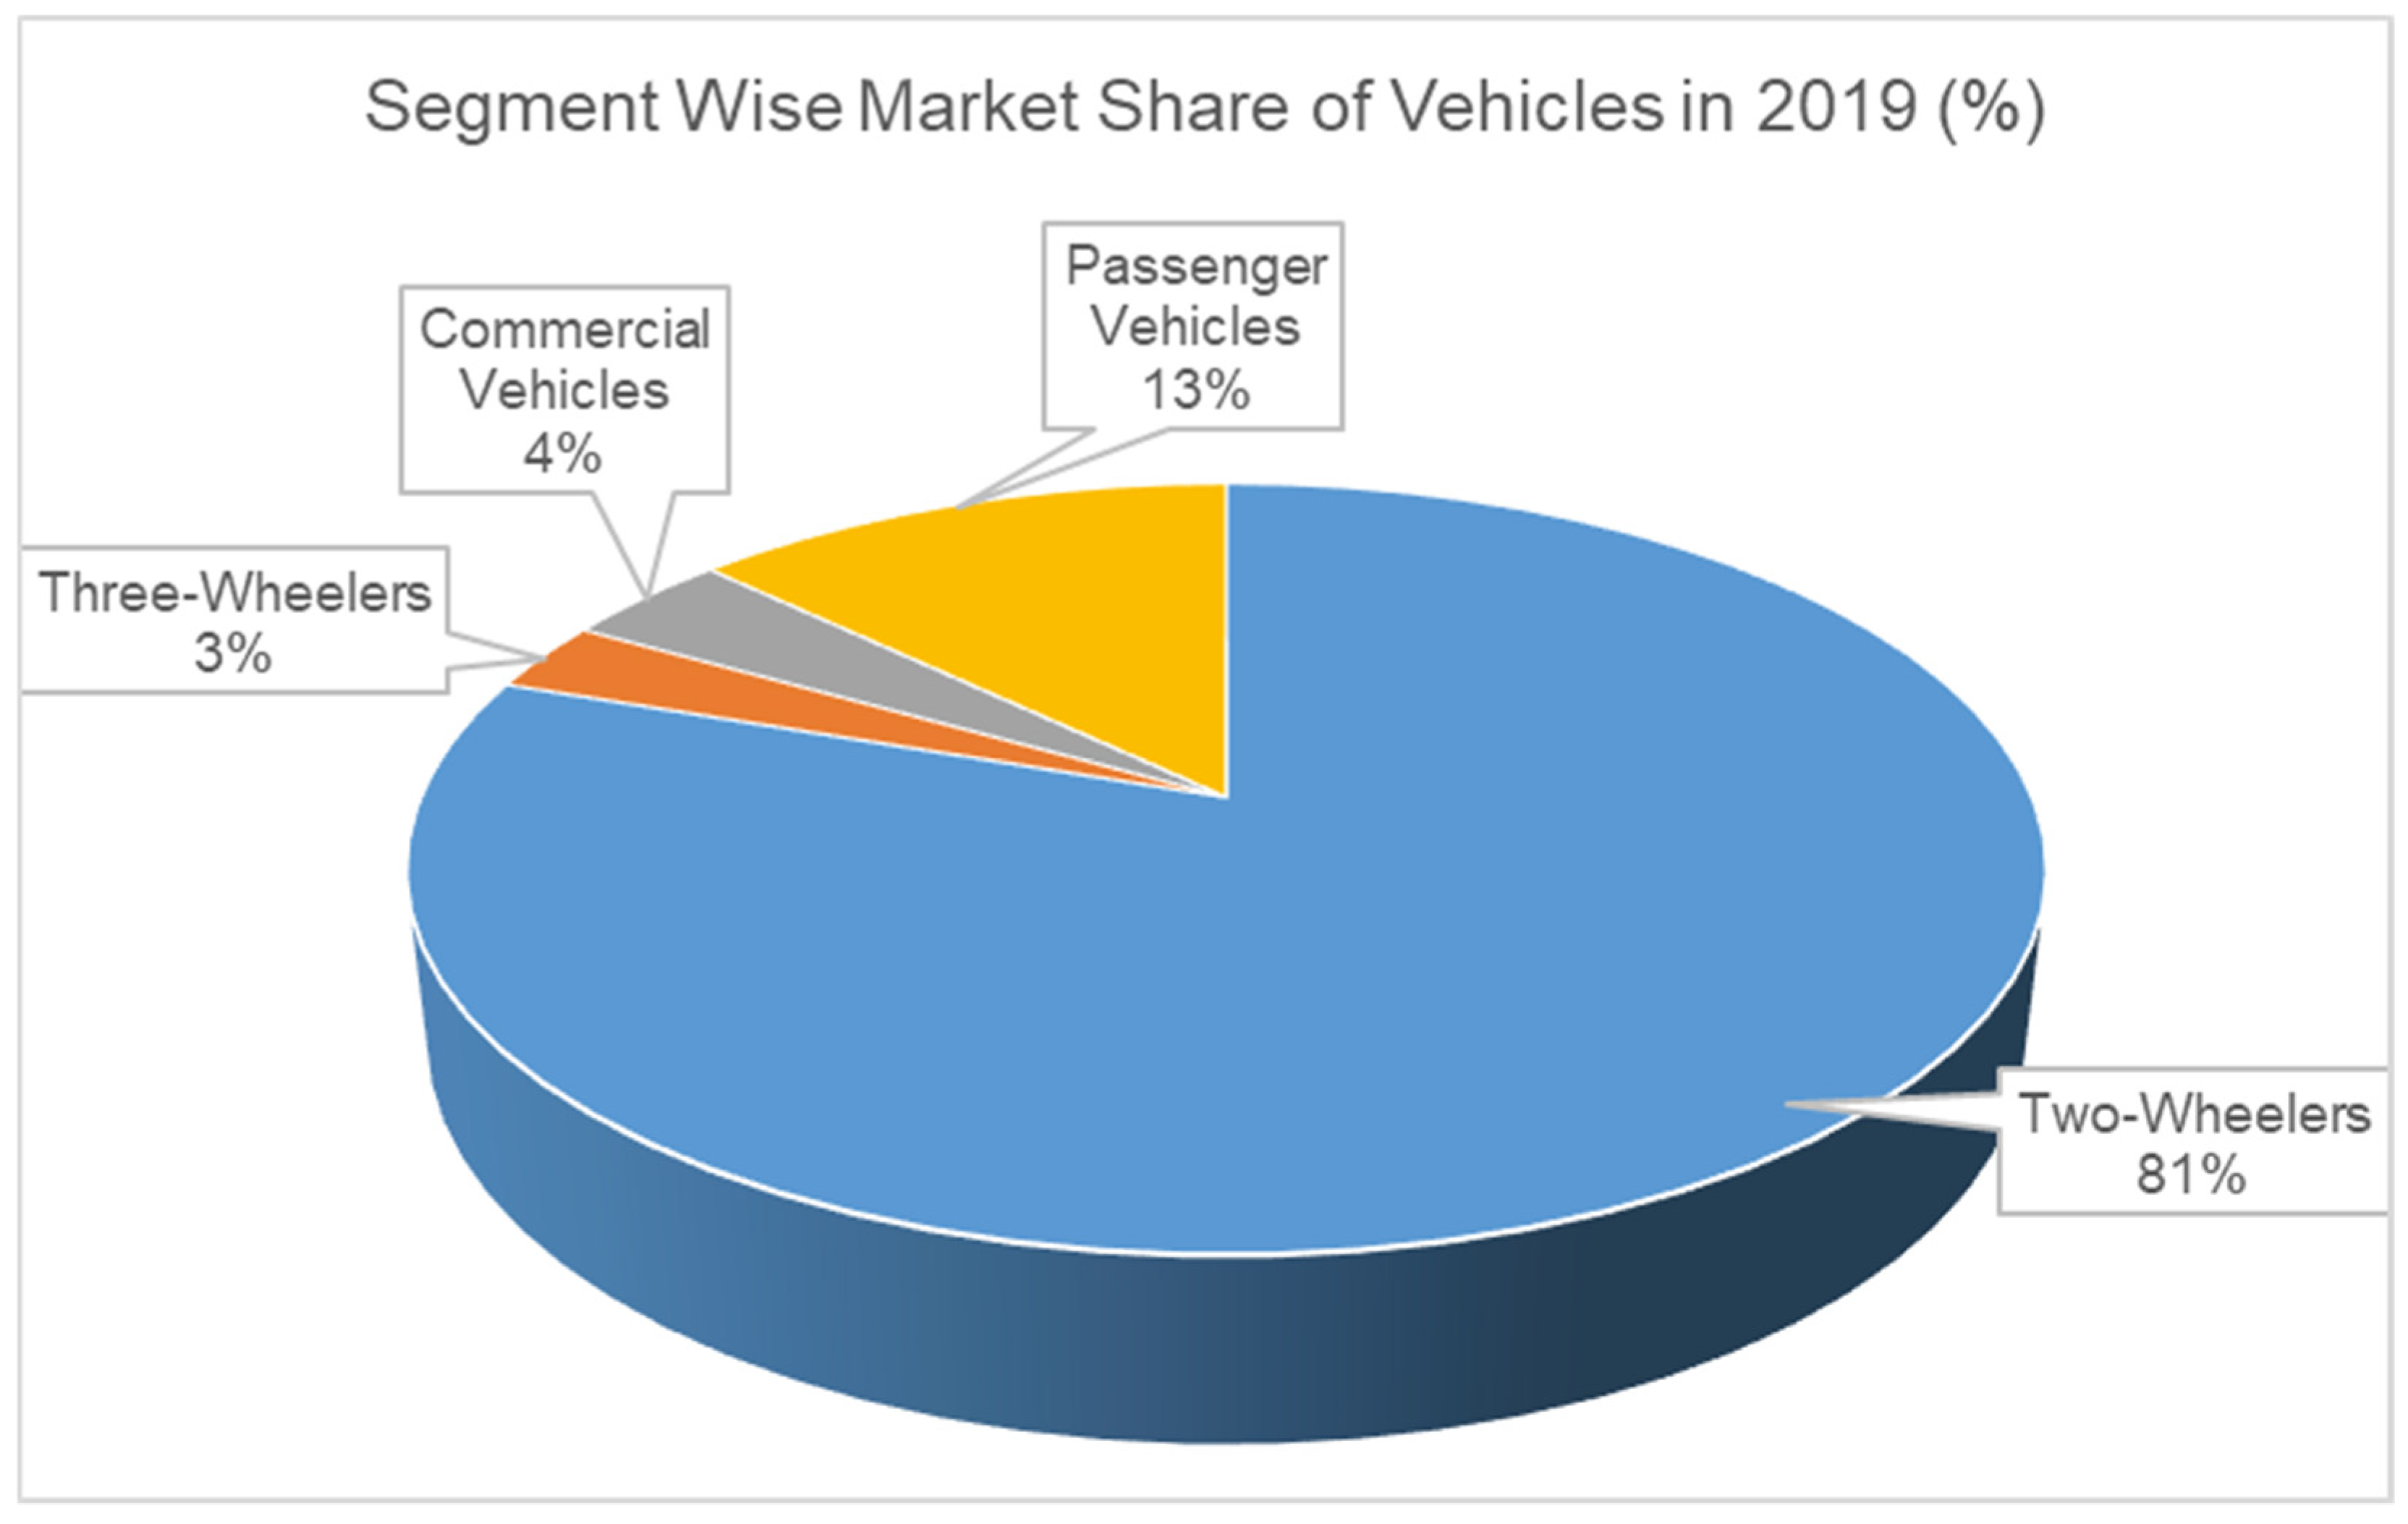
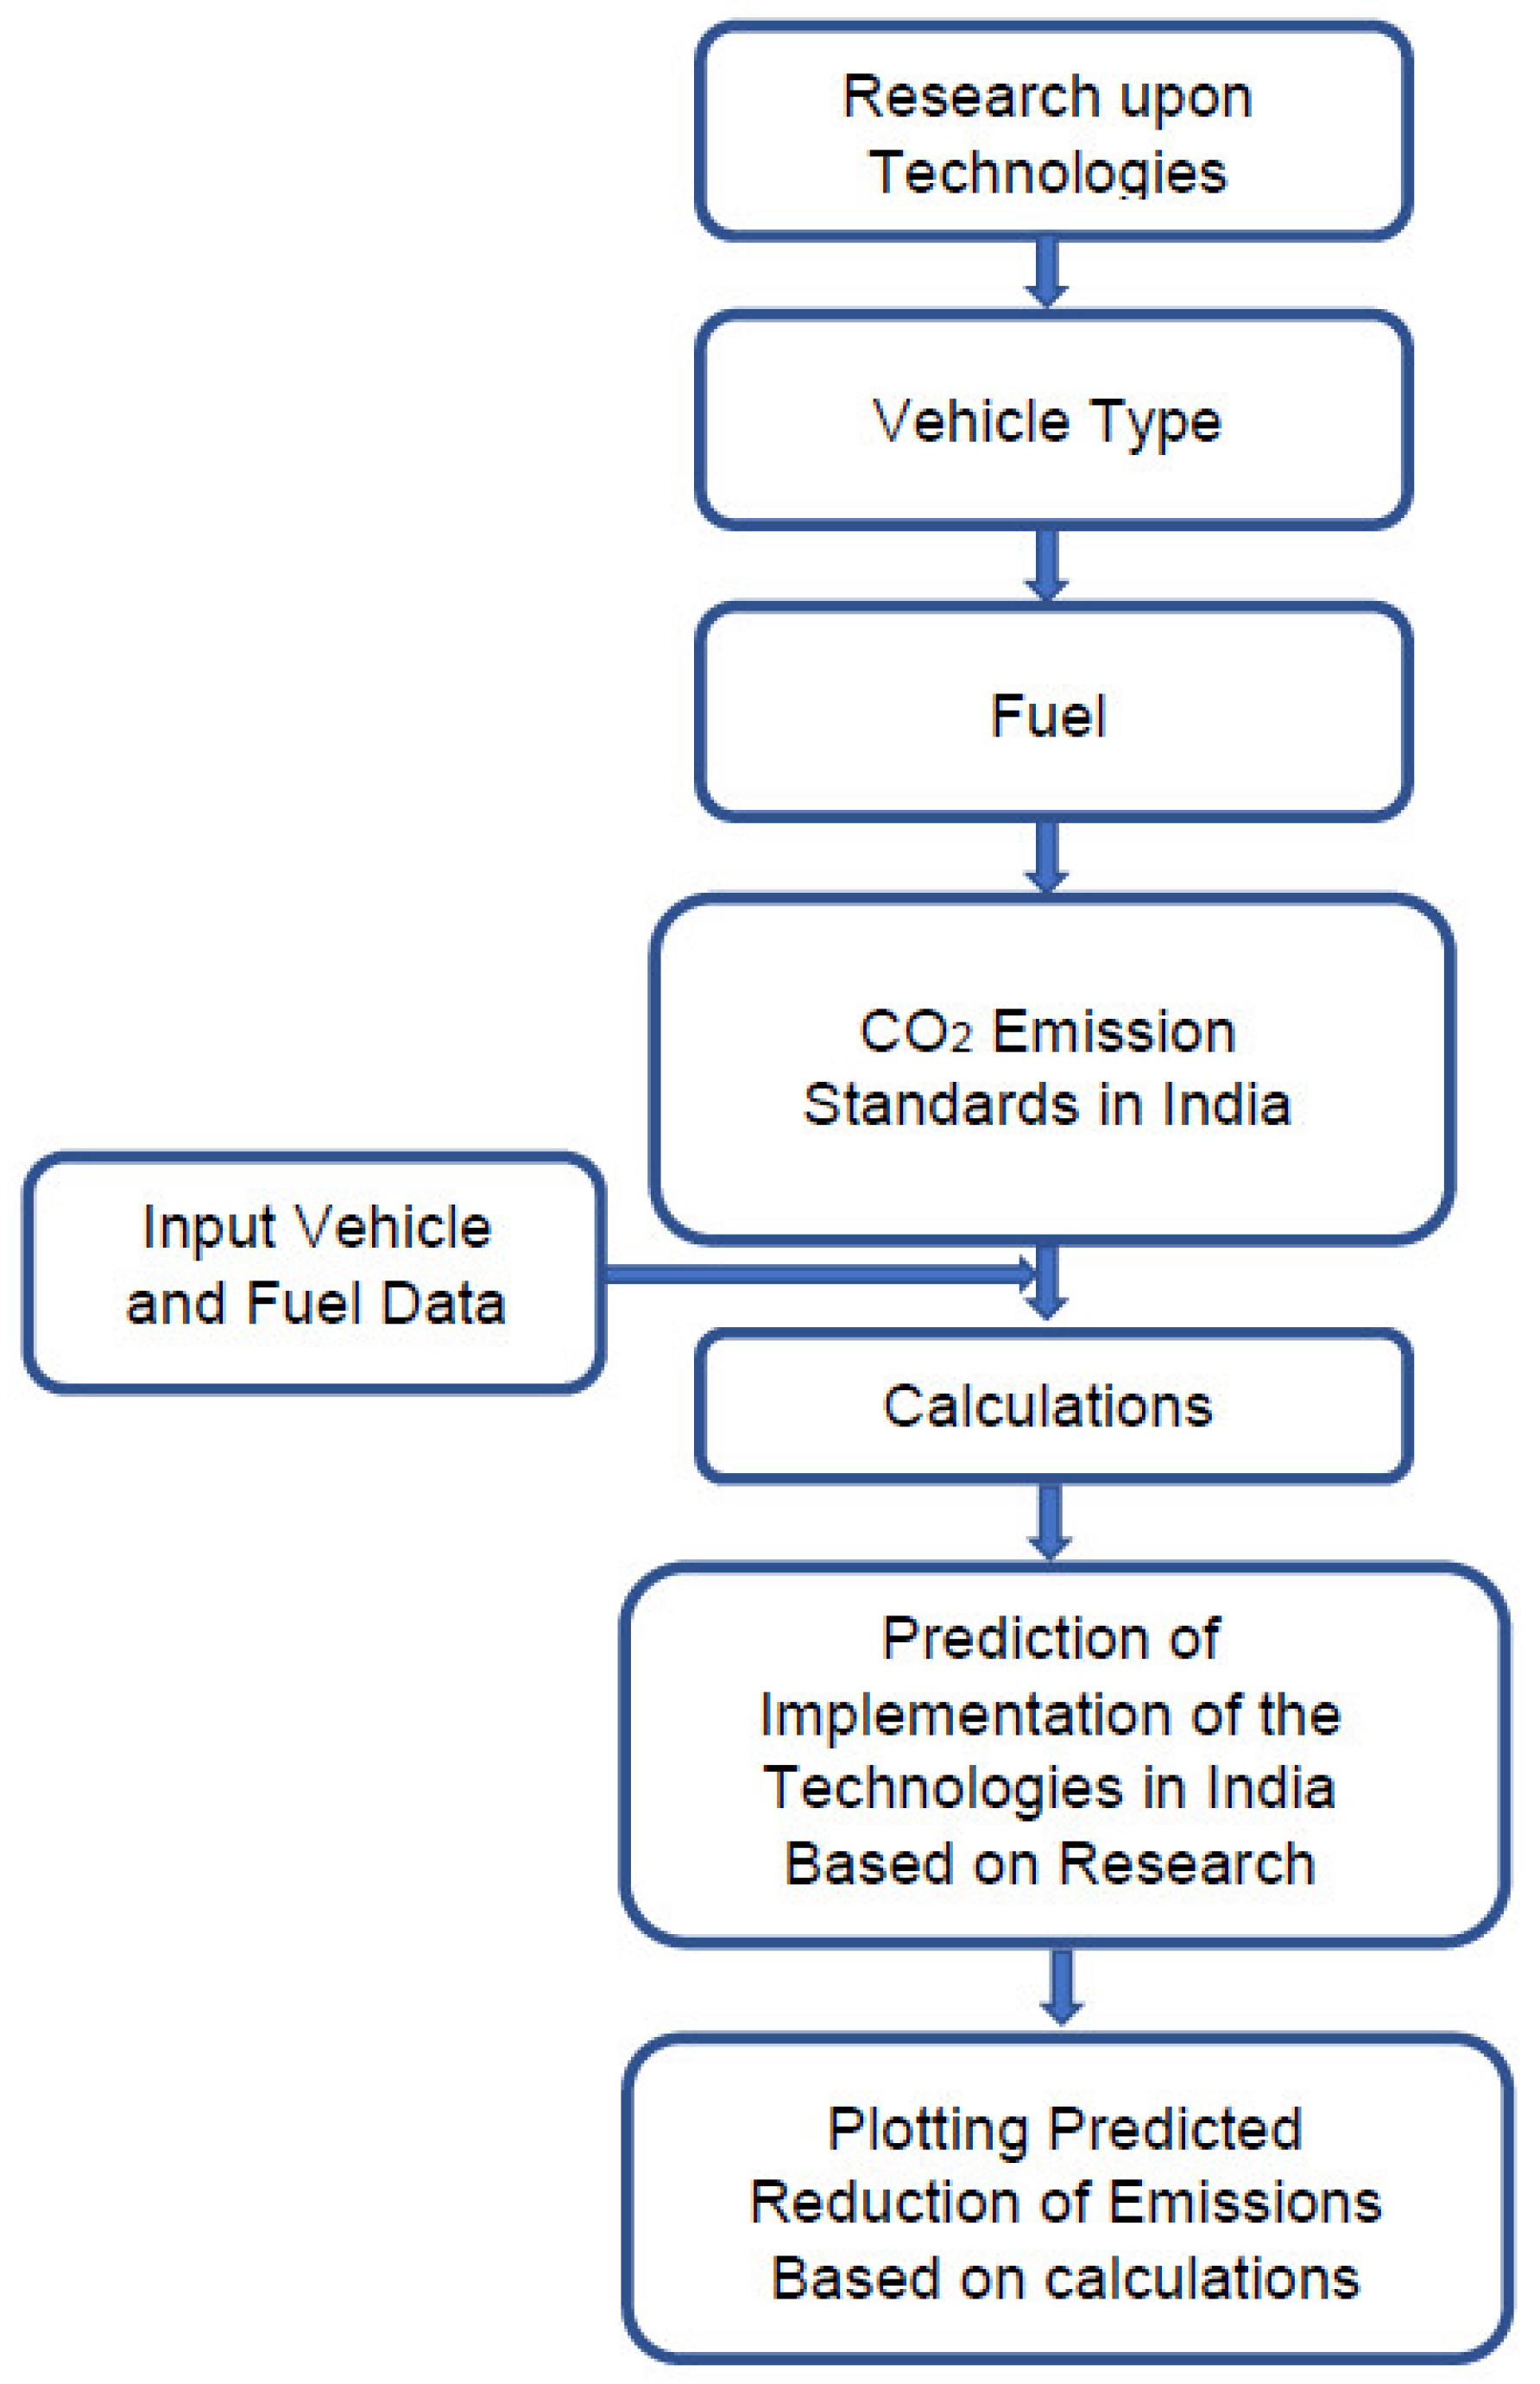
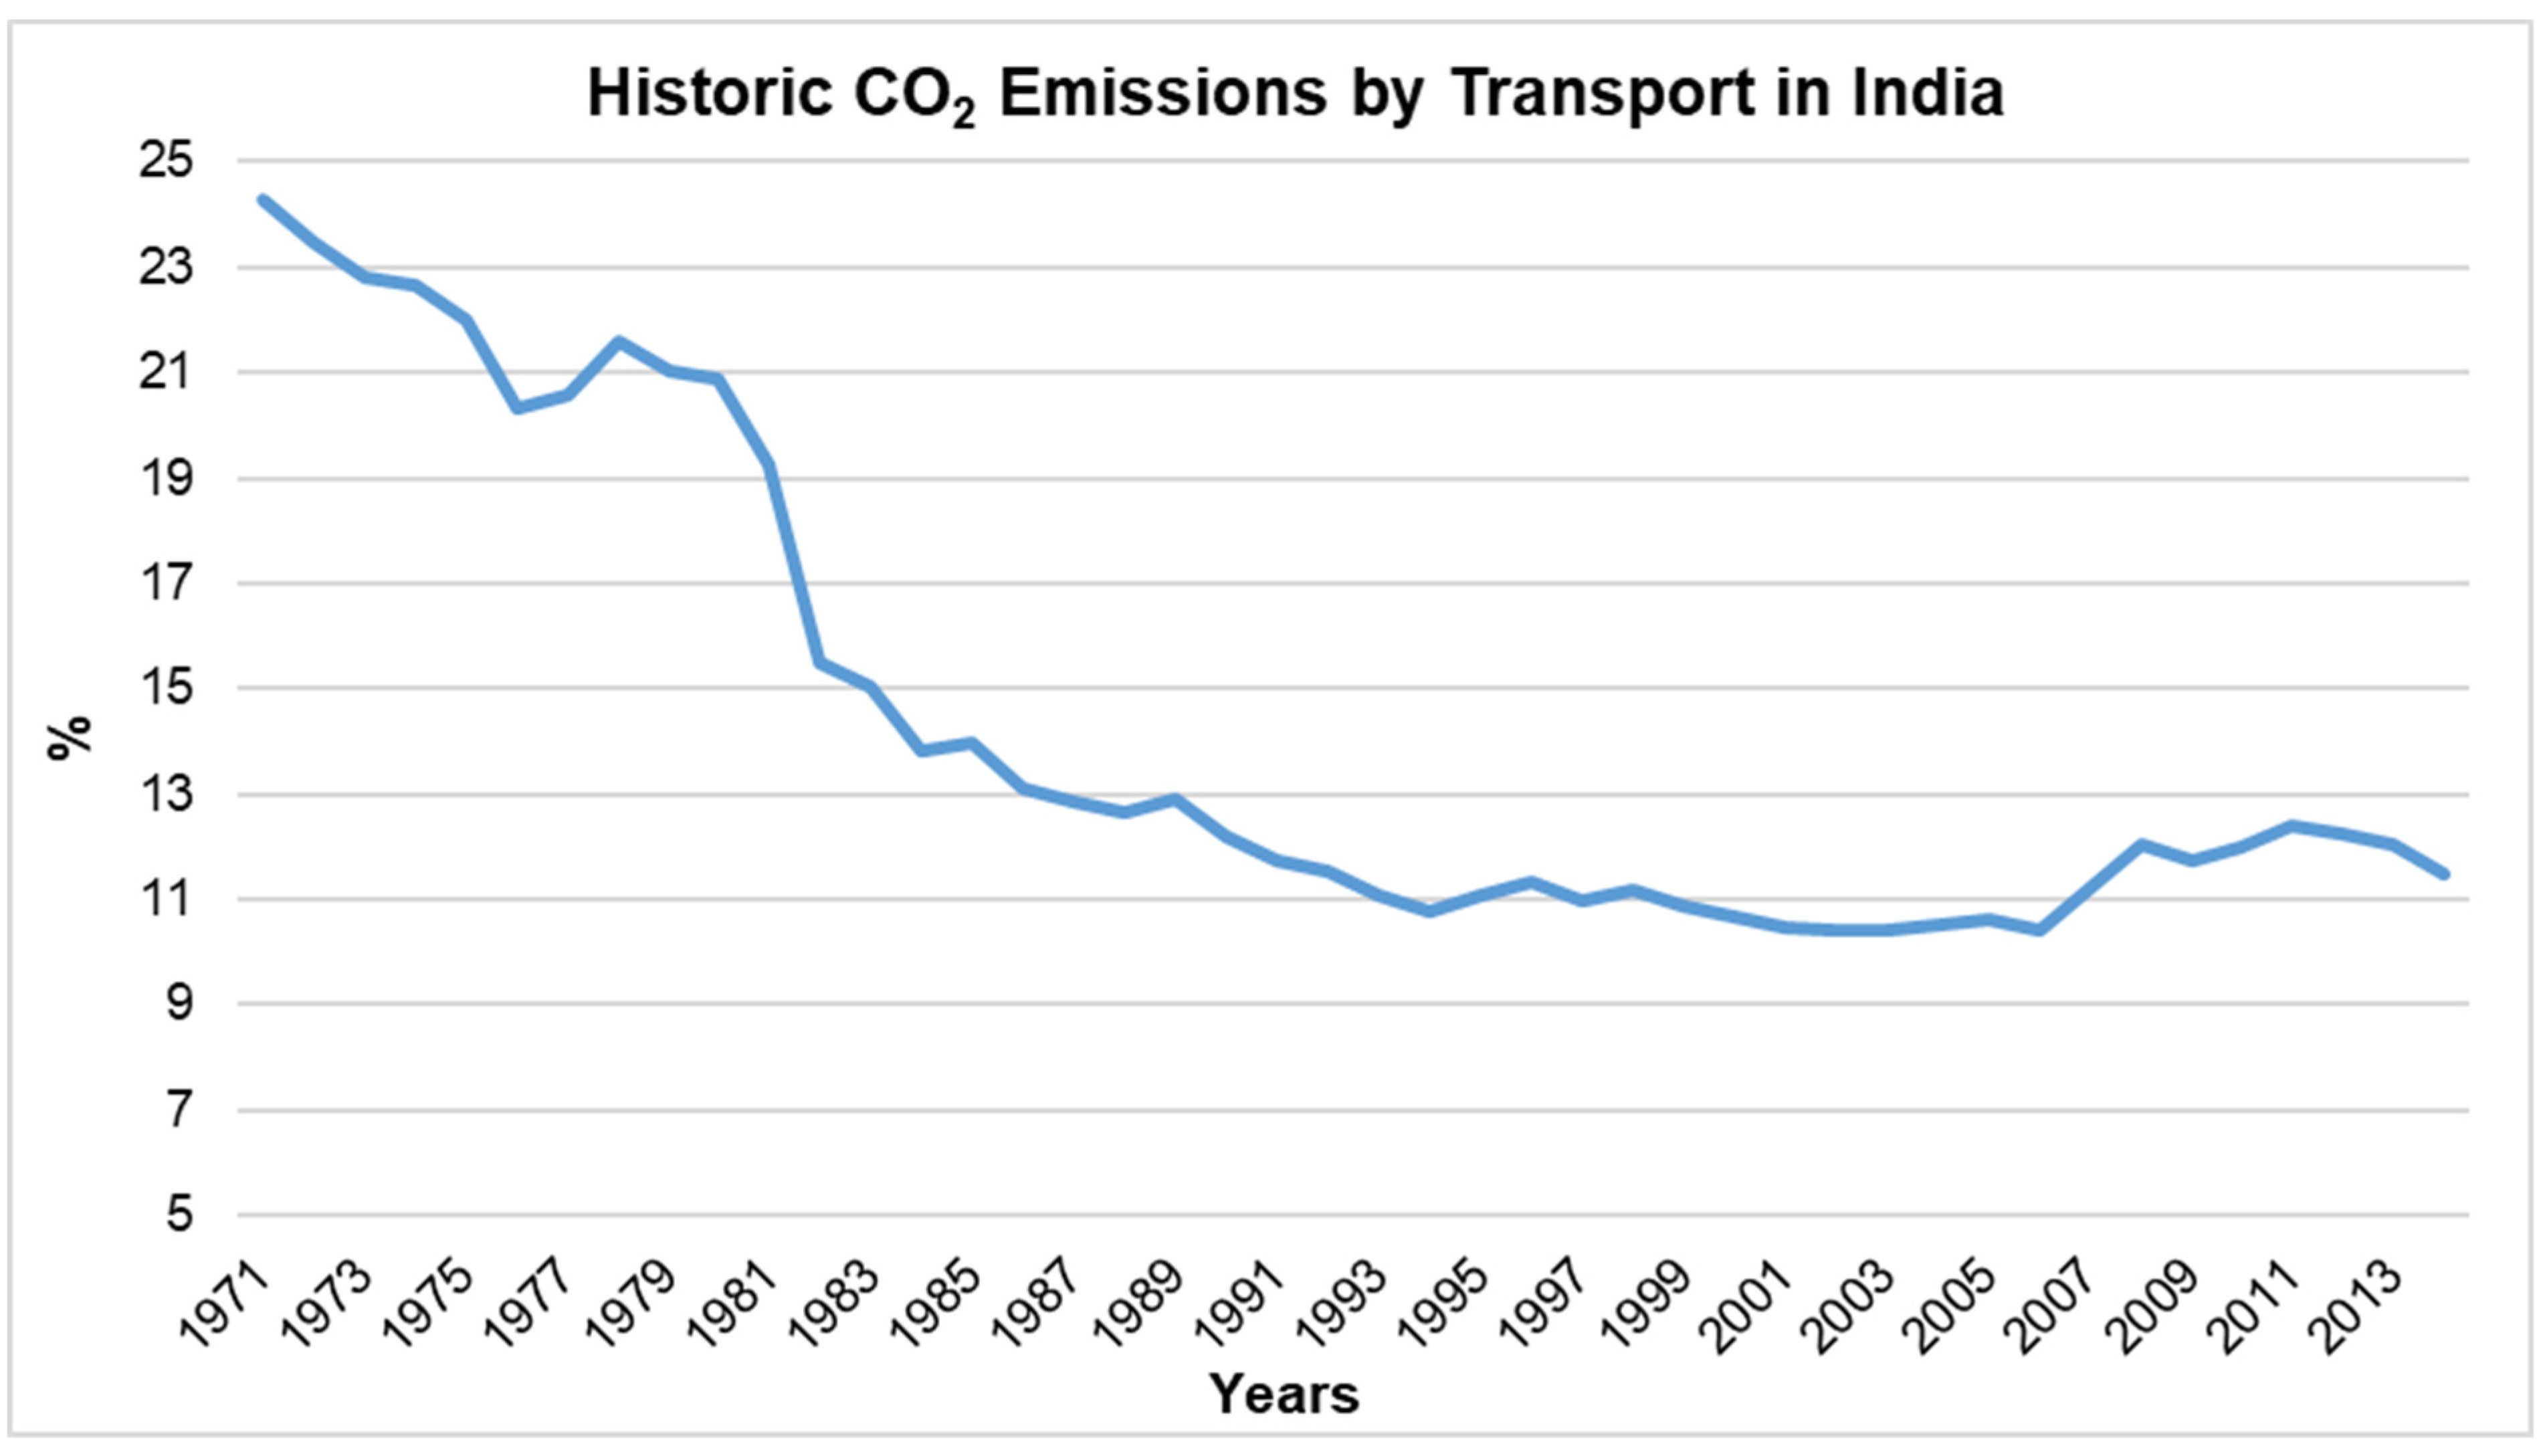
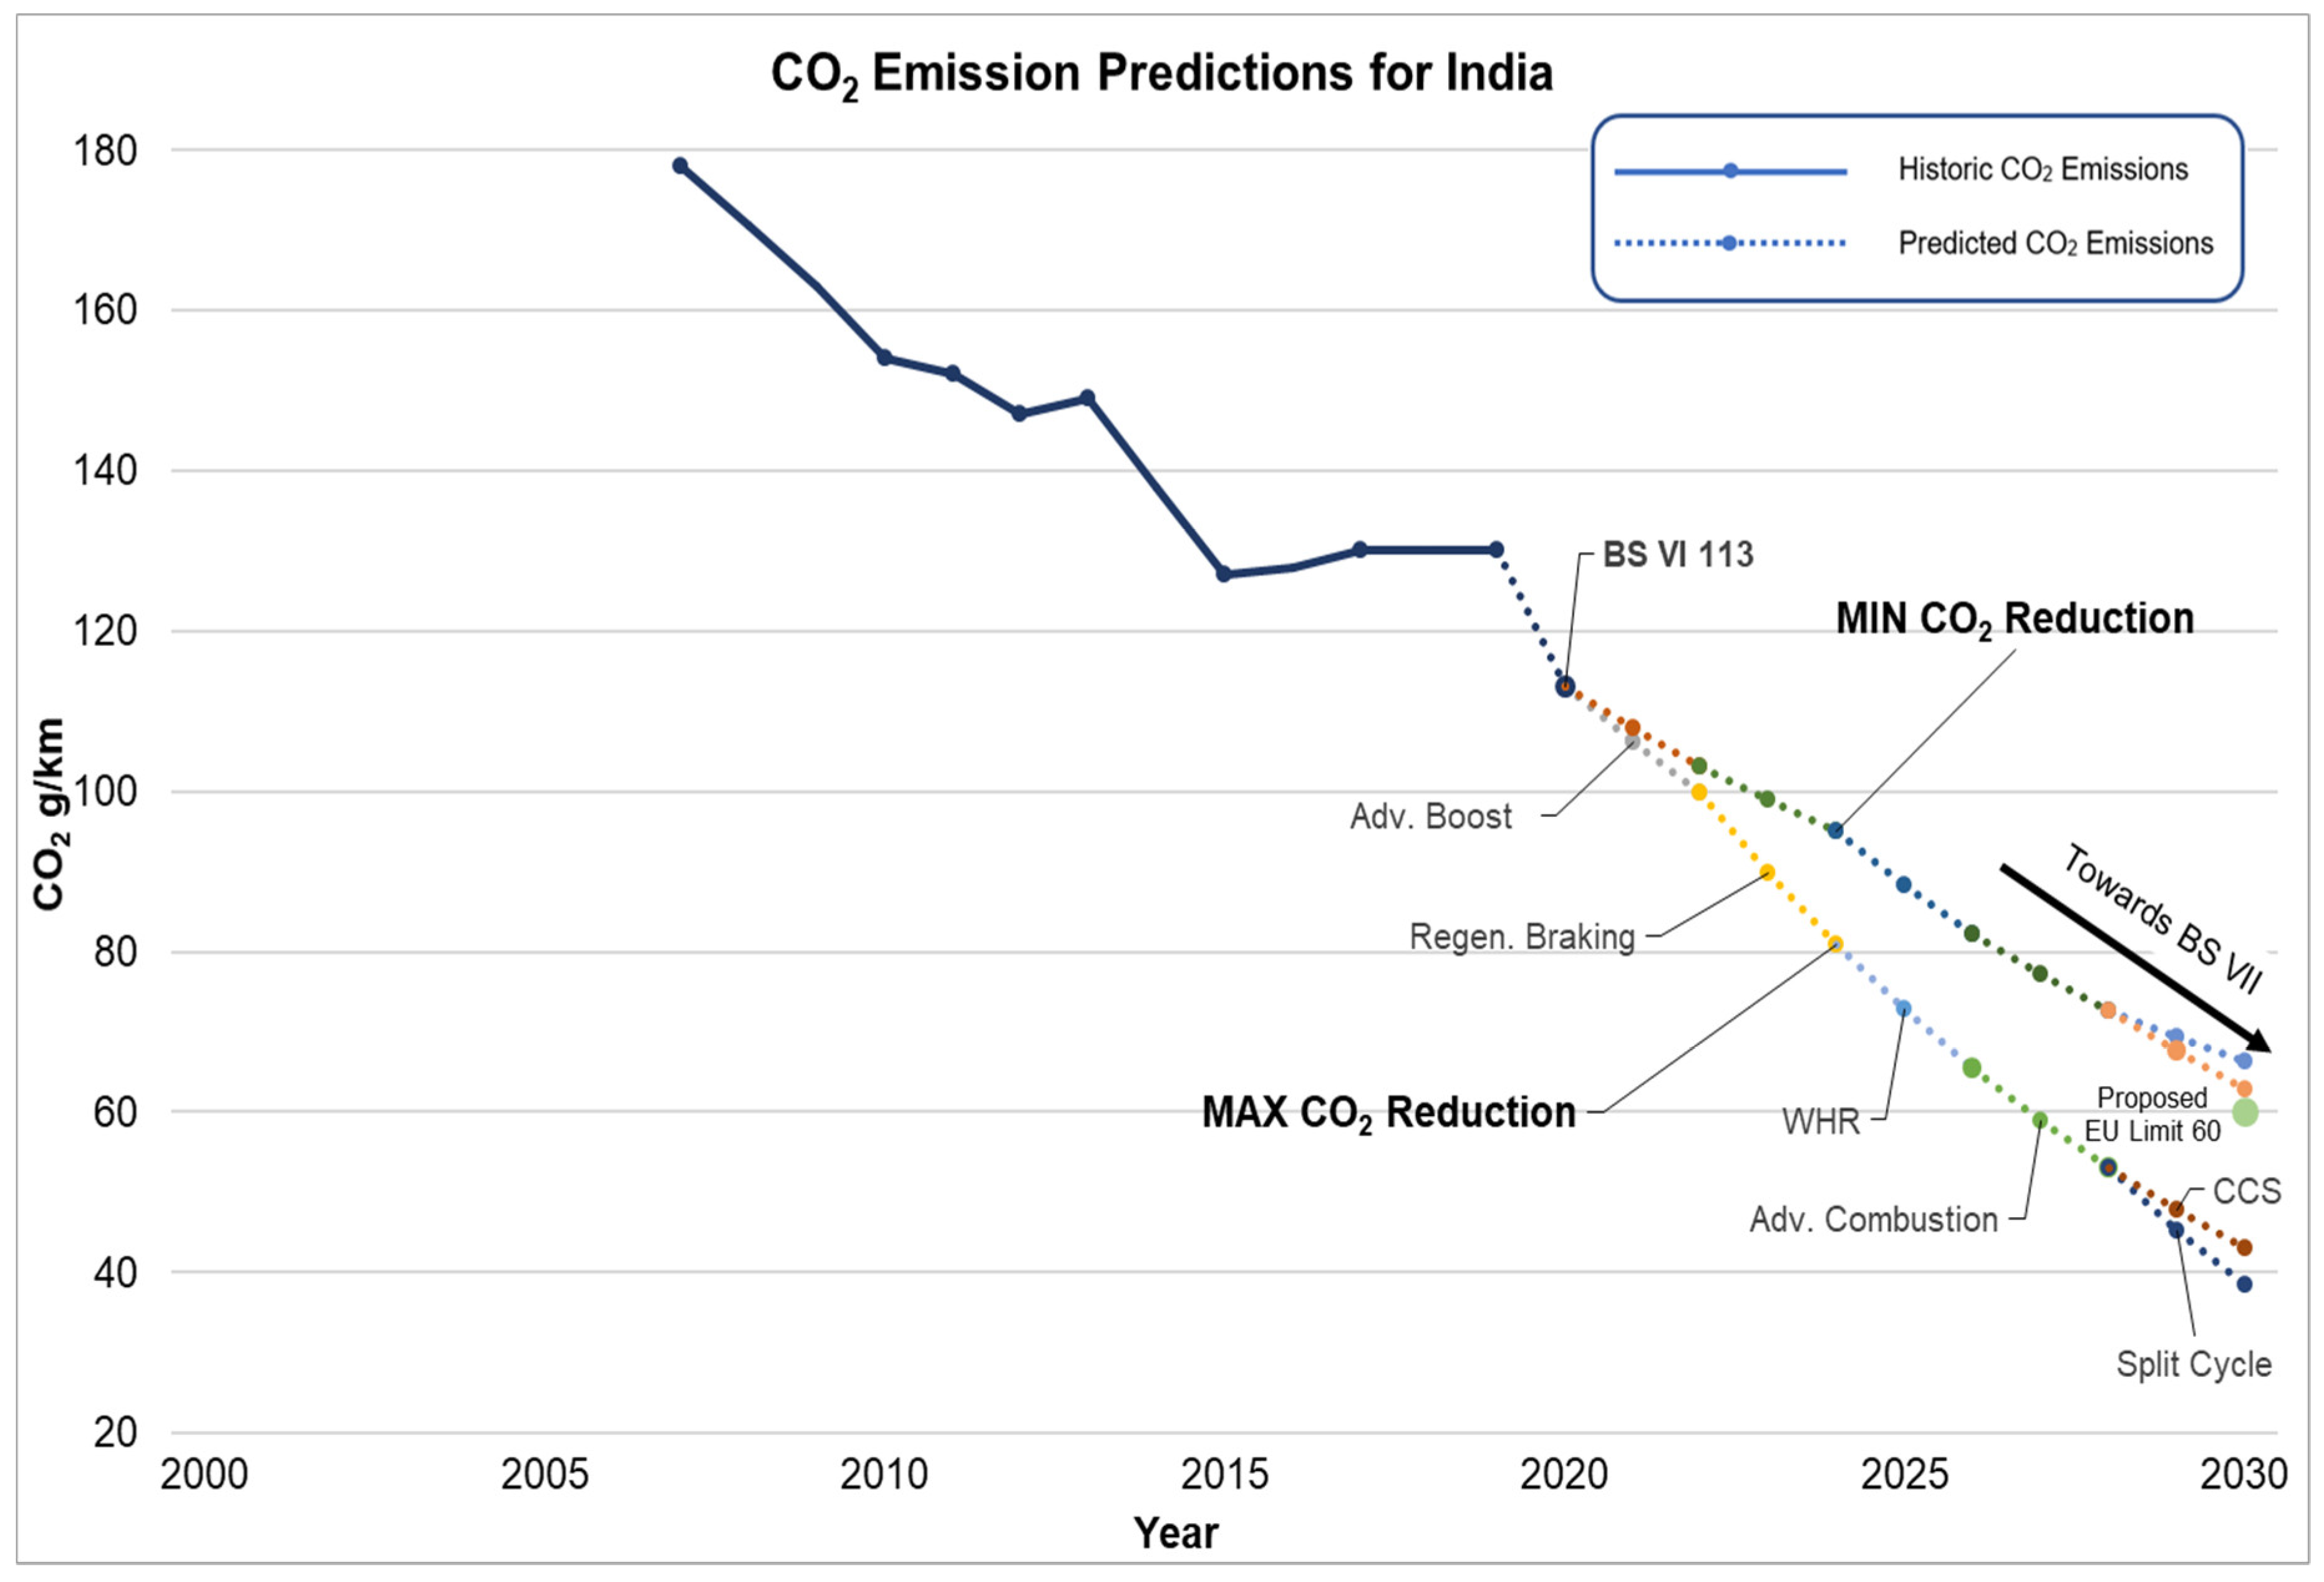
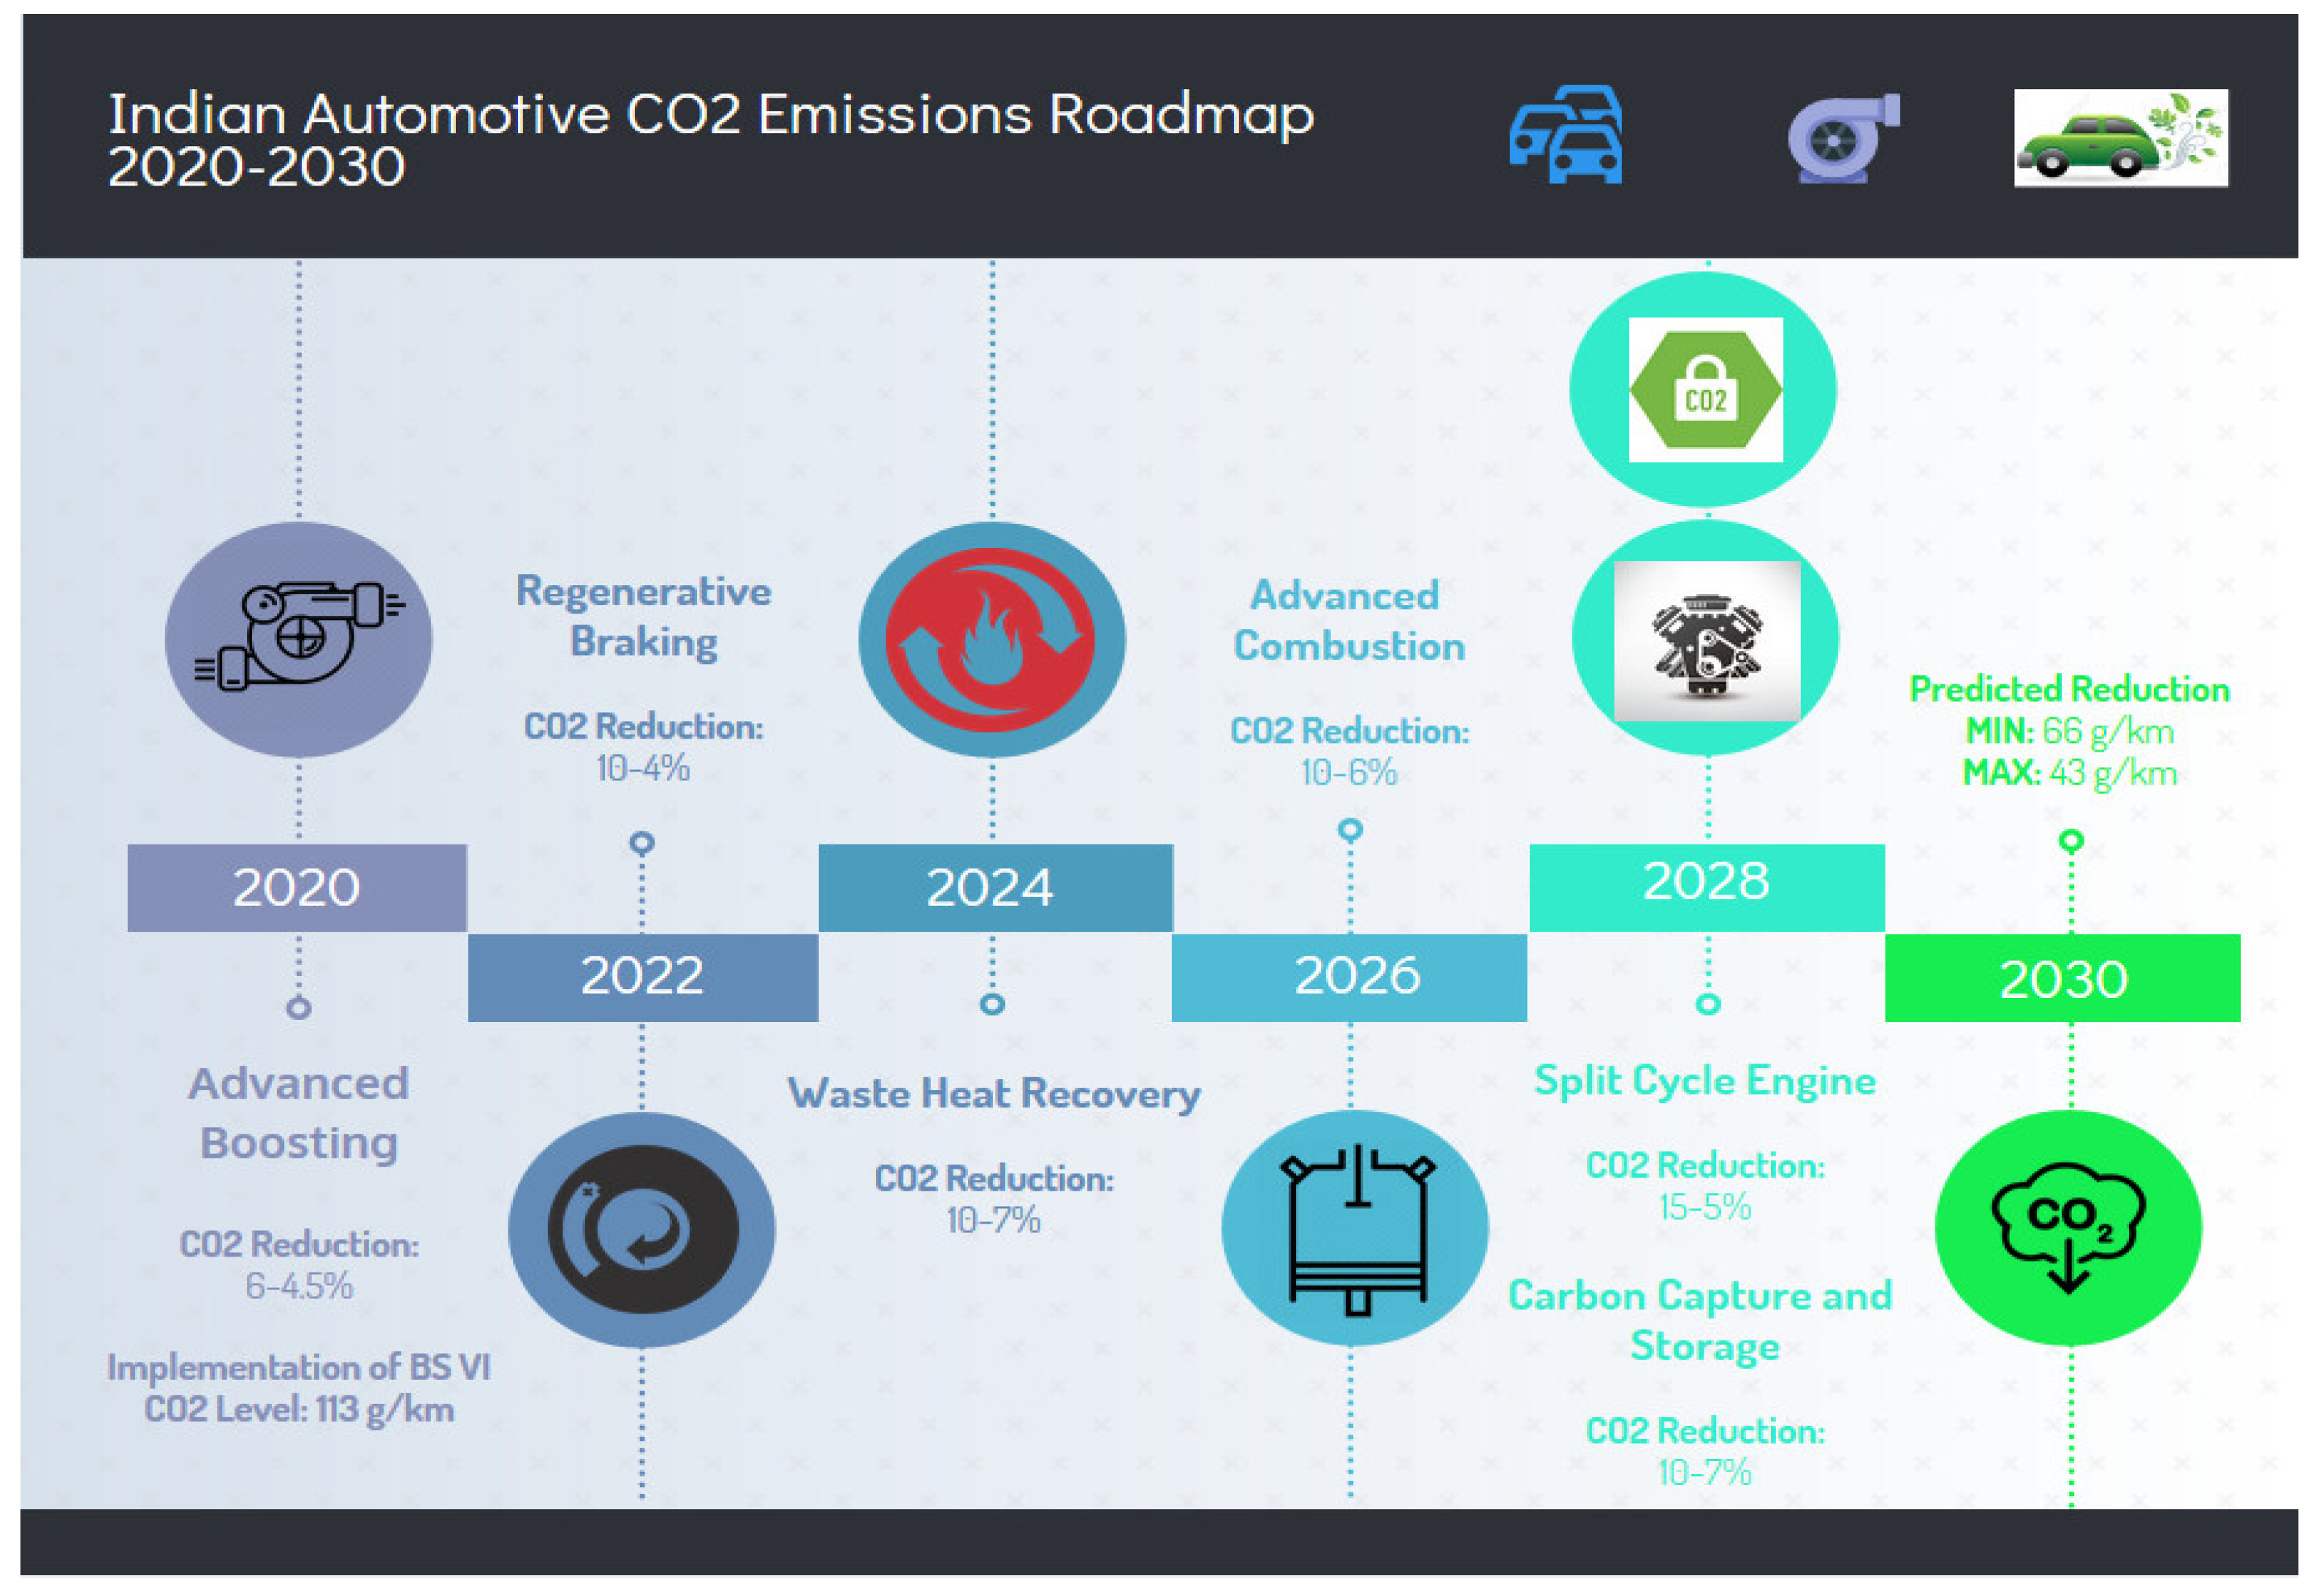
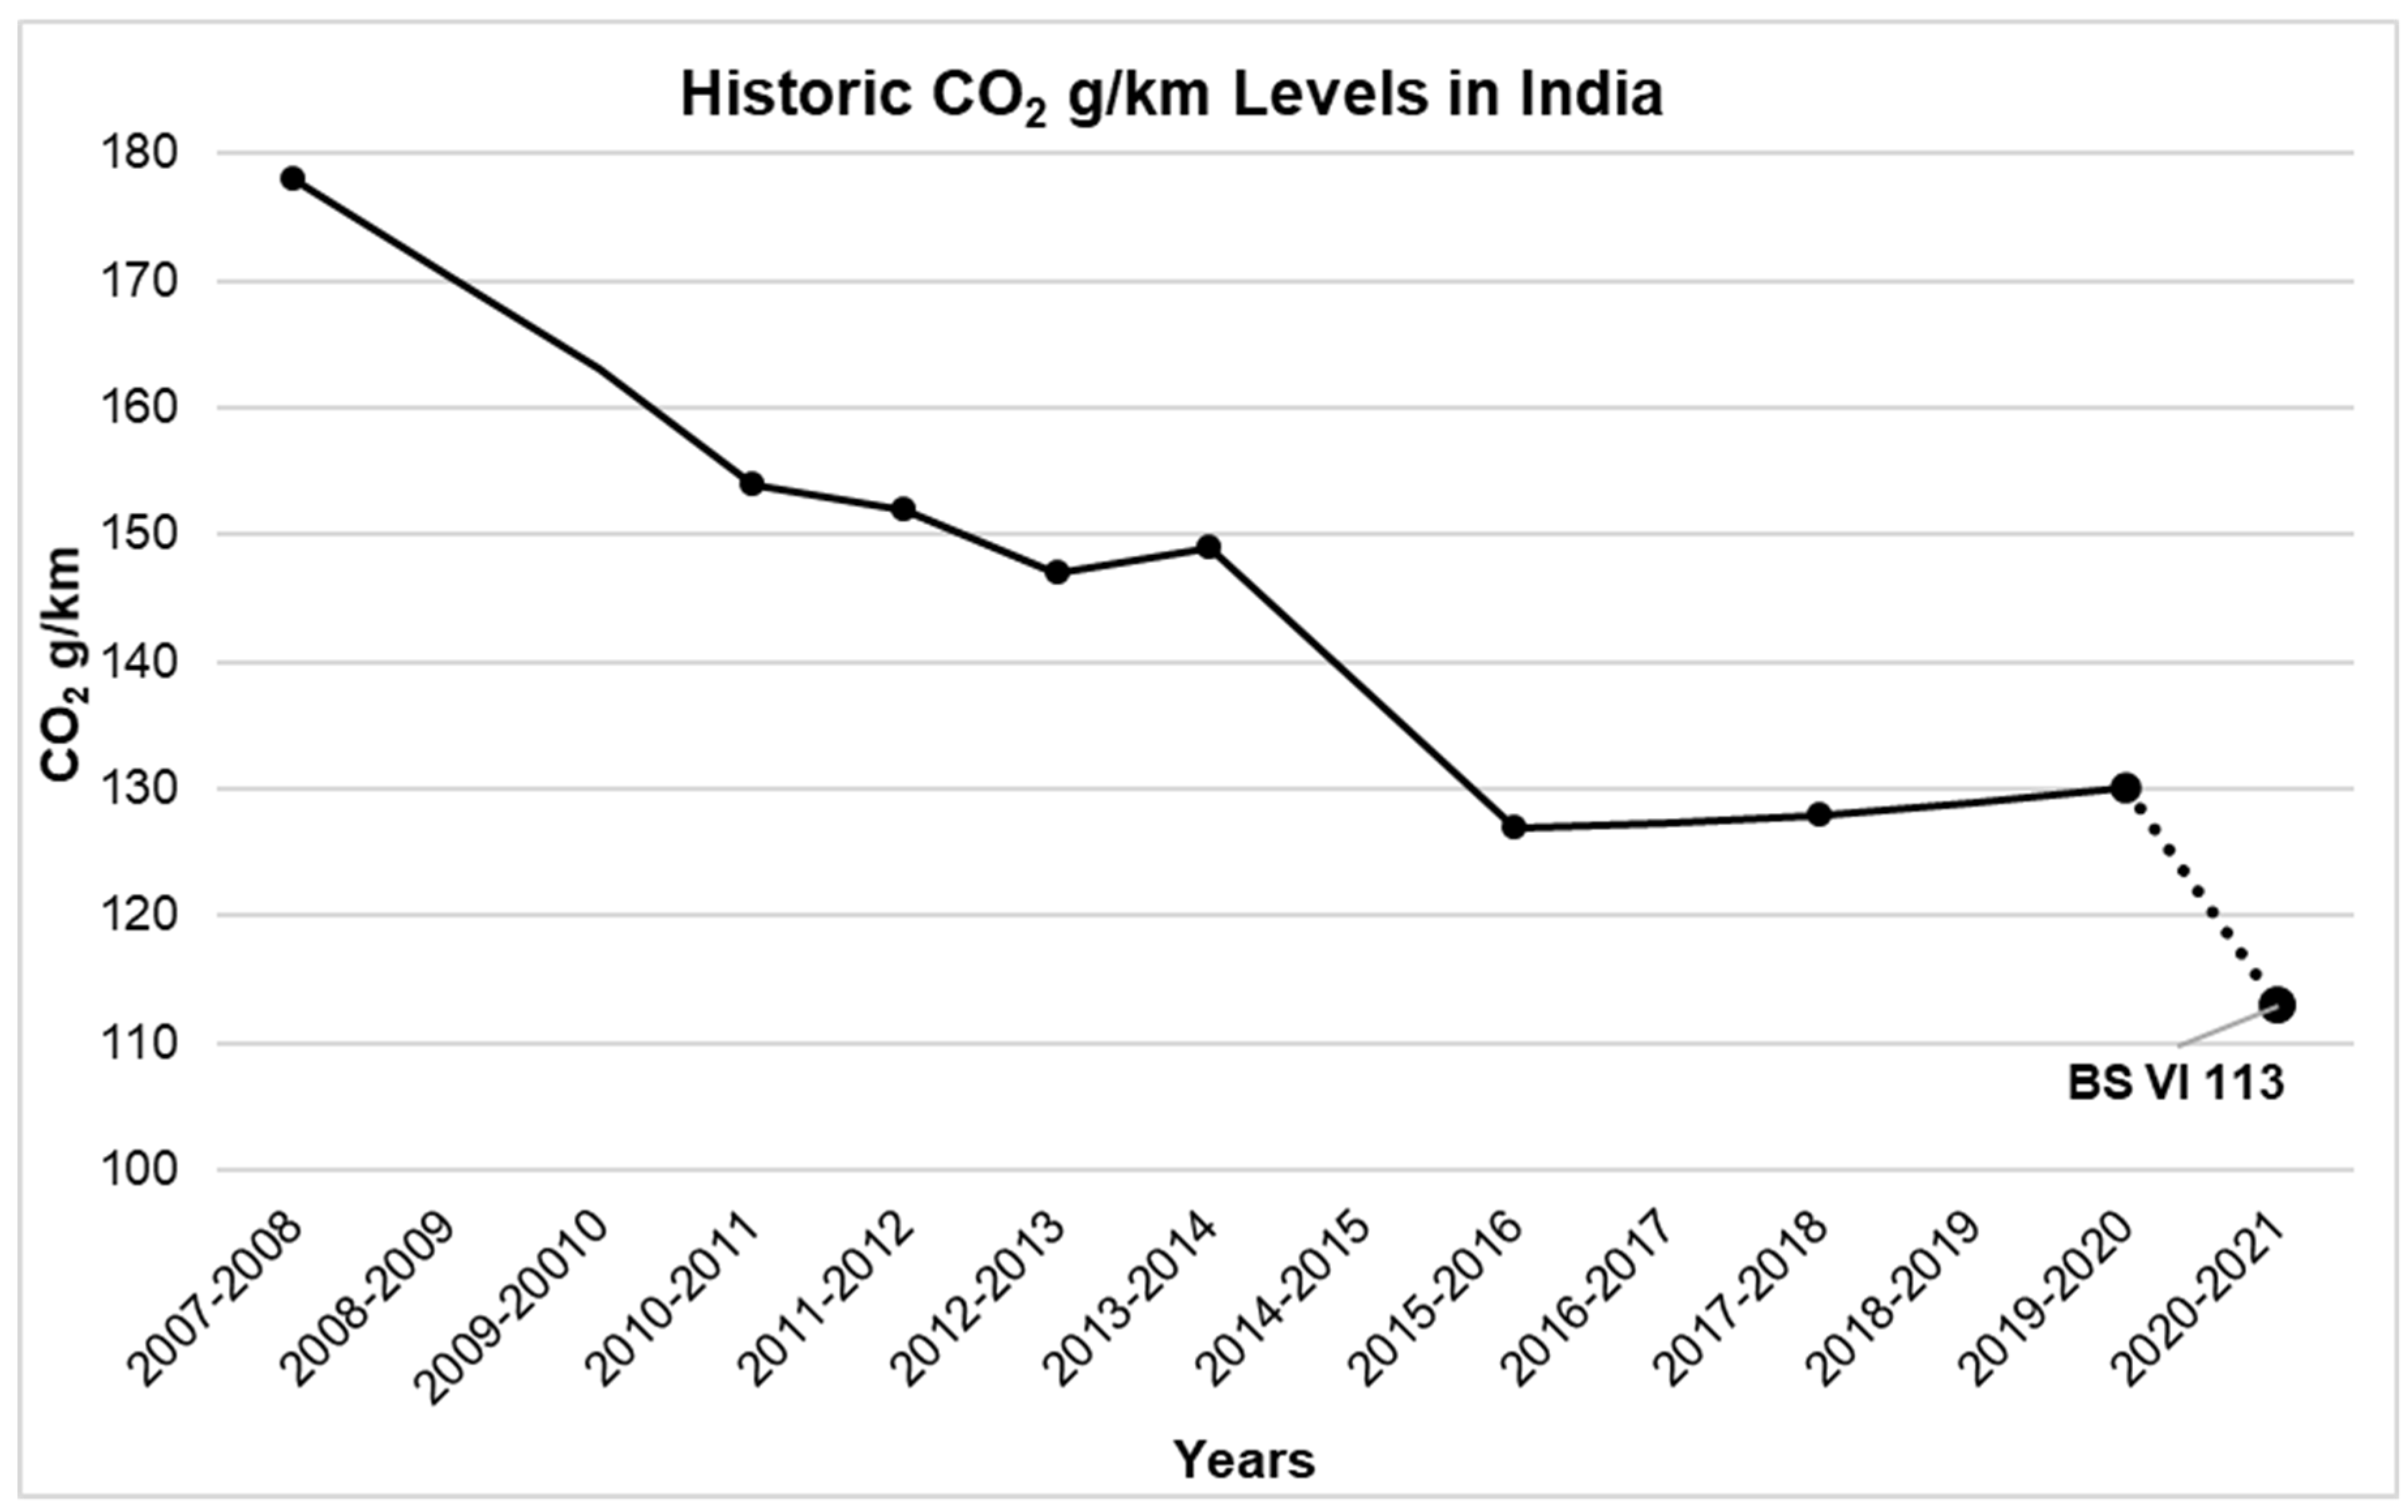
Table 1.
Vehicle Base Configurations.
| Vehicle Make | Engine Capacity (Litres) | Fuel Used | Fuel Density (kg/L) | Fuel Consumption (L/100 km) |
|---|---|---|---|---|
| Lotus | 1.6 | Diesel | 0.84 | 4.7 |
Table 2.
Calculation of CO2 Reduction through Fuel Consumption.
| Entities | WHR | Adv. Boost | Regen. Braking | Reference Engine |
|---|---|---|---|---|
| 1 L Diesel (g) | 840 | 840 | 840 | 840 |
| % Carbon in Diesel | 86.2 | 86.2 | 86.2 | 86.2 |
| Carbon in Diesel (g) | 724 | 724 | 724 | 724 |
| Oxygen Needed To burn Diesel (g) | 1920 | 1920 | 1920 | 1920 |
| CO2 gram per 1 L | 2644 | 2644 | 2644 | 2644 |
| Fuel Consumption L/100 km | 4.23 | 4.4 | 4.5 | 4.7 |
| CO2 g/L based on fuel consumption | 112 | 116 | 107 | 124 |
| CO2 % Reduction compared to Ref. Engine | 10% | 6% | 14% | - |
Table 3.
CO2 % Reduction of all the Technologies & its Implementation.
| Sr. No | Technology | CO2 Reduction | Year of Implementation |
|---|---|---|---|
| 1 | Advanced Boosting | 6–4.5% [54] | 2020–2022 |
| 2 | Regenerative Braking | 10–4% [46,47] | 2022–2024 |
| 3 | Waste Heat Recovery | 10–7% [27,53] | 2024–2026 |
| 4 | Advanced Combustion | 10–6% [36,41] | 2026–2028 |
| 5 | Split Cycle (CryoPower) | 11–6% [29,32] | 2028–2030 |
| 6 | Split Cycle (ThermoPower) | 15–5% [29,32] | 2028–2030 |
| 7 | Carbon Capture & Storage | 10–7% [15,16] | 2028–2030 |
Table 4.
CO2 Reduction in Advanced Boosting Technology.
| Adv. Boost | MAX Case % | MIN Case % | CO2 Reduction g/km MAX Case | CO2 Reduction g/km MIN Case |
|---|---|---|---|---|
| 2020 | 6% | 4.5% | 113 | 113 |
| 2021 | 6% | 4.5% | 106.22 | 107.92 |
| 2022 | 6% | 4.5% | 99.85 | 103.06 |
Table 5.
CO2 Reduction in Regenerative Braking Technology.
| Regen. Braking | MAX Case % | MIN Case % | CO2 Reduction g/km MAX Case | CO2 Reduction g/km MIN Case |
|---|---|---|---|---|
| 2022 | 10% | 4% | 99.85 | 103.06 |
| 2023 | 10% | 4% | 89.86 | 98.94 |
| 2024 | 10% | 4% | 80.88 | 94.98 |
Table 6.
CO2 Reduction in Waste Heat Recovery Technology.
| WHR | MAX Case % | MIN Case % | CO2 Reduction g/km MAX Case | CO2 Reduction g/km MIN Case |
|---|---|---|---|---|
| 2024 | 10% | 7% | 80.88 | 94.98 |
| 2025 | 10% | 7% | 72.79 | 88.33 |
| 2026 | 10% | 7% | 65.51 | 82.15 |
Table 7.
CO2 Reduction in Advanced Combustion Technology.
| Adv. Combustion | MAX Case % | MIN Case % | CO2 Reduction g/km MAX Case | CO2 Reduction g/km MIN Case |
|---|---|---|---|---|
| 2026 | 10% | 6% | 65.51 | 82.15 |
| 2027 | 10% | 6% | 58.96 | 77.22 |
| 2028 | 10% | 6% | 53.06 | 72.59 |
Table 8.
CO2 Reduction in Split Cycle Engine Technology.
| Split Cycle Thermo | MAX Case % | MIN Case % | CO2 Reduction g/km MAX Case | CO2 Reduction g/km MIN Case |
|---|---|---|---|---|
| 2028 | 15% | 5% | 53.06 | 72.59 |
| 2029 | 15% | 5% | 45.10 | 69.3 |
| 2030 | 15% | 5% | 38.34 | 66.2 |
Table 9.
CO2 Reduction in Carbon Capture and Storage Technology.
| CCS | MAX Case % | MIN Case % | CO2 Reduction g/km MAX Case | CO2 Reduction g/km MIN Case |
|---|---|---|---|---|
| 2028 | 10% | 7% | 53.06 | 72.59 |
| 2029 | 10% | 7% | 47.76 | 67.50 |
| 2030 | 10% | 7% | 42.98 | 62.78 |
© 2020 by the authors. Licensee MDPI, Basel, Switzerland. This article is an open access article distributed under the terms and conditions of the Creative Commons Attribution (CC BY) license (http://creativecommons.org/licenses/by/4.0/).
Share and Cite
MDPI and ACS Style
Gohil, D.B.; Pesyridis, A.; Serrano, J.R. Overview of Clean Automotive Thermal Propulsion Options for India to 2030. Appl. Sci. 2020, 10, 3604. https://doi.org/10.3390/app10103604
AMA Style
Gohil DB, Pesyridis A, Serrano JR. Overview of Clean Automotive Thermal Propulsion Options for India to 2030. Applied Sciences. 2020; 10(10):3604. https://doi.org/10.3390/app10103604
Chicago/Turabian StyleGohil, Dhrumil B., Apostolos Pesyridis, and Jose Ramon Serrano. 2020. "Overview of Clean Automotive Thermal Propulsion Options for India to 2030" Applied Sciences 10, no. 10: 3604. https://doi.org/10.3390/app10103604
Note that from the first issue of 2016, this journal uses article numbers instead of page numbers. See further details here.