Article

Enhanced out of Plane Electrical Conductivity in Polymer Composites Induced by CO2 Laser Irradiation of Carbon Fibers

by
Anastasios Karakassides
1,
Angeliki Karakassides
1,2,
Michaella Konstantinidou
1,2,
Alkiviadis S. Paipetis
2 and
Pagona Papakonstantinou
1,*
1
School of Engineering, Engineering Research Institute, Ulster University, Newtownabbey BT37 0QB, UK
2
Department of Materials Science and Engineering, University of Ioannina, 45110 Ioannina, Greece
*
Author to whom correspondence should be addressed.
Appl. Sci. 2020, 10(10), 3561; https://doi.org/10.3390/app10103561
Submission received: 2 May 2020 / Revised: 16 May 2020 / Accepted: 18 May 2020 / Published: 21 May 2020
(This article belongs to the Special Issue Multifunctional Composite Materials)

Abstract

:
The creation of a hierarchical interface between the carbon fiber (CF) and the epoxy resin matrix of fiber-reinforced polymer (CFRP) composites has become an effective strategy for introducing multifunctional properties. Although the efficacy of many hierarchical interfaces has been established in lab-scale, their production is not amenable to high-volume, continuous, cost effective fiber production, which is required for the large-scale commercialization of composites. This work investigates the use of commercially available CO2 laser as a means of nano-structuring the surface of carbon fiber (CF) tows in an incessant throughput procedure. Even though the single carbon fiber tensile strength measurements showed a decrease up to 68% for the exposed CFs, the electrical conductivity exhibited an increment up to 18.4%. Furthermore, results on laminates comprised of irradiated unidirectional CF cloth, demonstrated an enhancement in out of plane electrical conductivity up to 43%, while preserved the Mode-I interlaminar fracture toughness of the composite, showing the potential for multifunctionality. This work indicates that the laser-induced graphitization of the CF surface can act as an interface for fast and cost-effective manufacturing of multifunctional CFRP composite materials.

Graphical Abstract

1. Introduction

Composite materials, in particular carbon fiber reinforced polymers (CFRP), consisting of epoxy resin and carbon fibers (CFs) as reinforcement, are dominating the production of lightweight components for the aeronautics [1], marine [2], automotive [3], and wind energy [4] markets. This gradual domination of CFRP over metallic structures in the above industries, is mainly driven by the requirement for reduced body-mass parts, which leads to decreased fuel consumptions and, in turn, fuel cost and CO2 emissions. A consequence of this persistent requirement for larger weight reductions, leads to the need for expanding CFRP’s multifunctionality, to achieve improved system designs. For instance, external functions such as structural health monitoring [5], energy storage [6], strike light protection [7], electromagnetic shielding [8], and actuation [9] can now be successfully integrated into composite structures.
A strong fiber–matrix interface is an important aspect for maximizing the structural performance of CFRP. Introducing nanostructures on the fiber, such as oriented carbon nanotubes (CNTs) [10,11,12,13,14,15,16], graphene nanoflakes (GNFs) [17,18,19], or metal oxide nanowires [20,21,22,23,24,25] has proven an effective technique for simultaneously enhancing the interfacial properties of CFRP composites and imparting additional functionalities (e.g., enhanced electrical conductivity, piezoelectricity, etc.) by creating a hierarchical structure at the fiber–matrix interface region. Laboratory-scale procedures have fabricated hierarchical interfaces on fibers with remarkable multifunctional properties; however, these processes are not amenable to high-volume, continuous fiber manufacturing, which is essential for the commercialization of nano-engineered CFRP. The challenge lies in successfully integrating these hierarchical reinforcing structures, to offer scalability and economic sustainability to advance towards commercialization. One potential route for tackling this challenge is the laser-induced modification of bare CFs, which is rather unexplored so far.
The utilization of pulsed lasers for the surface modification of CFRP composites in joining applications has gained increasing attention in the last decade [26,27,28,29]. Being a non-contact technique, laser treatment diminishes mechanical failure and evades tool wear and surface contamination, which are common problems encountered with mechanical approaches like abrading [30] and blasting processes [31]. However, reducing the heat-affected zone (HAZ) in CFs induced by the thermal nature of the laser/material interactions remains an obstacle. Along these lines, ultrafast lasers operating in the picosecond or femtosecond (fs) pulse duration regimes are the most efficient for CFRP surface texturing and improving adhesive bonding between CFRP parts in terms of Mode I and II fracture energy [32,33,34], since the HAZ and mechanical degradation on the CFs are minimal.
The direct writing of fs-laser-induced periodic surface structures (LIPSSs) on CFs is a single step process using linearly polarized irradiation and has gained increased attention. It is well-known that their formation mechanism is attributed to a spatially modulated energy pattern, formed by the interference of the incident laser irradiation with surface electromagnetic waves [35]. Tensile tests on single carbon fibers (10 µm diameter) decorated with LIPSS of approximately 150 nm revealed that fs irradiation preserved the tensile strength of the exposed fibers [36]. Even-though fs-laser processing seems promising, its adoption in commercial CFRP manufacturing is prohibited by their high cost and reduced availability for roll to roll processing.
On the other hand, continuous wave (CW) infrared lasers, such as CO2, are widely commercially for micromachining applications at moderate prices. However, material–laser interactions are dominated by heating effects. So far, the irradiation of CFs with commercially available CO2 or Nd:YVO4 laser beam sources have focused on intense laser conditions suitable for cutting of the CFs rather on inducing surface texturing [37]. Under Nd: YVO4 laser irradiation conditions, CFs exhibited decrement in the tensile strength up to 75% and a reduction in stiffness by 17%.
The current work systematically investigates the effect of CO2 laser irradiation on CF tow and unidirectional carbon cloth under conditions suitable for inducing CF surface texturing without breaking the fibers. The uniformity and the texturing changes due to laser exposure were examined through Raman spectroscopy and SEM analysis. The mechanical properties of the irradiated CFs were examined via single carbon fiber tensile strength tests on CFs and Mode-I interlaminar fracture toughness measurements on their laminated structures. Electrical conductivity tests on both CF samples and their CFRP were performed in order to identify any changes in conductive paths that could potentially be introduced by the laser texturing.

2. Materials and Methods

2.1. Materials

In this work, two different kinds of carbon fibers were used—(i) polyacrylonitrile based (PAN) carbon fiber (Torayca T700SC, supplied from Toray, Japan) tows consisting of 12,000 fibers, having a 1.2 wt % sizing (Bisphenol A epoxy + Unsaturated polyester) designed for epoxy and polyester matrices (denoted as TCF). Each fiber had a diameter about 7 μm. (ii) Unidirectional unwoven carbon fiber (UD) (Pyrofil TR50S 15K, Mitsubishi Chemical Corporation, Tokyo, Japan) with textile weight of 100 g m² and a diameter of about 7 μm (denoted as PCF). The conductive silver paint (PELCO Conductive Silver Paint) used for the electrical conductivity measurements was supplied by Agar Scientific Ltd. The epoxy resin system selected for the fabrication of CFRP laminates was an IN2 Epoxy infusion resin with an AT30 slow hardener from Easy Composites Ltd. (Easy Composites Ltd., Longton, Stoke on Trent, Staffordshire, UK)

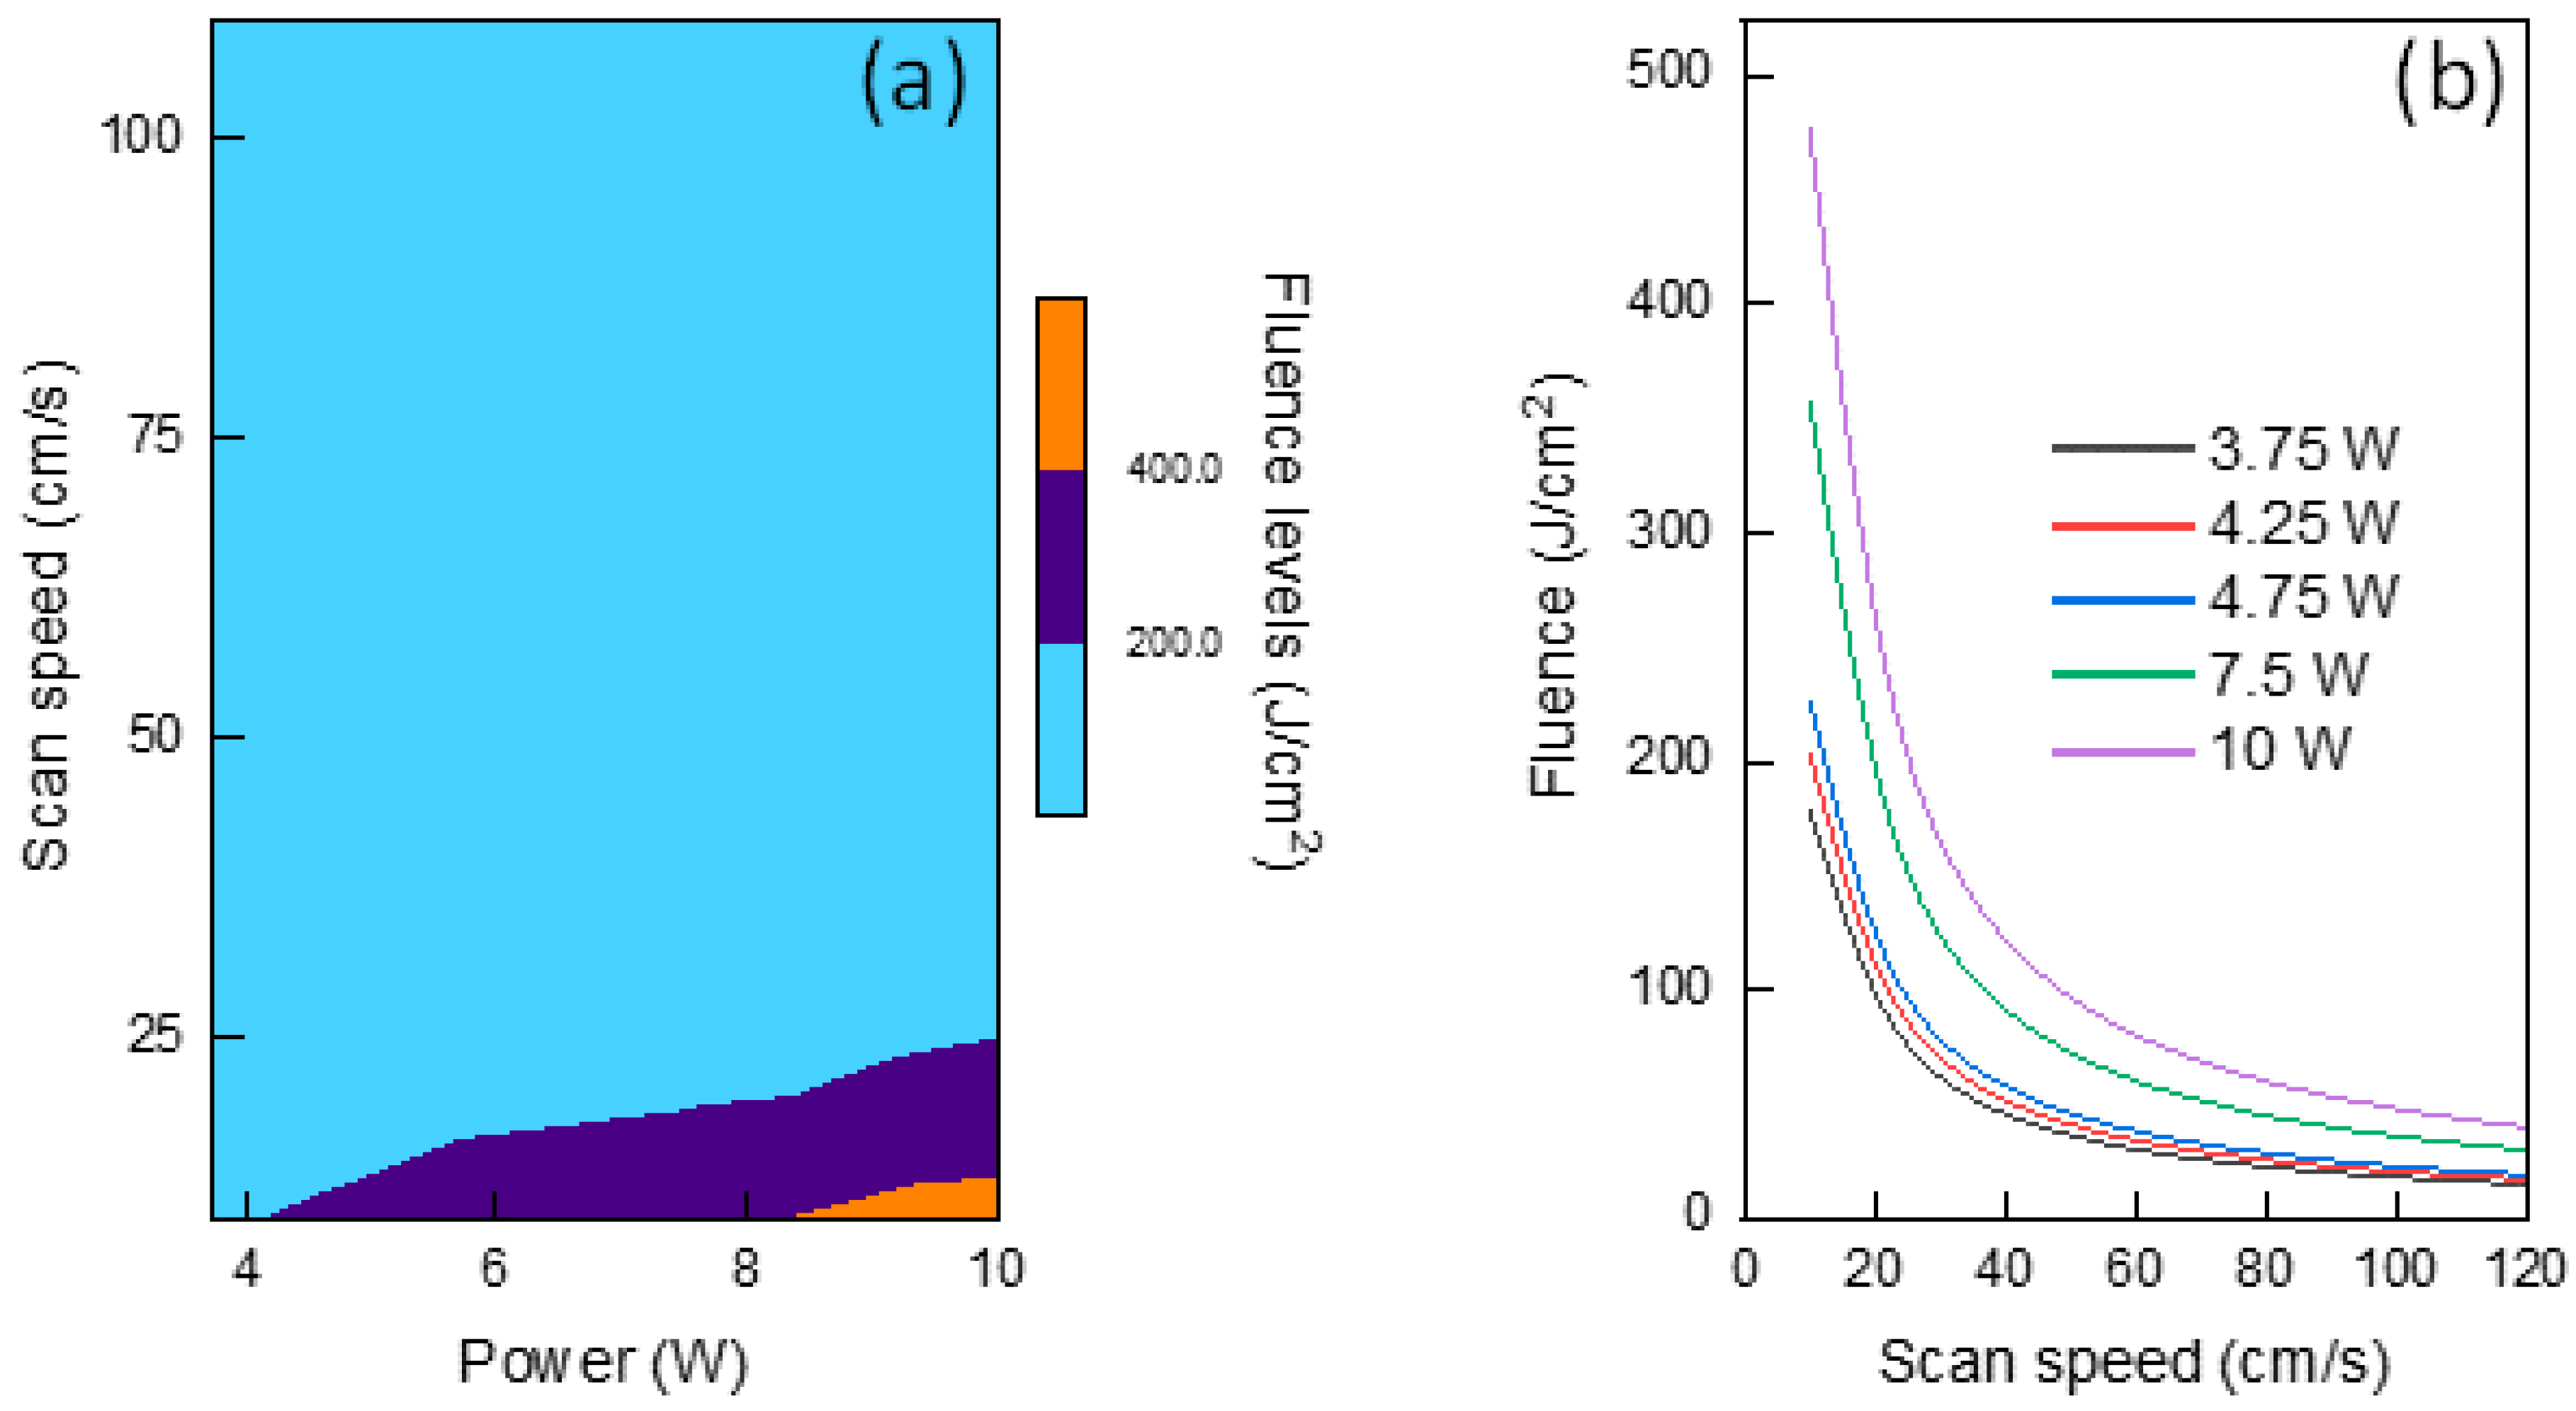
2.2. CO2 Irradiation/Activation of the CFs
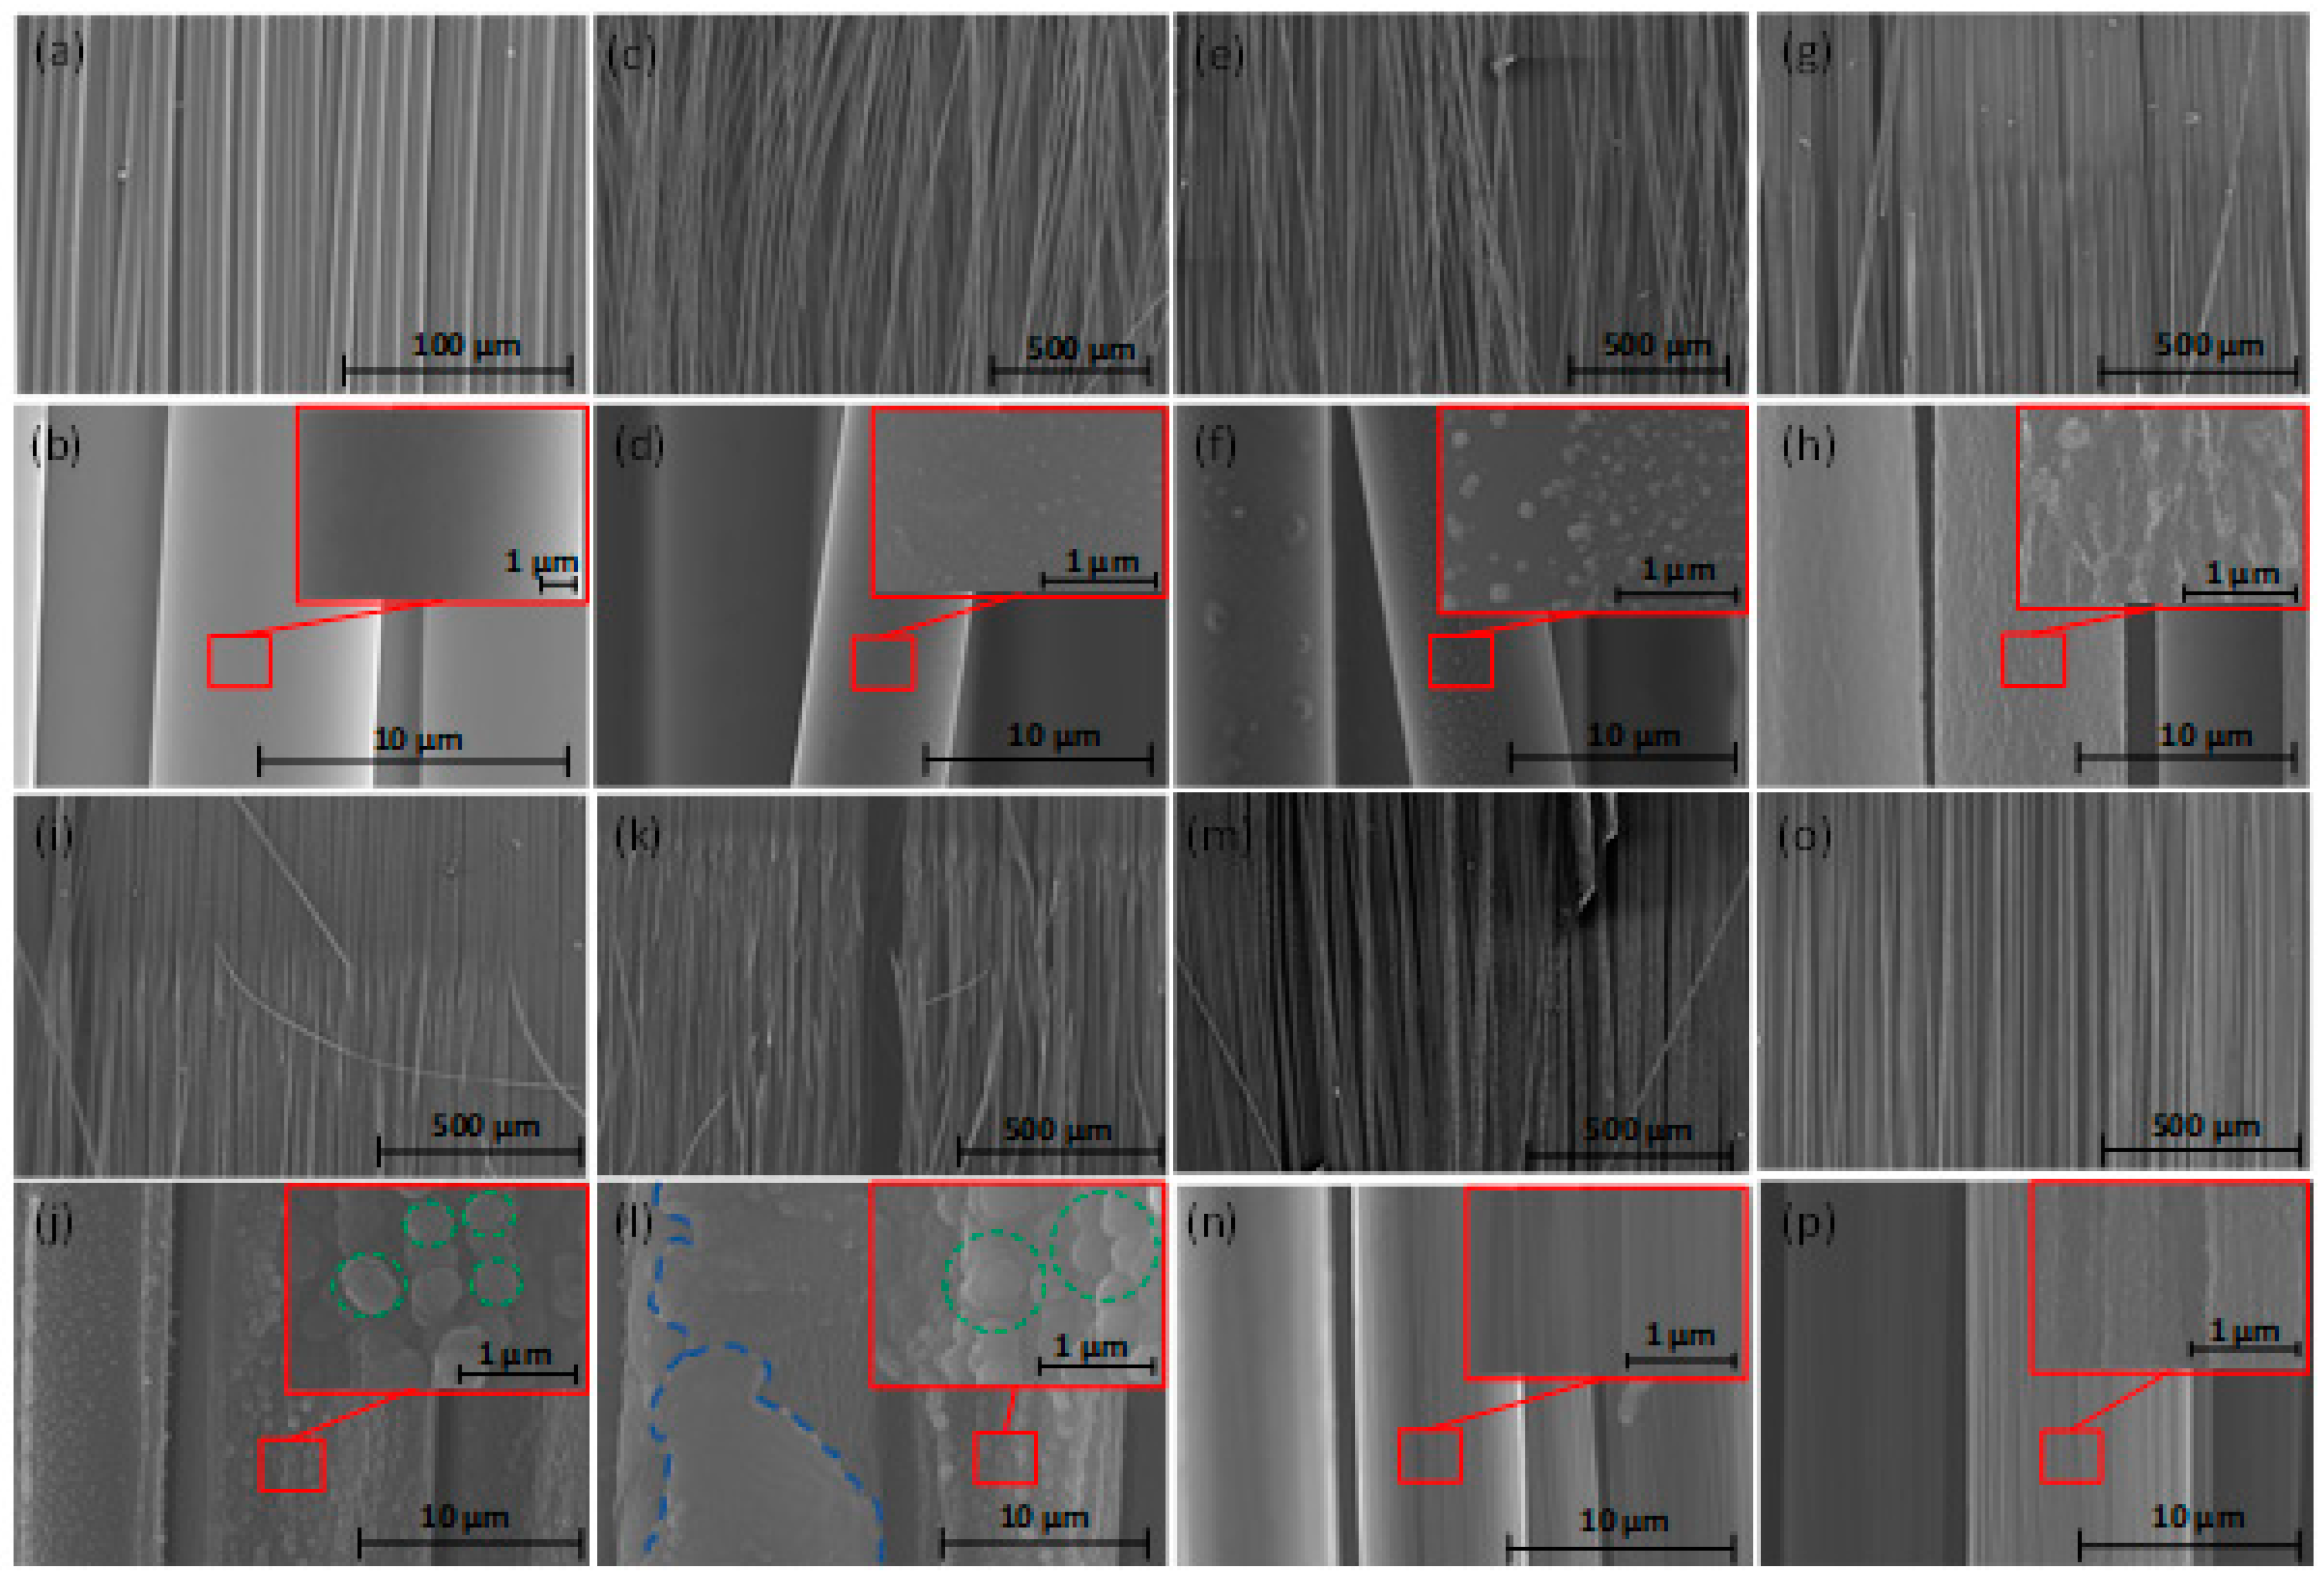
The laser system used for the investigation of the surface modification of the CFs was a carbon dioxide (CO2, VersaLASER® VLS2.30, Universal Laser Systems, Inc., Vienna, Austria) laser that emits infrared radiation at a wavelength of 10.6 microns, operating at a maximum power of 25 W and maximum scan speed of 126 cm s−1.

2.3. SEM Analysis

The surface morphology of the irradiated CF yarns and delaminated specimens was inspected with a field emission scanning electron microscope FESEM, (HITACHI SU5000, Tokyo, Japan) operated at an accelerating voltage of 10 kV (irradiated CF yarns) and 1 kV (delaminated samples). Micrographs were acquired along CF yarns in order to determine any possible changes of the irradiated areas, as well as at the interlaminar region of the tested laminates, to identify the mechanism of CFRP delaminating procedure.

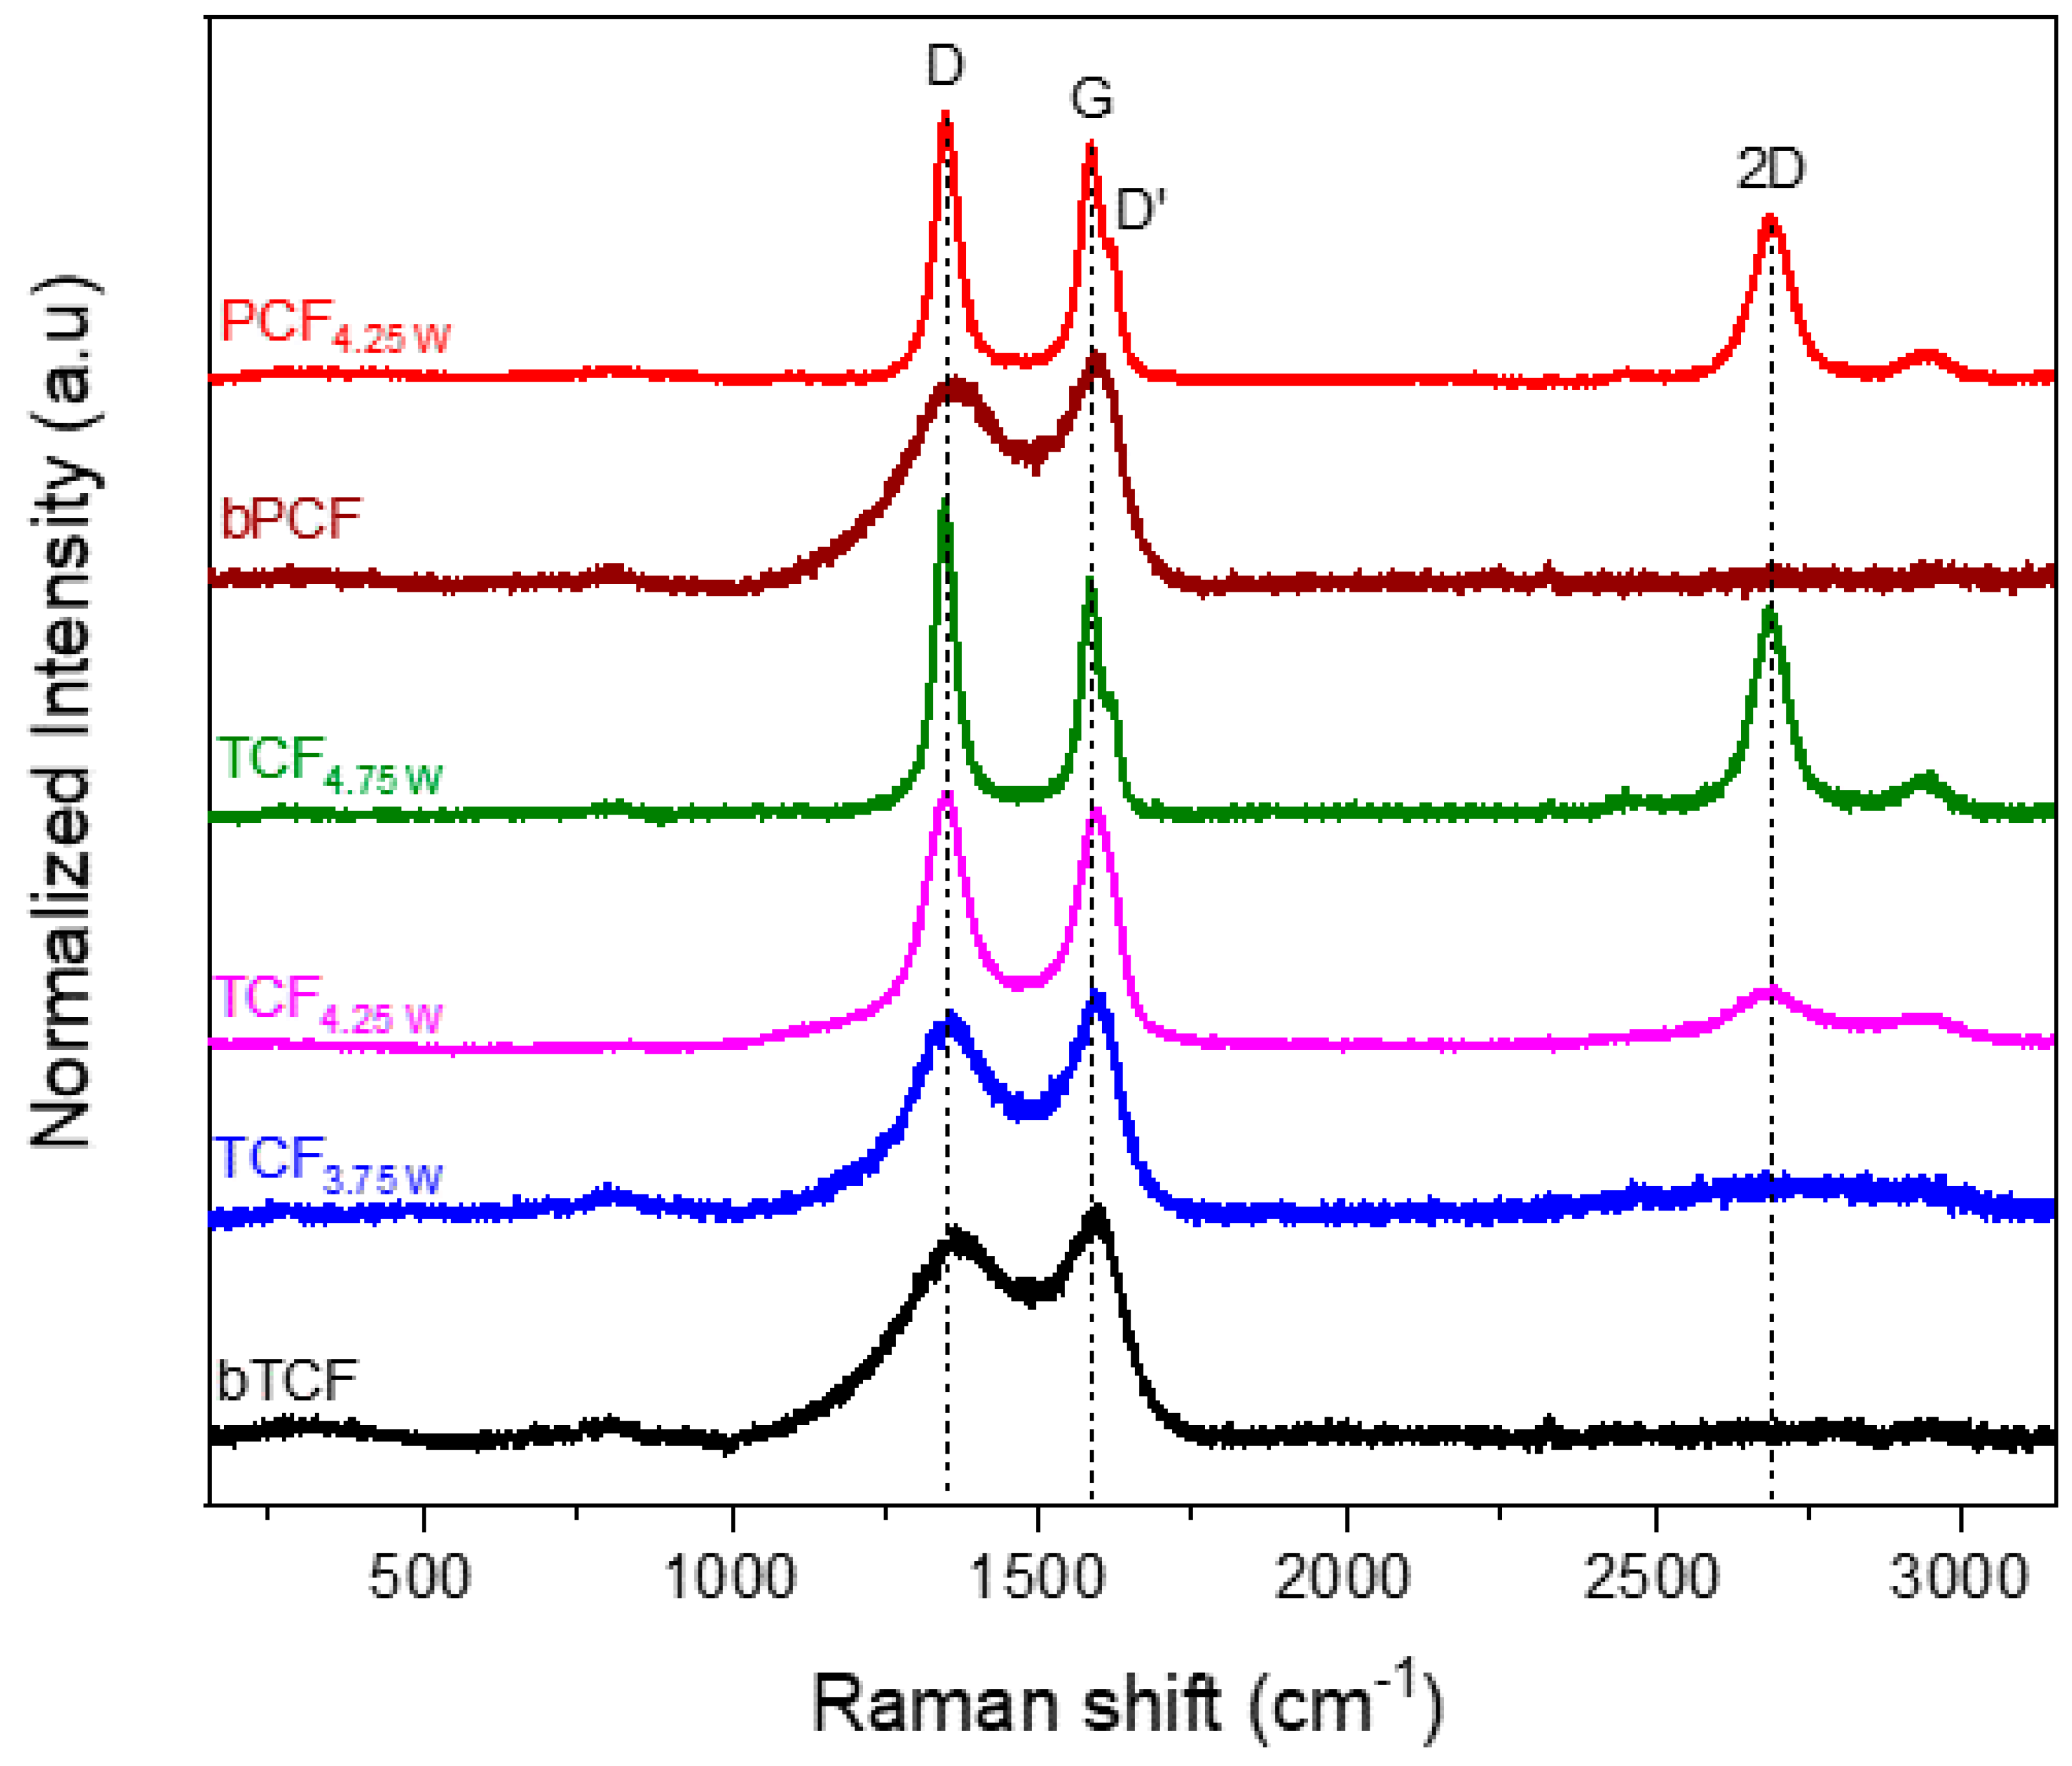
2.4. Raman Characterization

Raman characterization was used to assess the laser induced structural changes and uniformity of the CFs’ surface “roughening,” using an excitation wavelength of 532 nm (RL532C laser source) at a Renishaw Invia Qontor system (Renishaw plc, Gloucestershire, Wotton-under-Edge, UK).

2.5. Single Carbon Fiber Tensile Strength Measurements

Tensile tests on single CFs were carried out on a Deben Ltd. Microtester (Deben UK Ltd., London, UK) with maximum load capacity of 5 N. Ultimate strength and failure strain were calculated according to ASTM C 1557 – 03 [38]. In order to study the laser irradiation effect on different fibers, single CF tensile tests were carried out on both T700SC and TR30S CFs. The designated motor-speed was set at 0.1 mm·min−1 and the data acquisition time at 100 ms. The ultimate tensile strength of the fibers was calculated as follows:
T = F A
where T (Pa) is the ultimate tensile strength, F (N) is the force to failure and A (m2) is the CF’s cross-sectional area at fracture plane (normal to fiber axis). The CF’s cross-sectional area (A) was calculated as illustrated below.
A = π d 2 4
where d (m) is mean diameter of irradiated fiber. The strain (ε) of the fiber was calculated using the following formula:
ε = Δ l l 0
where Δl (mm) is the elongation of the gauge length and l0 (mm) is the gauge length.

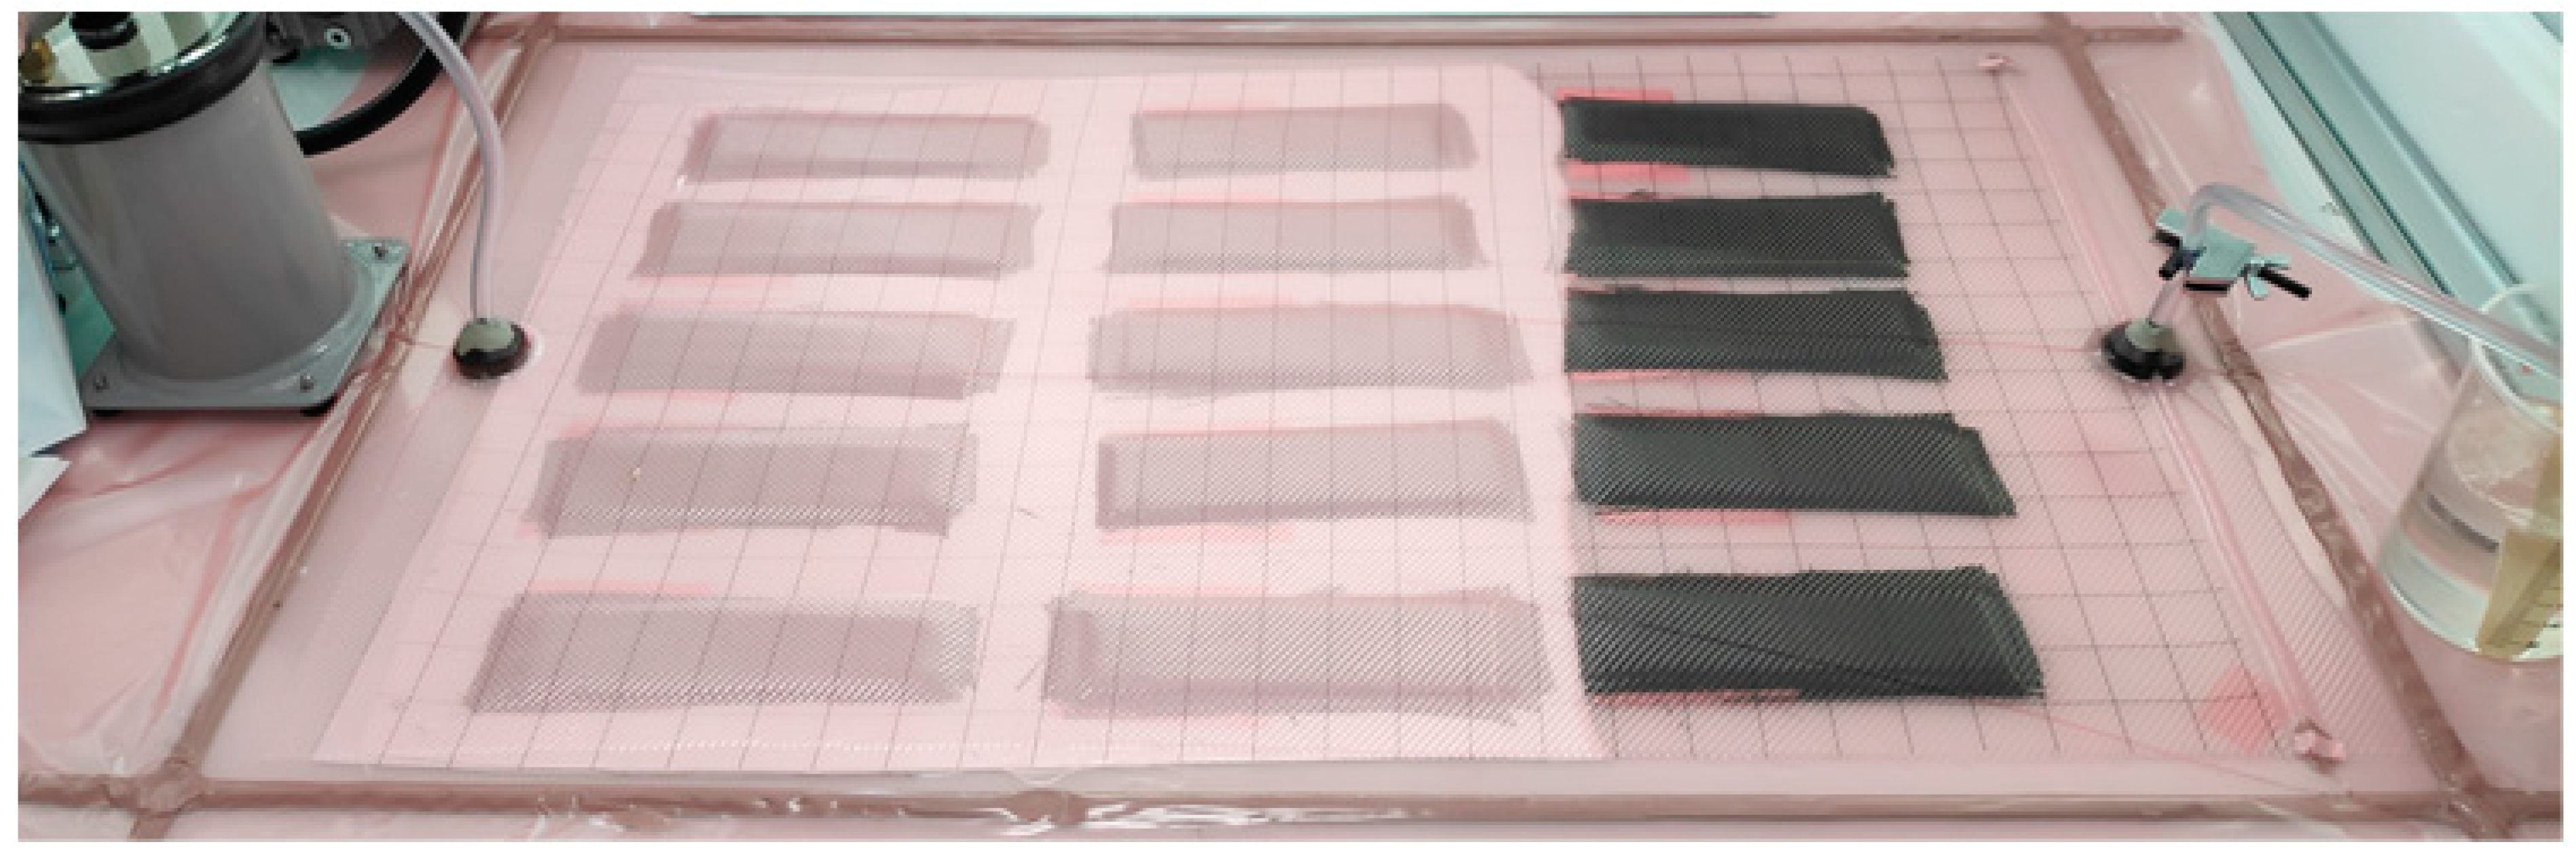
2.6. Laminate Preparation

The CFRP laminates were fabricated following a vacuum-assisted resin transfer molding process (VARTM). A crucial part of the procedure is the evacuation, or elimination, of the air from the porous material prior to the resin introduction. VARTM procedure encompasses a number of assets, when compared to other conventional lamination processes (wet lay-up, prepreg, hot press lamination, filament winding, etc.), such as (i) lower tooling costs, (ii) less air voids due to the infusion process, (iii) room temperature curing, and (iv) capability of large-scale and multipart components fabrication. All specimens consisted of 16 plies in total ([0/90]7/ [0]2/ [0/90]7), with an average of around 50%–55% fiber volume fraction. The two plies in the center of each specimen were UD unwoven CF as described at the materials section. All laminations were conducted on a plain glass plate. Before each lamination, release wax was placed on the glass plate to ensure easy removal of the laminates from the plate (Figure 1).
For the reference sample, seven layers of carbon plain fiber were stacked together possessing dimensions of 20 cm × 4 cm × 0.3 mm each. Then, the two layers of UD fiber (PFC) of same dimensions were placed at the interface, and another seven layers of plain-woven fiber cloth were stacked on the top of them, making eventually a 16-plies laminate sample. The laminated procedure for the irradiated sample (PCF4.25 W) was the same, with the only difference being that the two intermediate UD fiber layers had been irradiated and were placed facing each other. Furthermore, post-curing of all samples was performed inside a vacuum oven at 60 °C for 6 h, following the instructions of the manufacturer of the epoxy resin system. Afterward, the samples were cut with a tile saw machine to the desirable dimensions (12.5 cm × 2 cm × 3 mm) for accessing the Mode I interlaminar fracture toughness, according to the ASTM D5528-13 [39].

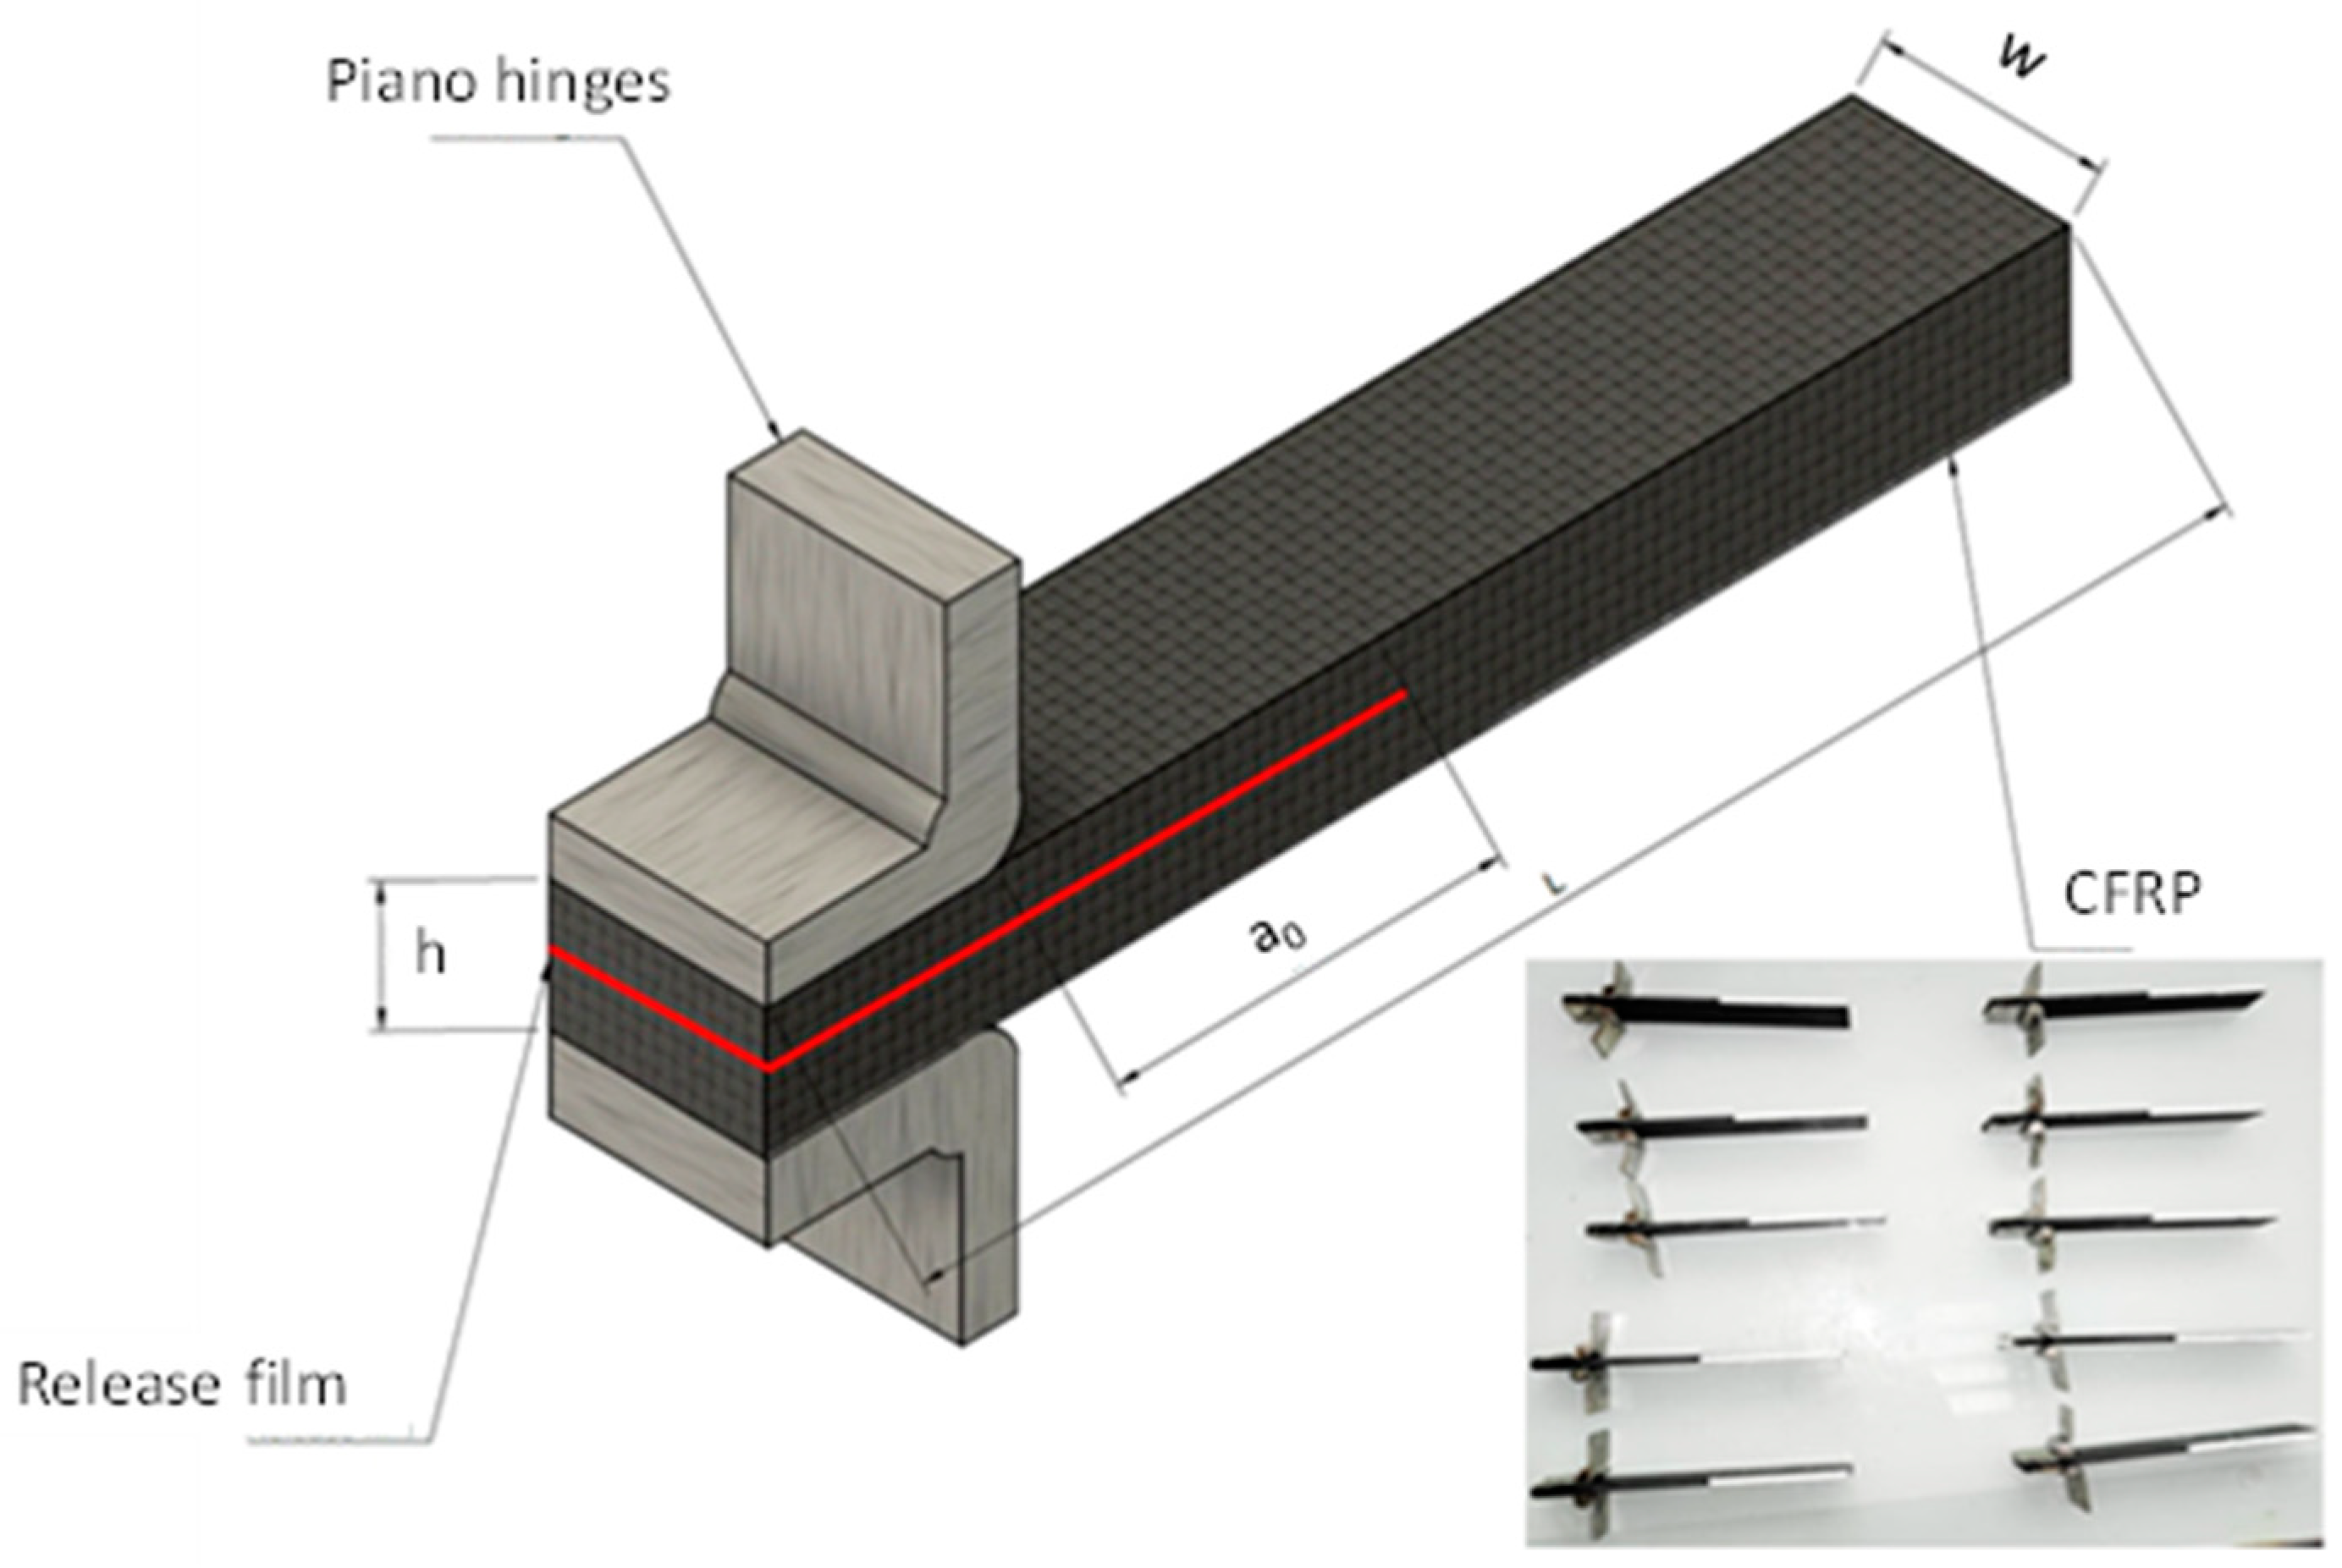
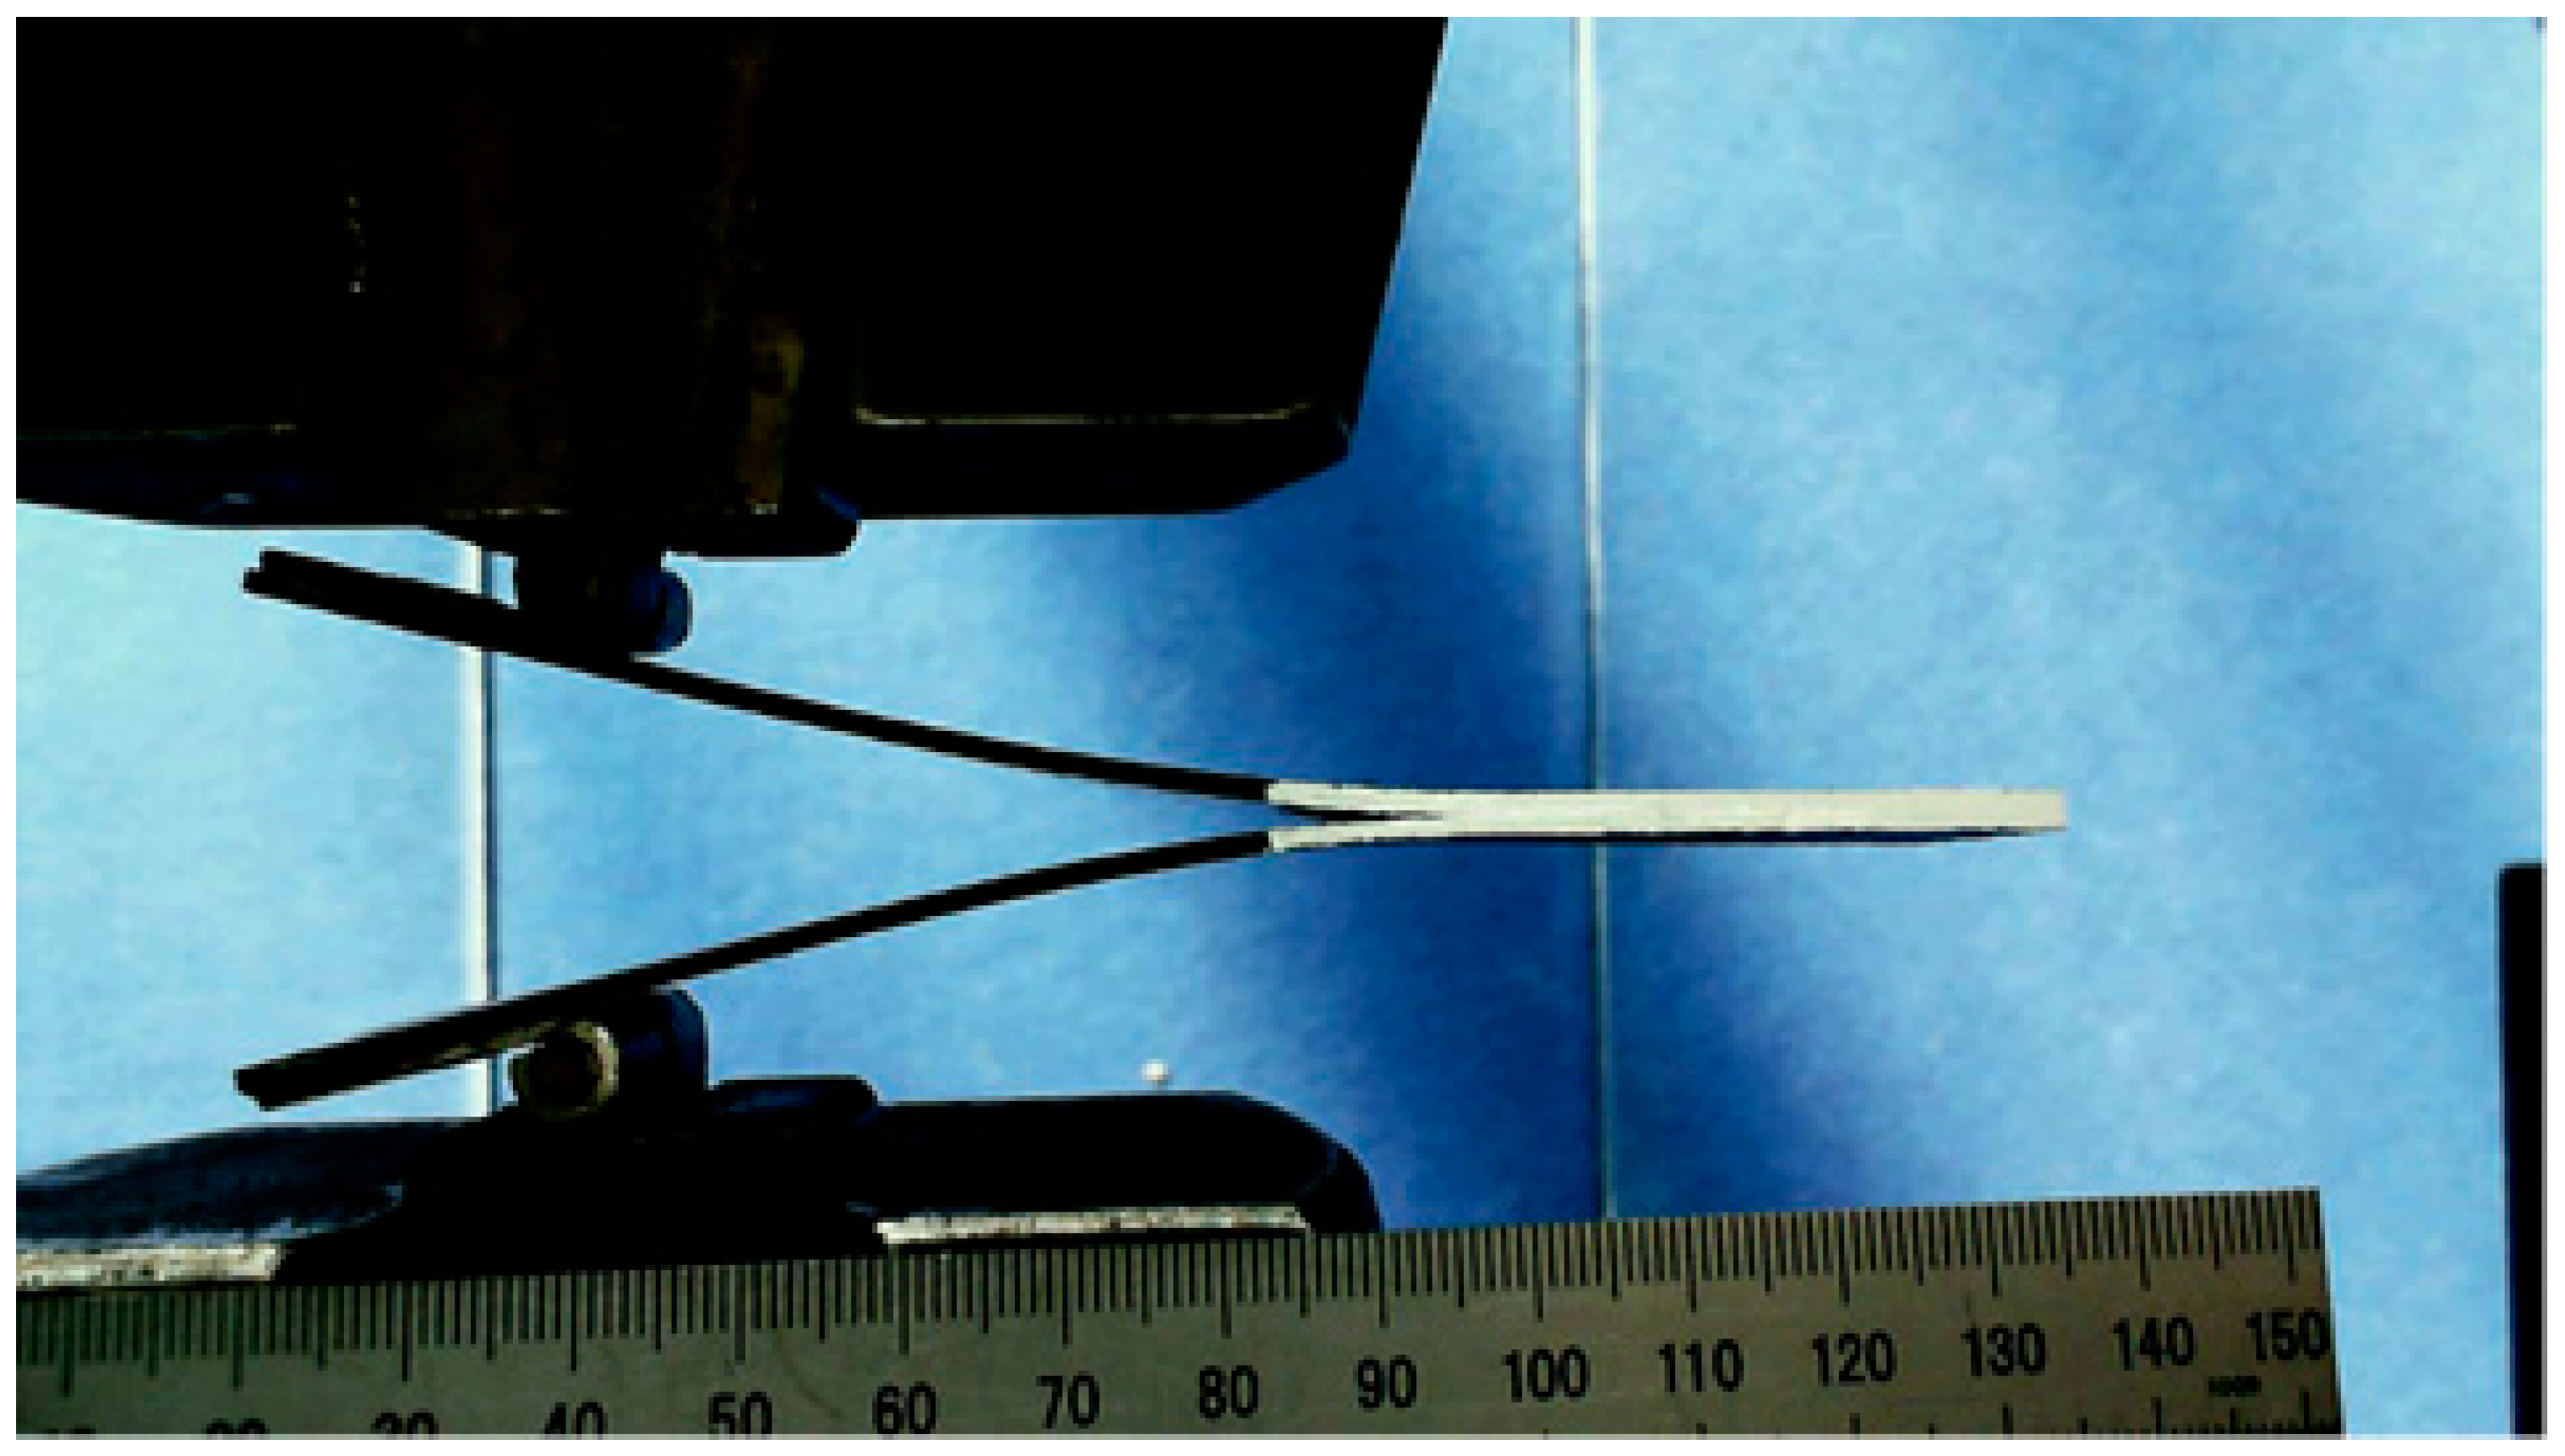
2.7. Mode-I Interlaminar Fracture Toughness Measurements

Mode I interlaminar fracture toughness was accessed utilizing the double cantilever beam (DCB) method technique following ASTM D5528-13 guidelines. The geometry and dimensions of a DCB specimen are illustrated in Figure 2.
A non- sticky vacuum bag membrane, which was 70 mm long and 0.1 mm thick, was introduced at the sample’s mid-plane to initiate a delamination. It should be noted that the initial pre-crack (a0) should be around 50 mm with the length of the piano hinges included. A Universal Instron loading machine (Model 5500R) was used to apply a tensile force at a constant displacement rate of 1 mm/min to piano hinges attached to the specimen. The applied force (P) and crosshead displacement (δ) were recorded and the crack length (a) was measured using a travelling USB camera. The crack on the laminate was calculated with the help of ImageJ software. A small metallic ruler (15 cm total length) was previously placed on the one clamp of the Instron system in order to act as a scale, as shown in Figure 3.
For clearer observation of the crack growth, the samples were painted with white color. The recorded values were then used to calculate the GIc values along the DCB specimen using the modified beam theory (MBT) method. The beam theory expression for the strain energy release rate of a perfectly built-in (that is, clamped at the delamination front) double cantilever beam is as follows:
G I c = 3   P   δ 2   b   a
where P = load (N), δ = load point displacement (mm), b = specimen width (mm), and a = delamination length (mm).
Nevertheless, this approach undervalues the compliance (C = δ/P) as the beam is not perfectly constructed. A way to correct this consequence, is to apply somewhat longer delamination length of a + | Δ | and a correction factor (F) for values of compliance over 0.4. This method of calculating GIc is known as corrected beam theory (CBT). All propagation values were calculated according to
G I c = 3   P   δ 2   b   ( a + | Δ | ) F
where GIc = Mode-I interlaminar fracture toughness (J m−2), P = load (N), δ = load point displacement (mm), b = specimen width (mm), a = delamination length (mm), | Δ |   = increase in delamination length without underestimating the compliance (mm), and F = correction factor.

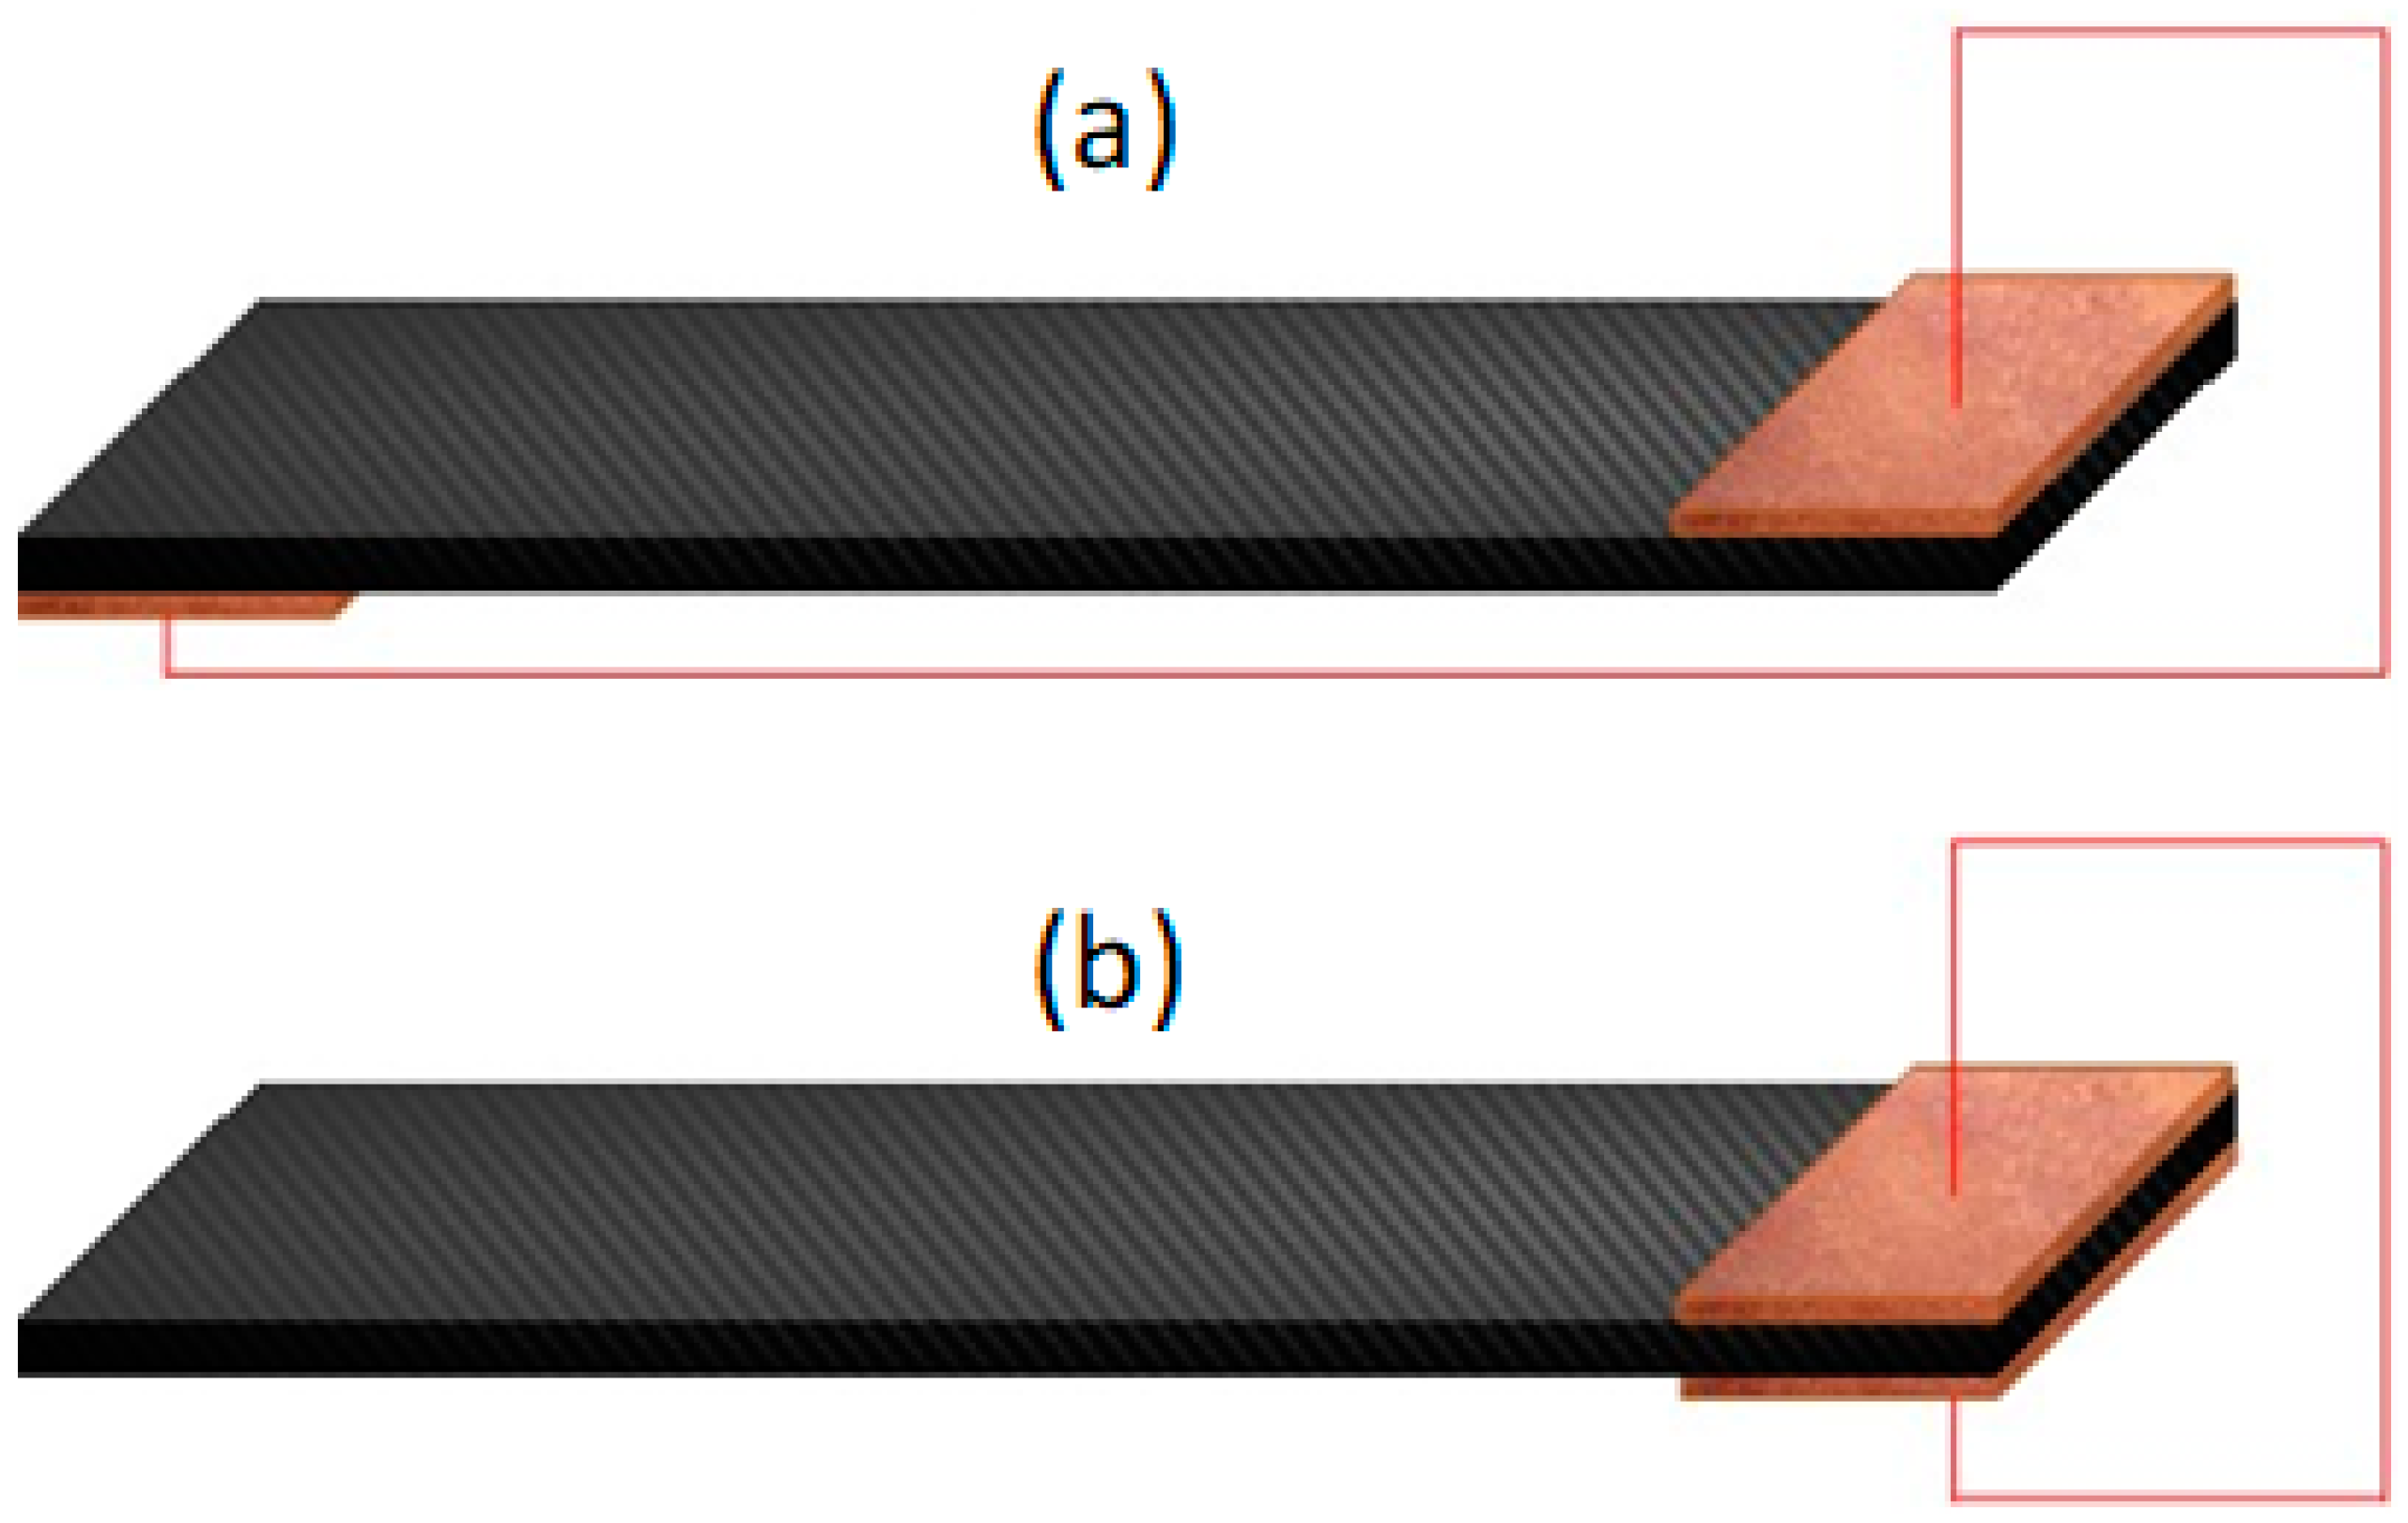
2.8. Electrical Conductivity Measurements

Electrical conductivity tests were performed on both irradiated CF yarns and CFRP, utilizing a two probe Keithley 2611B (Keithley Instruments, Cleveland, Ohio, United States) source meter. For the CF yarns, conductive silver paste was laid at the CF yarn’s edges, and conductive copper tape was positioned over the silver paste, thus creating a uniform connection between the probes and the CF yarn. For the CFRP specimen, two different out of plane measurements were performed in order to examine the electrical conductivity of the fabricated laminates: (i) out of plane through volume conductivity and (ii) out of plane through thickness conductivity. The different probe contacts for each case are depicted in Figure 4. For the calculation of the electrical conductivity, the following equation was used:
σ = G L A
where σ is the electrical conductivity (S/cm), L is the length between the two contacts, G is the conductance (S), and A is the cross-sectional area (cm2).

3. Results and Discussion

3.1. CO2 Irradiation of the CFs

The following five laser powers were selected for the irradiation of the samples: 3.75 W, 4.25 W, 4.75 W, 7.5 W and 10 W, in order to examine the effect of the fluence on CF’s surface. The dimensions of the CF yarns were selected at length = 6 cm and width = 0.6 cm. The fluence (in J cm−2) of the laser beam was calculated as follows:
Fluence = power scan   speed PPI area
where PPI represents the pulses per inch used for the irradiation of the samples (1000 PPI) and “area” indicates the laser beam’s focused spot size area [40,41,42]. The laser beam’s spot size area was assumed as a rectangle, having as its length the diameter of the spot size per pulse (76 μm) and as width the CF’s diameter (7 μm). The scan speed of the laser was fixed at 48.5 cm s−1 during the irradiation. The estimated laser fluences for the experimental irradiation conditions are presented in Table 1. Figure 5 presents theoretical calculations of the variation of laser fluence as a function of laser speed for various laser beam powers. It is evident that when the scan speed of the laser system decreases, the fluence levels of the beam increase (Figure 5a). At the fixed scan speed value of 48.5 cm s−1, used in this work, an increase in laser power is accompanied by a simultaneous increase in laser fluence (Figure 5b).

3.2. SEM Analysis

SEM micrographs of the CFs before (Figure 6a,b) and after laser irradiation (Figure 6c–p) were acquired in order to observe the differences on the morphology of the exposed surface as a function of different fluences (more detailed SEM micrographs can be found in Section S1). Additional SEM micrographs of PCF UD cloths and TCF tows are provided in Figures S1–S16). Five laser powers were selected (3.75 W, 4.25 W, 4.75 W, 7.5 W, and 10 W), with corresponding fluences of 37 J/cm2, 42 J/cm2, 47 J/cm2, 74 J/cm2, and 99 J/cm2, respectively. At the fluence of 37 J/cm2, there is an insignificant “roughening” of the CF surface; however, the presence of small particles was clearly visible when operating the SEM system at 15 kV, indicating that they were quite conductive (Figure 6d and Figure S10). As the fluence was increased to 42 J/cm2, the density of the particles increased substantially and at 47 J/cm2 the “roughening” of the CF surface became apparent (Figure 6f,h, Figures S11 and S12), through the development of nanosized “vertical fins.” When the fluence surpassed the value of ~50 J/cm2, CF destruction was observed (fibers were cut) (Figure 6i–l). A closer look at the destructed area revealed the formation of 200–300 nm cauliflower-liked graphitic structures (Figure 6j,l, Figures S13 and S14—green dashed circular areas), indicating that an engraving phenomenon took place prior to the cutting, creating significant modulations on the CFs. In addition, Figure 6l and Figure S14 reveal the removal of skin layers from the surface of the fiber (blue highlighted dashed area), suggesting that the laser beam actually etched the CFs’ surface layer by layer.
The fluences of the experimental work in this paper were selected below the threshold value of 50 J/cm2, where no broken fibers were detected. However, at the fluence of 47 J/cm2 a noticeable expansion on the CFs’ diameter was noted, which was an indication for the thermal loading within the bulk of the fiber. It is worth noting that due to the non-uniform flatness of a woven carbon cloth (e.g., warp and weft directions have different heights) the focal spot size was varying generating substantial heterogeneity on the irradiated areas. In order to assure the uniformity of the irradiated area a Unidirectional (PCF) cloth was selected (Figure 6m–p, Figures S1–S7, S15, and S16) for Mode-I experiments (more SEM micrographs of PCF samples can be found in the supporting information, Section S1, Figures S1–S7).

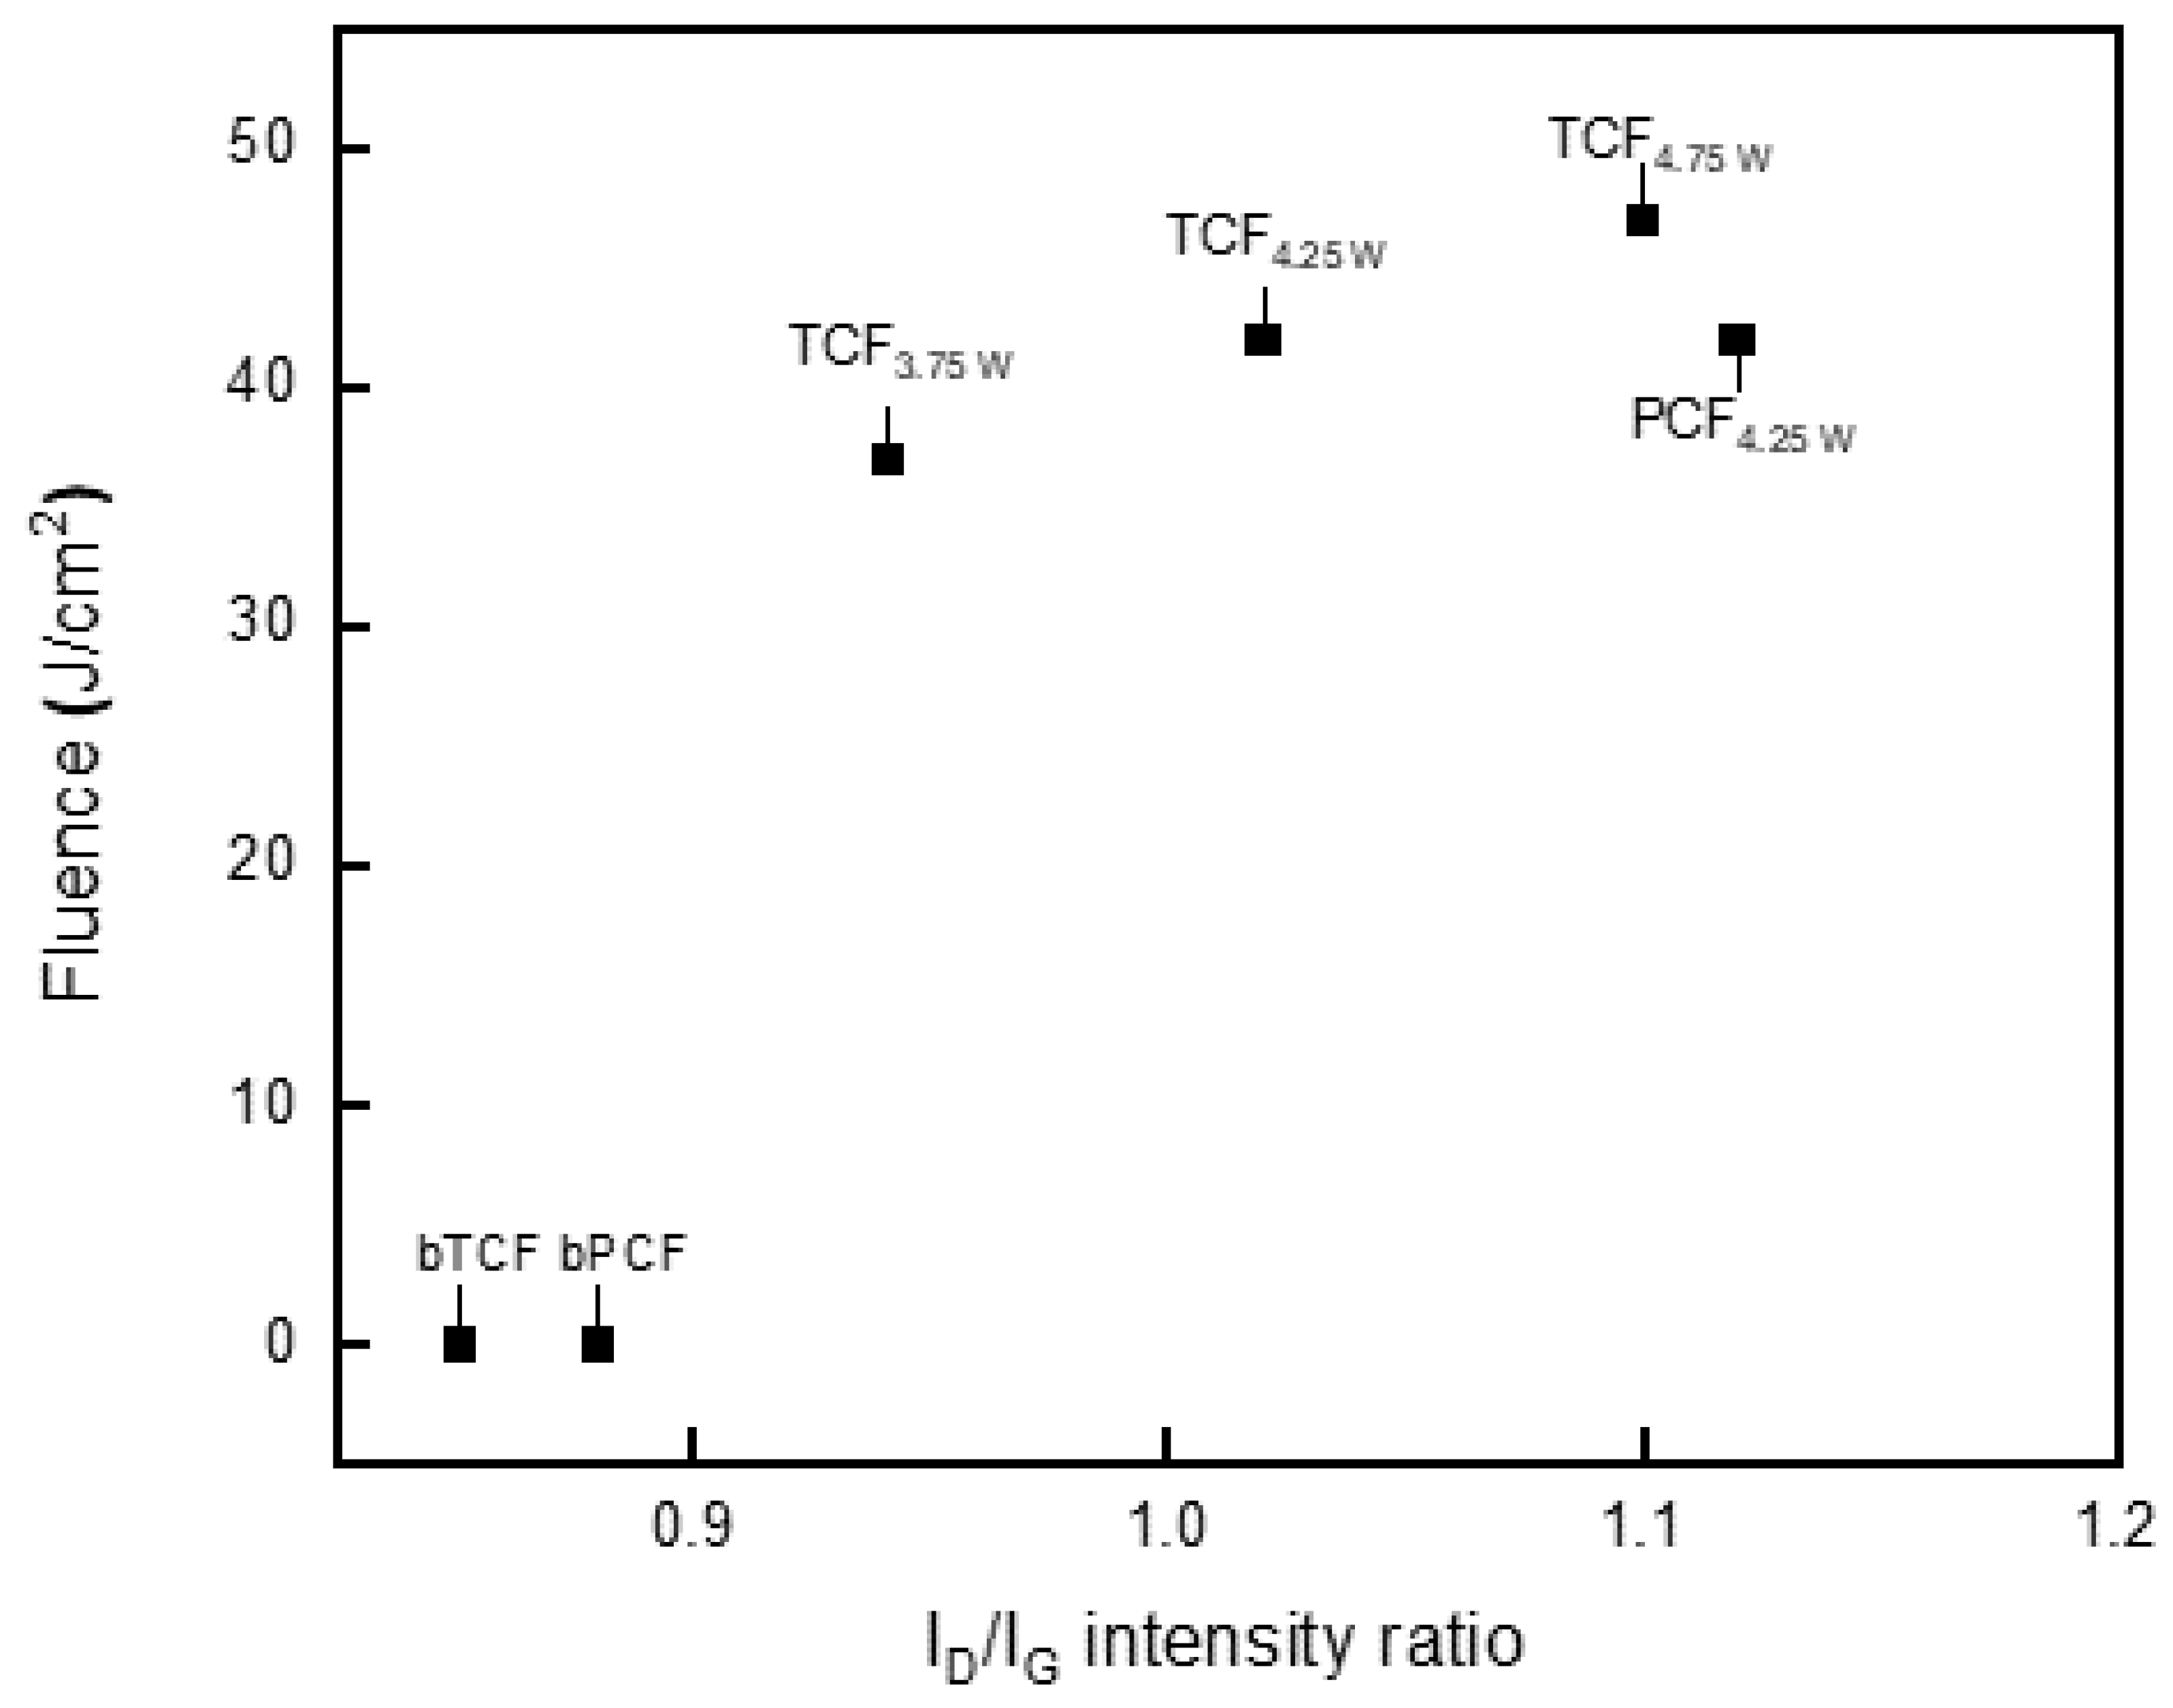
3.3. Raman Characterization

Raman characterization was performed on CFs in order to elucidate the induced structural changes upon laser irradiation and assess the uniformity of the modified CF surfaces. All spectra (Figure 7) contained prominent vibrational modes near 1343 cm−1, 1582 cm−1, and 2685 cm−1, which correspond to the D, G, and the 2D bands, respectively [17,43,44]. The D band is associated with the presence of defects such as vacancies and strain in graphitic networks. The G band is representative of in plane sp2 bonding and originates from first-order Raman scattering, whereas the 2D band results from a double resonance Raman process. The shoulder peak in the G band (D′), is a band indicative of finite graphite crystals and graphene edges. Figure 8 shows the correlation between the fluence (J/cm2) and the ID/IG intensity ratio of the irradiated samples. It is apparent that as the fluence increased to higher levels, the ID/IG ratio increased as well, indicating the existence of more defective structures, which correlated well with the increased “roughening” at higher fluences observed from the SEM analysis. More specifically, at a fluence of 37 J/cm2 (3.75 W) the ratio was calculated as ~ 0.94, at a fluence of 42 J/cm2 (4.25 W) as ~1.02, and at a fluence of 47 J/cm2 (4.75 W) as ~1.10 for TCF fibers. However, PCF fiber (Unidirectional cloth) at 42 J/cm2 exhibited a larger intensity ratio (~1.12), when compared to TCF exposed at the same fluence and was comparable to TCF exposed to a fluence of 47 J/cm2. More Raman spectra of the PCF irradiated samples as a function of different laser powers can be found in the supporting information, Section S2. Raman characterization of the PCF UD cloths are presented in Figure S17. The intensity of the 2D band gradually increased with increasing fluence, showing a very well-defined sharp band at the higher fluence samples (TCF4.75 W and PCF4.25 W) implying a high degree of graphitization. It is insinuated, that the TCFs seem to require relatively larger fluence (by 5 J/cm2) to achieve a high degree of surface graphitization, when compared to the PCFs. This difference can be attributed to either different graphitization responses of the fibers upon irradiation or to the thick sizing agent of TCF (T700SC: 1.1% of sizing agents) [45], which is acting as a shield to the laser irradiation, requiring higher fluence values to achieve the desirable “roughening” of the CFs’ surface. Another notable observation on the Raman spectra of irradiated PCF samples (Figure S17) was, at fluencies equal to or higher than 44 J/cm2 (4.5 W), the D and G bands broadened resembling those of non-irradiated bPCF fibers, whereas the 2D band was still present. The reason for the broadening of D and G bands can be attributed to the increased structural disorder in the graphite crystalline structure induced by the higher laser power irradiation [36,46].

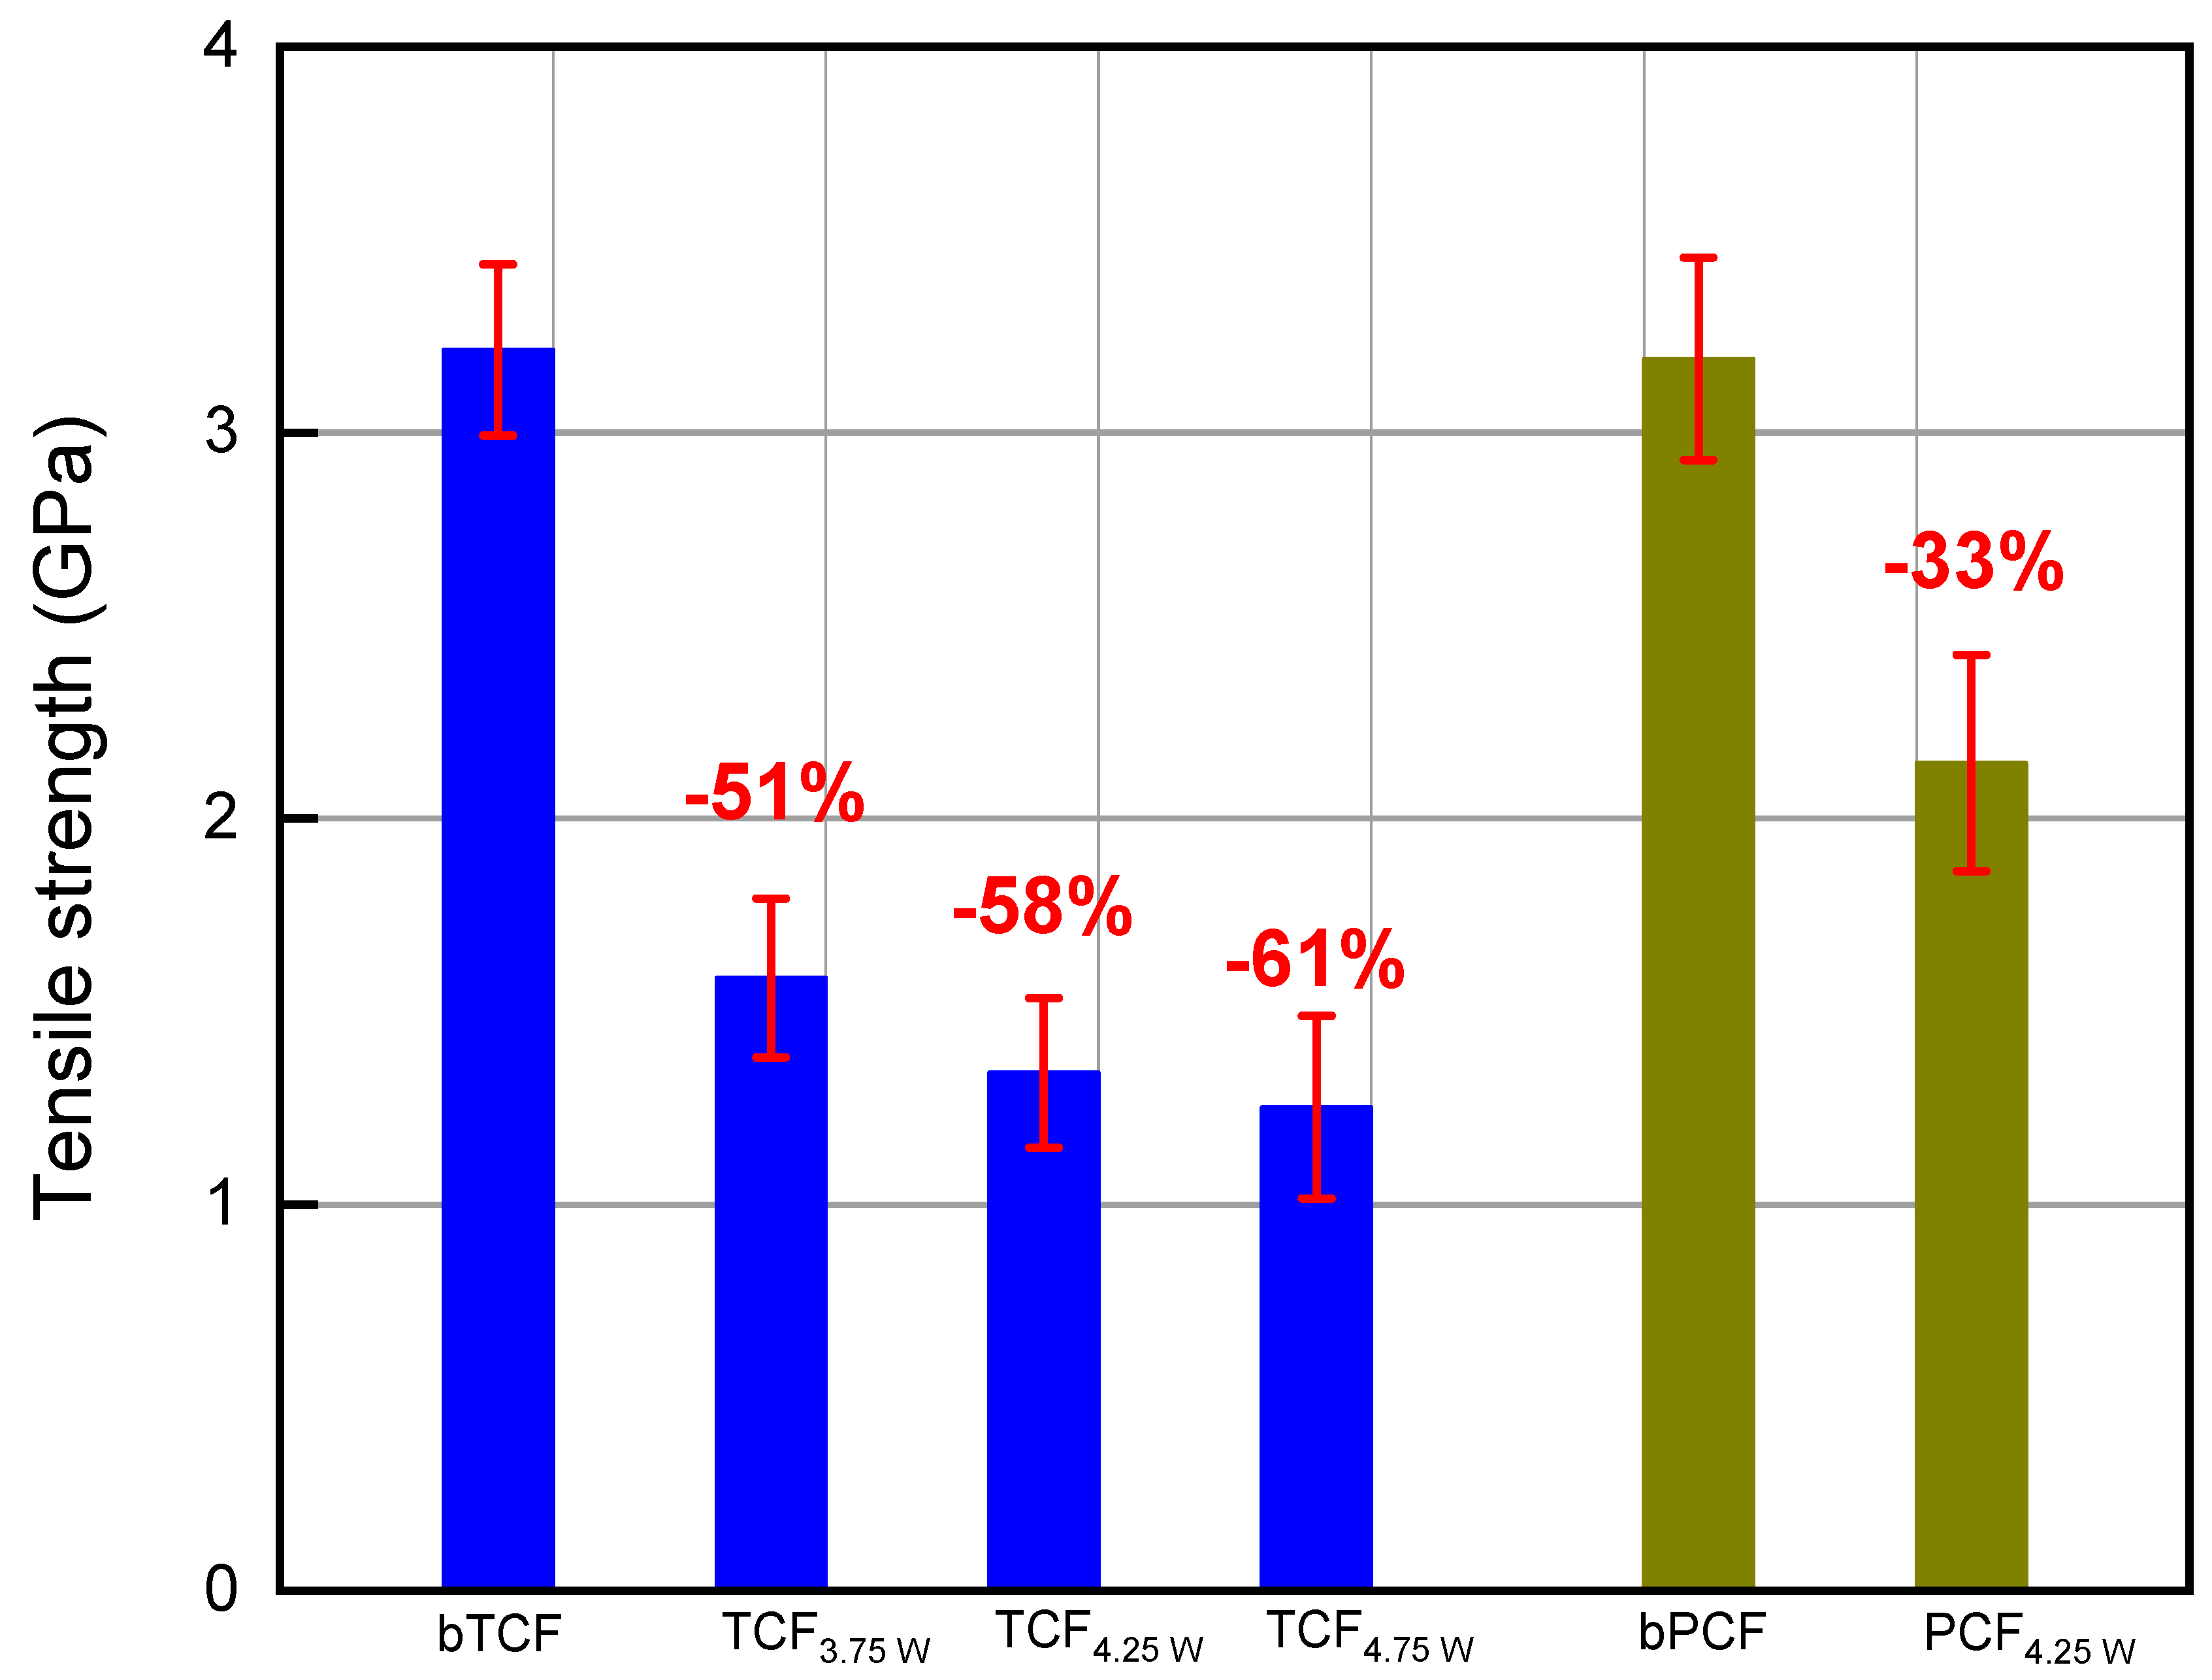
3.4. Single Carbon Fiber Tensile Strength Measurements

Single fiber tensile strength tests were carried out to investigate the effect of laser irradiation on the CFs’ tensile properties (Figure 9). Every specimen’s gauge length was chosen at 20 mm, following the methodology described in Section 2.5. Tensile strength values were calculated using Equation (1). The tensile strengths of non-exposed CFs bTCF and bPCF were estimated as 3.2 ± 0.32 GPa and 3.19 ± 0.36 GPa respectively. For the range of investigated fluences (37–47 J/cm2; power: 3.75–4.75 W), a decrease up to 61% was observed on the tensile strength of the irradiated CFs (2.14 − 1.25 ± 0.38 GPa), when compared to reference CFs (bTCF and bPCF) (Table 2). It can be assumed that the deterioration of the CFs’ tensile strength, was caused by the high temperatures, that were generated by the CO2 photothermal effect. By definition, fluence is the energy delivered by the laser beam per unit area, which means that when the fluence was increased to higher levels, the induced thermal loading on CFs increased as well, causing greater deterioration of the CFs’ tensile strength. However, even at low fluences, the thermal loading was high enough to impose harmful effects to the mechanical integrity of them. PCF4.25 W displayed a lower decrement in the tensile strength (−33%) compared to TCF4.25 W (−58%), and this can be attributed to the different turbostatic nature of the original non-exposed fibers; however, the Raman ID/IG did not show any significant difference (bTCF: 0.85; bPCF: 0.88). SEM analysis revealed that bTCF (Figure 6a,b, Figure S9) possessed an extremely smooth surface when compared to bPCF (Figure 6m,n, Figure S15), where graphitic stripes were observed (originating from the drawing process of the fiber).

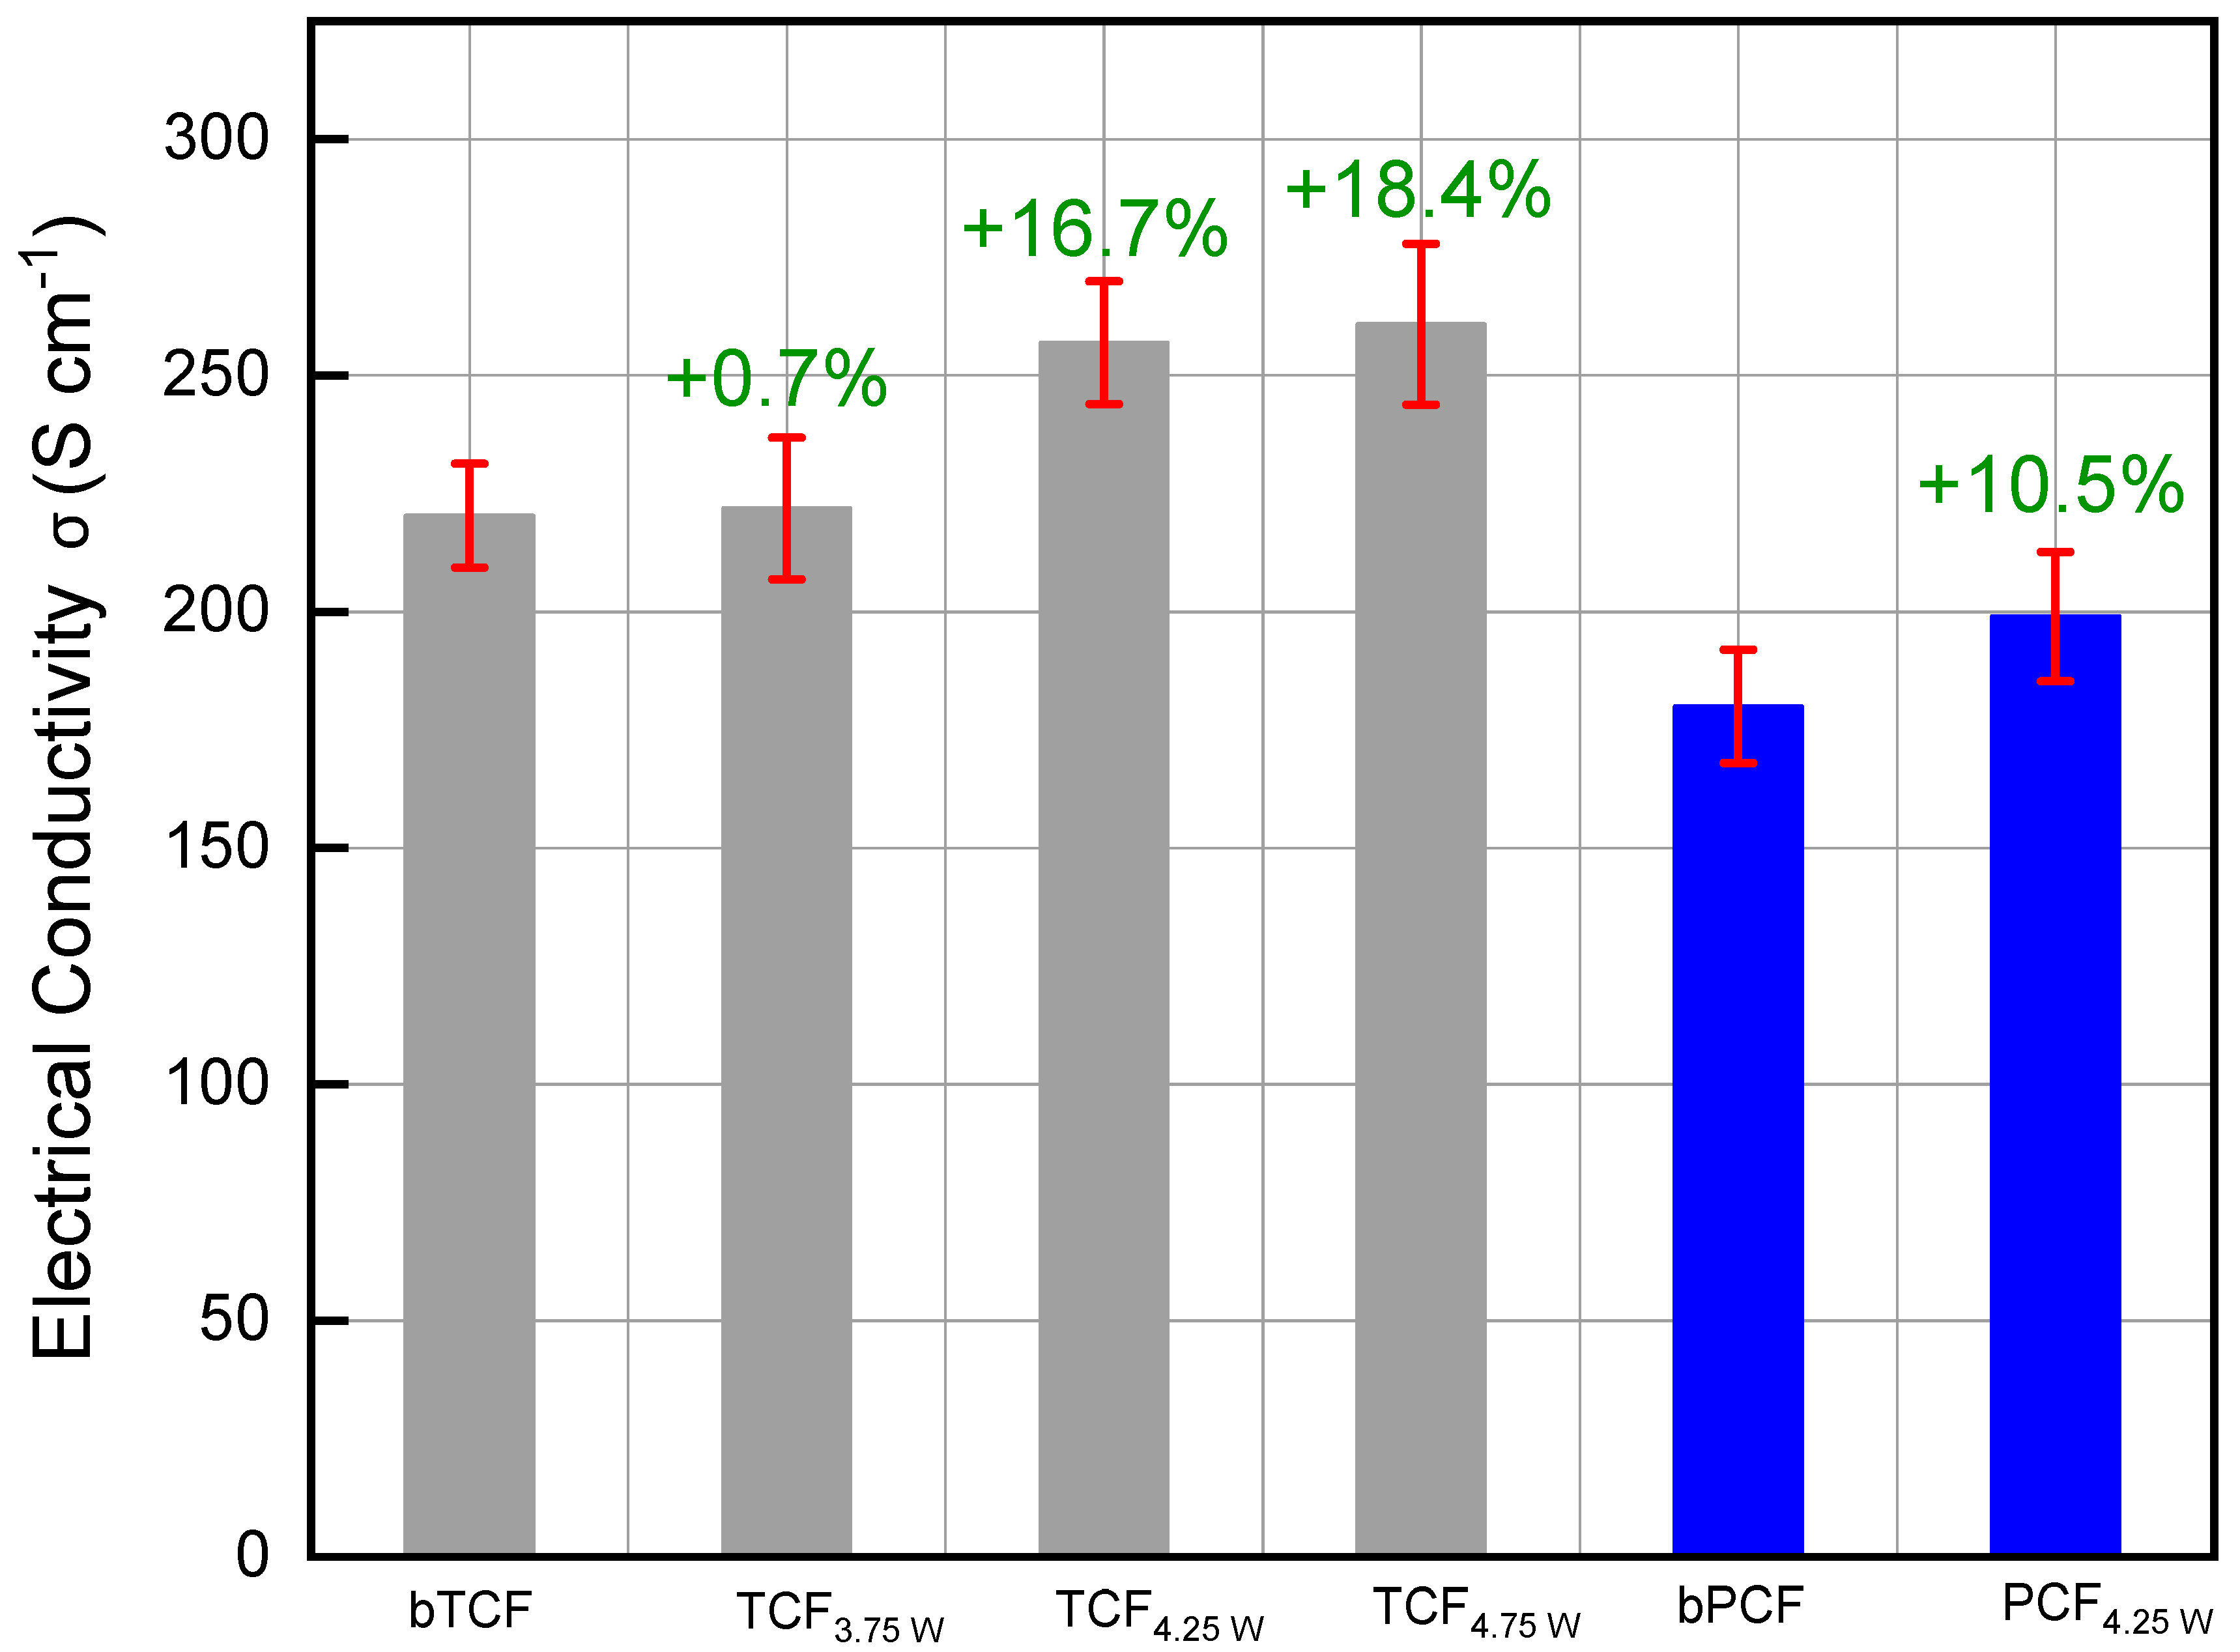
3.5. Electrical Conductivity Measurements on Activated CF Yarns

The electrical conductivity of CF yarns prior and after the laser beam irradiation is illustrated in Figure 10. The electrical conductivity of both specimens (TCF, PCF) was calculated using Equation (6) as described on Section 2.7 at materials and methods. bTCF and bPCF exhibited a conductivity of approximately 220 S·cm−1 and 180 S cm−1 respectively, which increased after irradiation. The highest electrical conductivity value was observed for TCF4.75 W = 260 S·cm−1, displaying an increase of approximately 18.4%. Overall, irradiated specimens displayed an increase in conductivity with increasing laser fluence when compared to control non-exposed samples (bTCF and bPCF) (Table 2). This enhancement in electrical conductivity can be attributed to the microstructure of polyacrylonitrile based CFs (PAN CFs), which possess a turbostratic nature consists of graphitic, arbitrarily folded sheets, and amorphous carbon [47,48]. Upon CO2 laser irradiation, due to heating nature of the irradiation, the amorphous carbon can be transformed to graphitic, enhancing the CFs’ electrical conductivity [49,50,51,52,53].

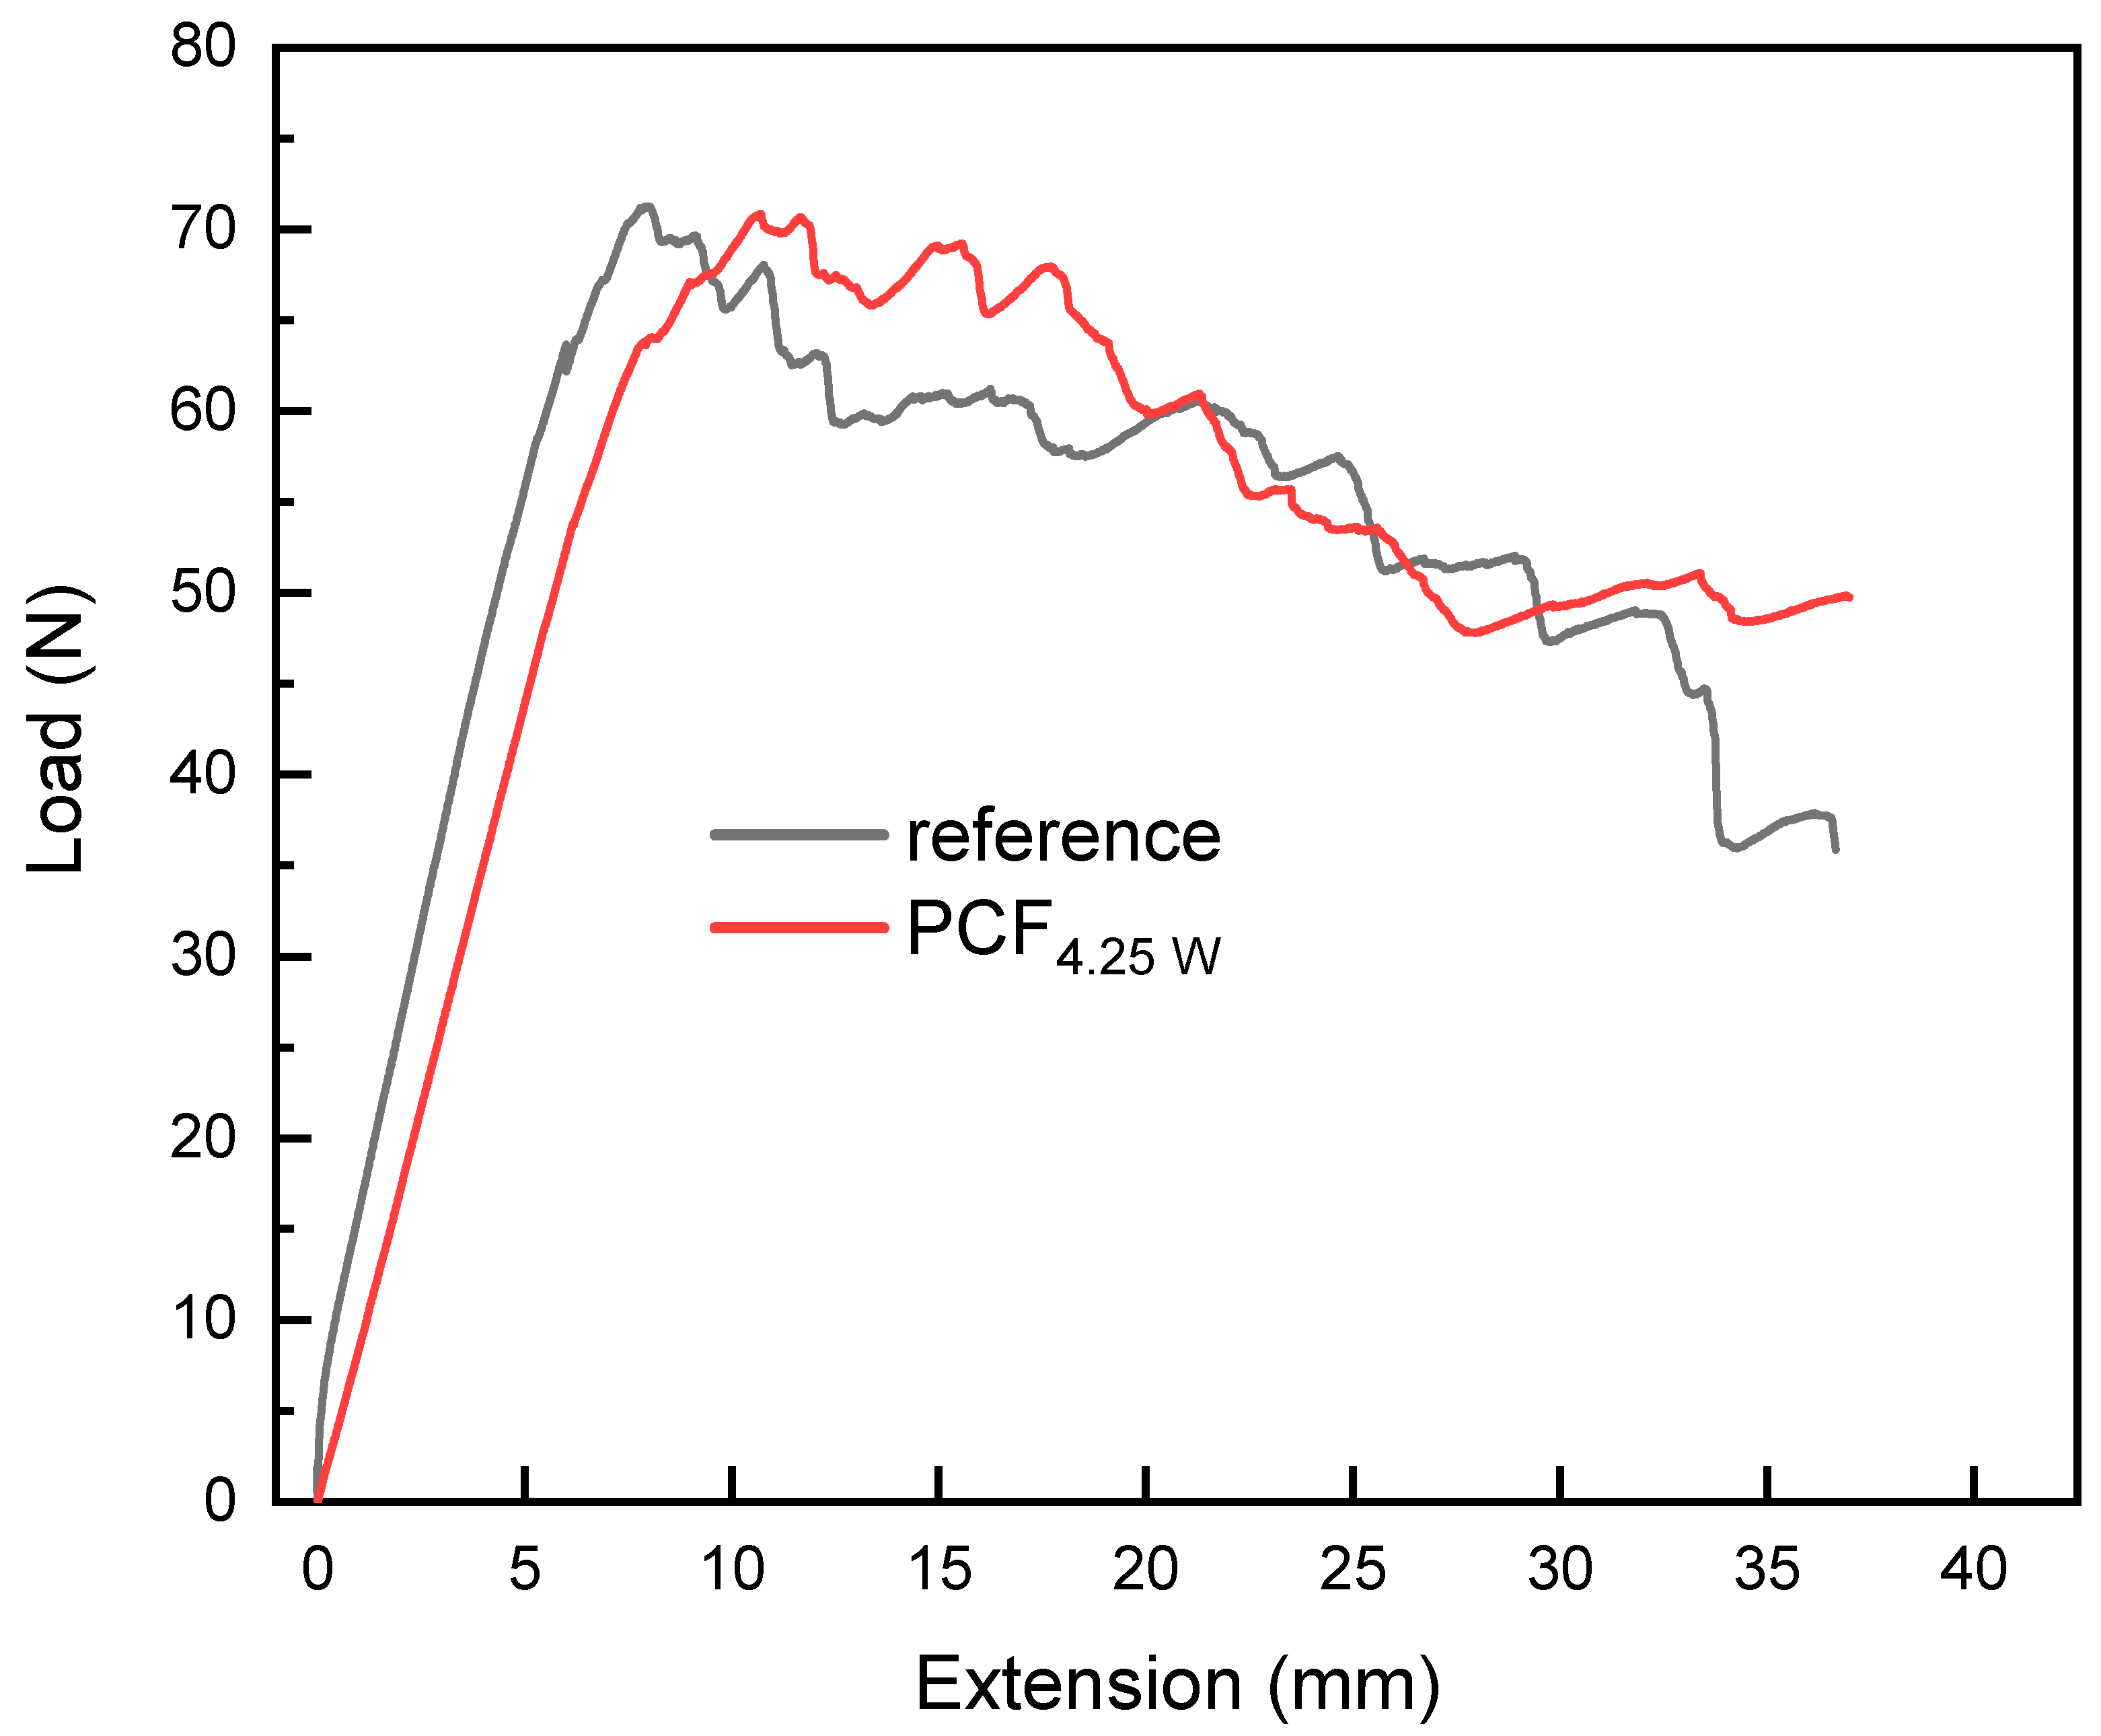
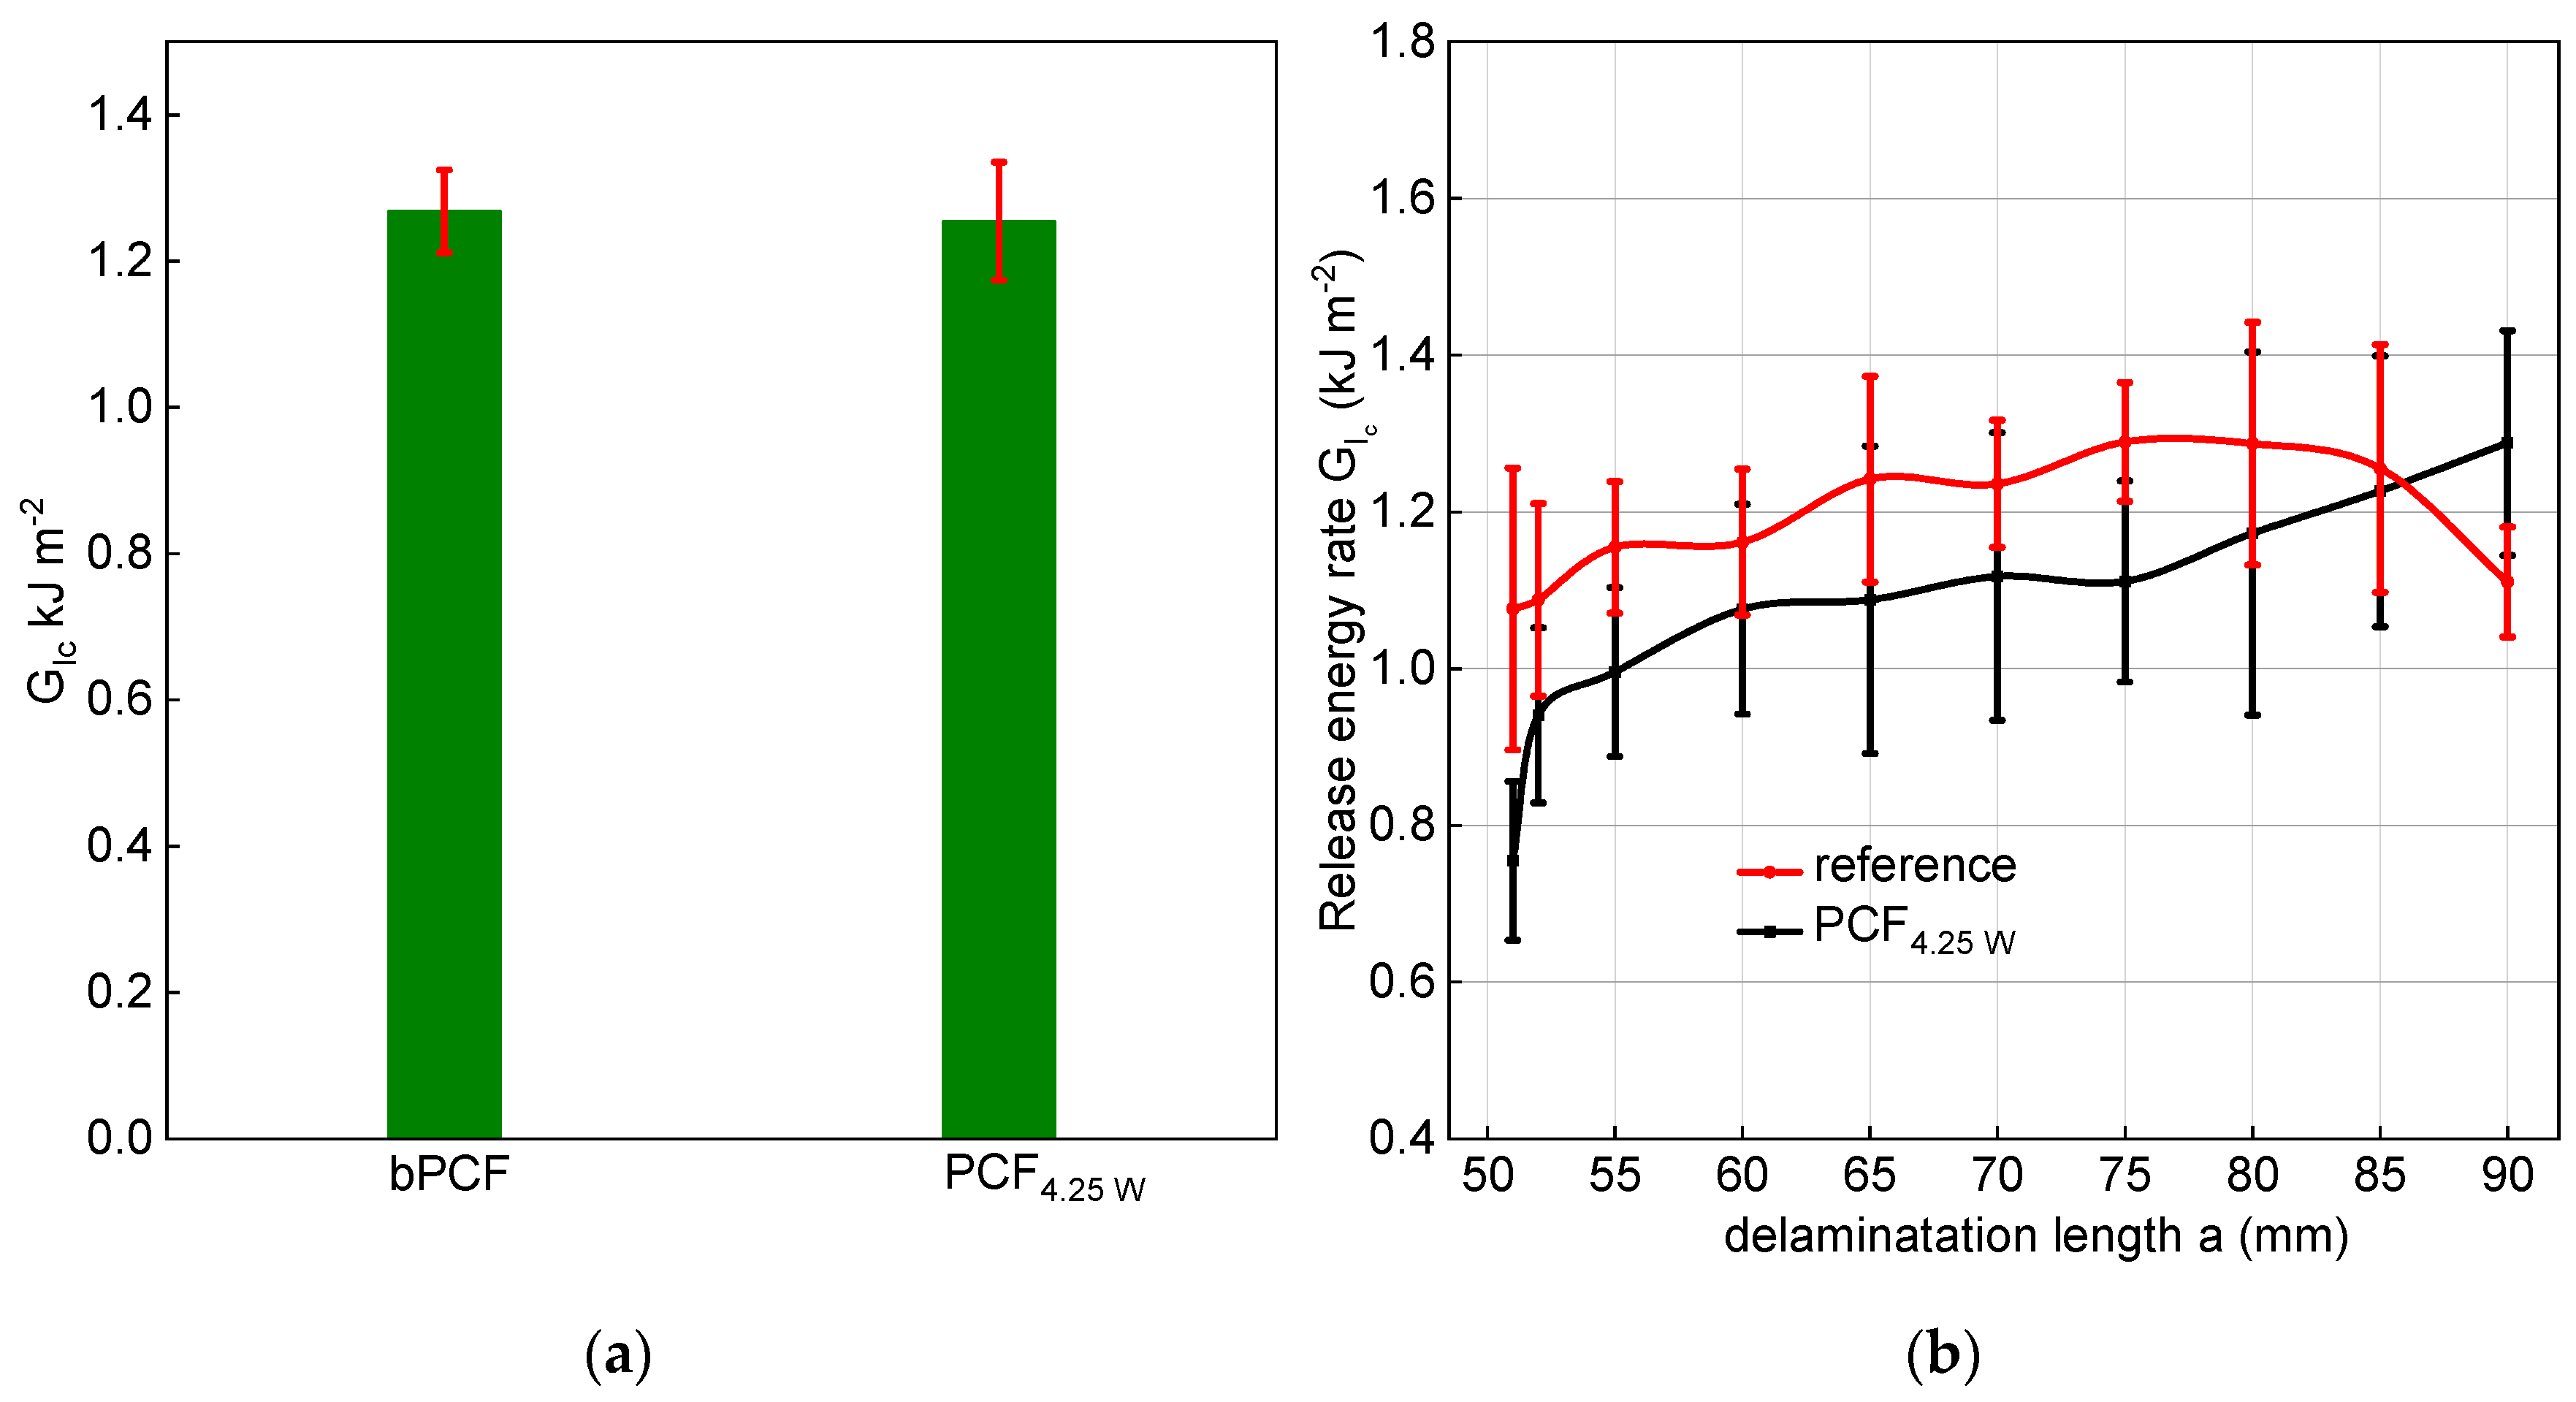
3.6. Mode-I Interlaminar Fracture Toughness Measurements

The interlaminar fracture toughness was determined in terms of the Mode-I strain energy release rate, in propagation ( G I c , PROP ) . The GIc load versus displacement representative curves for both reference and PCF4.25 W samples are shown in Figure 11. For the calculation of the strain energy release rate, Equation (5) was used. All the values summarized in Table 3 were based on Mode-I fracture with a pre-crack of 50 mm. The comparative values obtained from GIc tests are illustrated in Figure 12a. From the results, it can be seen that the fabricated laminates preserved their interlaminar fracture toughness, as the G I c , PROP strain energy release rate values were almost similar—1268 ± 56 J m−2 and 1254 ± 80 J m−2 for reference and PCF4.25 W sample, respectively. Furthermore, the propagation resistance curves (R-curves) in Figure 12b, display representative curves of Mode I interlaminar fracture toughness as a function of the delamination length observed for both the reference and PCF4.25 W sample. The experimental data showed that the values of GIc were gradually increased within the crack growth phase between 50–60 mm and reached steady-state fracture toughness values at delamination length values above 60 mm.

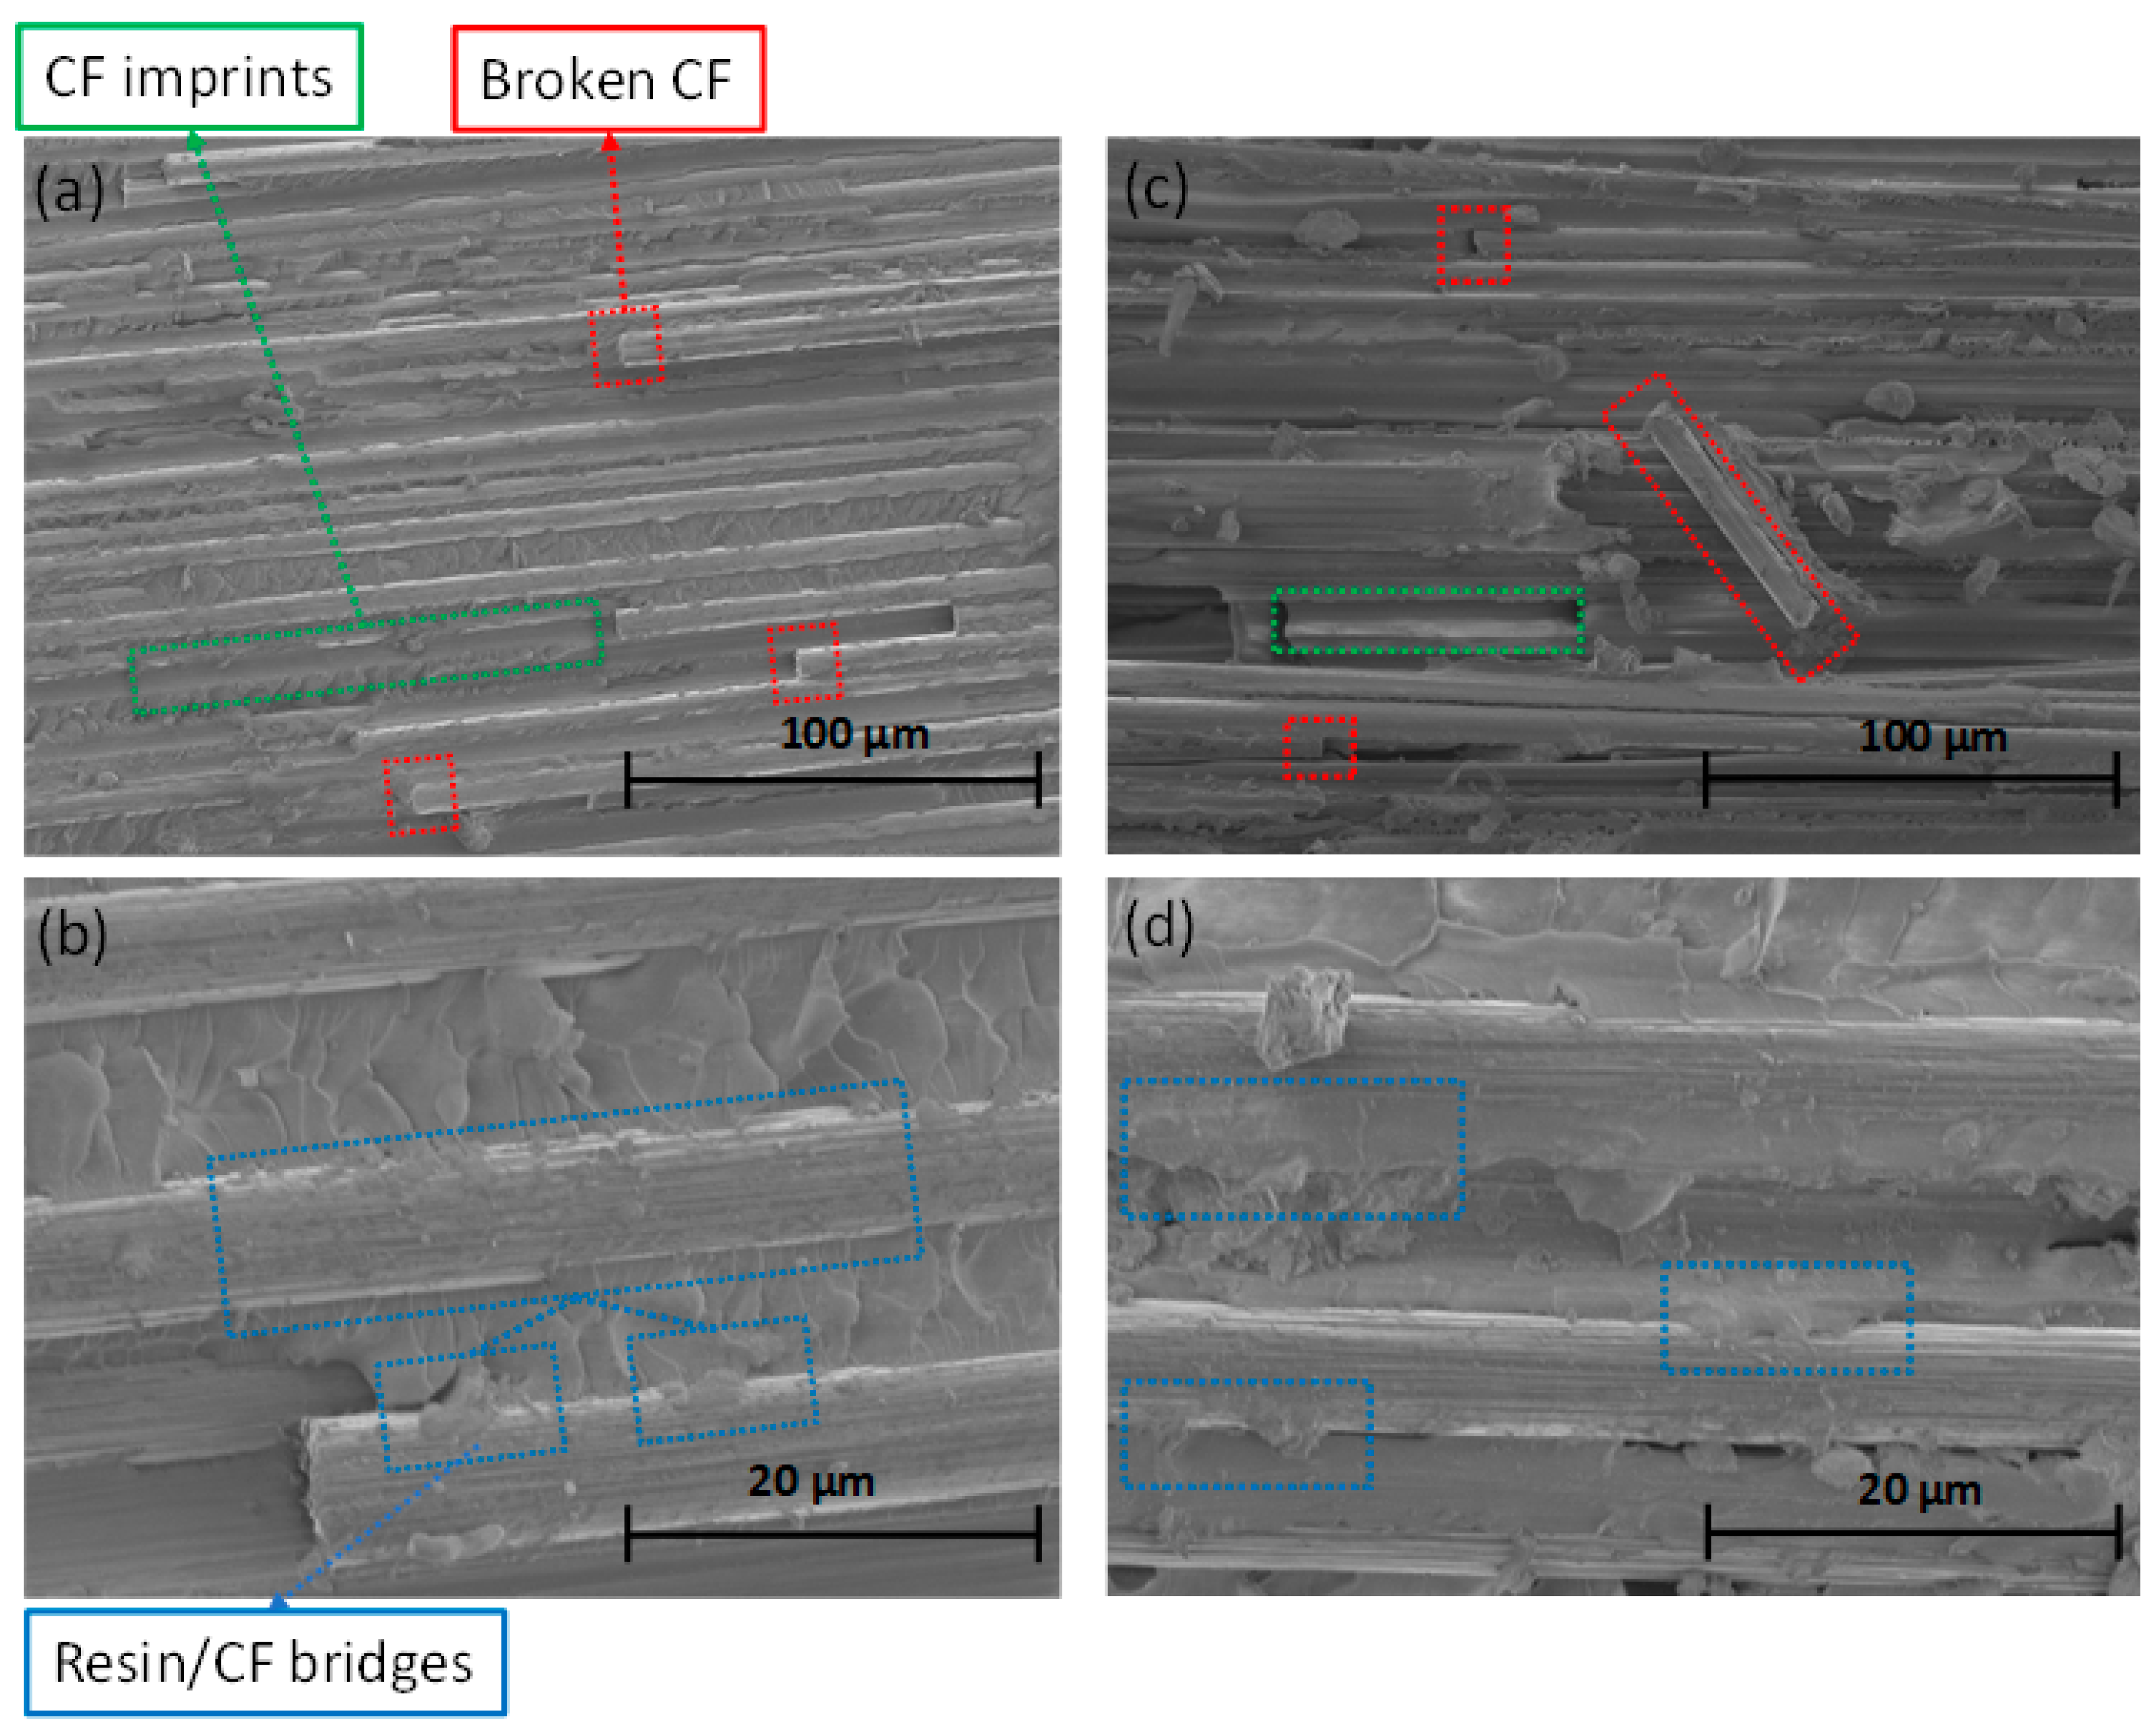
3.7. Fractography of the Tested Samples

Fractography analysis of the tested Mode I samples confirmed the interlaminar fracture toughness results that have been reported earlier (Table 3). PCF4.25 W samples that exhibited almost the same interlaminar fracture toughness as the reference samples presented a similar interlaminar region, as it can be seen clearly by the SEM photos (Figure 13). More specifically, there were some individual CFs on both samples that were pulled out from the polymer matrix (Figure 13a,c), as seen by the CF imprints that were created by the pull-out forces. Furthermore, it could be observed that some fibers broke during the tests. An important observation was that the bridging effect between the epoxy resin and the CFs did not deteriorate during the laser activation of the samples, as there were not any differences in the SEM micrographs (Figure 13b,d). In summary, the fractography analysis confirmed the Mode-I results as no obvious differences in the interlaminar region of the tested laminates were observed.

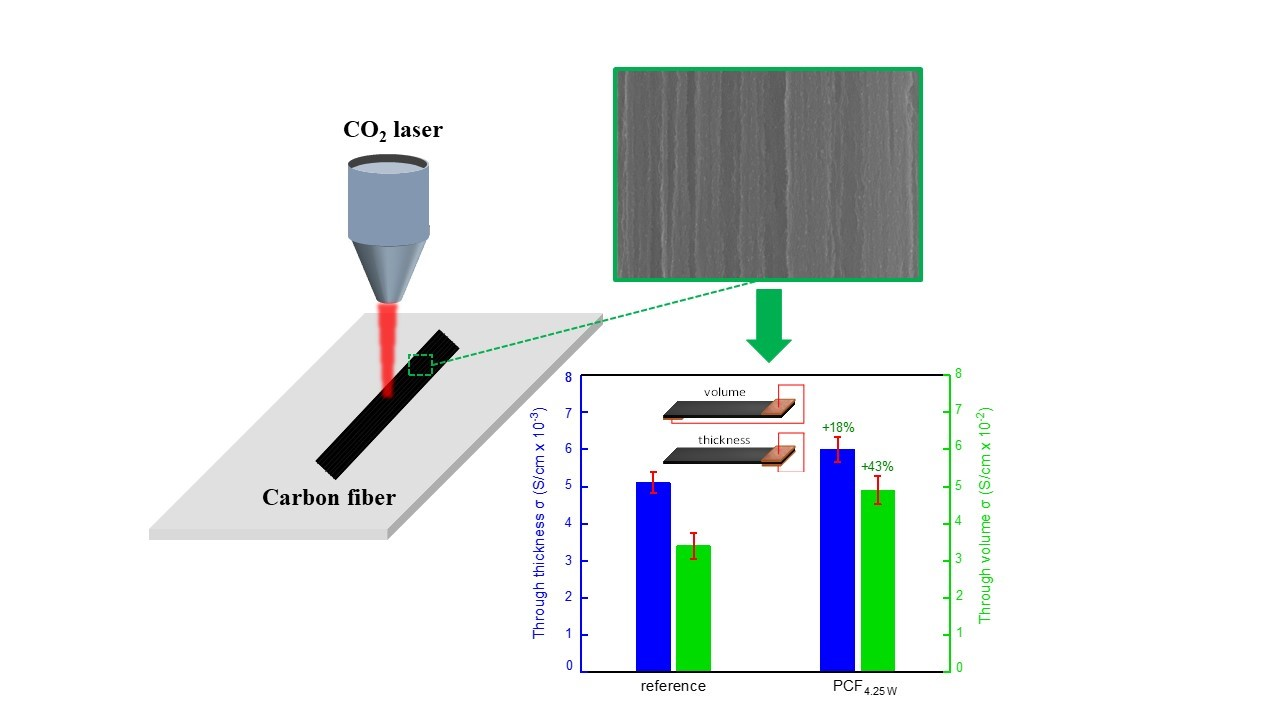
3.8. Electrical Conductivity of the Fabricated CFRP

The out-of-plane electrical conductivity on both through thickness and volume direction (Figure 14) was calculated utilizing Equation (6), as described at Section 2.7. The calculated conductivity values are quoted in Table 3 for both reference and PCF4.25 W laminates. There was an increase of about 43% on the out of plane volume electrical conductivity of the irradiated sample, exhibiting a value of 4.9 × 10⁻² S/cm when compared to the reference sample, which had a conductivity of 3.4 × 10⁻² S/cm. When comparing the out-of-plane thickness conductivity of the laminates, an enhancement of 18% was observed on PCF4.25 W sample. The improvement on the electrical conductivity on both thickness and volume directions can be attributed to the improved conduction paths afforded by the enhanced surface graphitic structure on the surface of the fibers and interlaminar region of the composite structure. It should be noted that the results are in good agreement with the enhancement in the electrical conductivity of the TCF and PCF CFs (Figure 10, Table 2)

4. Conclusions

In summary, the activation of the CFs’ surface by a CO2 laser beam was investigated for the first time as a novel and simple route to enhance the out-of-plane electrical conductivity of fabricated CFRP without simultaneously deteriorating their interlaminar mechanical properties. Irradiated CF yarns were tested prior to the fabrication of the laminated structures, both in terms of tensile strength and electrical conductivity, to examine the impact of the laser irradiation to the CFs themselves. Our results showed that even though there was a decrease in the tensile strength of the irradiated CFs, the electrical conductivity was actually enhanced (up to 18.4%), due to a combination of (i) the laser induced graphitic nanostructuring on the CFs’ surface and (ii) laser induced thermal transformation of amorphous to graphitic carbon in the bulk of the fiber. Furthermore, the results of Mode-I interlaminar fracture toughness on the fabricated composites, showed that the interlaminar region was not affected by this decrement in the tensile strength of CFs, as the values of toughness were almost the same. Fractography analysis further established that the CF/epoxy bridging effect was not affected by the laser induced graphitic texturing. Moreover, the out-of-plane electrical conductivity on both through thickness and volume directions was enhanced by 18% and 43% respectively. This improvement on the electrical conductivity of the irradiated laminates is associated with improved conductive paths created within and between the CFs upon irradiation. Overall, the results demonstrate that CO2 irradiation is a promising route for enhancing the electrical conductivity of the laminated structures without sacrificing the Mode-I interlaminar fracture toughness. However, one limitation is the preservation of tensile strength in single CFs, associated with the high temperatures generated in the bulk of the fiber. Our work demonstrates that controlled CO2 laser irradiation at reduced laser fluences is an effective route to graphitize the surface of CFs and enhance the bulk composite electrical conductivity needed for large-scale, multifunctional structural applications. The laser induced surface modification of CFs is a straight-forward one step scalable method, when compared to conventional CVD or solution-based methods employed to modify CFs; it eliminates complicating time-consuming processing steps; hence, it is economically viable and can be easily commercialized using widely available CO2 lasers.

Supplementary Materials

The following are available online at https://www.mdpi.com/2076-3417/10/10/3561/s1. Figure S1 PCF sample irradiated at 2.5 W (25 J/cm−2); Figure S2: PCF sample irradiated at 3.75 W (37 J/cm−2); Figure S3. PCF sample irradiated at 4 W (39 J/cm−2); Figure S4. PCF sample irradiated at 4.25 W (42 J/cm−2); Figure S5. PCF sample irradiated at 4.5 W (44 J/ cm−2); Figure S6. PCF sample irradiated at 4.75 W (47 J/cm−2); Figure S7. PCF sample irradiated at 5 W (49 J/cm−2); Figure S8. Area of the irradiation for TCF representative samples. (a) TCF4.75 W (47 J/cm−2), (b) TCF7.5 W (74 J/cm−2), (c) TCF10 W (99 J/cm−2); Figure S9. bTCF sample.; Figure S10. TCF sample irradiated at 3.75 W (37 J/cm−2); Figure S11. TCF sample irradiated at 4.25 W (42 J/cm−2); Figure S12. TCF sample irradiated at 4.75 W (47 J/cm−2); Figure S13. TCF sample irradiated at 7.5 W (74 J/cm−2); Figure S14. TCF sample irradiated at 10 W (99 J/cm−2); Figure S15. bPCF sample; Figure S16. PCF sample irradiated at 4.25 W (42 J/cm−2), Figure S17. Raman spectra of PCF sample irradiated at various powers.

Author Contributions

A.K. (Anastasios Karakassides) performed experiments, collected data, analyzed and wrote the manuscript; A.K. (Angeliki Karakassides) and M.K. performed experiments and collected data, A.S.P. reviewed the paper; P.P. conceived the research idea; supervised all phases of the research project and co-wrote/reviewed the paper. All authors have read and agreed to the published version of the manuscript.

Funding

The research was funded by the Air Force Office of Scientific Research (AFOSR) under Grant FA9550-17-1-0042; the Department of Education in Northern Ireland and Ulster University (PhD studentship to A.K.); and European Community (Erasmus+ founding for international mobility).

Conflicts of Interest

The authors declare no conflict of interest.

References

  1. De Rosa, I.M.; Sarasini, F.; Sarto, M.S.; Tamburrano, A. EMC Impact of Advanced Carbon Fiber/Carbon Nanotube Reinforced Composites for next-Generation Aerospace Applications. IEEE Trans. Electromagn. Compat. 2008, 50, 556–563. [Google Scholar] [CrossRef]
  2. Afshar, A.; Alkhader, M.; Korach, C.S.; Chiang, F.P. Effect of Long-Term Exposure to Marine Environments on the Flexural Properties of Carbon Fiber Vinylester Composites. Compos. Struct. 2015, 126, 72–77. [Google Scholar] [CrossRef]
  3. Feraboli, P.; Masini, A.; Taraborrelli, L.; Pivetti, A. Integrated Development of CFRP Structures for a Topless High Performance Vehicle. Compos. Struct. 2007, 78, 495–506. [Google Scholar] [CrossRef]
  4. Mishnaevsky, L.; Branner, K.; Petersen, H.N.; Beauson, J.; McGugan, M.; Sørensen, B.F. Materials for Wind Turbine Blades: An Overview. Materials 2017, 10, 1285. [Google Scholar] [CrossRef] [PubMed] [Green Version]
  5. Alsaadi, A.; Meredith, J.; Swait, T.; Curiel-Sosa, J.L.; Jia, Y.; Hayes, S. Structural Health Monitoring for Woven Fabric CFRP Laminates. Compos. Part B Eng. 2019, 174, 107048. [Google Scholar] [CrossRef]
  6. Pereira, T.; Zhanhu, G.; Nieh, S.; Arias, J.; Hahn, H.T. Energy Storage Structural Composites: A Review. J. Compos. Mater. 2009, 43, 549–560. [Google Scholar] [CrossRef]
  7. Dhanya, T.M.; Yerramalli, C.S. Lightning Strike Effect on Carbon Fiber Reinforced Composites–Effect of Copper Mesh Protection. Mater. Today Commun. 2018, 16, 124–134. [Google Scholar] [CrossRef]
  8. Munalli, D.; Dimitrakis, G.; Chronopoulos, D.; Greedy, S.; Long, A. Electromagnetic Shielding Effectiveness of Carbon Fibre Reinforced Composites. Compos. Part B Eng. 2019, 173, 106906. [Google Scholar] [CrossRef]
  9. Jungwirth, M.E.L.; Wick, D.V.; Baker, M.S.; Wilcox, C.C.; Dereniak, E.L.; Romeo, R.C.; Martin, R.N. Actuation for Carbon Fiber Reinforced Polymer Active Optical Mirrors. In Proceedings of the IEEE Aerospace Conference Proceedings, Big Sky, MT, USA, 3–10 March 2012; pp. 1–9. [Google Scholar]
  10. Kim, K.J.; Yu, W.R.; Youk, J.H.; Lee, J. Degradation and Healing Mechanisms of Carbon Fibers during the Catalytic Growth of Carbon Nanotubes on Their Surfaces. ACS Appl. Mater. Interfaces 2012, 4, 2250–2258. [Google Scholar] [CrossRef]
  11. Kim, K.J.; Kim, J.; Yu, W.R.; Youk, J.H.; Lee, J. Improved Tensile Strength of Carbon Fibers Undergoing Catalytic Growth of Carbon Nanotubes on Their Surface. Carbon N. Y. 2013, 54, 258–267. [Google Scholar] [CrossRef]
  12. Qian, H.; Bismarck, A.; Greenhalgh, E.S.; Kalinka, G.; Shaffer, M.S.P. Hierarchical Composites Reinforced with Carbon Nanotube Grafted Fibers: The Potential Assessed at the Single Fiber Level. Chem. Mater. 2008, 20, 1862–1869. [Google Scholar] [CrossRef]
  13. Lee, G.; Youk, J.H.; Lee, J.; Sul, I.H.; Yu, W.R. Low-Temperature Grafting of Carbon Nanotubes on Carbon Fibers Using a Bimetallic Floating Catalyst. Diam. Relat. Mater. 2016, 68, 118–126. [Google Scholar] [CrossRef]
  14. Steiner, S.A.; Li, R.; Wardle, B.L. Circumventing the Mechanochemical Origins of Strength Loss in the Synthesis of Hierarchical Carbon Fibers. ACS Appl. Mater. Interfaces 2013, 5, 4892–4903. [Google Scholar] [CrossRef] [PubMed]
  15. Li, R.; Lachman, N.; Florin, P.; Wagner, H.D.; Wardle, B.L. Hierarchical Carbon Nanotube Carbon Fiber Unidirectional Composites with Preserved Tensile and Interfacial Properties. Compos. Sci. Technol. 2015, 117, 139–145. [Google Scholar] [CrossRef] [Green Version]
  16. Sager, R.J.; Klein, P.J.; Lagoudas, D.C.; Zhang, Q.; Liu, J.; Dai, L.; Baur, J.W. Effect of Carbon Nanotubes on the Interfacial Shear Strength of T650 Carbon Fiber in an Epoxy Matrix. Compos. Sci. Technol. 2009, 69, 898–904. [Google Scholar] [CrossRef]
  17. Karakassides, A.; Ganguly, A.; Tsirka, K.; Paipetis, A.S.; Papakonstantinou, P. Radially Grown Graphene Nanoflakes on Carbon Fibers as Reinforcing Interface for Polymer Composites. ACS Appl. Nano Mater. 2020, 3, 2402–2413. [Google Scholar] [CrossRef] [Green Version]
  18. Ganguly, A.; Karakassides, A.; Benson, J.; Hussain, S.; Papakonstantinou, P. Multifunctional Structural Supercapacitor Based on Urea Activated Graphene Nanoflakes Directly Grown on Carbon Fibre Electrodes. ACS Appl. Energy Mater. 2020. [Google Scholar] [CrossRef]
  19. Chi, Y.; Chu, J.; Chen, M.; Li, C.; Mao, W.; Piao, M.; Zhang, H.; Liu, B.S.; Shi, H. Directly Deposited Graphene Nanowalls on Carbon Fiber for Improving the Interface Strength in Composites. Appl. Phys. Lett. 2016, 108, 211601. [Google Scholar] [CrossRef]
  20. Shakir, I.; Shahid, M.; Rana, U.A.; Nashef, I.M.A.; Hussain, R. Nickel-Cobalt Layered Double Hydroxide Anchored Zinc Oxide Nanowires Grown on Carbon Fiber Cloth for High-Performance Flexible Pseudocapacitive Energy Storage Devices. Electrochim. Acta 2014, 129, 28–32. [Google Scholar] [CrossRef]
  21. Yang, Y.; Zhou, M.; Guo, W.; Cui, X.; Li, Y.; Liu, F.; Xiao, P.; Zhang, Y. NiCoO2 Nanowires Grown on Carbon Fiber Paper for Highly Efficient Water Oxidation. Electrochim. Acta 2015, 174, 246–253. [Google Scholar] [CrossRef]
  22. Deka, B.K.; Hazarika, A.; Kim, J.; Park, Y.B.; Park, H.W. Multifunctional CuO Nanowire Embodied Structural Supercapacitor Based on Woven Carbon Fiber/Ionic Liquid-Polyester Resin. Compos. Part A Appl. Sci. Manuf. 2016, 87, 256–262. [Google Scholar] [CrossRef]
  23. Zheng, N.; Huang, Y.; Sun, W.; Du, X.; Liu, H.Y.; Moody, S.; Gao, J.; Mai, Y.W. In-Situ Pull-off of ZnO Nanowire from Carbon Fiber and Improvement of Interlaminar Toughness of Hierarchical ZnO Nanowire/Carbon Fiber Hydrid Composite Laminates. Carbon N. Y. 2016, 110, 69–78. [Google Scholar] [CrossRef] [Green Version]
  24. Lin, Y.; Ehlert, G.; Sodano, H.A. Increased Interface Strength in Carbon Fiber Composites through a ZnO Nanowire Interphase. Adv. Funct. Mater. 2009, 19, 2654–2660. [Google Scholar] [CrossRef]
  25. Liao, Q.; Mohr, M.; Zhang, X.; Zhang, Z.; Zhang, Y.; Fecht, H.J. Carbon Fiber-ZnO Nanowire Hybrid Structures for Flexible and Adaptable Strain Sensors. Nanoscale 2013, 5, 12350–12355. [Google Scholar] [CrossRef] [PubMed]
  26. Reitz, V.; Meinhard, D.; Ruck, S.; Riegel, H.; Knoblauch, V. A Comparison of IR- and UV-Laser Pretreatment to Increase the Bonding Strength of Adhesively Joined Aluminum/CFRP Components. Compos. Part A Appl. Sci. Manuf. 2017, 96, 18–27. [Google Scholar] [CrossRef]
  27. Fischer, F.; Kreling, S.; Jäschke, P.; Frauenhofer, M.; Kracht, D.; Dilger, K. Laser Surface Pre-Treatment of CFRP for Adhesive Bonding in Consideration of the Absorption Behaviour. J. Adhes. 2012, 88, 350–363. [Google Scholar] [CrossRef]
  28. Schmutzler, H.; Popp, J.; Büchter, E.; Wittich, H.; Schulte, K.; Fiedler, B. Improvement of Bonding Strength of Scarf-Bonded Carbon Fibre/Epoxy Laminates by Nd:YAG Laser Surface Activation. Compos. Part A Appl. Sci. Manuf. 2014, 67, 123–130. [Google Scholar] [CrossRef]
  29. Leone, C.; Genna, S. Effects of Surface Laser Treatment on Direct Co-Bonding Strength of CFRP Laminates. Compos. Struct. 2018, 194, 240–251. [Google Scholar] [CrossRef]
  30. Xu, F.; Du, X.; Zhou, H. Building Hierarchical Micro-Structure on the Carbon Fabrics to Improve Their Reinforcing Effect in the CFRP Composites. In Recent Developments in the Field of Carbon Fibers; Chapter 5; IntechOpen: Rijeka, Croatia, 2018. [Google Scholar] [CrossRef] [Green Version]
  31. Saleem, M.; Toubal, L.; Zitoune, R.; Bougherara, H. Investigating the Effect of Machining Processes on the Mechanical Behavior of Composite Plates with Circular Holes. Compos. Part A Appl. Sci. Manuf. 2013, 55, 169–177. [Google Scholar] [CrossRef]
  32. Moreira, R.D.F.; Oliveira, V.; Silva, F.G.A.; Vilar, R.; de Moura, M.F.S.F. Mode II Fracture Toughness of Carbon–Epoxy Bonded Joints with Femtosecond Laser Treated Surfaces. Int. J. Mech. Sci. 2018, 148, 707–713. [Google Scholar] [CrossRef]
  33. Ledesma, R.I.; Palmieri, F.L.; Lin, Y.; Belcher, M.A.; Ferriell, D.R.; Thomas, S.K.; Connell, J.W. Picosecond Laser Surface Treatment and Analysis of Thermoplastic Composites for Structural Adhesive Bonding. Compos. Part B Eng. 2020, 191, 107939. [Google Scholar] [CrossRef]
  34. Moreira, R.D.F.; Oliveira, V.; Silva, F.G.A.; Vilar, R.; de Moura, M.F.S.F. Influence of Femtosecond Laser Treated Surfaces on the Mode I Fracture Toughness of Carbon-Epoxy Bonded Joints. Int. J. Adhes. Adhes. 2018, 82, 108–113. [Google Scholar] [CrossRef]
  35. Sajzew, R.; Schröder, J.; Kunz, C.; Engel, S.; Müller, F.A.; Gräf, S. Femtosecond Laser-Induced Surface Structures on Carbon Fibers. Opt. Lett. 2015, 40, 5734–5737. [Google Scholar] [CrossRef] [PubMed]
  36. Kunz, C.; Büttner, T.N.; Naumann, B.; Boehm, A.V.; Gnecco, E.; Bonse, J.; Neumann, C.; Turchanin, A.; Müller, F.A.; Gräf, S. Large-Area Fabrication of Low- and High-Spatial-Frequency Laser-Induced Periodic Surface Structures on Carbon Fibers. Carbon N. Y. 2018, 133, 176–185. [Google Scholar] [CrossRef] [Green Version]
  37. Blaker, J.J.; Anthony, D.B.; Tang, G.; Shamsuddin, S.R.; Kalinka, G.; Weinrich, M.; Abdolvand, A.; Shaffer, M.S.P.; Bismarck, A. Property and Shape Modulation of Carbon Fibers Using Lasers. ACS Appl. Mater. Interfaces 2016, 8, 16351–16358. [Google Scholar] [CrossRef] [Green Version]
  38. ASTM C1557–03. Standard Test Method Tensile Strength Young’s Modulus Fibers; ASTM: West Conshohocken, PA, USA, 2003. [Google Scholar]
  39. ASTM. Standard Test Method for Mode I Interlaminar Fracture Toughness of Unidirectional Fiber-Reinforced Polymer Matrix Composites 1; ASTM: West Conshohocken, PA, USA, 2001. [Google Scholar]
  40. Stratan, A.; Zorila, A.; Rusen, L.; Nemes, G. Measuring Effective Area of Spots from Pulsed Laser Beams. Opt. Eng. 2014, 53, 122513. [Google Scholar] [CrossRef]
  41. Van, H.H.; Badura, K.; Zhang, M. Laser-Induced Transformation of Freestanding Carbon Nanotubes into Graphene Nanoribbons. RSC Adv. 2015, 5, 44183–44191. [Google Scholar] [CrossRef]
  42. Daniels, E.O. Laser Heat Treatment Processing for Pan Based Carbon Fiber Structure Modification; Florida State University: Tallahassee, FL, USA, 2017. [Google Scholar]
  43. Cançado, L.G.; Jorio, A.; Ferreira, E.H.M.; Stavale, F.; Achete, C.A.; Capaz, R.B.; Moutinho, M.V.O.; Lombardo, A.; Kulmala, T.S.; Ferrari, A.C. Quantifying Defects in Graphene via Raman Spectroscopy at Different Excitation Energies. Nano Lett. 2011, 11, 3190–3196. [Google Scholar] [CrossRef] [PubMed] [Green Version]
  44. Ferrari, A.C.; Meyer, J.C.; Scardaci, V.; Casiraghi, C.; Lazzeri, M.; Mauri, F.; Piscanec, S.; Jiang, D.; Novoselov, K.S.; Roth, S.; et al. Raman Spectrum of Graphene and Graphene Layers. Phys. Rev. Lett. 2006, 97, 187401. [Google Scholar] [CrossRef] [PubMed] [Green Version]
  45. Nakamura, H.; Tanaka, Y.; Nakai, A.; Kobayashi, S.; Ikuta, N. Interfacial Properties of Carbon Fiber Reinforced Thermoplastic Composites. In Proceedings of the 10th International Conference on Flow Processes in Composite Materials, Ascona, Switzerland, 11–15 July 2020. [Google Scholar]
  46. Ferrari, A.C. Raman Spectroscopy of Graphene and Graphite: Disorder, Electron-Phonon Coupling, Doping and Nonadiabatic Effects. Solid State Commun. 2007, 143, 47–57. [Google Scholar] [CrossRef]
  47. Guigon, M.; Oberlin, A.; Desarmot, G. Microtexture and Structure of Some High Tensile Strength, PAN-Base Carbon Fibres. Fibre Sci. Technol. 1984, 20, 55–72. [Google Scholar] [CrossRef]
  48. Edie, D.D. The Effect of Processing on the Structure and Properties of Carbon Fibers. Carbon N. Y. 1998, 36, 345–362. [Google Scholar] [CrossRef]
  49. Kim, T.; Lee, J.; Lee, K.H. Full Graphitization of Amorphous Carbon by Microwave Heating. RSC Adv. 2016, 6, 24667. [Google Scholar] [CrossRef] [Green Version]
  50. Onodera, A.; Irie, Y.; Higashi, K.; Umemura, J.; Takenaka, T. Graphitization of Amorphous Carbon at High Pressures to 15 GPa. J. Appl. Phys. 1991, 69, 2611. [Google Scholar] [CrossRef]
  51. Walters, J.K.; Fox, D.M.; Burke, T.M.; Weedon, O.D.; Newport, R.J.; Howells, W.S. The Effect of Temperature on the Structure of Amorphous Hydrogenated Carbon. J. Chem. Phys. 1994, 101, 4288. [Google Scholar] [CrossRef] [Green Version]
  52. Li, X.; Mao, H.K. Solid Carbon at High Pressure: Electrical Resistivity and Phase Transition. Phys. Chem. Miner. 1994, 21, 1–5. [Google Scholar] [CrossRef]
  53. Jin, C.H.; Wang, J.Y.; Chen, Q.; Peng, L.M. In Situ Fabrication and Graphitization of Amorphous Carbon Nanowires and Their Electrical Properties. J. Phys. Chem. B 2006, 110, 5423–5428. [Google Scholar] [CrossRef]
Figure 1. Photo of the vacuum assisted resin transfer molding process (VARTM).
Applsci 10 03561 g001
Figure 2. Schematic of the specimen for the Mode I test. L represents the length of the specimen, w the width, h the thickness and a0 the initial 50 mm pre-crack. The inset photo shows specimens ready to be measured.
Applsci 10 03561 g002
Figure 3. Representative snapshot during the Mode-I test.
Applsci 10 03561 g003
Figure 4. Schematic illustration of electrical conductivity probe contacts. (a) Out of plane through volume conductivity. (b) Out of plane through thickness conductivity.
Applsci 10 03561 g004
Figure 5. (a) Fluence, scan speed, and power correlation contour map. (b) Relationship between fluence and scan speed at different laser beam powers.
Applsci 10 03561 g005
Figure 6. Scanning electron microscopy (SEM) micrographs of the irradiated samples. (a,b) bTCF, (c,d) TCF3.75 W, (e,f) TCF4.25 W, (g,h) TCF4.75 W, (i,j) TCF7.5 W, (k,l) TCF10 W, (m,n) bPCF, and (o,p) PCF4.25 W. (More detailed SEM micrographs can be found in the supporting information, Section S1, Figures S8–S16).
Applsci 10 03561 g006
Figure 7. Raman analysis of the irradiated samples. TCF denotes Toray carbon fibers (T700SC), while PCF denotes the Pyrofil fibers (TR50S). bTCF and bPCF represent control bare non-exposed carbon fiber (CFs).
Applsci 10 03561 g007
Figure 8. Fluence vs ID/IG intensity ratio of the irradiated samples.
Applsci 10 03561 g008
Figure 9. Single carbon fiber tensile strength for all irradiated samples.
Applsci 10 03561 g009
Figure 10. Electrical conductivity (σ) of all irradiated yarns.
Applsci 10 03561 g010
Figure 11. GIc load (N) versus displacement (mm) representative curve for reference and PCF4.25 W samples.
Applsci 10 03561 g011
Figure 12. (a) Average GIc mode-I interlaminar fracture toughness. (b) Propagation R-curves for both reference and PCF4.25 W samples.
Applsci 10 03561 g012
Figure 13. Fractography analysis of the reference (a,b) and PCF4.25 W (c,d) samples after Mode I test.
Applsci 10 03561 g013
Figure 14. Out of plane electrical conductivity (σ) of the fabricated composite structures.
Applsci 10 03561 g014
Table 1. Fluence calculation of all irradiated samples.
SampleScan Speed (cm/s)Power (W)PPIFluence (J/cm2)
TCF3.75 W48.53.75100037
TCF4.25 W48.54.25100042
TCF4.75 W48.54.75100047
TCF7.5 W48.57.5100074
TCF10 W48.510100099
PCF4.25 W 48.54.25100042
Table 2. Tensile strength and electrical conductivity (σ) of all irradiated samples.
SampleTensile Strength (GPa)Electrical Conductivity
σ (S/cm)
bTCF3.21 ± 0.22220 ± 11
TCF3.75 W1.59 ± 0.21222 ± 15
TCF4.25 W1.34 ± 0.19257 ± 13
TCF4.75 W1.25 ± 0.23261 ± 17
bPCF3.19 ± 0.26180 ± 12
PCF4.25 W2.14 ± 0.28199 ± 14
Table 3. Mode I interlaminar fracture toughness and electrical conductivity of the fabricated laminates.
Mode-I GIc (J m−2)Electrical Conductivity σ (S/cm)
Through VolumeThrough Thickness
reference1268 ± 563.4 10−2 ± 3.5 10−35.1 10−3 ± 2.8 10−4
PCF4.25 W1254 ± 804.9 10−2 ± 3.8 10−36.0 10−3 ± 3.5 10−4

