Article

Raman Spectral Analysis for Quality Determination of Grignard Reagent

1
Department of Biosystems Machinery Engineering, College of Agricultural and Life Science, Chungnam National University, 99 Daehak-ro, Yuseong-gu, Daejeon 34134, Korea
2
Department of Biosystems Engineering, College of Agriculture and Life Sciences, Kangwon National University, Chuncheon 24341, Korea
3
Department of Agricultural and Biosystems Engineering, Faculty of Agricultural Technology, Gadjah Mada University, Yogyakarta 55281, Indonesia
4
Environmental microbial and Food Safety Laboratory, Agricultural Research Service, Unite States Department of Agriculture, Powder Mill Road, BARC-East, Bldg 303, Beltsville, MD 20705, USA
*
Authors to whom correspondence should be addressed.
Appl. Sci. 2020, 10(10), 3545; https://doi.org/10.3390/app10103545
Submission received: 28 March 2020 / Revised: 13 May 2020 / Accepted: 18 May 2020 / Published: 20 May 2020
(This article belongs to the Special Issue Application of Hyperspectral Imaging for Nondestructive Measurement)

Abstract

:
Grignard reagent is one of the most popular materials in chemical and pharmaceutical reaction processes, and requires high quality with minimal adulteration. In this study, Raman spectroscopic technique was investigated for the rapid determination of toluene content, which is one of the common adulterants in Grignard reagent. Raman spectroscopy is the most suitable spectroscopic method to mitigate moisture and CO2 interference in the molecules of Grignard reagent. Raman spectra for the mixtures of toluene and Grignard reagent with different concentrations were analyzed with a partial least square regression (PLSR) method. The combination of spectral wavebands in the prediction model was optimized with a variables selection method of variable importance in projection (VIP). The results obtained from the VIP-based PLSR model showed the reliable performance of Raman spectroscopy for predicting the toluene concentration present in Grignard reagent with a correlation coefficient value of 0.97 and a standard error of prediction (SEP) of 0.71%. The results showed that Raman spectroscopy combined with multivariate analysis could be an effective analytical tool for rapid determination of the quality of Grignard reagent.

1. Introduction

Chemical reagents play a crucial role in the chemical and pharmaceutical fields as well as several other areas. The Grignard reagent, having the molecular formula R-MgX (where R is an alkyl or an aryl group), is a widely used type of organometallic reagent formed by the reaction of an alkyl halide and magnesium metal in an ethereal solvent, which provides the ligands that stabilize the organo-magnesium compound formed by complexation of ether oxygen at the magnesium center.
CH 3 CH 2 Br + Mg + C 2 H 5 O C 2 H 5     CH 3 CH 2 Mg Br
The reagent was named after Victor Grignard (1871–1935), who jointly received the Nobel Prize in chemistry with Paul Sabatier in 1912. The Grignard reaction is an easy method to synthesize various organic compounds required for different chemical reactions, owing to the formation of a new C-C bond. The reagent works as an active pharmaceutical ingredient (API) and thus plays an important role in pharmaceutical industries [1] in the synthesis of various drugs. Moreover, the Grignard reagent is used for the industrial preparation of Tamoxifen, [2] which is used in the early treatment of breast cancer in both men and women [3]. Further, the reagent is used in the synthesis of 5-(4′-methylbiphenyl-2-yl)-1H-tetrazole, [4] which is a key intermediate in the preparation of several angiotensin II receptor antagonists. Owing to its wide range of applications and the strong demand for this reagent, it is essential to evaluate its quality by evaluating its possible adulteration. Presently, the widely available methods for quality determination of chemical reagents are high-performance liquid chromatography (HPLC), mass spectrometry (MS), and nuclear magnetic resonance spectroscopy (NMR). These methods are highly accurate and can detect the adulterants in parts per million (ppm) or parts per billion (ppb) levels. However, they have several shortcomings; for instance, they are time-consuming, destructive, and entail high analysis costs, thus limiting their applicability for regular use. Therefore, there is a need to develop a technique that can overcome all the aforementioned drawbacks and provide an alternative tool for the quality measurement of Grignard reagent.
Spectroscopy is an effective and imperative tool for investigating the structure of chemically relevant systems. It is useful for extracting information such as structural and other physicochemical properties of molecules by analyzing the interaction of electromagnetic radiation with matter. Further, it is capable of determining atomic and molecular structures and is used for measuring the energy difference between different molecular energy levels. Various spectroscopic techniques are used for measuring experimental parameters, such as the energy of the radiations absorbed or emitted by the molecules, and the intensity of spectral lines.
In the case of near-infrared (NIR) absorption, the presence of combination and overtone bands from functional groups in the chemical compounds results in spectra broadness, which reduces the sensitivity, accuracy and precision of spectroscopy [5]. Raman spectroscopy, which is a non-destructive analytical technique that relies on the inelastic scattering of the light by the substances under examination, has garnered considerable attention because of its good analytical performance with pharmaceutical materials. This technique has emerged as a novel technology that can overcome the aforementioned drawbacks of NIR spectroscopy and ensure simultaneous detection of multiple components of mixtures present in samples. Several studies have employed Raman spectroscopy for the quantitative analysis of food and agricultural products, e.g., melamine in liquid milk [6], dairy creams, cream-like analogs [7], fake eggs detection [8], argan oil adulteration [9], etc. Further, Raman spectroscopy was also utilized for pharmaceutical product design [10] and content uniformity of a dry powder inhaler [11].
Grignard reagent reacts rapidly with the moisture and carbon dioxide present in the atmosphere and undergoes crystallization through an exothermic reaction (∆E = -ve).
C H 3 C H 2 M g Br + H 2 O   C H 3 C H 3 + Mg ( OH ) Br
C H 3 C H 2 MgBr + CO 2   C H 2 CO-OMgBr
For the spectral measurement, attenuated total reflection (ATR) Fourier transform infrared (FT-IR) spectroscopic measurement cannot be used due to the direct interaction of the reagent with the moisture present in the atmosphere during the sample placement on the diamond crystal holder. FT-IR measurement using a probe is also not a good choice, as the sample comes in contact with air moisture when inserting the probe in the sample container and takes more acquisition time. Further, measuring samples using a cuvette in FT-IR is also not useful due to higher sensitivity of glass or quartz cuvettes, which therefore generates a great deal of unwanted information during the measurement. Thus, Raman spectroscopy is considered as a solution to this problem, as the spectra collection is performed inside the closed cuvette to avoid moisture issues and the sample measurement is much easier and fast compared with the above-mentioned techniques. To date, no study has utilized Raman spectroscopy for the non-destructive quality determination of Grignard reagent. Hence, the main goal of this study was to investigate the feasibility of Raman spectroscopic analysis to determine the toluene adulteration in Grignard reagent in a rapid and nondestructive manner.

2. Materials and Methods

2.1. Sample Collection and Preparation

The chemicals used in this study were Grignard reagent (98%) and toluene (99%), which were purchased from Sigma-Aldrich (St. Louis, MO, USA). Given the high solubility and low toxicity of toluene compared with tetrahydrofuran (THF), it was used as a medium during the sample preparation. In this study, the Grignard reagent samples were spiked with toluene under different concentrations (0%, 1%, 2%, 3%, 4%, 5%, 10%, 15%, and 20% v/v) in a total volume of 30 mL shown in Table 1. The preparation of all the samples was performed inside the fume hood to protect the chemicals when coming in contact with the atmospheric moisture. Further, the spiked samples were transferred to individual snap-cap vials; then, the vortex mixer high-speed Vortex Gene2 (Scientific Industries, Inc., USA) was used for 40 s to achieve the uniform solution of chemicals. Ten samples from each of the nine groups with different amount of adulterant present, i.e., 90 samples, were prepared for Raman spectroscopic measurement.

2.2. Raman Spectral Measurement

The Raman spectra of pure and adulterated Grignard reagents were recorded using a portable i-Raman spectrometer (BWTEK Inc., USA) configured with a charge-coupled device (CCD) detector having a pixel size of 14 × 900 μm and a 785-nm laser. All the Raman spectra of the chemical samples were collected in a dark room to avoid light interference during spectral acquisition. The laser light source was operated at 785 nm with laser power of 200 mW, and spectra were collected for each sample in the wavenumber range of 400–1650 cm−1 under 1 s exposure time and with a spectral resolution of 2 cm−1. The BAC100 model from BWTEK Inc. (Newark, DE 19713, USA) was utilized as a standard probe for the experiment. During the spectral collection, the cuvette was dried before the measurement. Subsequently, each sample was injected with a syringe into the closed quartz cuvette from the top to prevent the sample from coming in contact with moisture. The sample was then placed at a distance of 2 mm in front of the probe, which had been calibrated in advance to ensure that the laser would penetrate the sample inside the cuvette. After the spectral acquisition, the cuvette was first cleaned with toluene to avoid crystallization inside the cuvette, which was then further cleaned with alcohol before being dried for further measurement. The integration time during the scan was 10,000 ms, four scans were used to generate high-quality Raman spectra, and the averaged spectra of each sample were used for model development.

2.3. Data Preprocessing and Multivariate Analysis

A high-energy laser light source was used for generating the Raman signal. The generation of background fluorescence signals by the organic and inorganic samples is one of the major challenges in Raman spectroscopy. Various mathematical methods have been developed so far, such as polynomial fitting, wavelet transformation, Fourier transformation, and derivatives, to eliminate the baseline shift caused by fluorescence in Raman spectra [12]. In this study, the polynomial curve fitting method was employed for analyzing Raman spectra affected by fluorescence, as it is more convenient, faster, and more effective than the other methods [13,14]. This process works on the principle of obtaining a proper order of the polynomial to generate a baseline by using iterative calculations.
The Raman spectral data are influenced by unintentional noise, which affects the spectral features and prediction performance of the model. Therefore, spectral pretreatment is necessary in order to acquire the required spectral information from the data. After the correction of the spectra using the polynomial fitting method, the spectra were further subjected to the multiplicative scatter correction (MSC) pre-processing method. The pre-processed spectral data were later used for developing the calibration model and then analysed using partial least squares regression (PLSR) in conjunction with a variable selection method using MATLAB (Version 7, The Mathworks, Natick, MA, USA).
The principal component analysis was applied to the MSC pre-processed data to make the data easy to explore and visualize. The score plot is useful for the projection of data into a subspace, which is used as a basis for interpreting the relations between the variables.
The PLSR model is used to determine the linear relationship between the dependent and independent variable matrices by predicting the properties of the dependent variable [15,16]. The PLSR model can be expressed by using the following equations:
X = TPT + E
Y = UQT + E
where X and Y represent the independent and dependent variables, respectively; T and U are the score matrices; PT and QT are the loading matrices of X and Y, respectively; and E is the error matrix.
In this study, the independent matrix, X, consisted of spectral data for Grignard reagent, while the dependent matrix Y, consisted of nine different toluene concentrations: 0%, 1%, 2%, 3%, 4%, 5%, 10%, 15%, and 20%. During the calibration model development, the selection of the optimal number of factors or latent variables is crucial to ensure the satisfactory performance of the model. Inappropriate selection of LVs creates “over-fitting” or “under-fitting”, which are responsible for the suppression of information from the developed model. Therefore, to prevent these issues in the developed model, the LVs were selected according to the lowest standard error values during the cross-validation process (CV) [17].

2.4. Variable Selection

Variable importance in projection (VIP), a type of variable selection method, was used to choose the suitable number of wavebands that are meant to provide the maximum prediction of different concentrations of toluene added to Grignard reagent [18]. The general equation for calculating the VIP score of a variable j is as follows:
V I P j = F = 1 F W j f 2 ×   S S Y f × J   S S Y t o t a l ×   F
where Wif is the weight value for component f of variable j; SSYf is the sum of the squares of the explained variance for the fth component, J is the number of variables, SSYtotal is the total sum of the squares for the dependent variable, and F is the total number of components. Several studies selected the variables with a VIP score higher than a constant value such as 1 [19,20] or 2 [21].

3. Results and Discussion

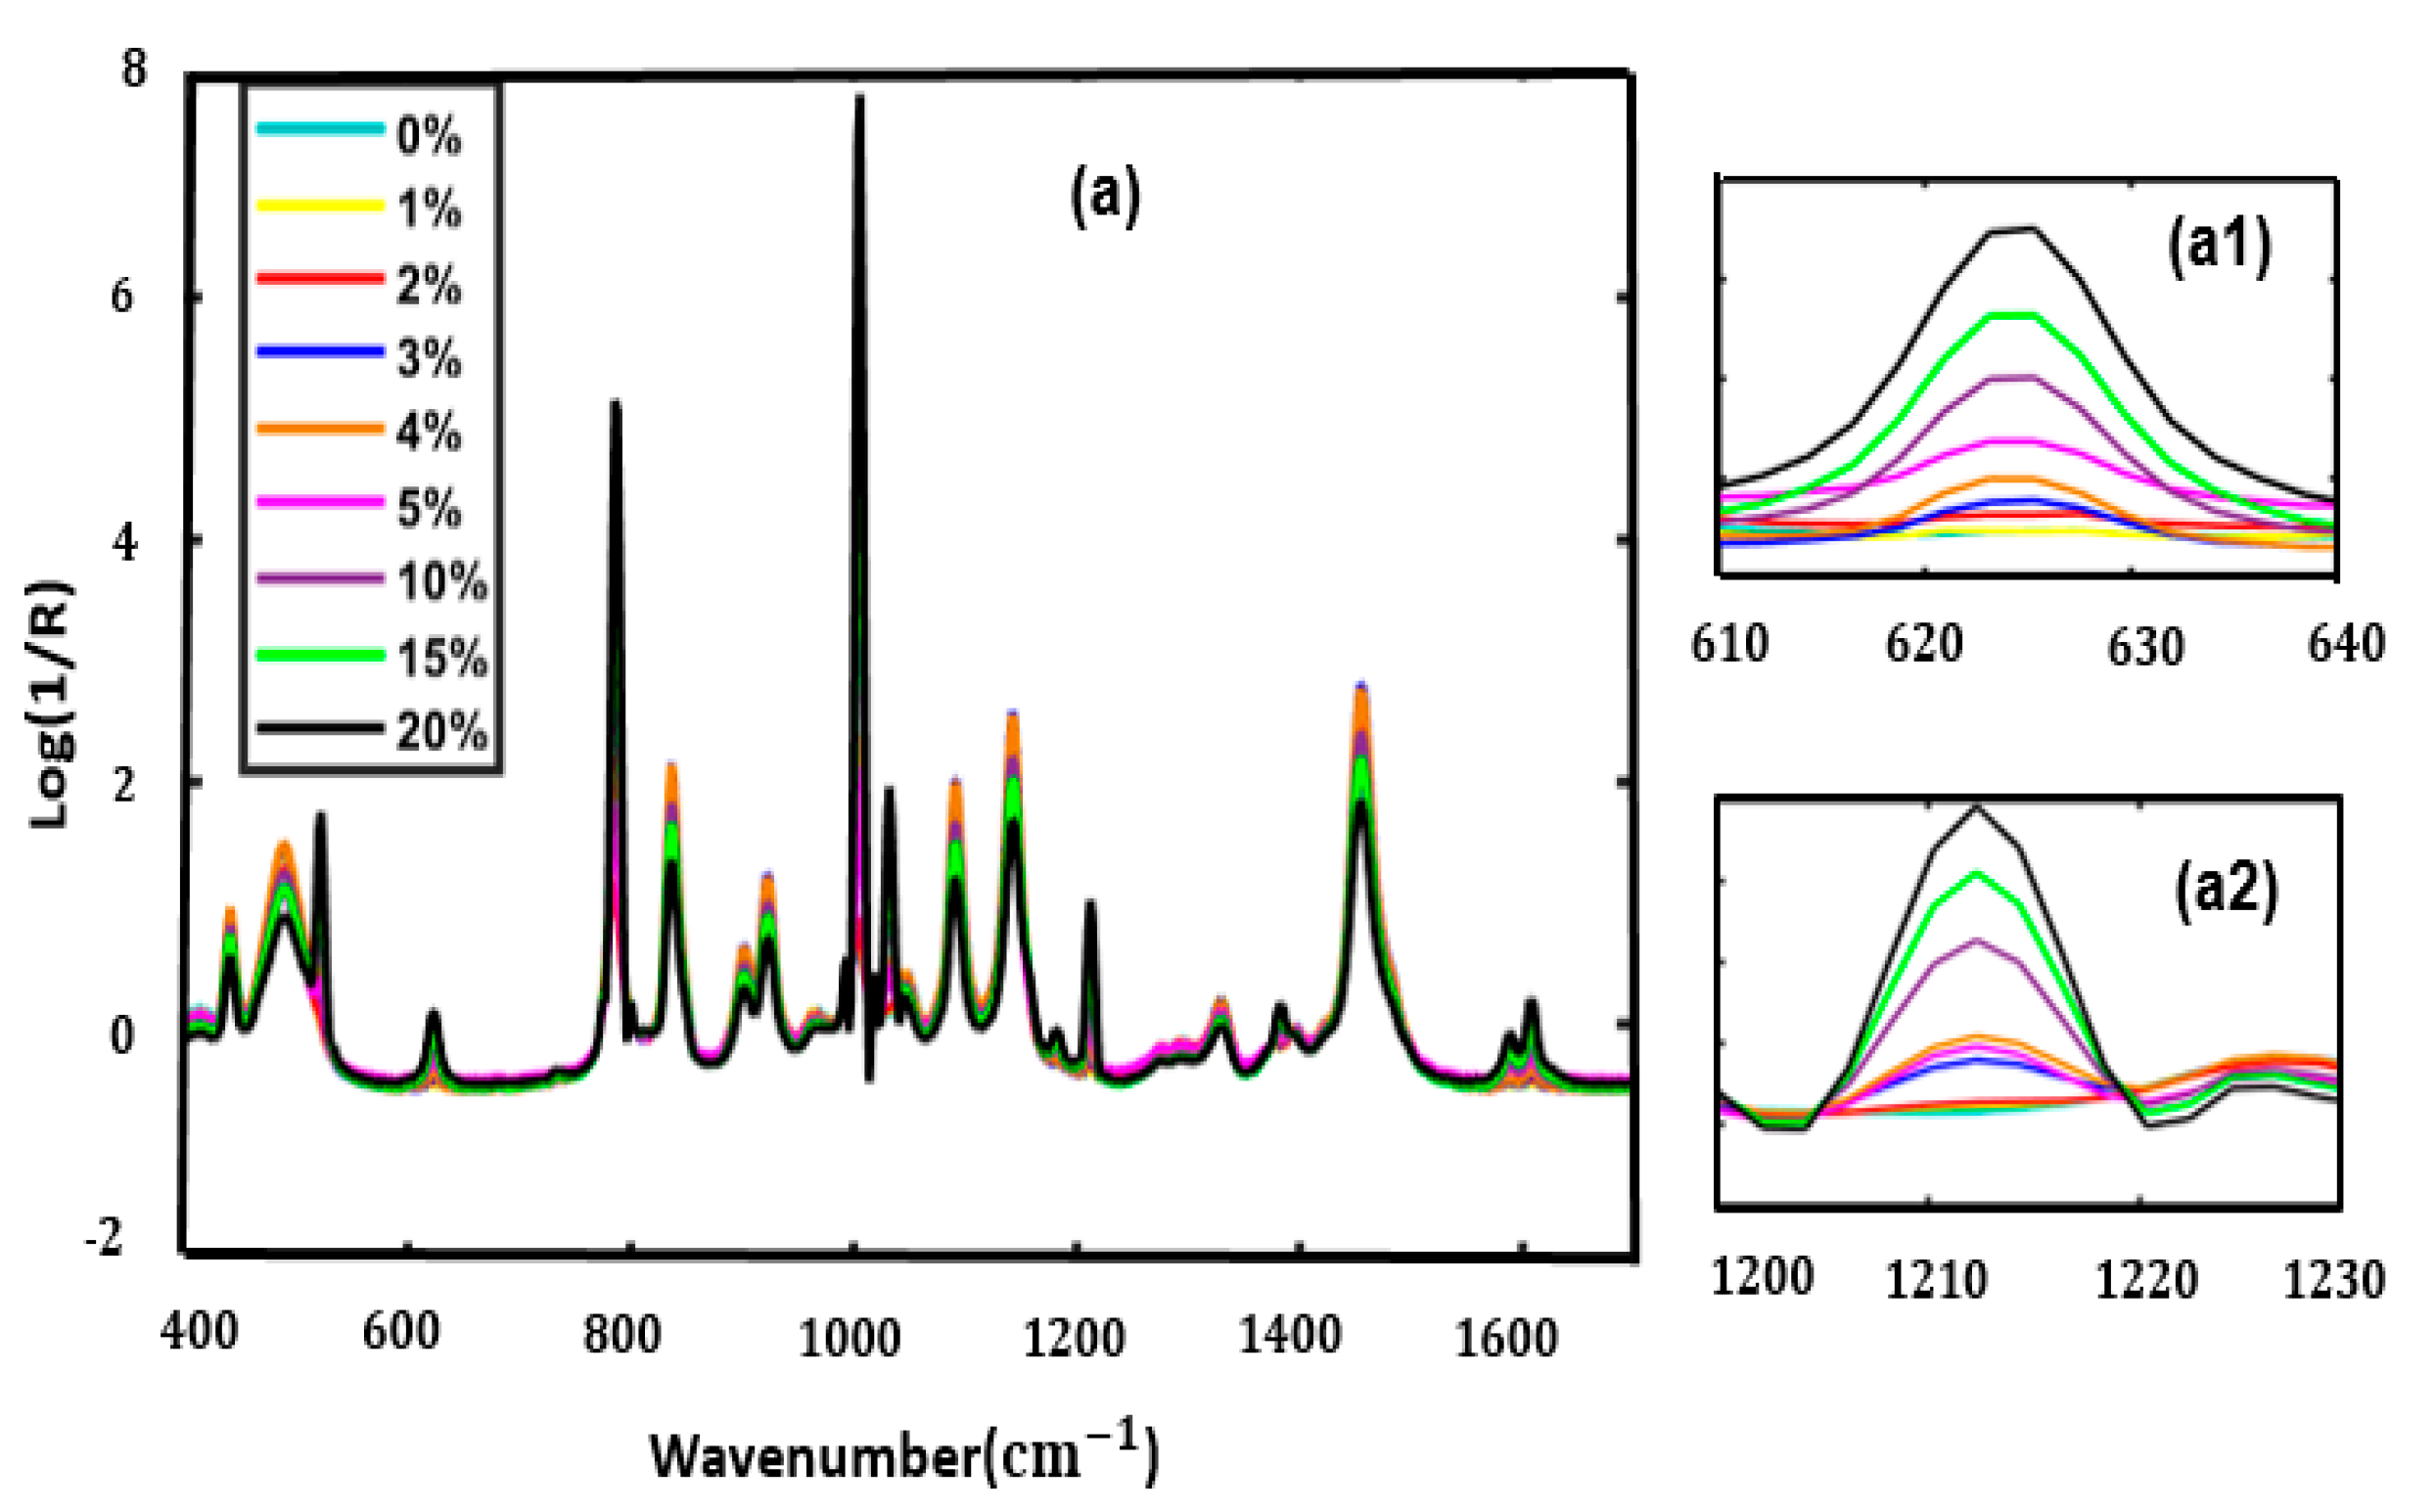
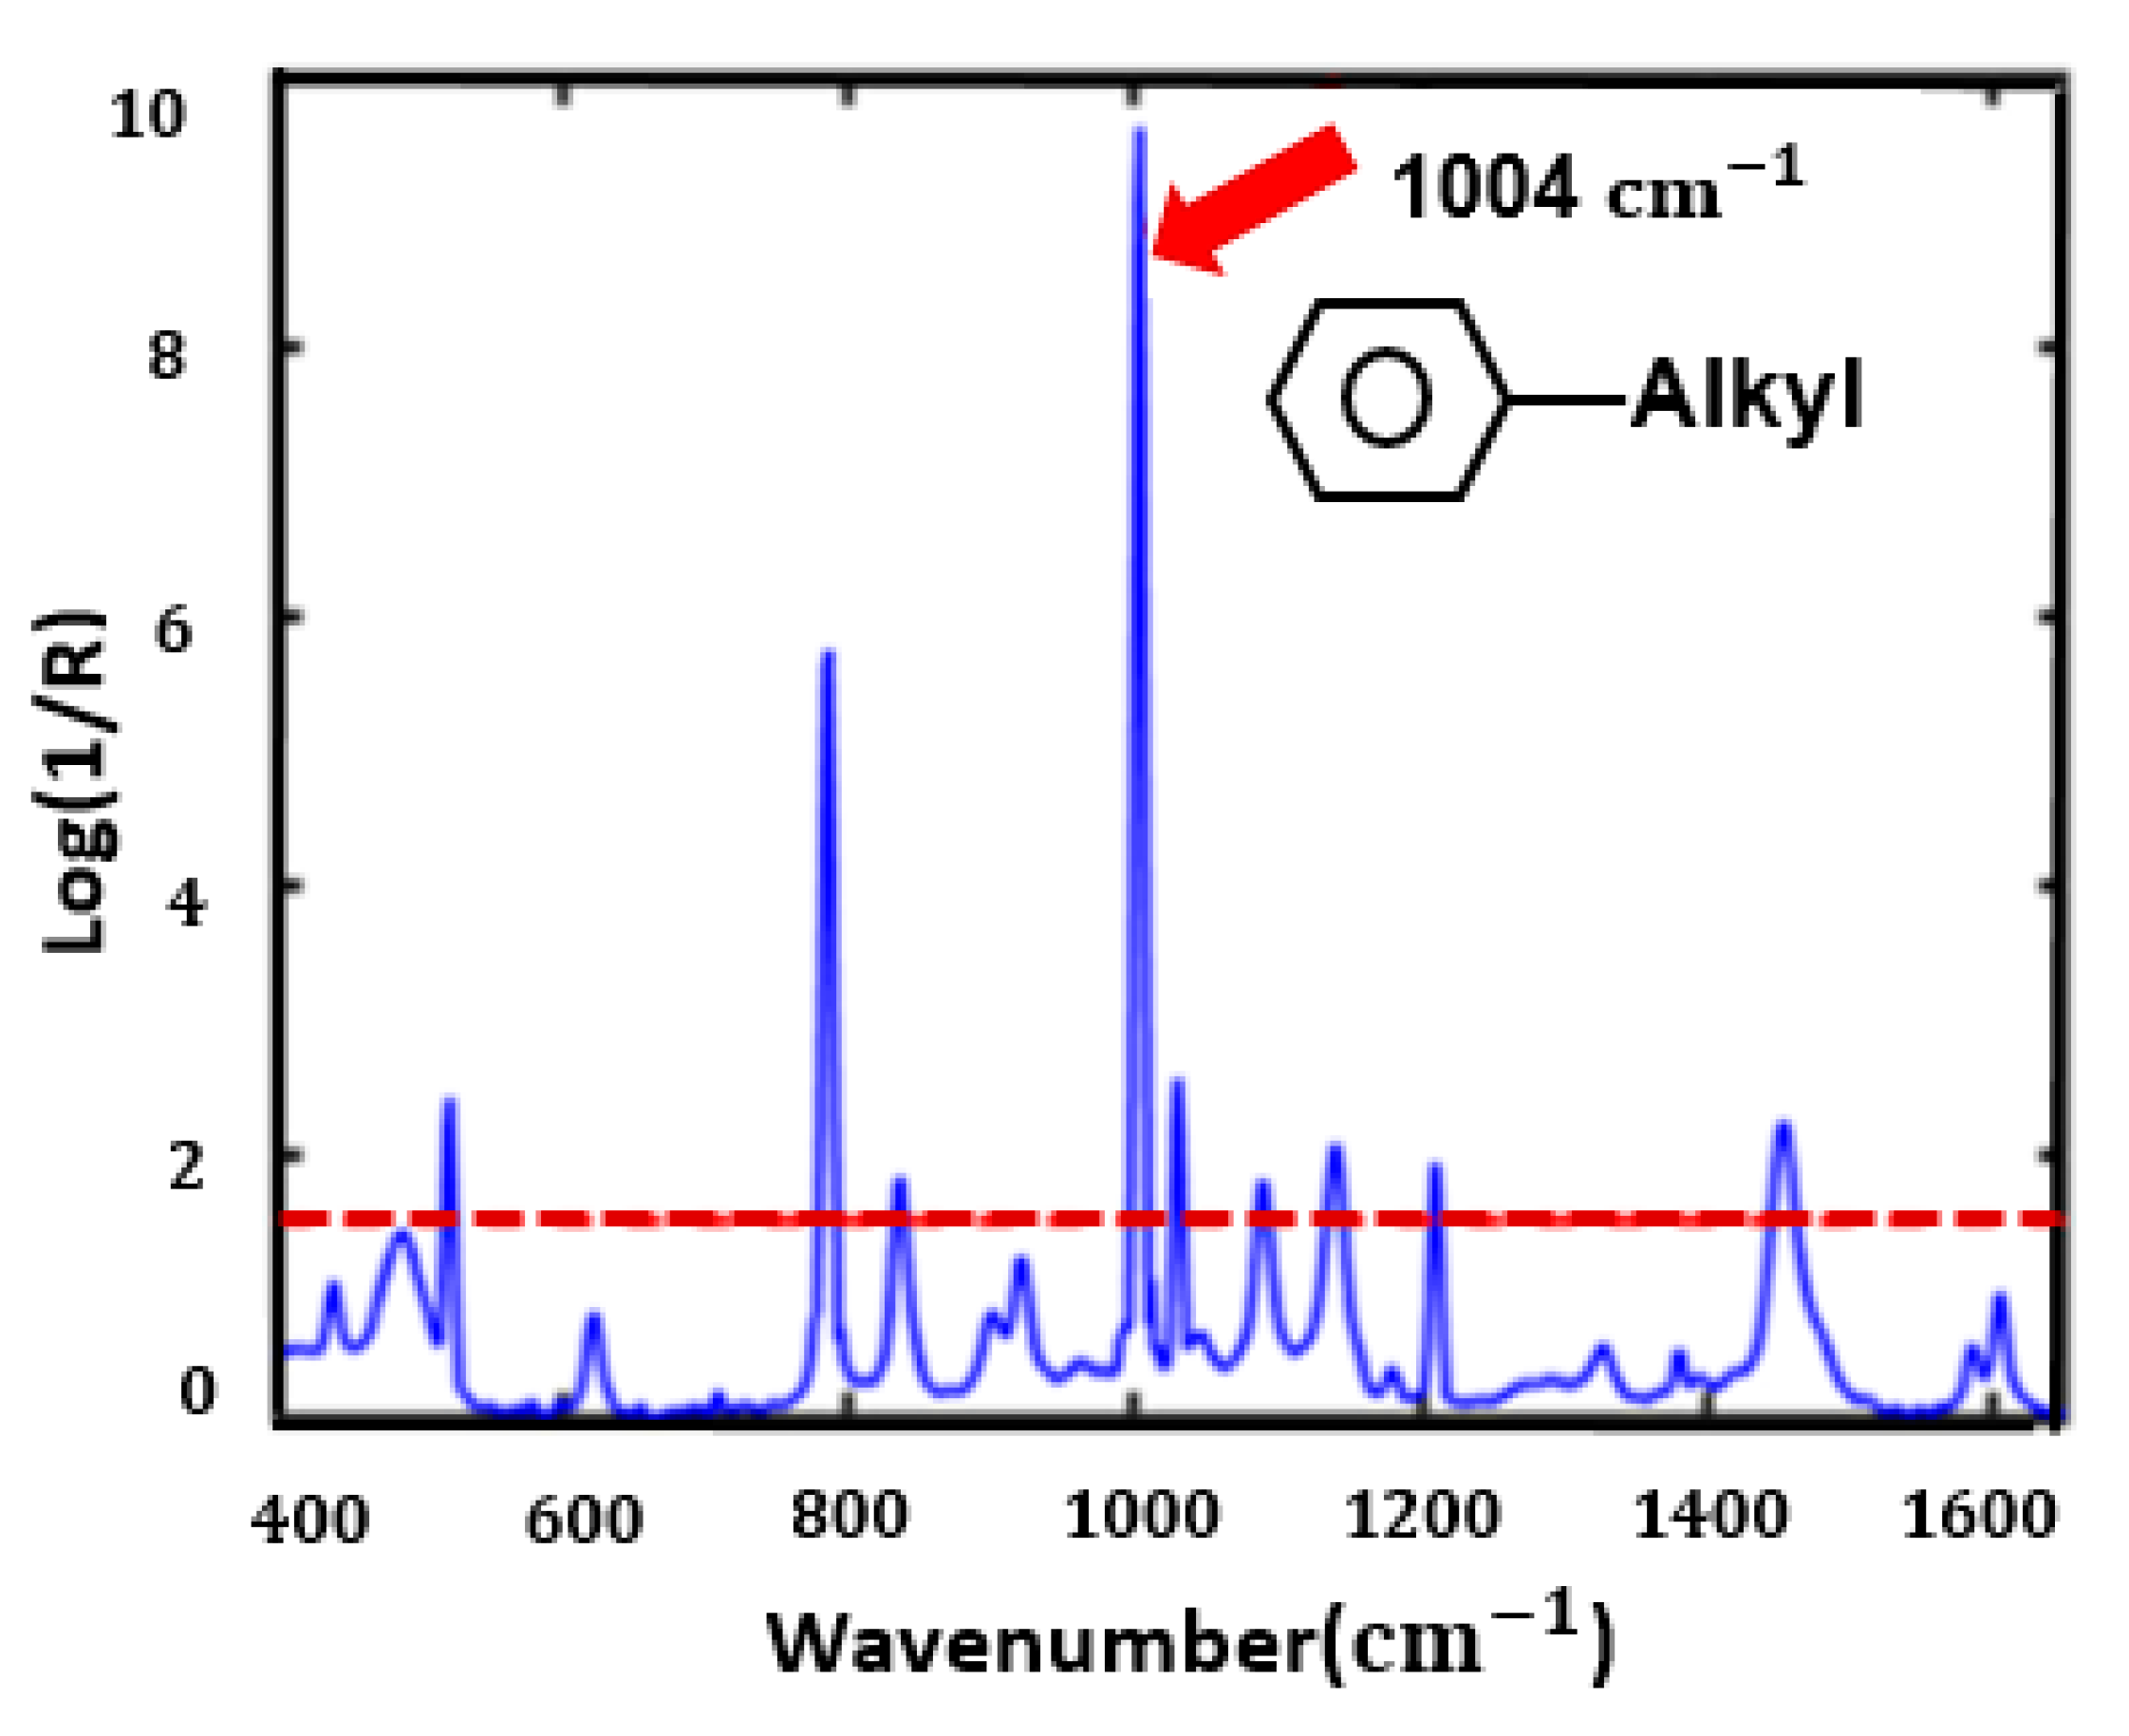
3.1. Spectral Interpretation

The Raman scattered spectra shown in Figure 1a were obtained for both the pure Grignard reagent and the Grignard reagent spiked with toluene. The corresponding spectral data obtained were preprocessed using the MSC preprocessing method. During model development, only the spectral region from 400 to 1650 cm−1 was selected for developing the model owing to the presence of the peaks related to the toluene concentration in the Grignard reagent, while the rest of the spectral region (1800–2500 cm−1) was not considered in this study, as there was no relevant information in this spectral region. The MSC pre-processed spectra show changes in the spectral pattern and intensities at around 600 cm−1 and 1200 cm−1, which is further clearly mentioned in the expanded spectral regions indicated as (a1) and (a2). These variations in the intensity of the spectra may have occurred owing to increased concentrations of toluene present in the Grignard reagent samples. It is difficult to differentiate the pure and adulterated Grignard reagent spectra by merely looking at the specific peaks obtained. Thus, there is a need for the multivariate analysis method to obtain better analytical performance for the prediction of possible adulteration.

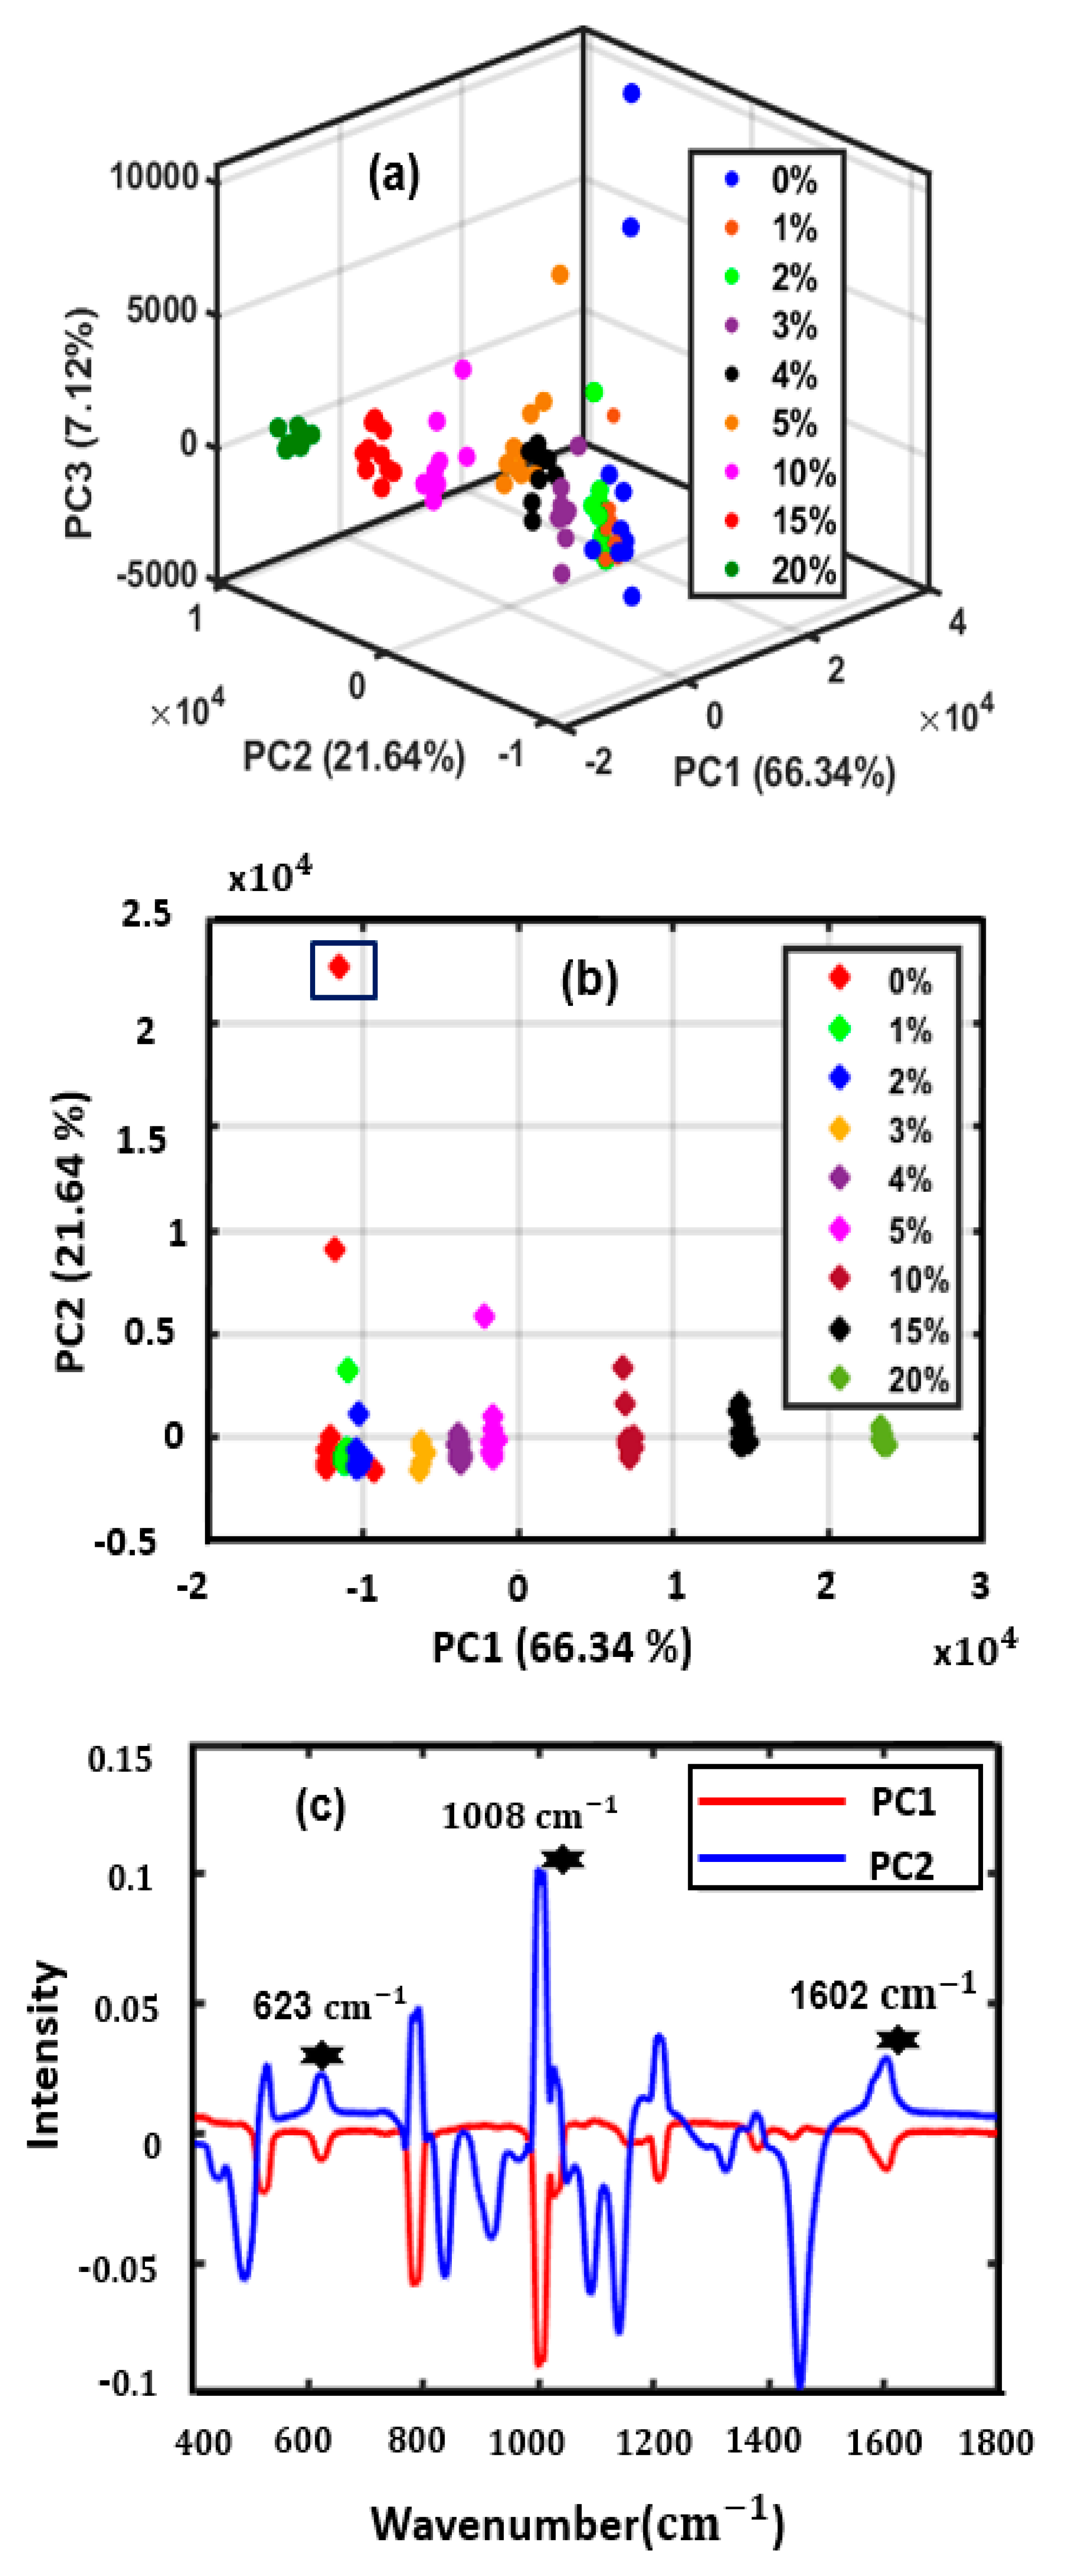
3.2. Principal Component Analysis (PCA) Model Data Visualization

The resultant scatter plot of the PC scores shows clustering depending on the different concentrations of toluene in the Grignard reagent samples. The first three principal components loadings accounted for nearly 95% of the total sample variance; subsequent PCs were unimportant and probably reflected noise in the data. The developed model could efficiently isolate the Grignard reagent with higher toluene concentration (5–20% [v/v]), whereas the samples with lower toluene concentration (0–4% [v/v]) overlapped, as shown in Figure 2a. Further, the resulting score plot in 2 D shows an outlier highlighted in the blue box in Figure 2b due to the smaller difference in the lower concentration range while the rest of the concentration separated.
We further developed a PC loading plot for the first two loading components (PC1 and PC2), which clearly explained the correlation weights of the variables. The loading plot revealed some useful information as highlighted in Figure 2c. The peaks around 623 cm−1, 1008 cm−1, and 1602 cm−1 are related to ring deformation, the presence of mono substituted benzene ring, ring stretch (Ar-C), and ring stretch doublet vibration, respectively [22]. Thus, all the extracted spectral information under the following waveband regions obtained from the loading plots provides significant information valuable for the distinction of toluene present in the Grignard reagent; therefore, the utilization of the PCA method is worthwhile to acquire the information regarding the samples and creates a basis for the development of the prediction model using PLSR.

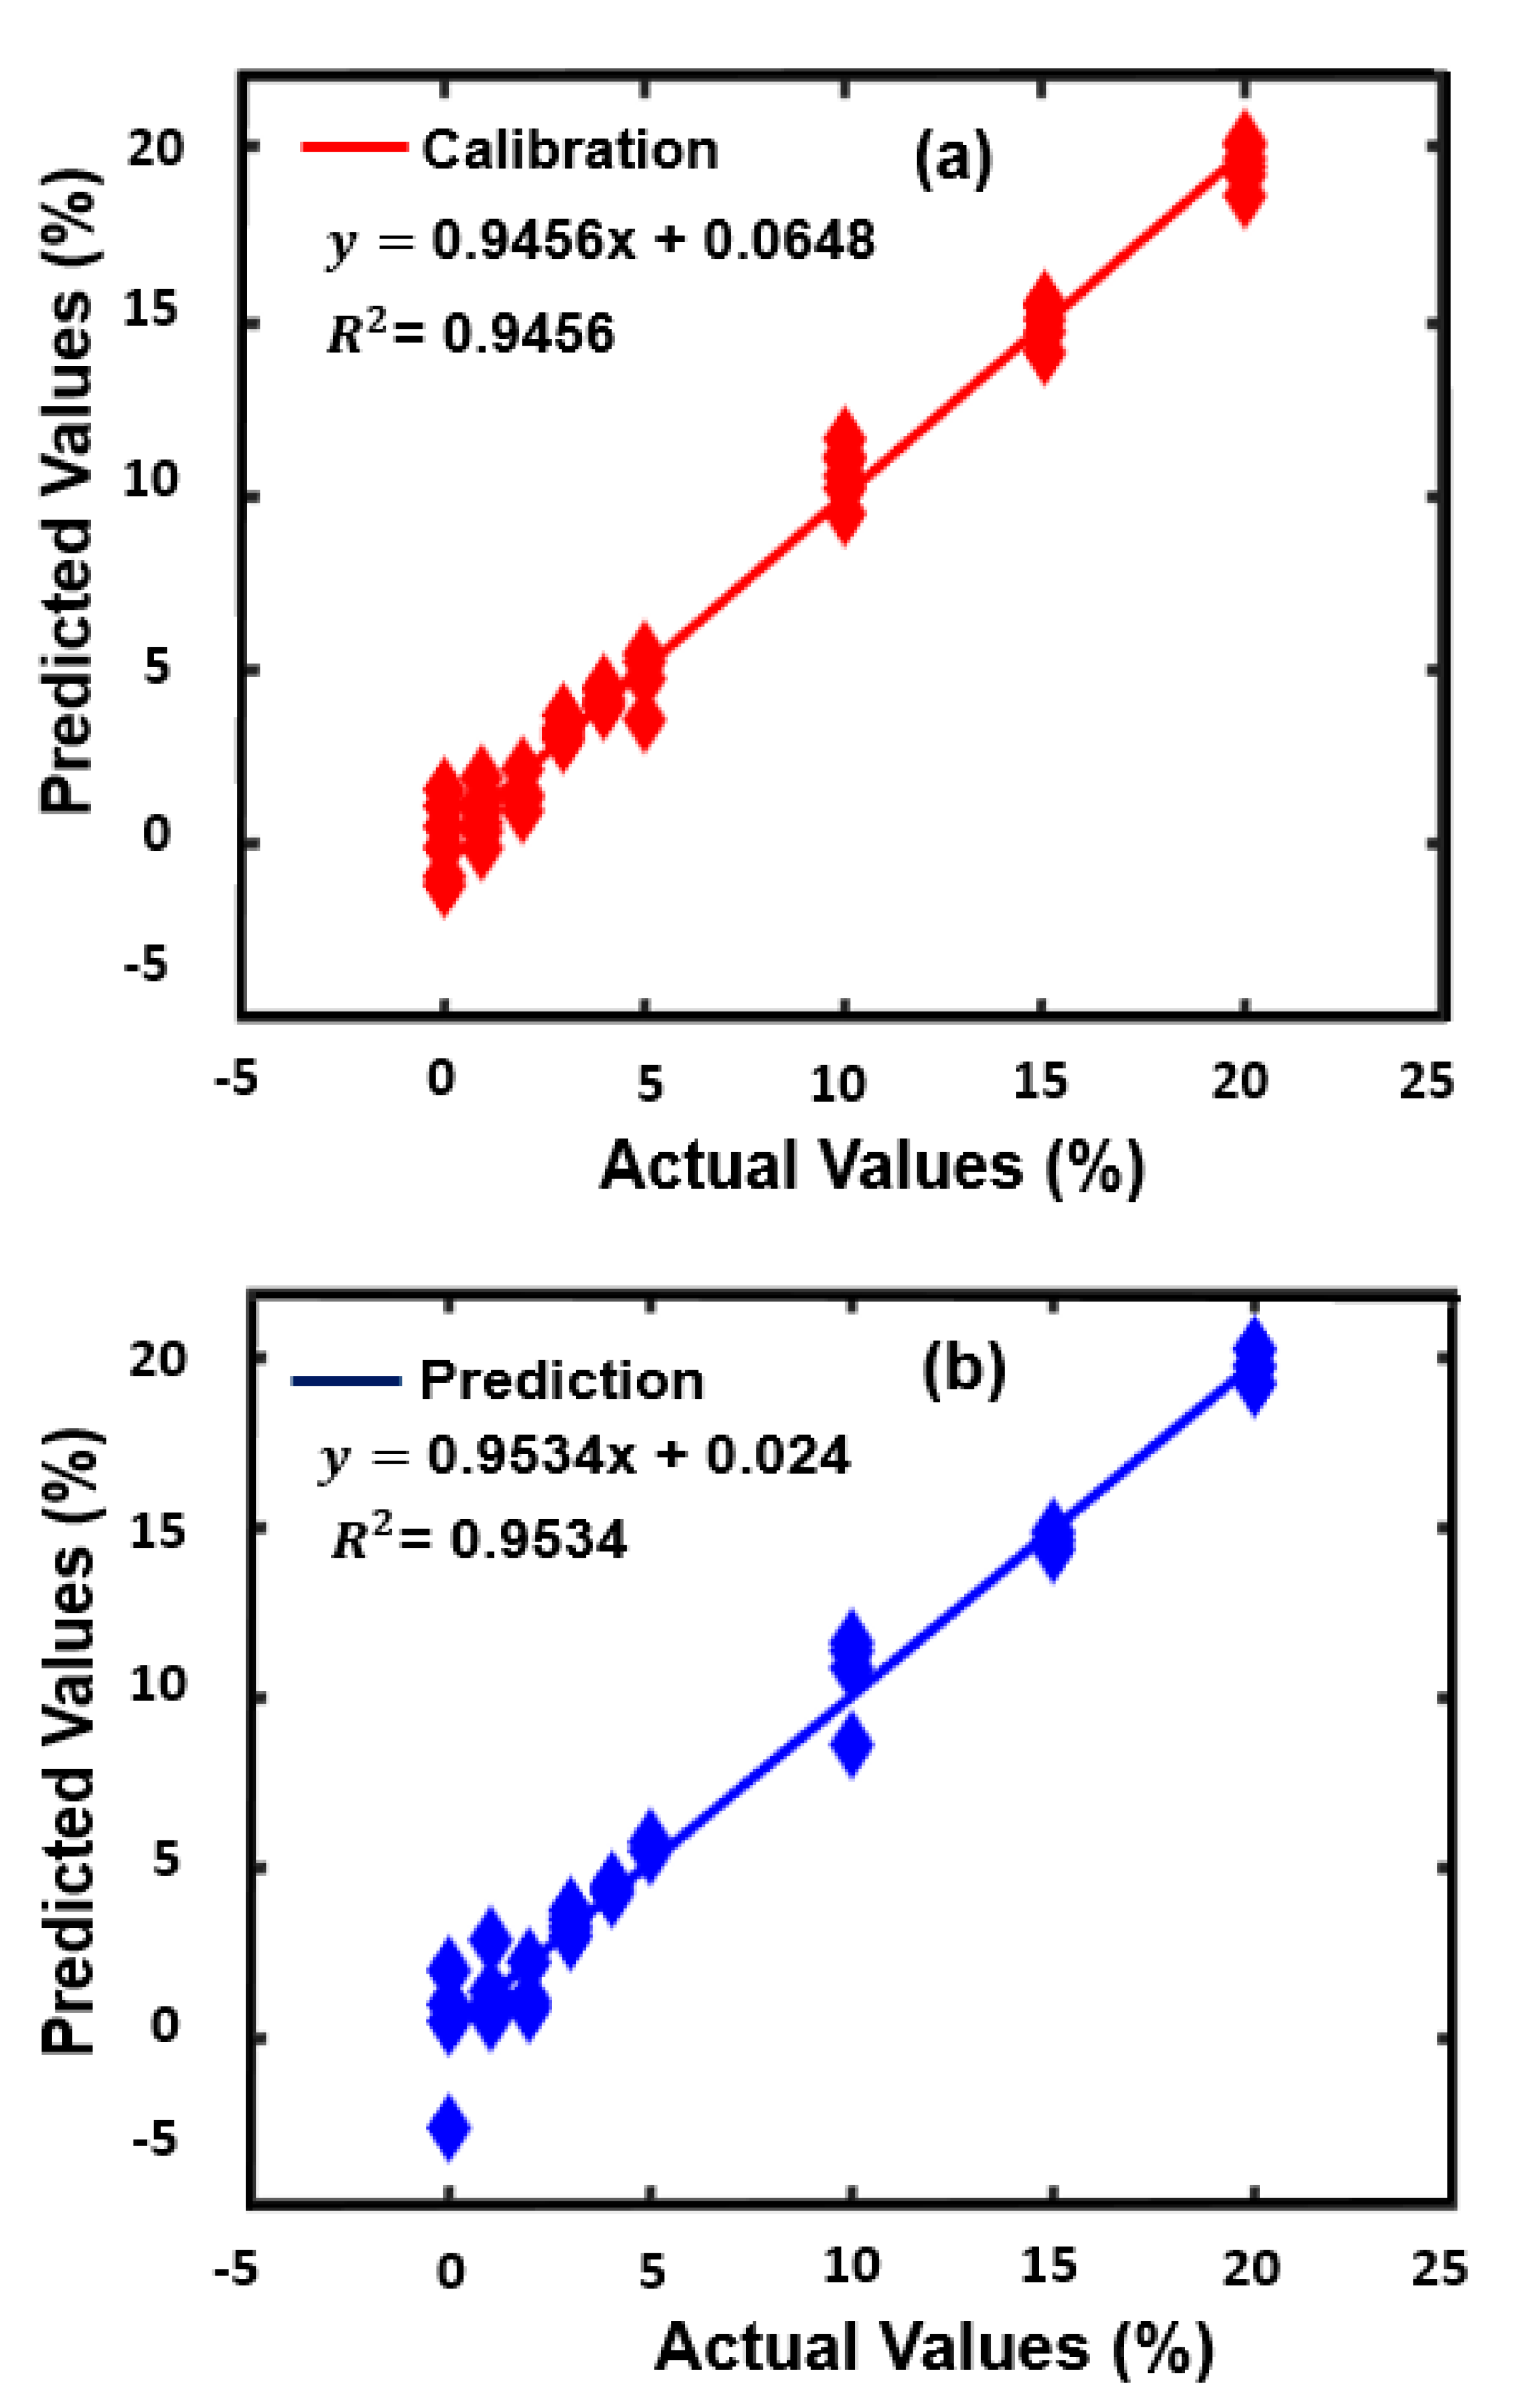
3.3. PLSR Models to Predict Toluene-Adulterated Grignard Reagent

To accomplish a high predictive performance and overcome probable errors due to data over-fitting, the appropriate selection of latent variables is crucial. As described earlier, four latent variables were selected for the PLSR-based model, which solely depends on the lower error rate. To evaluate the accuracy of the model, the dataset consisting of 90 samples was divided into calibration (50 samples) and validation (40 samples), set in a ratio of 5:4. The coefficient of determination (R2) and root mean square error (RMSE) are considered to be the most important factors for evaluating the performance of the model. Thus, the higher the correlation values, the better the calibration method. Figure 3a,b show the original toluene concentrations and the values predicted by the PLSR model for the Grignard reagent with sample concentrations ranging from 0% to 20%. From the figure, it can be seen that the original and predicted values showed an excellent agreement with each other. The calibration model yielded a high R2 value of 0.94 with a standard error of calibration (SEC) value of 0.65%, whereas the corresponding prediction set yielded R2 and SEP values of 0.95 and 0.79%, respectively.
In the multivariate analysis, beta coefficients are useful for the localization of wavenumbers that contain valuable information about chemical features. The value of beta coefficients indicates the extent of change in the predicted value when the corresponding predictor is increased by 1 unit, keeping all other predictors constant. Furthermore, the signs (plus or minus) of the beta coefficients are also used to interpret the direction of the relationship between variables. The higher the beta value, the greater the influence on the predicted value [23]. Figure 4a shows the beta coefficient plot for the developed PLSR model. As a result of comparing the spectra of pure toluene and Grignard reagent shown in Figure 4b, it is observed that the peaks obtained for the toluene come under the same region as the one shown in the beta coefficient plot in Figure 4a. Certain different types of important peaks are observed in the beta coefficients plot (Figure 4a) around 621, 1004, 1210, and 1606 cm−1 as clearly indicated above in the PCA loading plot [22]. The following regions clearly show the sensitivity of the toluene present in this region.

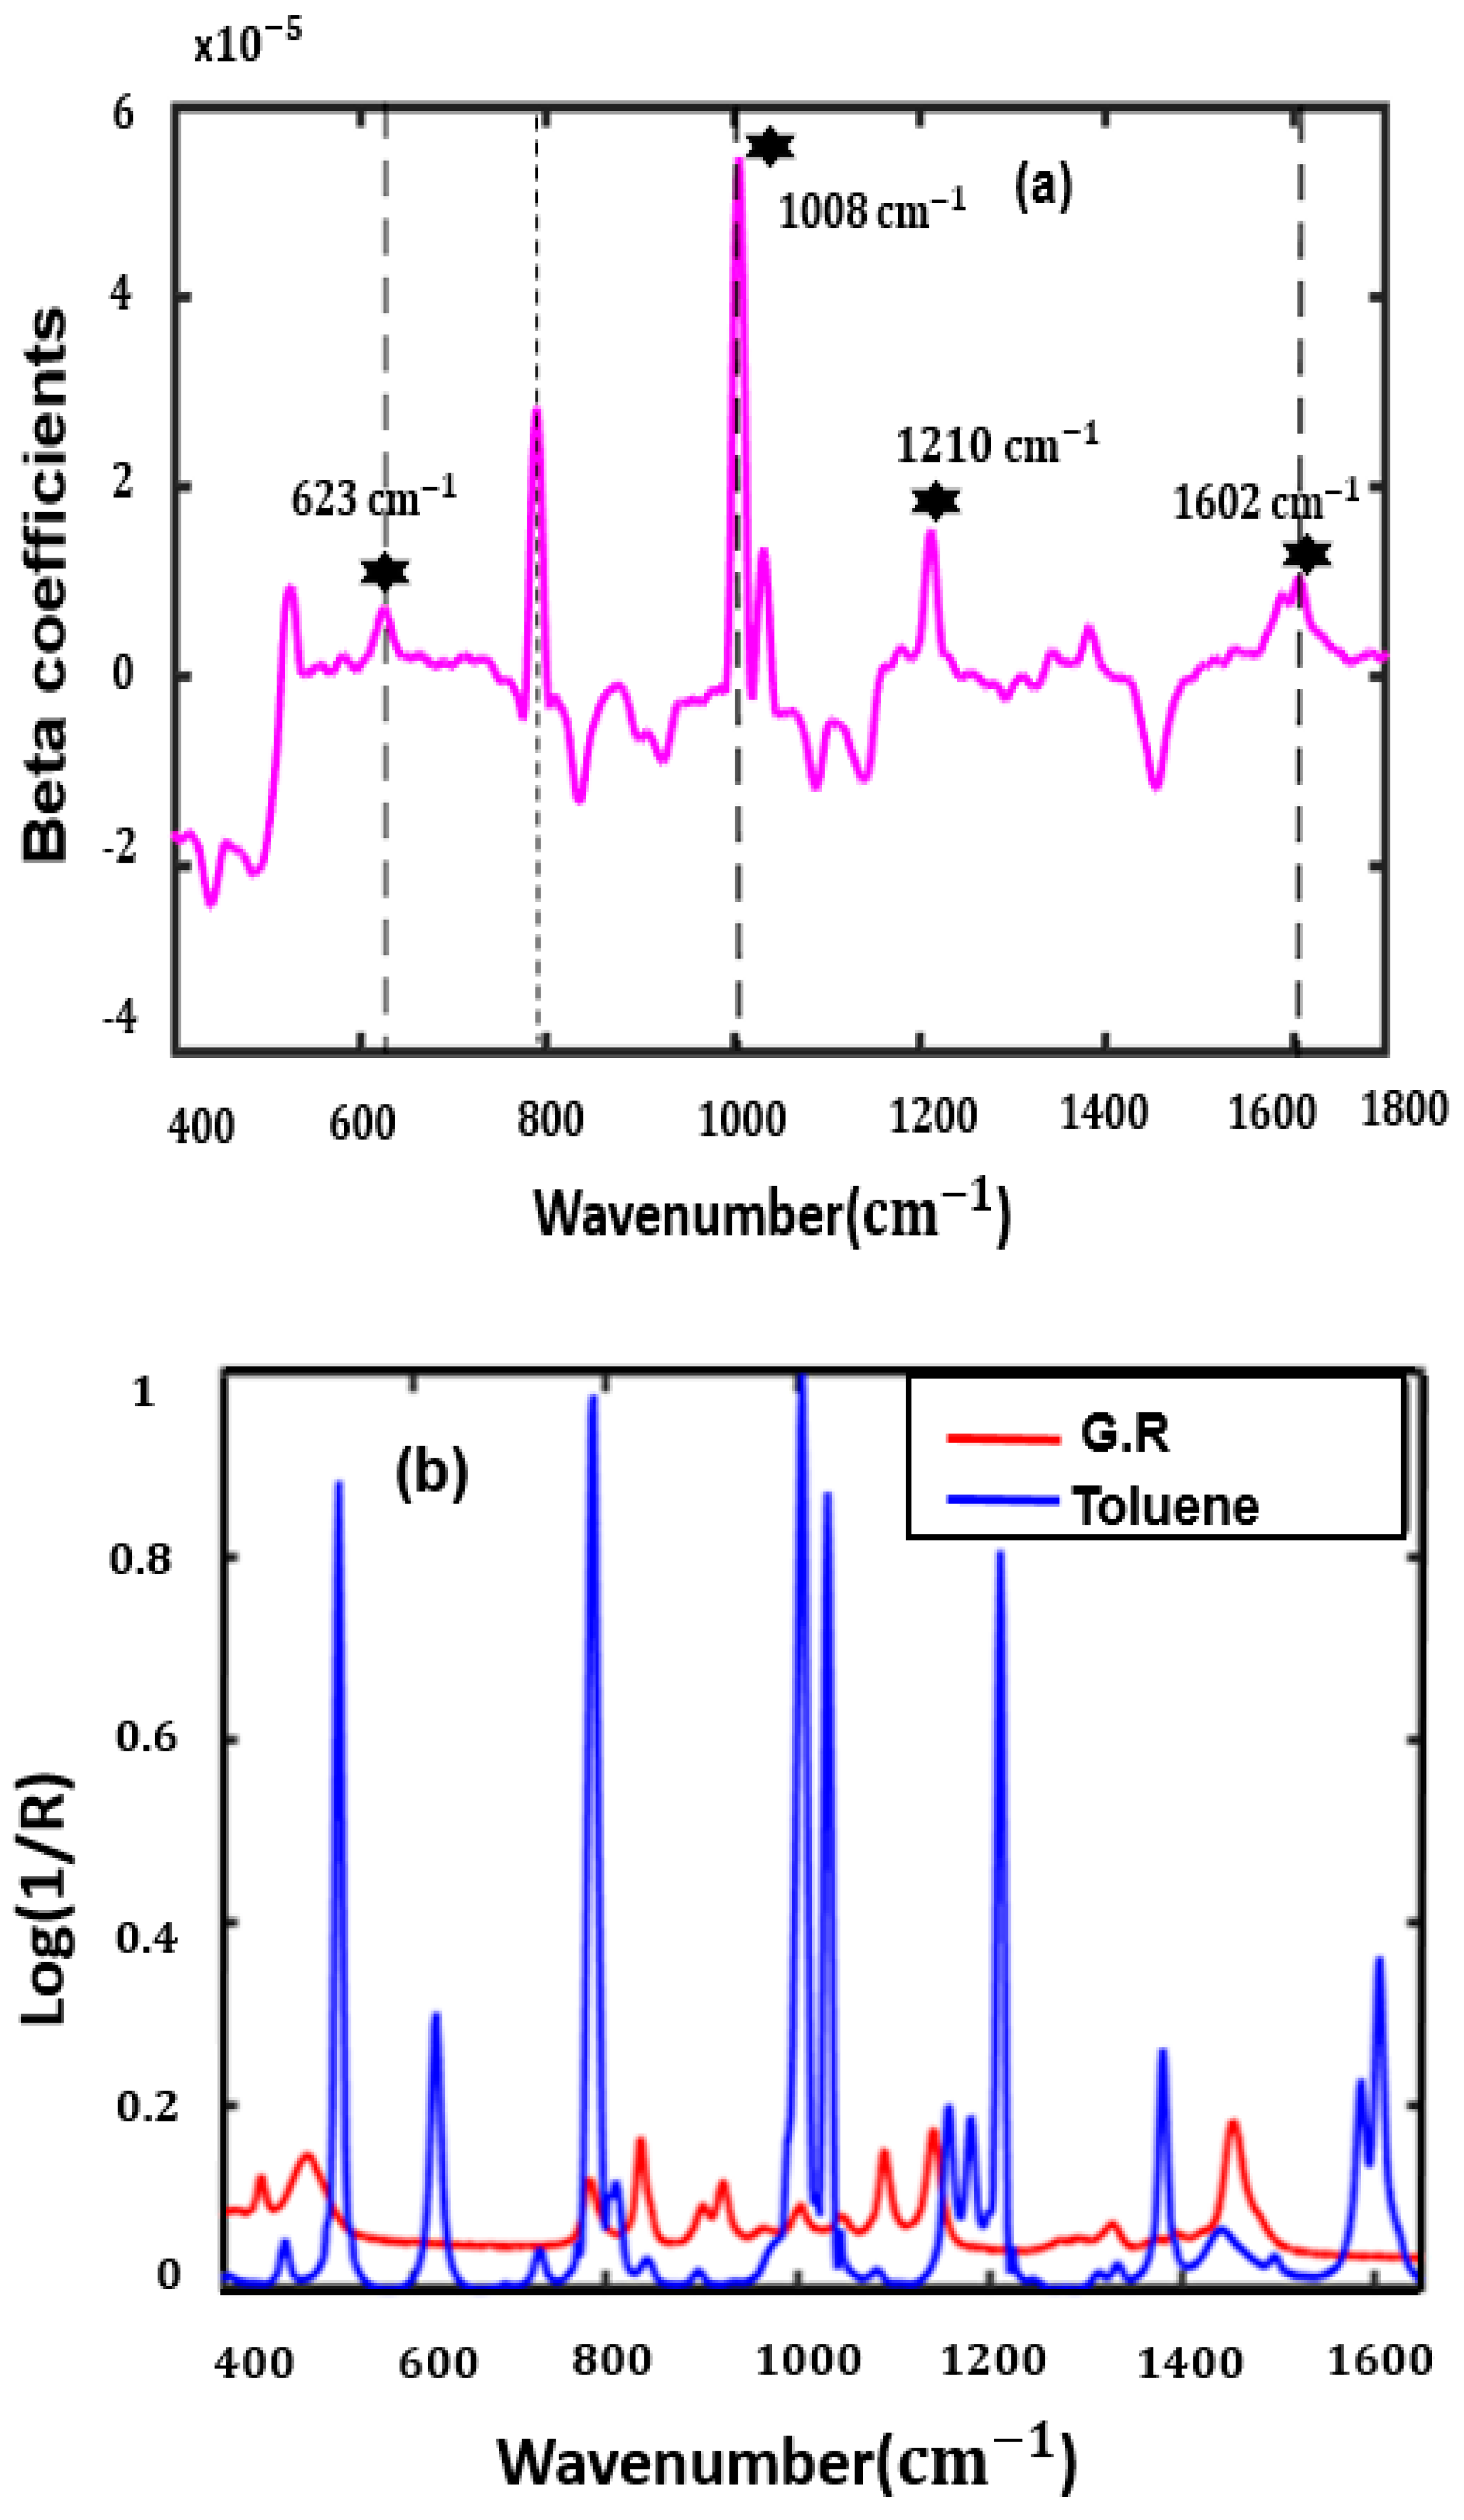
3.4. VIP-PLSR Analysis to Predict Toluene-Adulterated Grignard Reagent

For the selection of an optimum number of variables from the PLSR-based results, a model-based variable selection method, namely VIP, was employed. The VIP-based algorithm was developed using MATLAB for the analysis and then further applied to the PLSR based results. The main reason for using a variable selection approach was that models that are generated by employing the variable selection approach are easier to interpret; besides, they have good performance for classification or prediction. The best cut-off value determined using the VIP method was 1.5, which acquired the highest accuracy for both the calibration and the prediction when the number of variables was 95. A new PLSR model was then developed based on the VIP threshold value; subsequently, it was further compared with the originally developed MSC preprocessed PLSR model with the highest prediction accuracy using a full wavenumber range of 2046 variables. Table 2 shows the improvement in the prediction results using the selected variables with the threshold value of 1.5 compared with the predicted results obtained using whole variables. The VIP-based PLSR model obtained better prediction results ( R p 2 = 0.97 and SEP = 0.71%), with bias and ratio of standard error of performance to standard deviation (RPD) values of −2.21% and 7.15, than the PLS model developed using whole variables ( R p 2 = 0.95 and SEP = 0.79%), having bias and RPD values of −0.61% and 5.24. Previous studies showed that the model with RPD values obtained between 2.5 and 3.0 and above 3.0 is considered well-developed and has greater prediction power [24]. Thus, the calculated RPD of 7.15 for the VIP-PLSR model suggested that the established model produces a very accurate prediction of toluene concentration in the Grignard reagent. Furthermore, the obtained VIP score plot (Figure 5) shows a strong peak at 1008 cm−1, which indicates the presence of a mono-substituted benzene ring C6H5CH3; this confirmed the presence of toluene in this region. Some high-intensity peaks were obtained around 787 cm−1 and 1029 cm−1, which is related to the symmetric ring breathing vibration from benzene and in-plane CH bending vibrations [25]. The other peaks obtained in the VIP score plot are not considered useful, as they are below the threshold line.

4. Conclusions

A method combining Raman spectroscopy and PLSR multivariate analysis was developed for the determination of the quality of Grignard reagent by measuring the possible adulteration. To avoid overfitting problems and further improve the prediction accuracy of the model, a variable selection method, namely VIP, was combined with the developed PLSR model for the selection of the optimum wavenumbers. The variable selection method was used to reduce the size of the variables (wavenumbers) from 2046 to 95; that is, the number of variables was reduced to 4.64% of the total number. This process results in the reduction of computational time and cost of designing the system. In the results, the VIP-based PLSR model attained an excellent prediction accuracy ( R p 2 = 0.97) and a lower prediction error (0.71%) compared with the PLS model developed using whole spectral variables ( R p 2   = 0.95 and SEP = 0.79%). Hence, the obtained results confirmed the potential of Raman spectroscopy when combined with multivariate analysis methods (VIP-PLSR), for serving as a rapid, accurate, and effective analytical tool for determining the quality of chemical reagents. Furthermore, the results suggest that the proposed method can replace conventional methods such as high-performance liquid chromatography (HPLC) and nuclear magnetic resonance spectroscopy (NMR), which are tedious and time-consuming. This research will be further conducted in the future with other varieties of samples to investigate the potential of the developed model for detecting other possible adulterations in real-time samples.

Author Contributions

R.J. (Rahul Joshi), R.J. (Ritu Joshi) and M.A.F. performed the experiment; H.Z.A., R.E.M., and M.S.K. analyzed the data; R.J. (Rahul Joshi), C.M. and B.-K.C. wrote the paper. All authors have read and agreed to the published version of the manuscript.

Funding

This research was supported by Chungnam National University.

Conflicts of Interest

The authors declare no conflicts of interest.

References

  1. Cervera-Padrell, A.E.; Nielsen, J.P.; Jønch Pedersen, M.; Müller Christensen, K.; Mortensen, A.R.; Skovby, T.; Dam-Johansen, K.; Kiil, S.; Gernaey, K.V. Monitoring and control of a continuous Grignard reaction for the synthesis of an active pharmaceutical ingredient intermediate using inline NIR spectroscopy. Org. Process Res. Dev. 2012, 16, 901–914. [Google Scholar] [CrossRef] [Green Version]
  2. Richey, H. Grignard Reagents: New Developments; Wiley: Chichester, UK, 2000. [Google Scholar]
  3. Jordan, V.C. A current view of tamoxifen for the treatment and prevention of breast cancer. Br. J. Pharmacol. 1993, 110, 507–517. [Google Scholar] [CrossRef] [PubMed]
  4. Kantevari, S.; Nair, C.K.S.; Pardhasaradhi, M. A practical synthesis of 5-(4’-methylbiphenyl-2-yl)-1H-tetrazole. J. Heterocycl. Chem. 2006, 43, 1353–1356. [Google Scholar] [CrossRef]
  5. Hong, S.J.; Lee, A.Y.; Han, Y.H.; Park, J.; So, J.D.; Kim, G. Rancidity Prediction of Soybean Oil by Using Near-Infrared Spectroscopy Techniques. J. Biosys. Eng. 2018, 43, 219–228. [Google Scholar]
  6. Zhang, X.F.; Zou, M.Q.; Qi, X.H.; Liu, F.; Zhu, X.H.; Zhao, B.H. Detection of melamine in liquid milk using surface-enhanced Raman scattering spectroscopy. J. Raman Spectrosc. 2010, 41, 1655–1660. [Google Scholar] [CrossRef]
  7. Nedeljkovic, A.; Tomasevic, I.; Miocinovic, J.; Pudja, P. Feasibility of discrimination of dairy creams and cream-like analogues using Raman spectroscopy and chemometric analysis. Food Chem. 2017, 232, 487–492. [Google Scholar] [CrossRef] [PubMed]
  8. Joshi, R.; Lohumi, S.; Joshi, R.; Kim, M.S.; Qin, J.; Baek, I.; Cho, B.K. Raman Spectral Analysis for Non-invasive Detection of External and Internal Parameters of Fake Eggs. Sens. Actuators B Chem. 2020, 303, 127243. [Google Scholar] [CrossRef]
  9. Joshi, R.; Cho, B.K.; Joshi, R.; Lohumi, S.; Faqeerzada, M.A.; Amanah, H.Z.; Lee, J.; Mo, C.; Lee, H. Raman spectroscopic analysis to detect olive oil mixtures in argan oil. Korean J. Agric. Sci. 2019, 46, 183–194. [Google Scholar] [CrossRef]
  10. Paudel, A.; Raijada, D.; Rantanen, J. Raman spectroscopy in pharmaceutical product design. Adv. Drug Deliv. Rev. 2015, 89, 3–20. [Google Scholar] [CrossRef] [Green Version]
  11. Yonzon, C.R.; Donovan, B.A. Raman spectroscopic method for content Uniformity of a dry powder inhaler. Am. Pharm. Rev. 2008, 11, 70–76. [Google Scholar]
  12. Schulze, G.; Jirasek, A.; Yu, M.M.L.; Lim, A.; Turner, R.F.B.; Blades, M.W. Investigation of selected baseline removal techniques as candidates for automated implementation. Appl. Spectrosc. 2005, 59, 545–574. [Google Scholar] [CrossRef] [PubMed]
  13. Mo, C.; Kang, S.; Lee, K.; Kim, G.; Cho, B.-K.; Lim, J.G.; Lee, H.S.; Park, J. Germination prediction of cucumber (cucumis sativus) seed using raman spectroscopy. J. Biosys. Eng. 2012, 37, 404–410. [Google Scholar] [CrossRef]
  14. Lee, H.; Cho, B.K.; Kim, M.S.; Lee, W.H.; Tewari, J.; Bae, H.; Sohn, S.I.; Chi, H.Y. Prediction of crude protein and oil content of soybeans using Raman spectroscopy. Sens. Actuators. B Chem. 2013, 185, 694–700. [Google Scholar] [CrossRef] [Green Version]
  15. Handbook of Near-Infrared Analysis—Google Books. Available online: https://books.google.co.kr/books?hl=en&lr=&id=6EEd1a0uka0C&oi=fnd&pg=PP1&dq=D.A.+Burns,+E.W.+Ciurczak,+Handbook+of+Near-Infrared+Analysis,+3rd+ed.%3B+Taylor+%26+Francis+Group:+New+York,+2007.&ots=L3b8O0HPrv&sig=BMt4VSyfi0eVfRJ6pawZtcP6CvA#v=onepage&q&f=false (accessed on 6 November 2019).
  16. Joshi, R.; Cho, B.K.; Lohumi, S.; Joshi, R.; Lee, J.; Lee, H.; Mo, C. Evaluation of benzene residue in edible oils using Fourier transform infrared (FTIR) spectroscopy. Korean J. Agric. Sci. 2019, 46, 257–271. [Google Scholar]
  17. Gowena, A.A.; Downey, G.; Esquerre, C.; O’Donnell, C.P. Preventing over-fitting in PLS calibration models of near-infrared (NIR) spectroscopy data using regression coefficients. J. Chemom. 2011, 25, 375–381. [Google Scholar] [CrossRef]
  18. Lohumi, S.; Lee, S.; Cho, B.K. Optimal variable selection for Fourier transform infrared spectroscopic analysis of starch-adulterated garlic powder. Sens. Actuators B Chem. 2015, 216, 622–628. [Google Scholar] [CrossRef]
  19. Cho, J.H.; Lee, D.; Jin, H.P.; Kim, K.; Lee, I.B. Optimal approach for classification of acute leukemia subtypes based on gene expression data. Biotechnol. Prog. 2002, 18, 847–854. [Google Scholar] [CrossRef] [PubMed]
  20. Chen, Y. Statistical Approaches for Detection of Relevant Genes and Pathway in Analysis of Gene Expression Data. Ph.D. Thesis, University of California, Davis, CA, USA, 2008. [Google Scholar]
  21. Pérez-Enciso, M.; Tenenhaus, M. Prediction of clinical outcome with microarray data: A partial least squares discriminant analysis (PLS-DA) approach. Hum. Genet. 2003, 112, 581–592. [Google Scholar]
  22. Kwok, C.S. Separations with Raman Spectroscopy for Identification of Oxidatively Modified Components in Parkinson’s Disease. Ph.D. Thesis, McGill University, Montreal, QC, Canada, 2008. [Google Scholar]
  23. Okparanma, R.N.; Mouazen, A.M. Visible and near-infrared spectroscopy analysis of a polycyclic aromatic hydrocarbon in soils. Sci. World J. 2013, 2013, 1–9. [Google Scholar] [CrossRef] [PubMed]
  24. William, P.; Norris, K. Near-Infrared Technology in the Agricultural and Food Industrie, 2nd ed.; American Association of Cereal Chemists: St. Paul, MN, USA, 2001; pp. 145–169. [Google Scholar]
  25. LIU, C.; BERG, R.W. Nonlinearity in Intensity versus Concentration Dependence for the Deep UV Resonance Raman Spectra of Toluene and Heptane. Appl. Spectrosc. Rev. 2013, 48, 425–437. [Google Scholar] [CrossRef]
Figure 1. Raman mean spectra corrected with the polynomial curve fitting method within a spectral region of 400–1650 cm−1 (a) and (a1); and (a2) presents expended spectral regions of (a).
Applsci 10 03545 g001
Figure 2. Scatter plots with the first three principal component (PC) score (a) and with 1st and 2nd PC score (b), and PC loading plot (c).
Applsci 10 03545 g002
Figure 3. Partial least squares regression (PLSR) graphs of actual versus predicted concentrations (a) calibration plot (b) prediction plot.
Applsci 10 03545 g003
Figure 4. Multiplicative scatter correction (MSC) preprocessed beta coefficients plot of PLSR model (a), and mean plot for the pure Grignard reagent and pure toluene (b).
Applsci 10 03545 g004
Figure 5. Plot of variable importance in projection (VIP) scores and selected wavenumbers.
Applsci 10 03545 g005
Table 1. Grignard reagent spiked with different toluene composition for Raman spectral measurement.
Toluene (%)Toluene (mL)Grignard Reagent (mL)
00.030.0
10.329.7
20.629.4
30.929.1
41.228.8
51.528.5
103.027.0
154.525.5
206.024.0
Total amount used = 18 mLTotal amount used = 252 mL
Table 2. Prediction results for the pure and toluene-adulterated Grignard reagent obtained from the partial least squares regression (PLSR) and VIP variable selection method.
Methods R C 2 SEC (%) R C V 2 SECV (%) R P 2 SEP (%)LVsBias (%)RPD
Whole spectra0.940.650.940.680.950.794−0.615.24
VIP-PLSR0.980.600.960.660.970.714−2.217.15
Rc2, Rv2, and Rp2 are the R2 values for calibration, validation, and prediction, respectively. SEC, SECV, and SEP are the standard errors of calibration, cross-validation, and prediction, respectively.

