Article

Effect of High-Speed Train-Induced Wind on Trackside UAV Thrust Near Railway Bridge

1
Korea Railroad Research Institute, Uiwang-si, Gyeonggi-do 16105, Korea
2
UCONSYSTEM Corporation, Daejeon 34015, Korea
3
Korea Railroad Corporation, Daejeon 34618, Korea
*
Author to whom correspondence should be addressed.
Appl. Sci. 2020, 10(10), 3495; https://doi.org/10.3390/app10103495
Submission received: 29 April 2020 / Revised: 15 May 2020 / Accepted: 15 May 2020 / Published: 18 May 2020

Abstract

:
Imaging devices attached to unmanned aerial vehicles (UAVs) are used for crack measurements of railway bridges constructed for high-speed trains. This research aims to investigate track-side wind induced by high-speed trains and its effect on UAV thrust near the railway bridge. Furthermore, the characteristics of train-induced wind in three axial directions along a track, wind velocity, and the effect of train-induced wind on the UAV thrust were analyzed. This was achieved by installing 3-axis ultrasonic anemometers and a UAV thrust measurement system on top of a PSC box girder bridge. The changes in the train-induced wind velocity were monitored along the train travel, width, and height directions. The train-induced wind was measured at distances of 0.8, 1.3, 2.3, and 2.8 m away from the train’s body to analyze wind velocity based on distance. It was found that the maximum wind velocity decreased linearly as the distance from the train’s body increased. The UAV thrust increased by up to 20% and 60%, owing to train-induced wind when the leading and trailing power cars of a high-speed train passed, respectively. Thus, it is necessary to conduct further research to develop robust control and a variable pitch-propeller that can control thrust.

1. Introduction

Railway bridges need to be constructed to support heavy trains such as passenger and freight trains. Furthermore, they are designed to support railway tracks along which the trains run and wherein steel rails are installed with a constant distance between them. Railway bridges need to secure a high level of safety while controlling the vibration of tracks and roadbeds essential to train operation owing to the introduction of high-speed trains that can travel at 200 km/h or higher and ultra-high-speed trains that can travel at 350 km/h or higher [1]. In this context, prestressed concrete (PSC) box girder bridges are commonly constructed for high-speed trains owing to their excellent safety against dynamic structural behavior [2,3]. A concrete girder, highly resistant to bending stress, is constructed by placing steel wires in concrete and fixing them after firmly pulling them owing to the compressive stress that acts on the concrete. However, regular crack inspections are necessary as cracking occurs over time in some cases because of the drying shrinkage of concrete [4]. Cracking in bridge decks is inspected through visual inspection. However, crack inspection in the lower parts of bridges and piers is difficult as it requires workers to use vehicle-mounted ladders for visual inspection owing to the difficulty in accessing these parts. Further, this type of inspection requires considerable cost and time, and it depends on the subjective judgment of the inspector [5].
Recently, studies have been conducted to measure cracks by acquiring images by means of various imaging devices attached to unmanned aerial vehicles (UAV) and by analyzing the acquired images. The interference of environmental factors such as uneven natural illumination, non-uniform shooting distance, and non-flat structural surfaces of bridge piers, and conditions where GPS coverage is unavailable has been identified through several studies [6,7,8,9,10]. The UAV used for the health monitoring of railway bridges is operated close to railway bridges. Therefore, the interference of train-induced wind should be considered in order to ensure safety. However, the effect of train-induced wind on UAVs near railway bridges has not been studied.
In this study, the characteristics of train-induced wind in three axial directions along the track, train-induced wind velocity based on the distance from the train surface, and the effect of train-induced wind caused by a high-speed train on the UAV thrust were analyzed. This was achieved by installing 3-axis ultrasonic anemometers and a UAV thrust measurement system on top of a PSC box girder bridge. Two types of high-speed trains with different lengths were used for the experiments. The changes in the train-induced wind velocity and direction caused by the leading power car, passenger cars, and the trailing power car were monitored along the train’s travel, width, and height direction. Additionally, the train-induced wind was measured at distances of 0.8, 1.3, 2.3, and 2.8 m from the train’s surface to analyze wind velocity based on the distance. The effect of the wind caused by the passing of a high-speed train on the UAV thrust at the trackside was experimentally characterized, and this result can be used for research on the stabilization of the thrust of UAVs used for railway bridge health monitoring.

2. Experimental Setup

The Wolsan bridge, which is located 8.6 km away from Singyeongju Station on the Gyeongbu high-speed railway, was used as the site of the experiment. The Wolsan bridge is constructed as a PSC box girder bridge and crosses a reservoir with four piers installed at 40 m intervals. The total length of the bridge is 200 m. Above the bridge, a continuous reinforced concrete track, that integrates both sleepers and concrete beds, is installed in both ascending and descending directions. On the tracks, contact wires that supply power to trains are placed in the longitudinal direction.
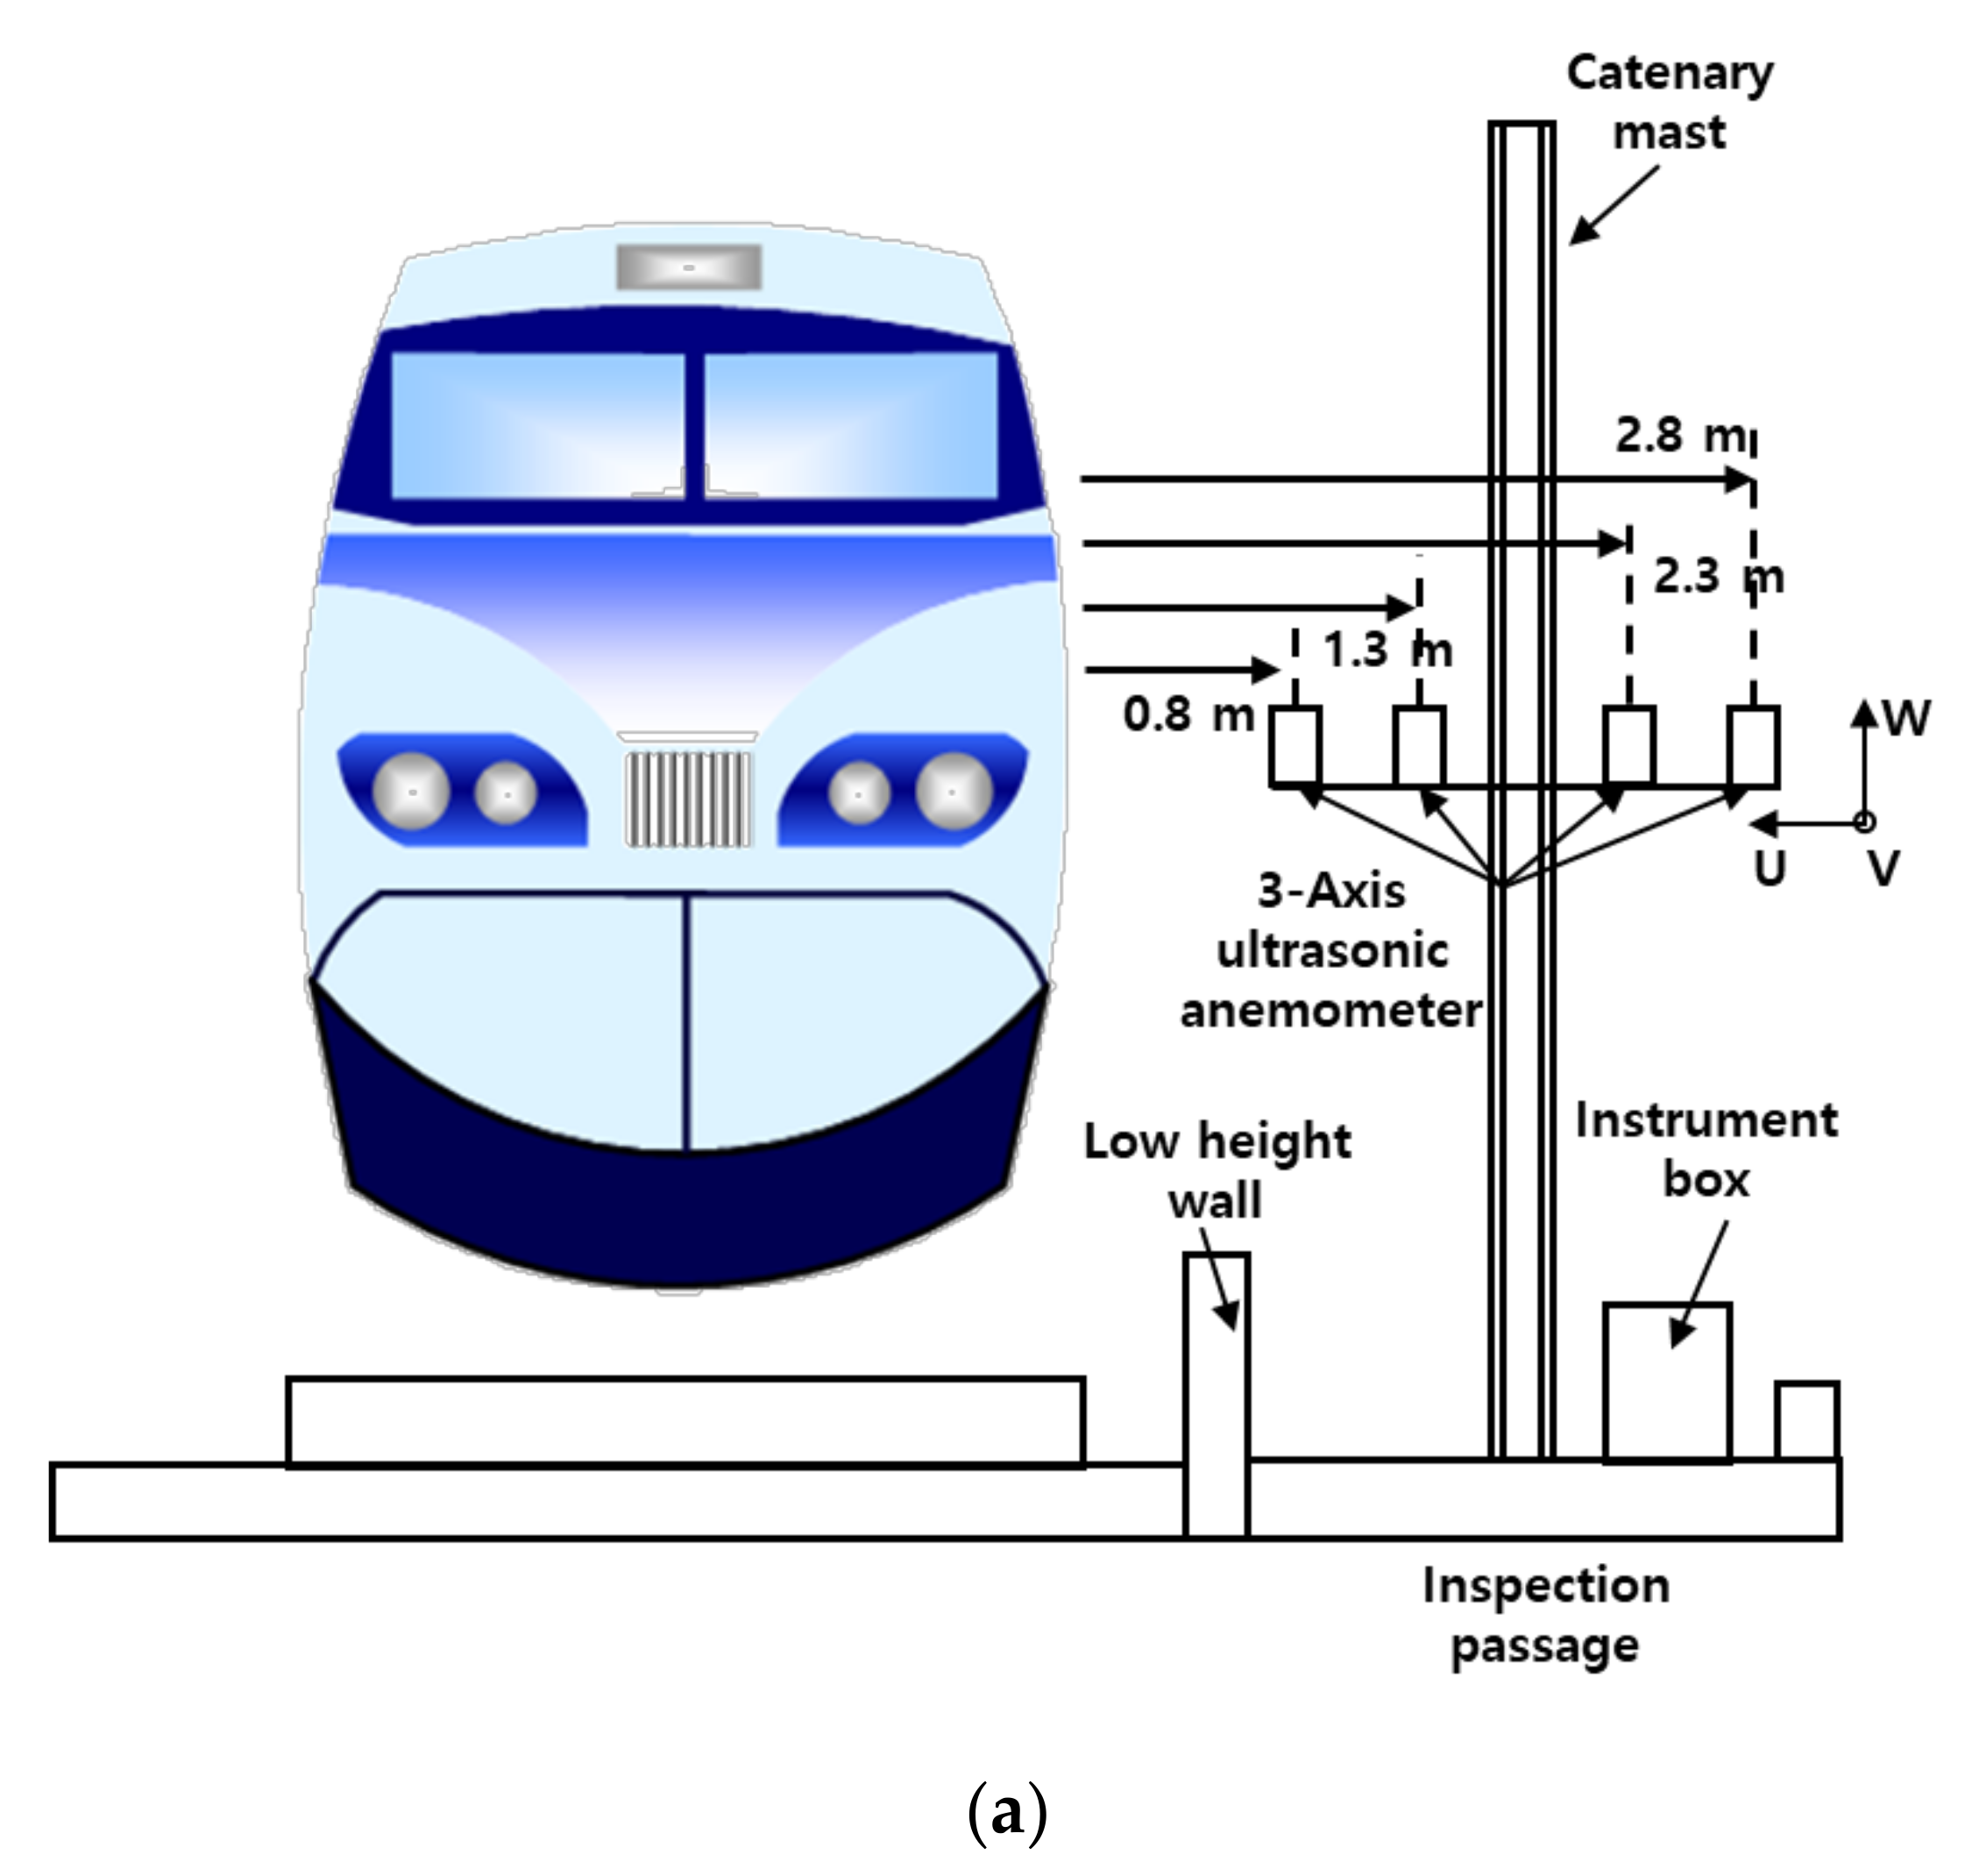
An experimental setup was installed on the top of the bridge, as shown in Figure 1. Power was supplied to four 3-axis ultrasonic anemometers (R. M. Young Co., Traverse City, MI, USA) through a DC power supply and power distribution system. Furthermore, train-induced wind data, measured by the anemometers, was transmitted to a PC via an RS-232 hub. The UAV motor (T-Motor Co., Nanchang, China) and propeller were controlled through the control board, which was connected to a personal computer to acquire thrust data. The main specifications of the train-induced wind and UAV thrust measurement systems used in the experiment are listed in Table 1.
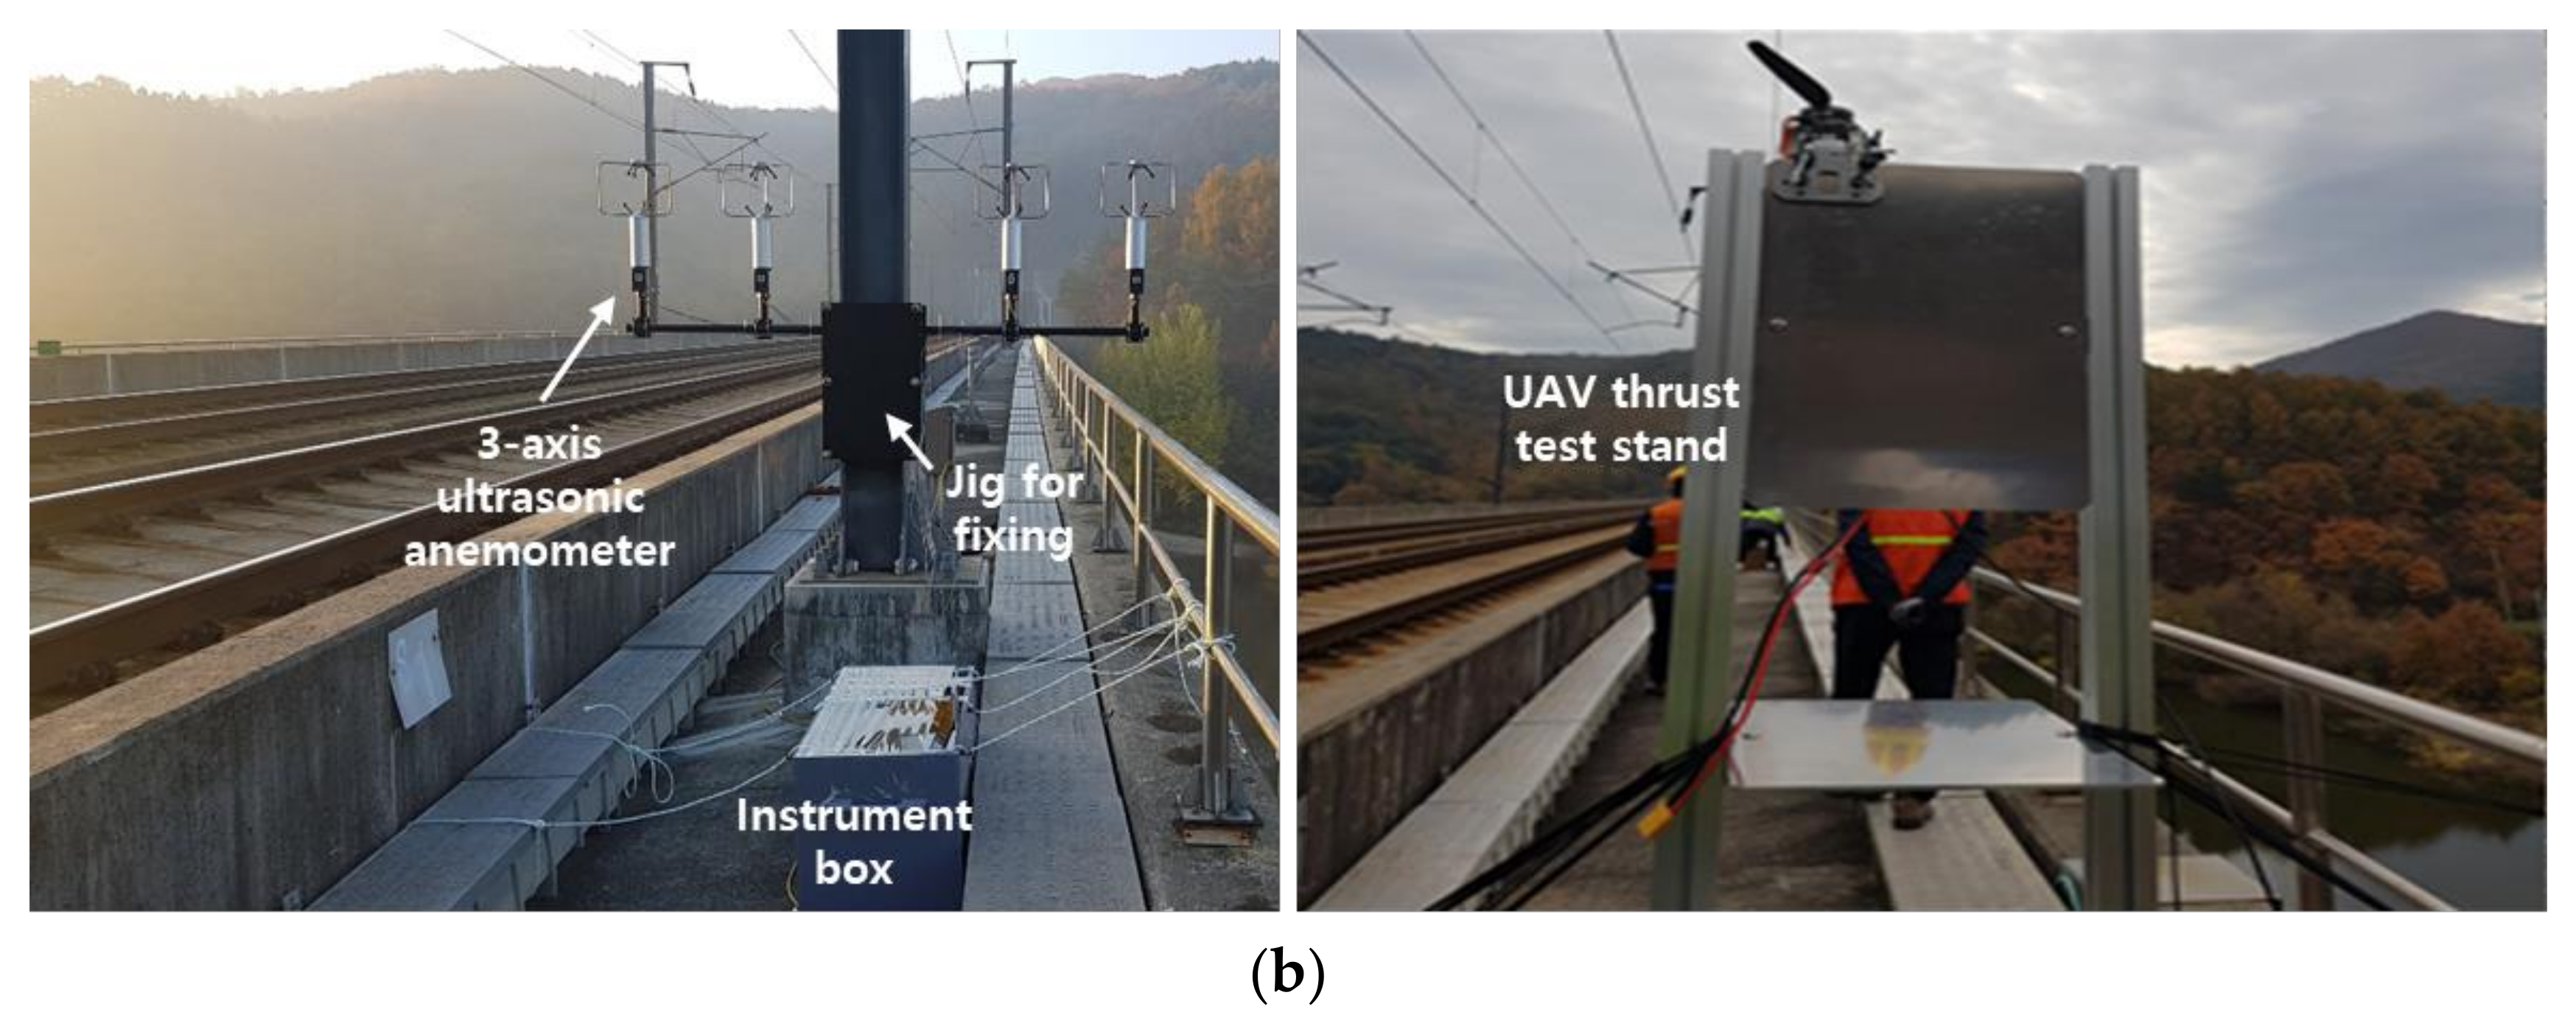
As shown in Figure 2, a jig was mounted on the catenary mast, and four 3-axis ultrasonic anemometers were installed on the jig. The anemometers were installed at distances of 0.8, 1.3, 2.3, and 2.8 m from the train surface. Additionally, the anemometers were installed at the height of 2 m to measure train-induced wind velocity at the middle height of the train. For the measurement directions, the train travel direction was defined as the V axis, the train width direction as the U axis, and the height direction as the W axis.
The UAV thrust test stand was installed at a point 1.8 m away from the train surface, and the thrust measurement system was installed above it. To prevent the effect of train-induced wind on the measurement system during the experiment, the system was placed in an instrument box and installed on the inspection passage between the low height wall to prevent access to the train and the bridge railing.

3. Analysis of the Effect of High-Speed Train-induced Wind on UAV Thrust along a Track

3.1. Characteristics of Train-induced Wind by a High-Speed Train along the Track

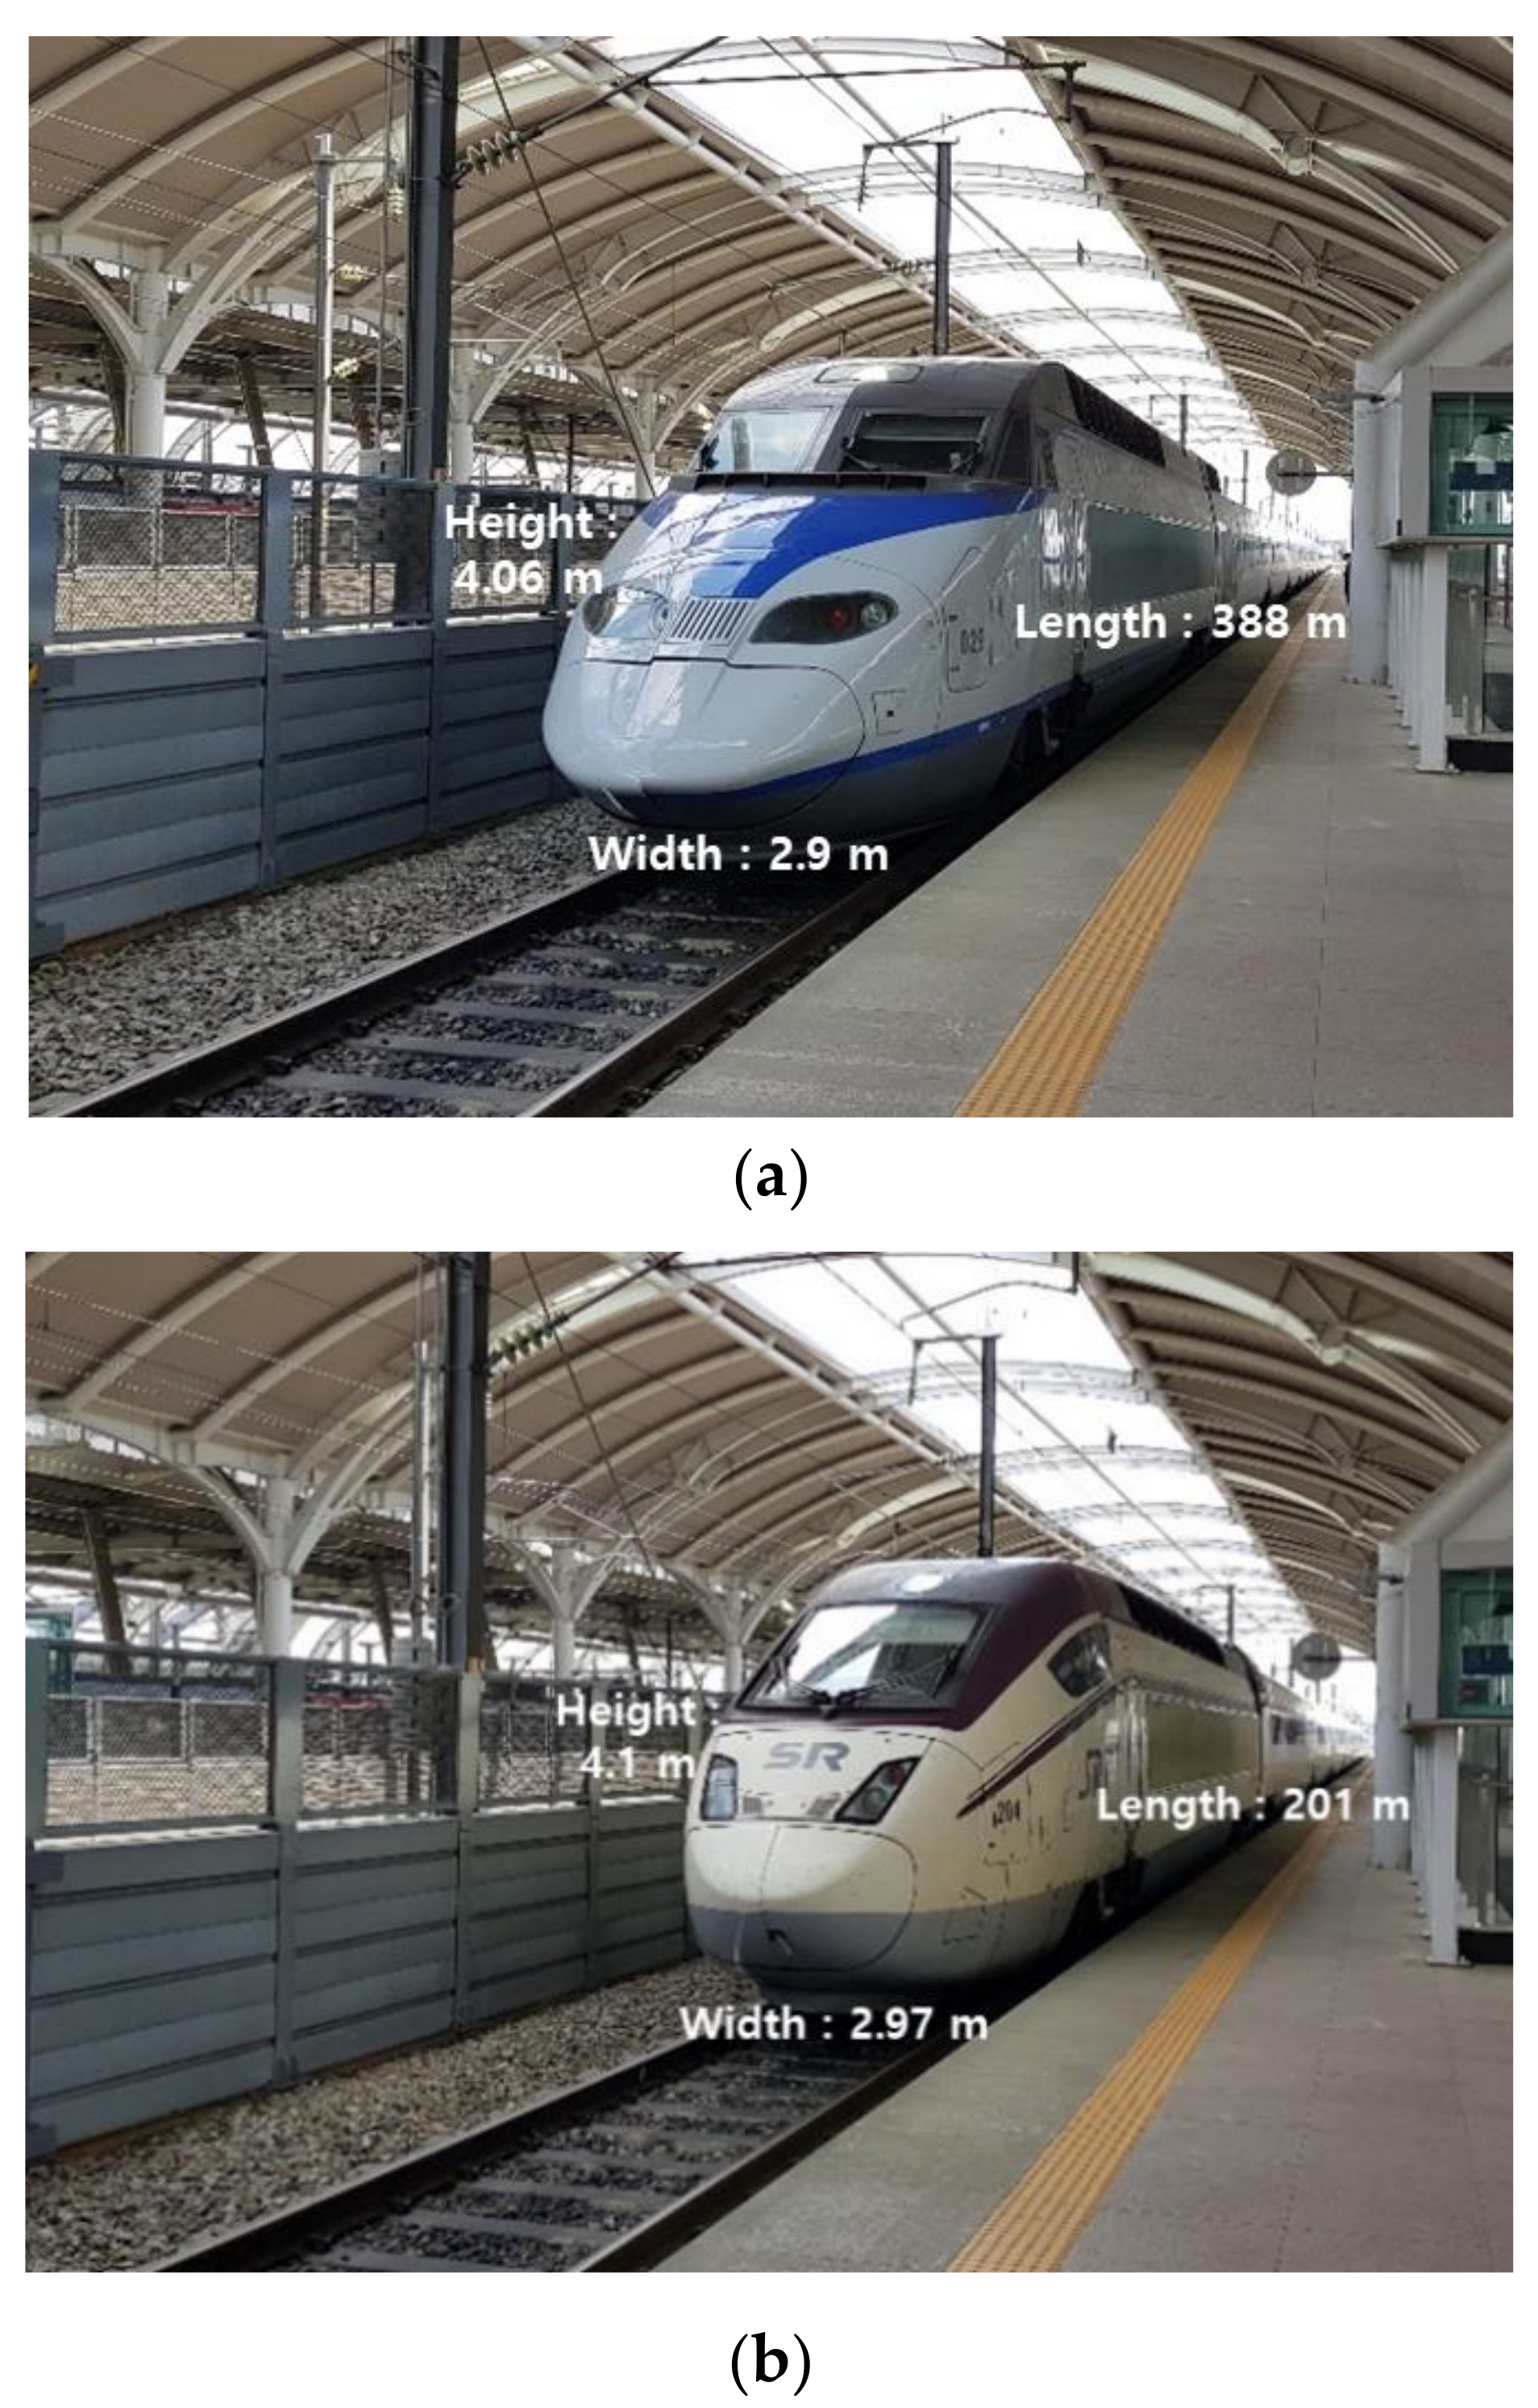
The wind induced by two types of high-speed trains (Figure 3), when passing through the Wolsan bridge, was measured along the track.
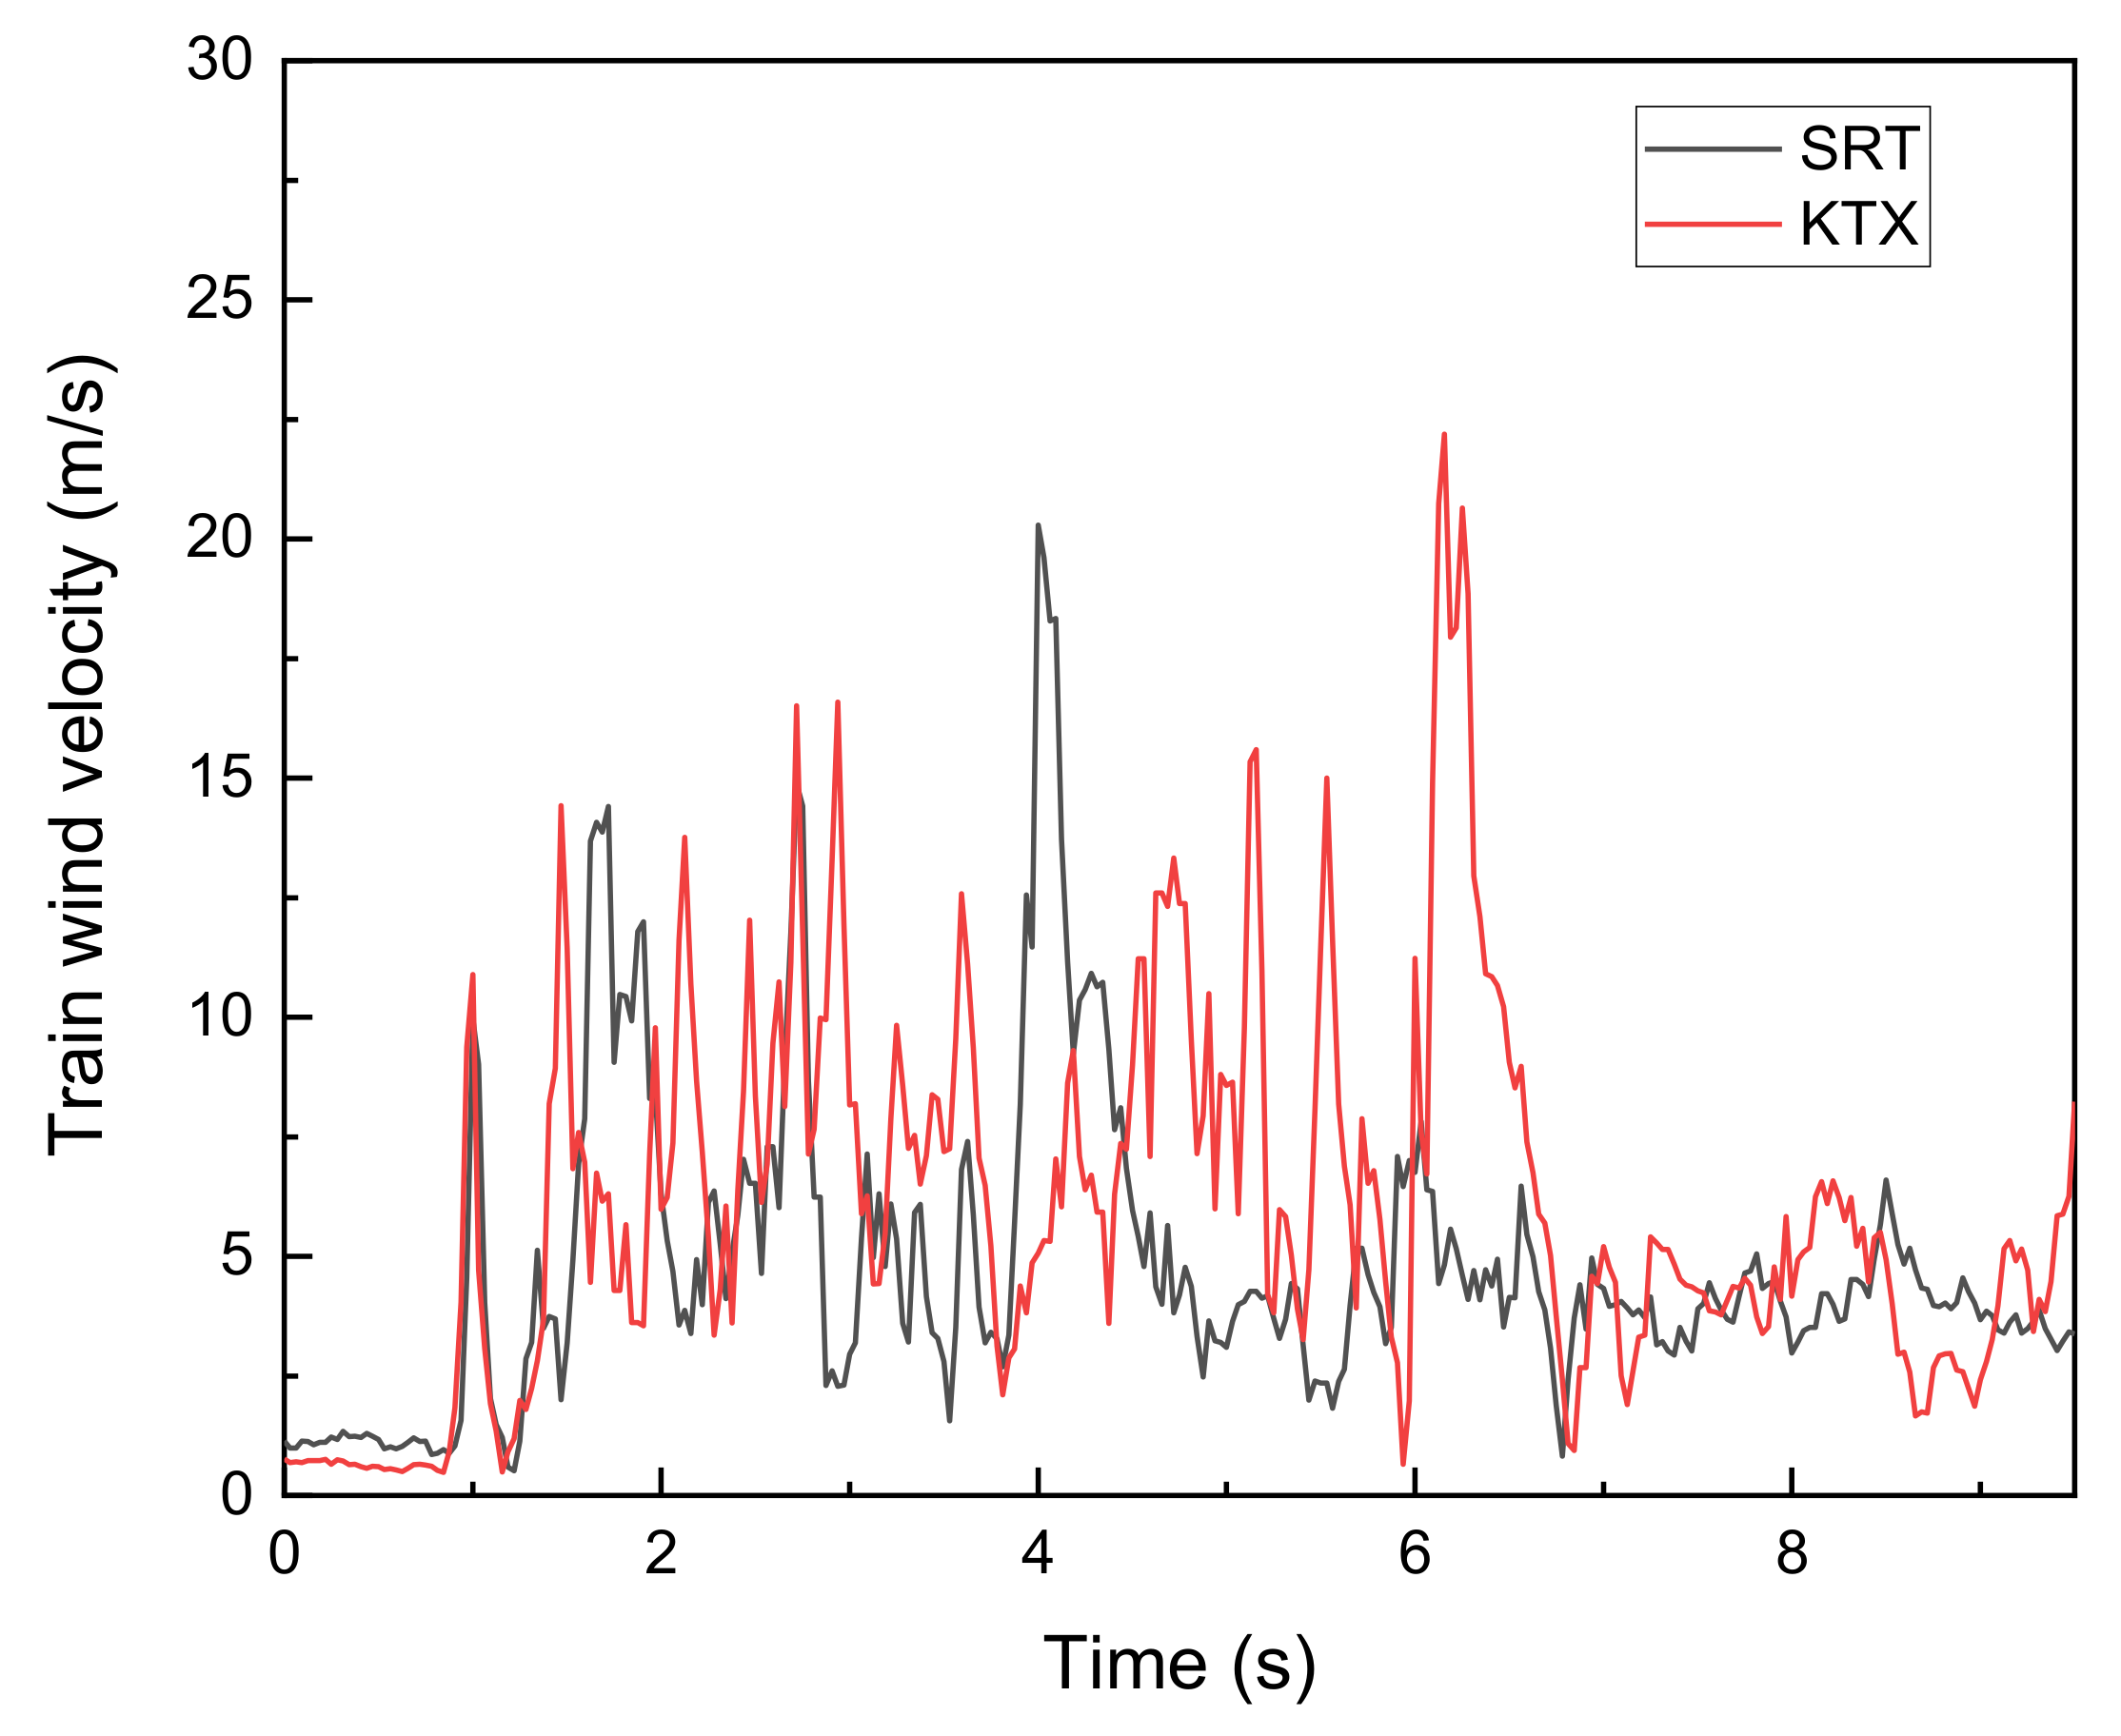
The KTX (Alstom, Saint-Ouen, France; Hyundai Rotem Co., Uiwang-si, Korea) is the first high-speed rail vehicle in South Korea. A total of 20 cars, including two power cars and 18 passenger cars, are operated as one formation with a length of 388 m. The maximum design speed is 320 km/h, and the maximum operating speed is 300 km/h. The KTX is a representative high-speed rail vehicle, and KORAIL operates a total of 46 formations. The SRT (Hyundai Rotem Co., Uiwang-si, Korea) is a high-speed rail vehicle model, independently developed in South Korea. A total of 10 cars, including two power cars and 8 passenger cars, are operated as one formation, and its length is 201 m. The maximum design speed is 330 km/h, and the maximum operating speed is 300 km/h. SR Co.(Seoul, Korea) operates a total of 32 formations. Although the rail vehicle specifications of the KTX and SRT are similar, the number of passenger cars of the KTX is higher than that of the SRT; hence, the overall length is about 1.93 times longer. Figure 4 shows the train-induced wind velocity results measured at 0.8 m from the train surface during the passages of the KTX and SRT. When passing over the Wolsan bridge, the velocity of the trains was approximately 293 km/h.
When the leading power cars of the SRT and KTX trains passed, the wind velocity sharply increased to 9.97 and 10.89 m/s, respectively, in approximately 0.2 s, and then rapidly decreased. The wind velocities of the two trains exhibited an approximately 9% difference. This is attributed to the influence of the nose shape [11,12]. The wind velocity slowly increased when the passenger cars passed, owing to the growth of the boundary-layer flow on the train’s surface, and the maximum wind velocity was observed when the trailing power cars passed. During the passage of the trains, the wind velocity severely fluctuated over time, exhibiting turbulent characteristics [13,14,15]. After the passage of the tailing end of the trains, the wind velocity gradually decreased. The maximum wind velocities of the SRT and KTX trains during the passage of the trailing power cars were 20.29 and 22.19 m/s, respectively. The KTX required a longer passage time than the SRT because it comprised more passenger cars and a larger total length. Furthermore, the boundary-layer flow increased further for the KTX owing to its longer passage time, and this appears to have resulted in the maximum wind velocity of the KTX being approximately 9.3% higher than that of the SRT. Figure 5 shows the train-induced wind velocity in Figure 4 expressed in the U, V, and W directions.
The wind velocity in the V direction exhibited a similar tendency to that of the wind velocity in Figure 4 and was the most dominant wind velocity. There were sharp fluctuations in wind direction when the leading and trailing power cars of the trains passed. The train-induced wind was not stable and exhibited turbulent characteristics for a considerable time, even after the passage of the trains [16]. In the case of the wind velocity in the U direction, there were sharp fluctuations in wind direction during the passage of the leading and trailing power cars of the trains in the same manner as in the V-axis wind velocity. However, the velocity was not high compared to the V-axis wind velocity. The wind direction toward the outside of the track was dominant. For the wind velocity in the W direction, there were sharp fluctuations when the leading power cars passed. The wind velocity showed a tendency to remain within 10 m/s, even during the passage of the trains. Figure 6 shows the maximum train-induced wind velocity according to the distance from the train surface during the passage of the KTX trains.
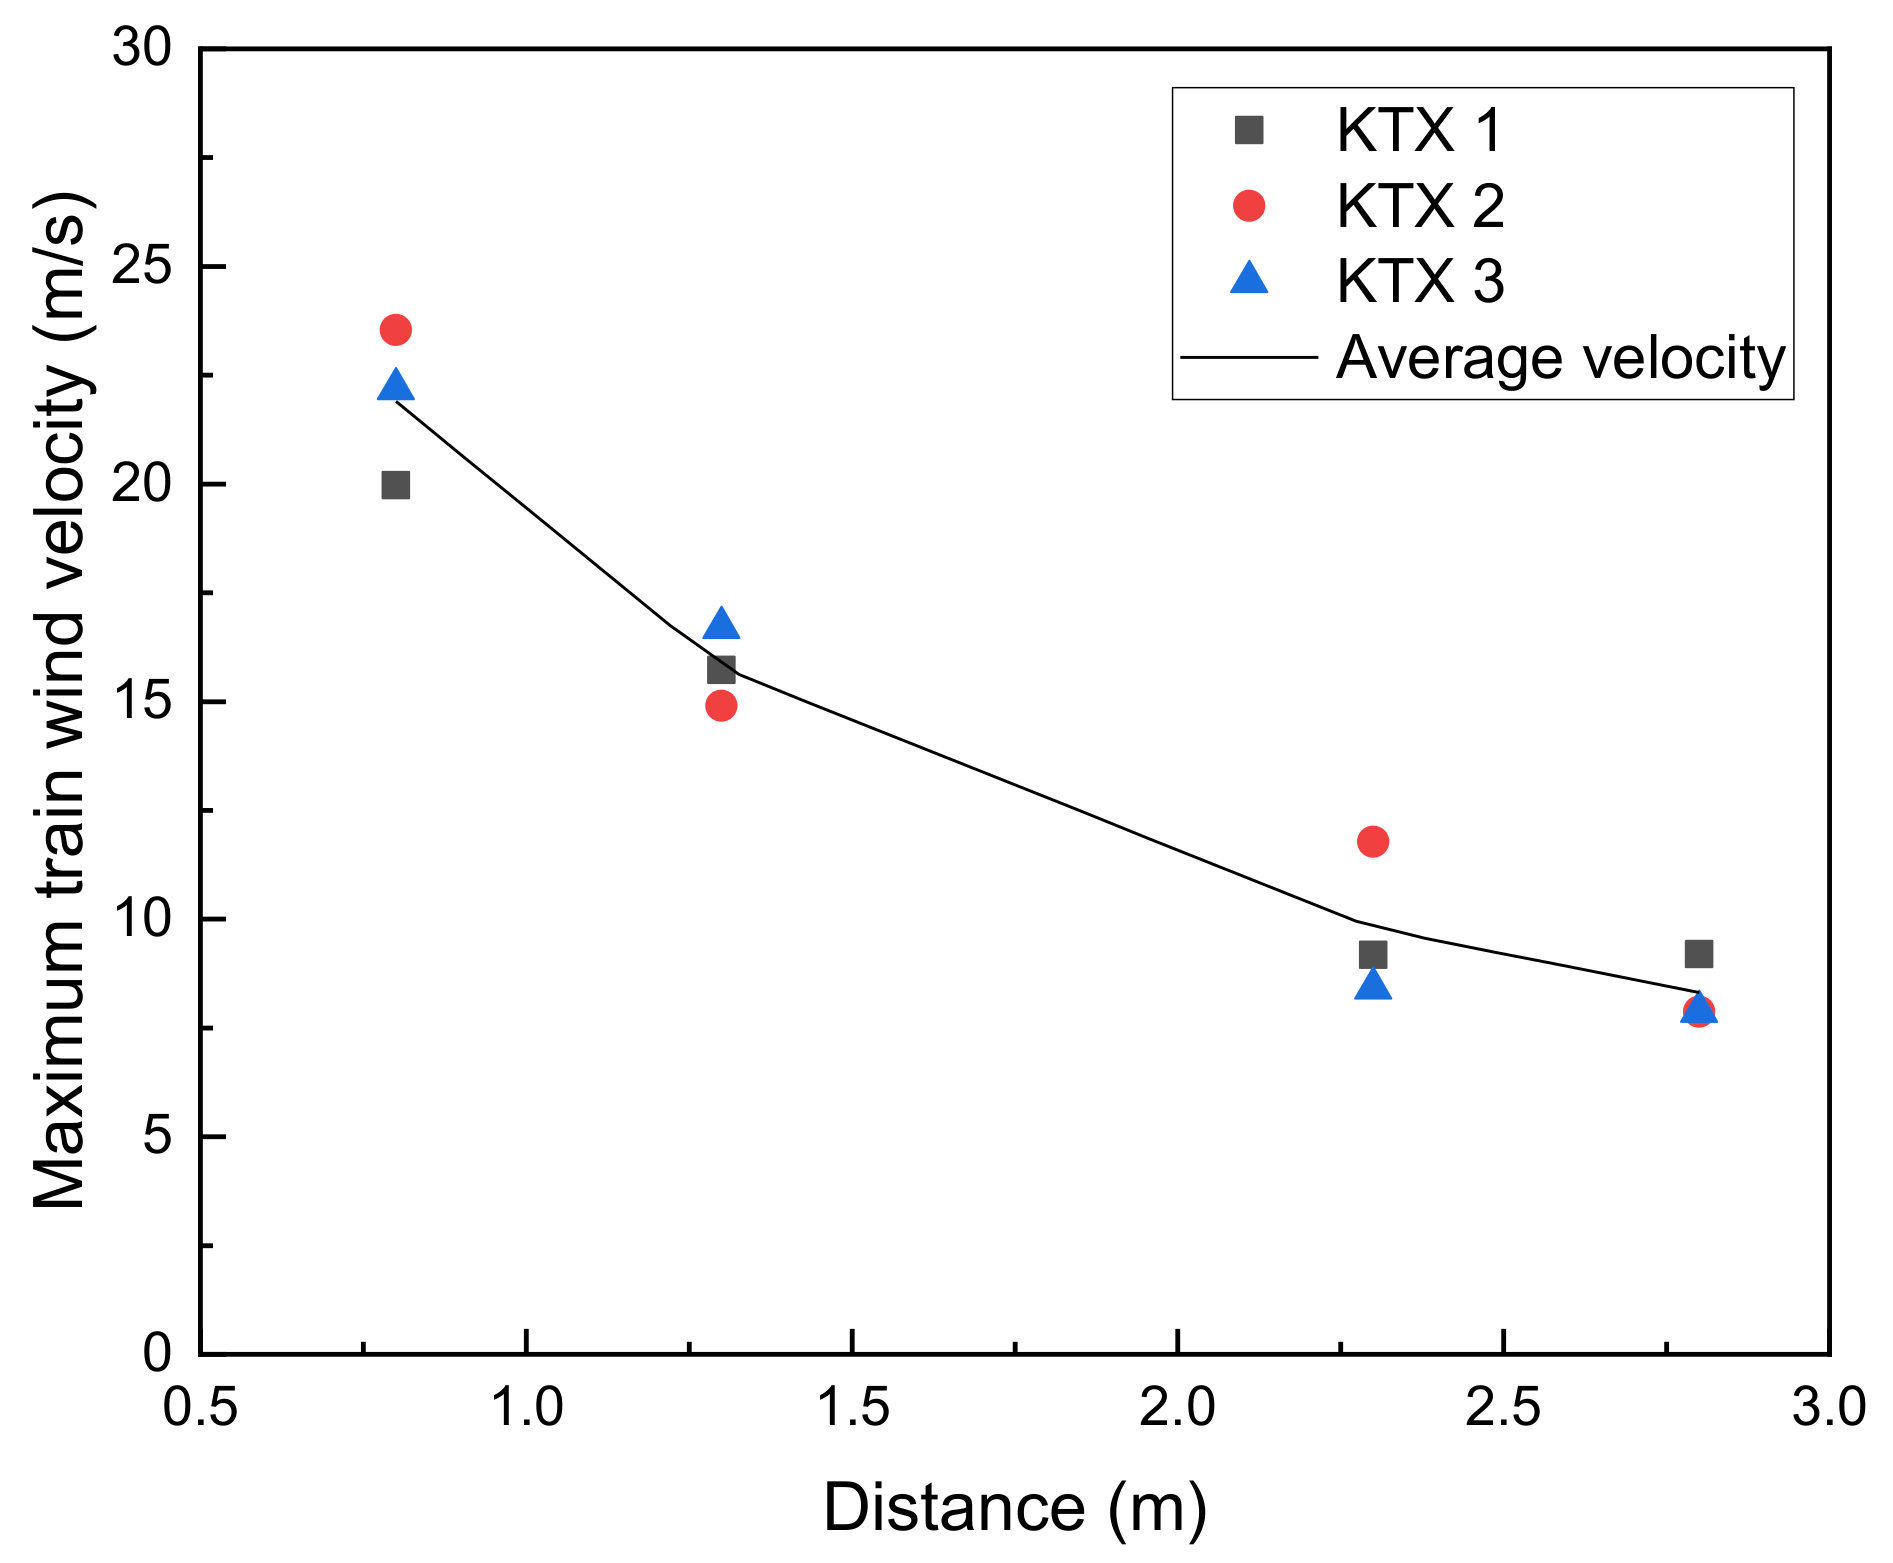
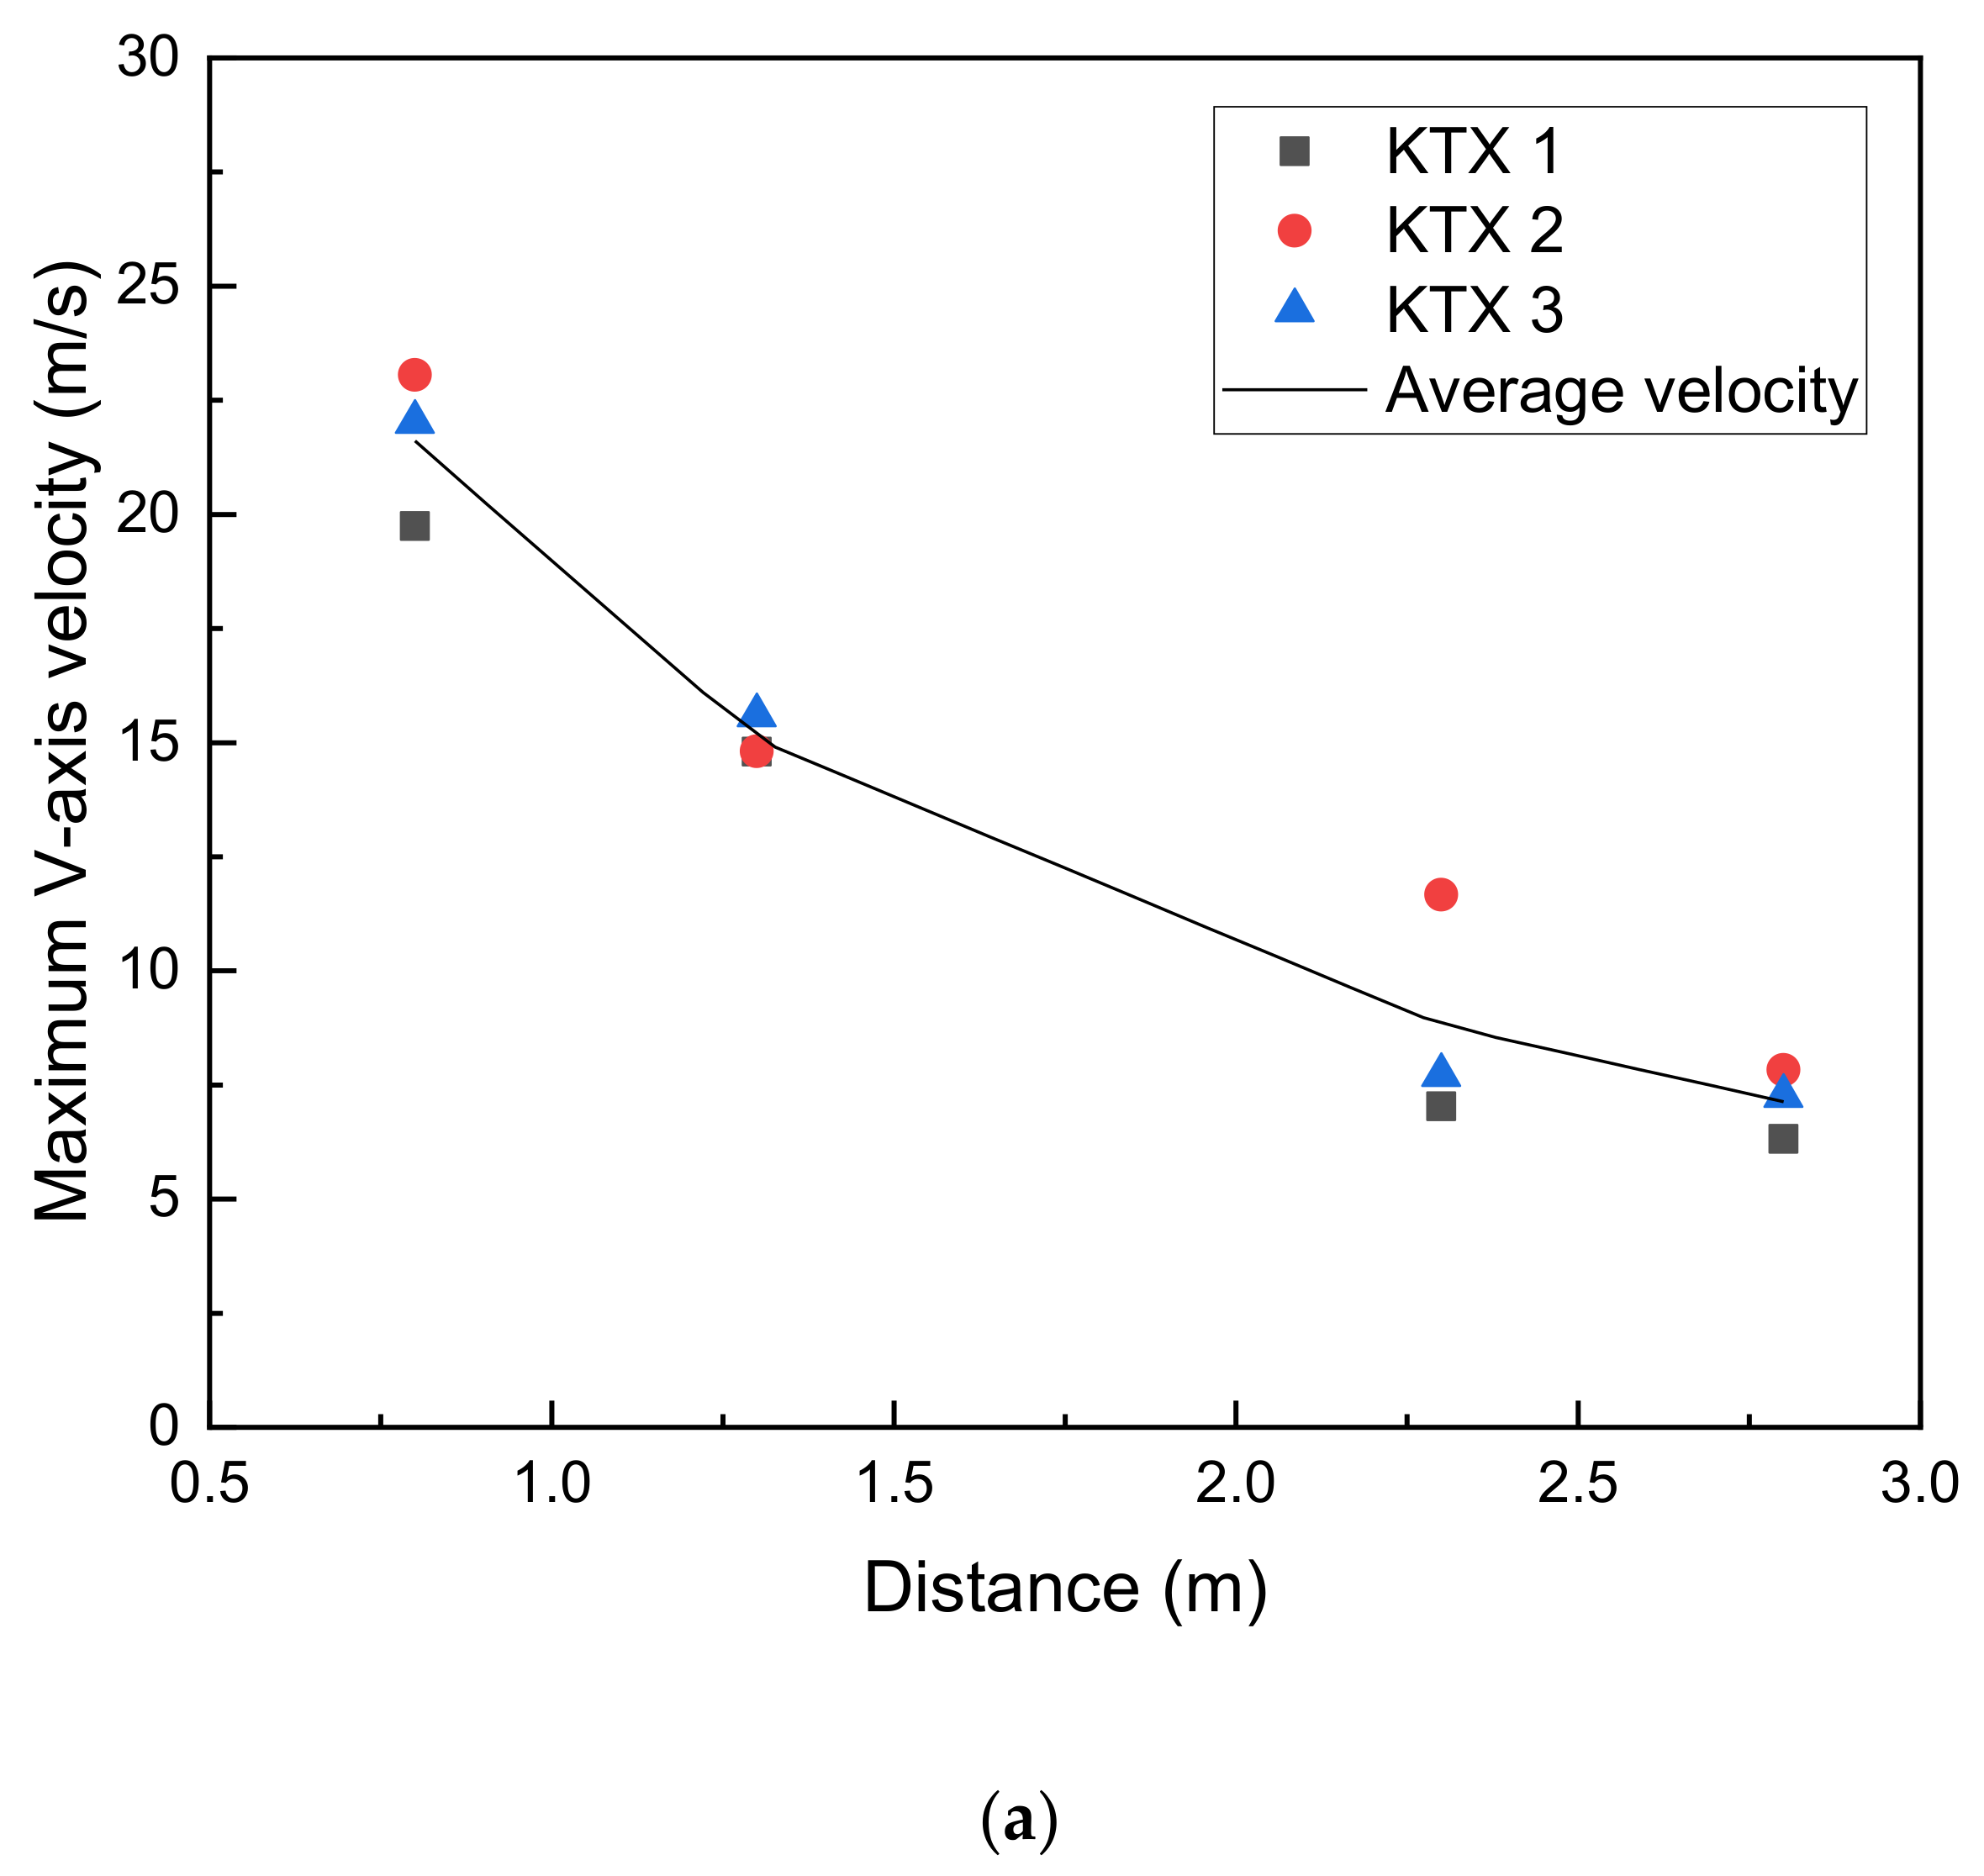
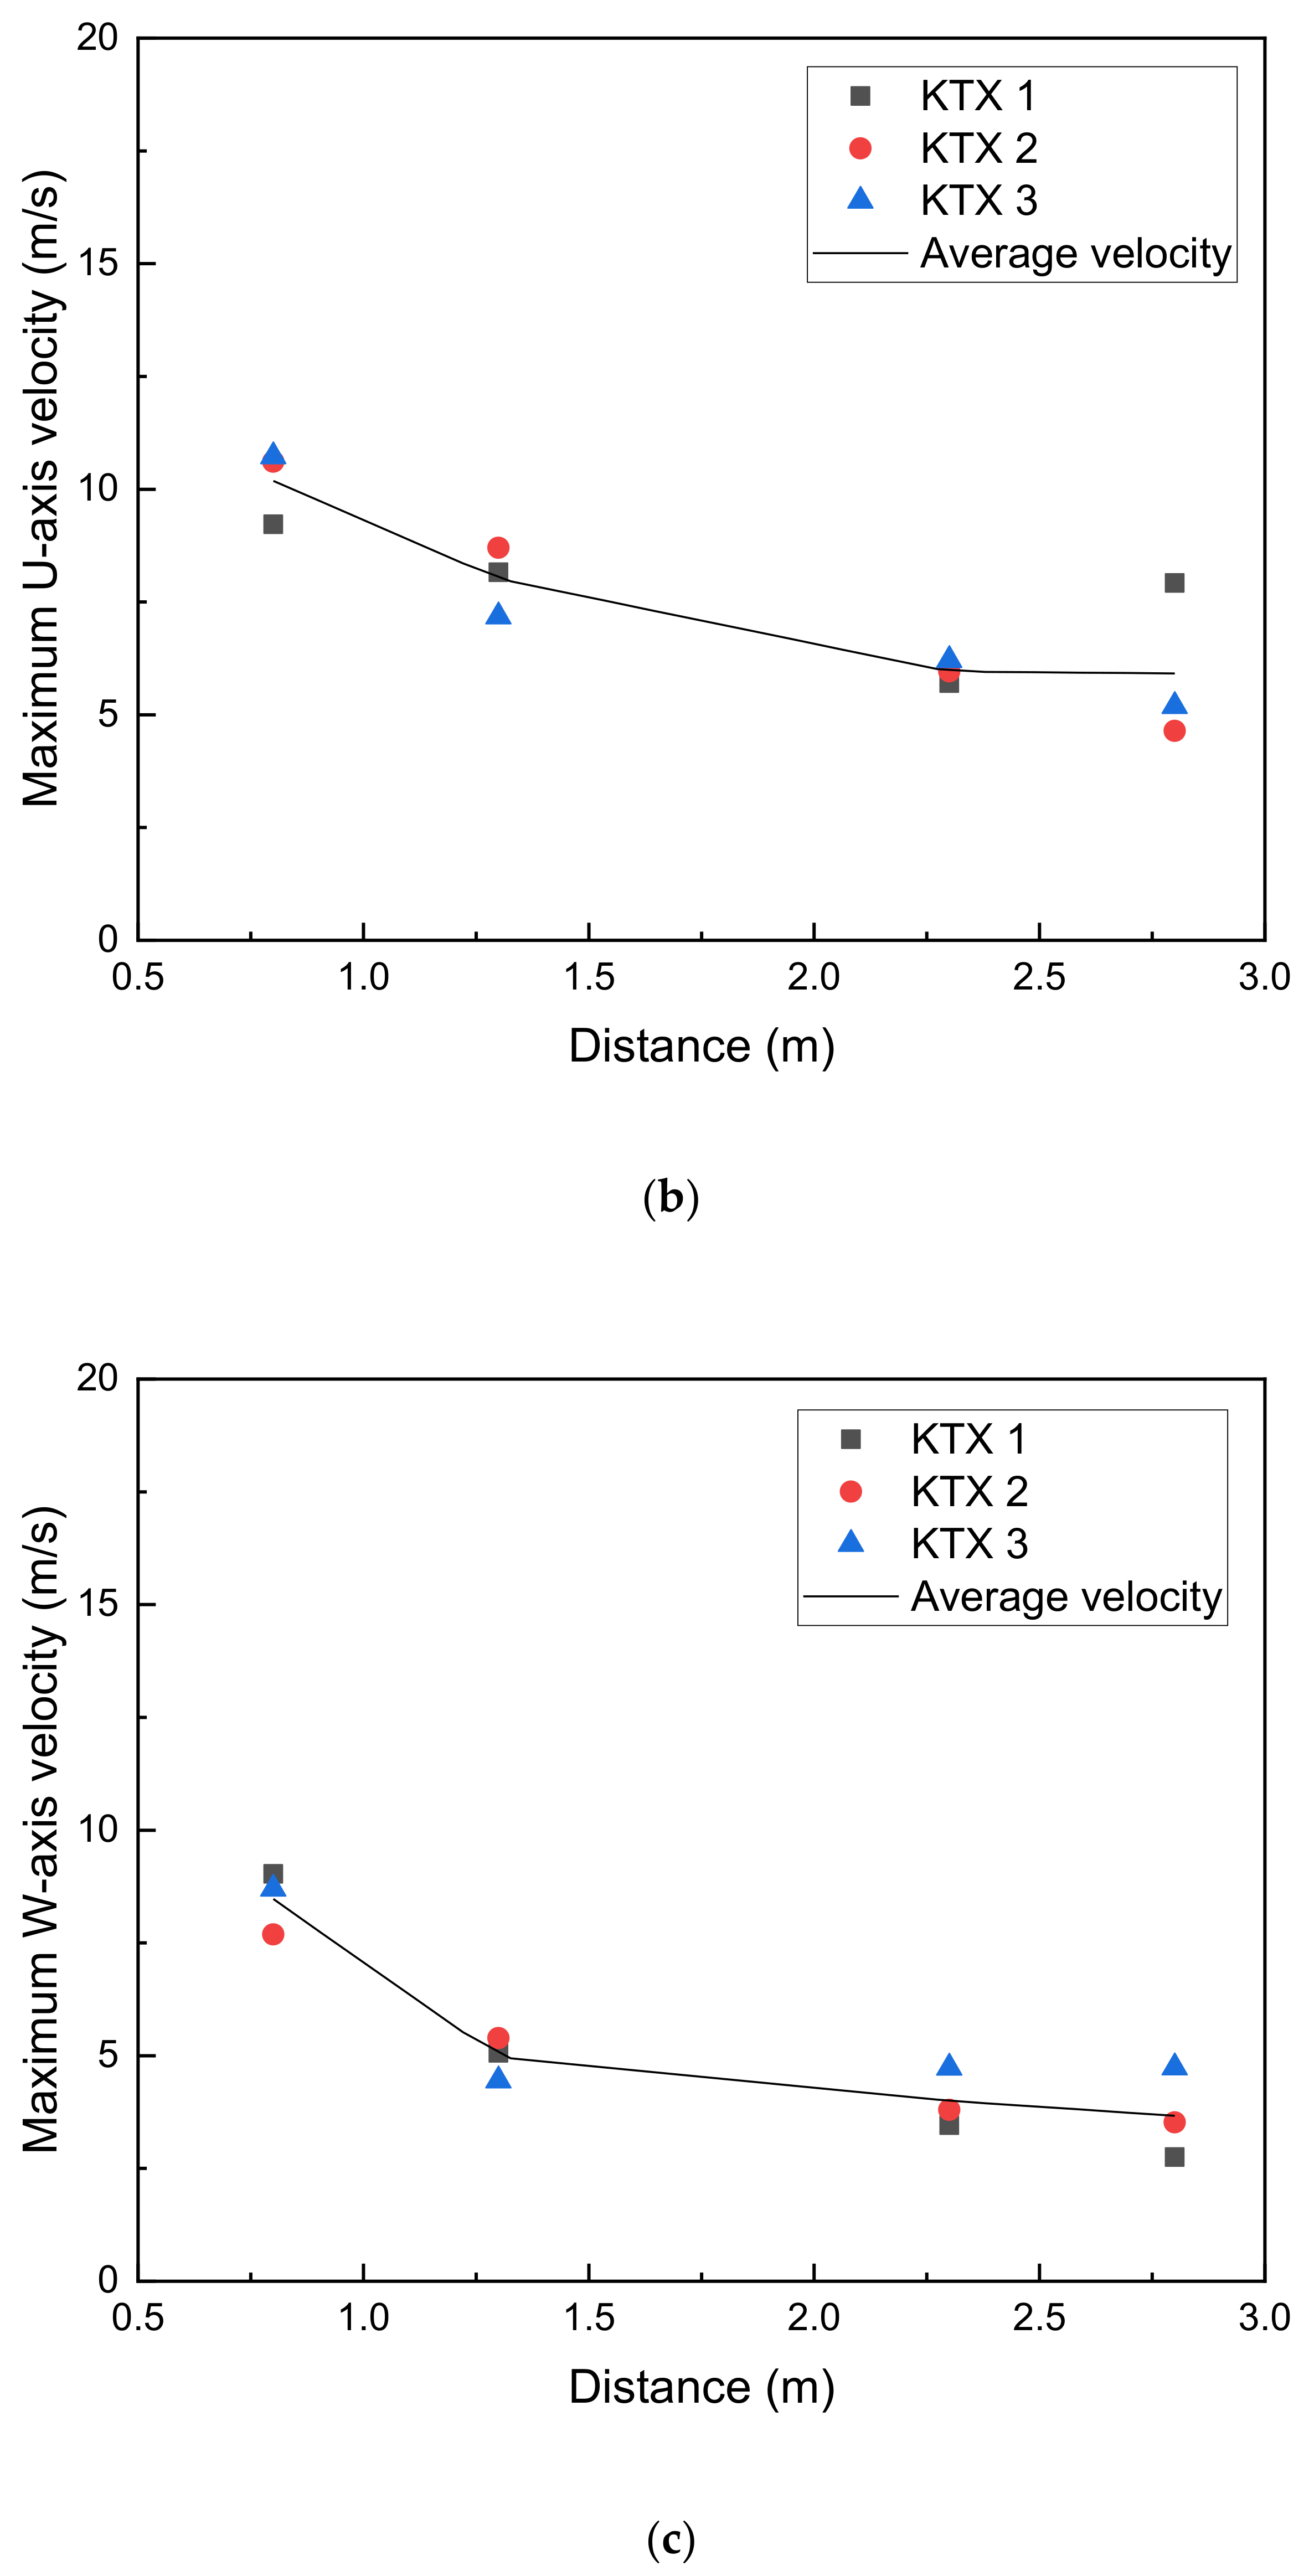
For three KTX train formations, train-induced wind was measured when they passed the target section, and maximum values were expressed. Additionally, the maximum wind velocities of the three formations, acquired at each measurement point, were averaged, and the average velocities were expressed. As the distance from the train surface increased, the maximum wind velocity decreased. The maximum wind velocity measured at 2.8 m from the train surface was approximately 62% lower than that measured at 0.8 m. The maximum and average wind velocities of the three KTX train formations in the U, V, and W directions according to the measurement distance are expressed, as shown in Figure 7.
For all directions, the wind velocities showed a tendency to decrease as the distance from the train surface increases. However, the maximum wind velocity decrements in the U and W directions were not large compared to that in the V direction.

3.2. Analysis of the UAV Thrust Change Caused by Train-Induced Wind

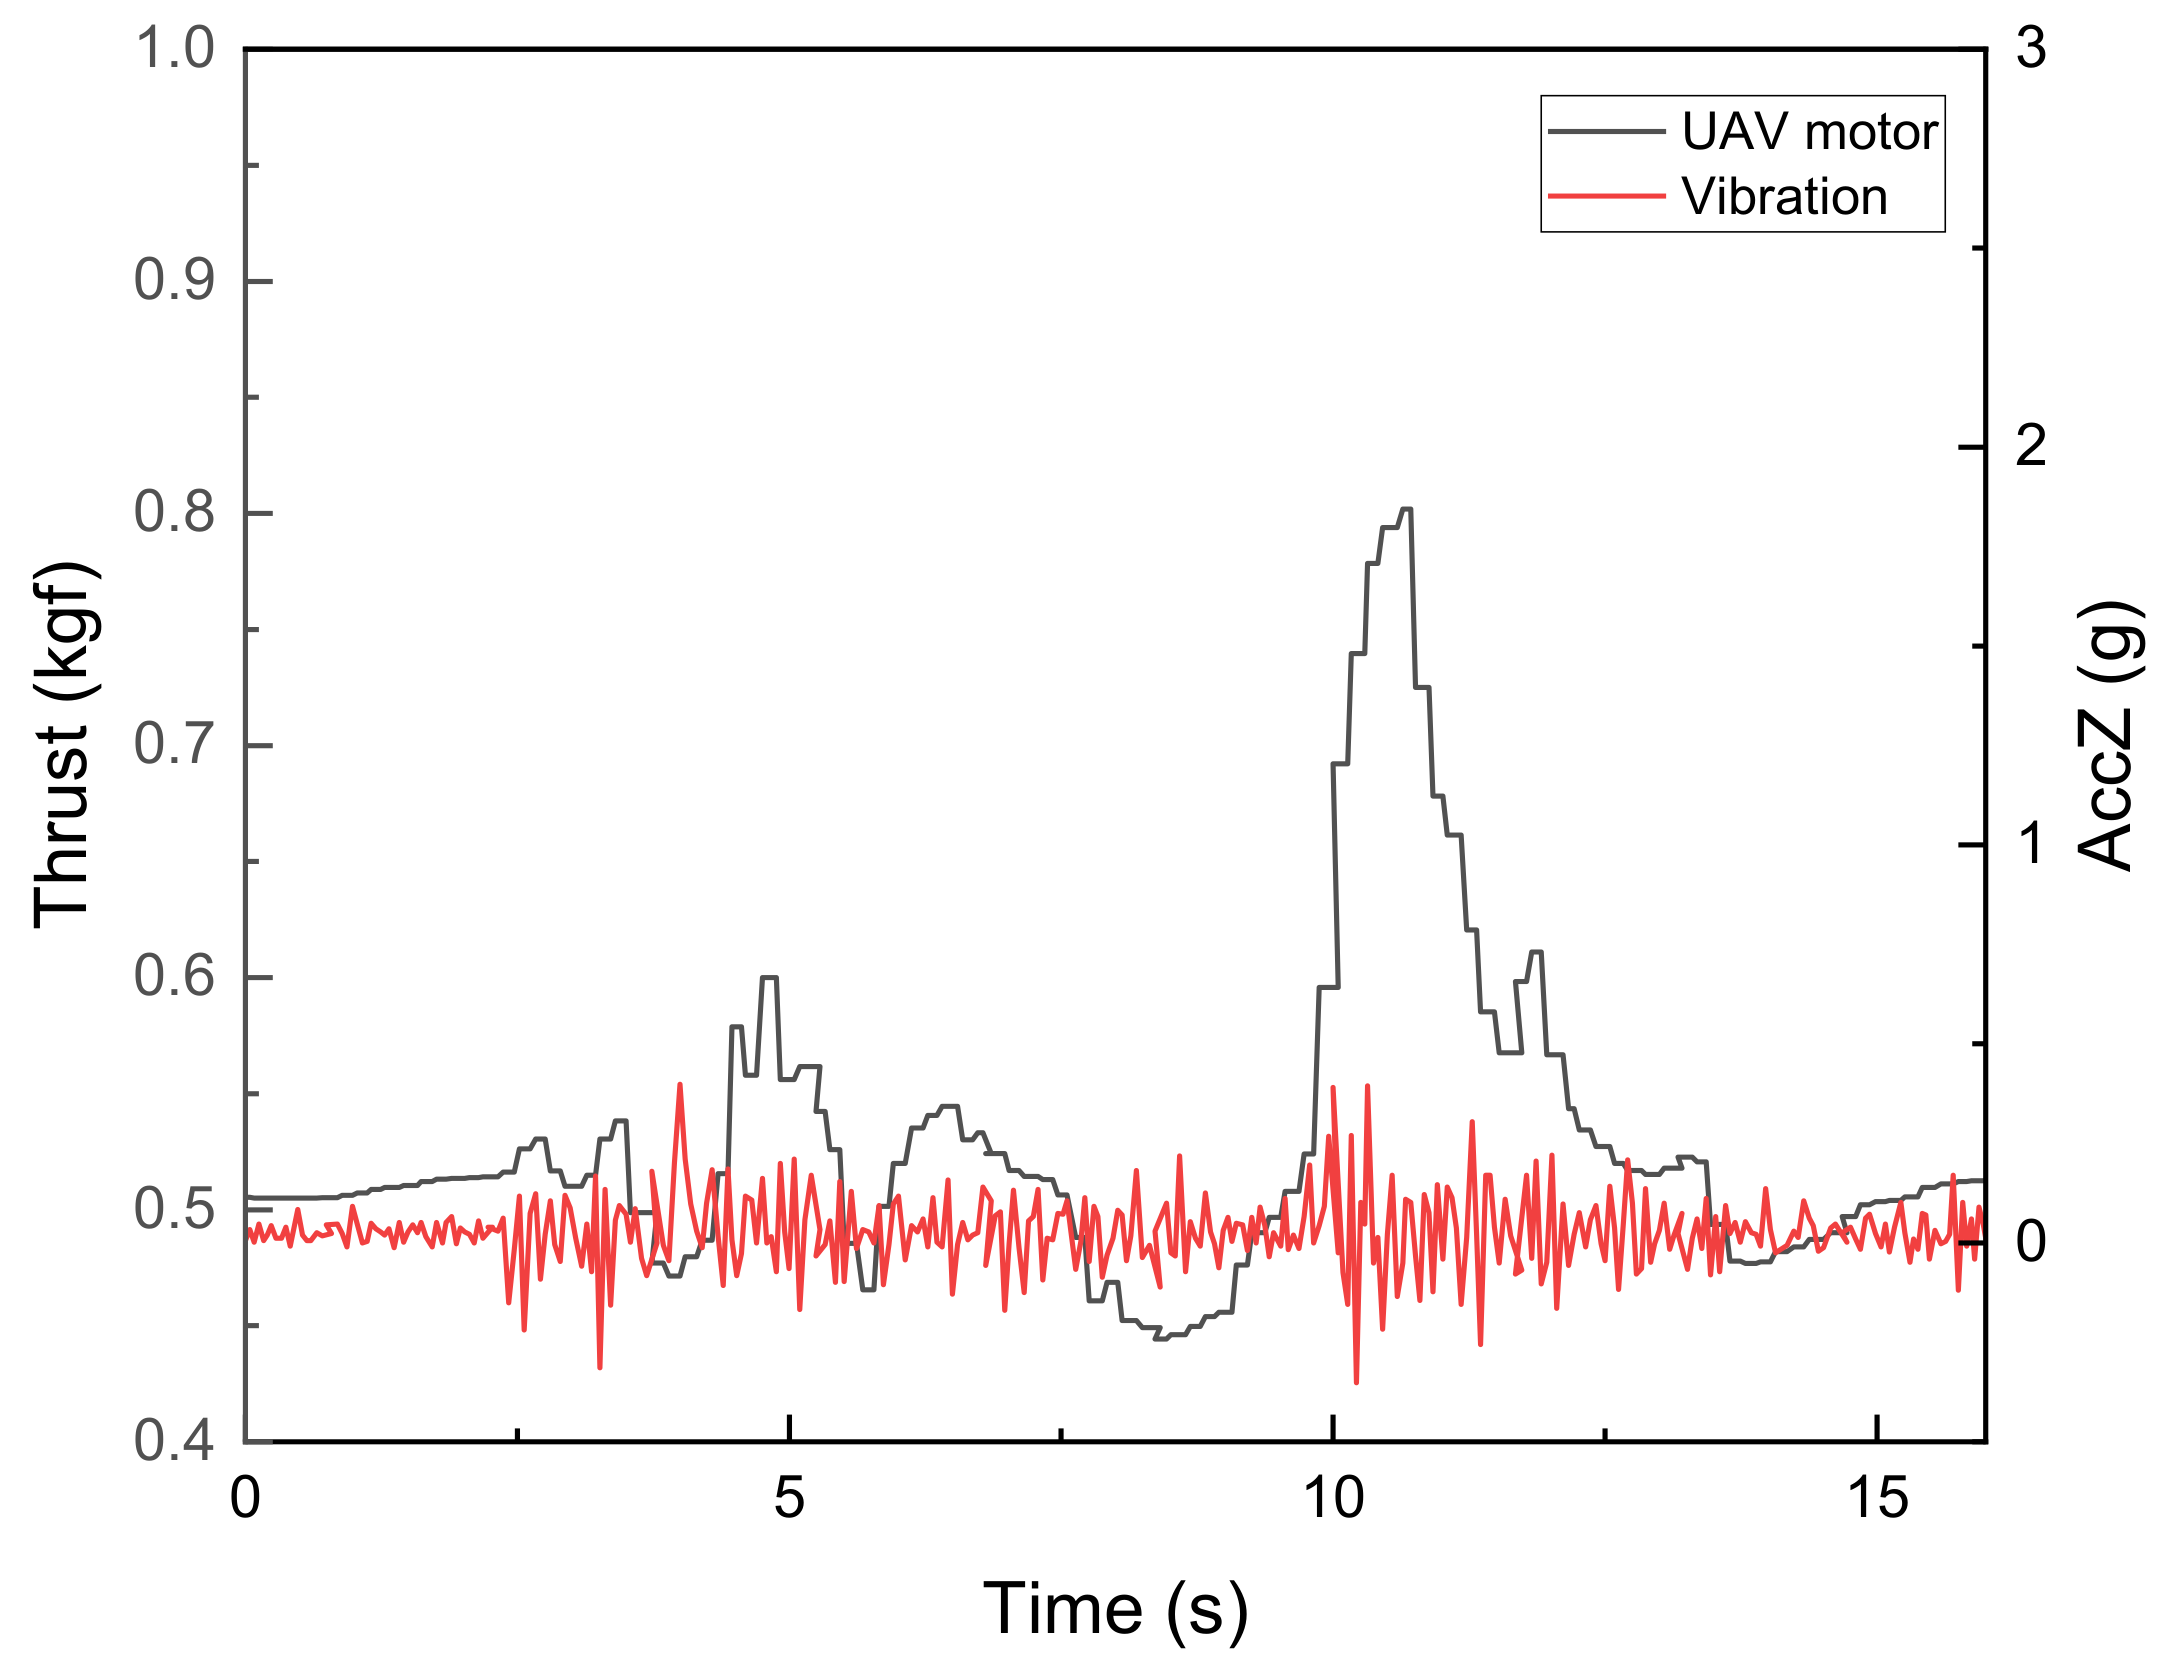
Figure 8 shows the UAV thrust and vibration acceleration measured at 1.8 m from the train surface during the passage of a KTX train. Before the passage of the train, the thrust of the UAV motor was maintained at 0.5 kgf. The thrust sharply increased to 0.6 kgf when the leading power car of the train passed and then rapidly decreased to 0.46 kgf. The thrust showed ±8.8% change during the passage of the passenger cars and sharply rose to 0.8 kgf when the trailing power car passed. After the passage of the train, the thrust slowly decreased and returned to 0.5 kgf in approximately 5 s.
The UAV thrust increased by 20% when the leading power car of a high-speed train passed and by up to 60% when the trailing power car passed. Even after the passage of the train, the pressure change and wake, which are factors affecting the thrust, were observed. This indicates that it takes several seconds for the thrust to stabilize. The wind velocity increased up to 10.89 and 22.19 m/s when the leading and trailing power cars of the KTX train passed, respectively, as shown in Figure 4. As observed, the thrust of the UAV increased significantly when the trailing car passed, which is attributed to the influence of the maximum wind velocity at this time.

4. Conclusions

The objective of this research was to experimentally investigate the characteristics of track-side wind induced by high-speed trains and its effects on the thrust of a typical quad-copter propeller near the railway bridge. In this study, 3-axis ultrasonic anemometers and a UAV thrust measurement system were installed on top of a PSC box girder bridge. Moreover, the changes in train-induced wind and UAV thrust were monitored along the track during the passage of two high-speed trains. The wind velocity sharply increased when the leading power cars of trains passed, gradually increased while the passenger cars passed, and more than doubled when the trailing power cars passed. The maximum wind velocity of the KTX was approximately 9.3% higher than that of the SRT, owing to its larger total length. Even after the passage of the trains, the train-induced wind slowly decreased owing to the influence of the wake. The measured train-induced wind characteristics can be used to establish a UAV operation plan when high-speed trains pass. Additionally, since the wind velocity in the train travel direction was confirmed to be dominant, it is appropriate to avoid operating the UAV in the train’s width direction when a train-induced wind occurs. The maximum wind velocity measured at 2.8 m from the train surface was approximately 62% lower than that measured at 0.8 m. The maximum wind velocity according to the distance from the train surface, can be used to set the accessible distance of the UAV.
It was found that the UAV thrust increased by 20% owing to the train-induced wind when the leading power car of a high-speed train passed and by up to 60% when the trailing power car passed. The thrust was maintained in the ±8.8% range in a relatively stable manner during the passage of the passenger cars after that of the leading power car. From the research results, it was confirmed that the thrust of the UAV, which was kept constant, suddenly increased when the leading and trailing power cars of a high-speed train passed over the bridge. A sudden thrust increase during the passage of a high-speed train may cause errors in UAV control systems. The experimental results presented here can be used to conduct further research on a robust control and a variable pitch-propeller that can control the thrust of UAV propellers.

Author Contributions

H.-J.Y., S.-H.Y., and D.-H.K. conceived and designed the experiments. J.H.K., B.-K.C., and G.-G.L. designed the UAV thrust measurement system, and S.-E.P. and Y.-C.K. assisted with the experiments. All authors have read and agreed to the published version of the manuscript.

Funding

This research was supported by a grant (20DPIW-C153340-02) from Unmanned Vehicle and SW platform research program related to Public Procurement for Innovation funded by the Ministry of Land, Infrastructure, and Transport (MOLIT) of Korea government and Korea Agency for Infrastructure Technology Advancement (KAIA).

Conflicts of Interest

The authors declare no conflict of interest.

References

  1. Kim, S.I. Experimental evaluations of track structure effects on dynamic properties of railway bridges. J. Vib. Control 2010, 17, 1817–1826. [Google Scholar] [CrossRef]
  2. Kim, S.I.; Kim, N.S. Dynamic performances of a railway bridge under moving train load using experimental modal parameters. Int. J. Struct. Stab. Dyn. 2010, 10, 91–109. [Google Scholar] [CrossRef]
  3. Kim, J.; Chung, W.; Jay Kim, J.H. Experimental investigation on behavior of a spliced PSC girder with precast box segments. Eng. Struct. 2008, 30, 3295–3304. [Google Scholar] [CrossRef]
  4. Guo, T.; Chen, Z.; Liu, T.; Han, D. Time-dependent reliability of strengthened PSC box-girder bridge using phased and incremental static analyses. Eng. Struct. 2016, 117, 358–371. [Google Scholar] [CrossRef]
  5. Cho, H.W.; Yoon, H.J.; Yoon, J.C. Analysis of crack image recognition characteristics in concrete structures depending on the illumination and image acquisition distance through outdoor experiments. Sensors 2016, 16, 1646. [Google Scholar] [CrossRef] [PubMed] [Green Version]
  6. Lei, B.; Wang, N.; Xu, P.; Song, G. New crack detection method for bridge inspection using UAV incorporating image processing. J. Aerosp. Eng. 2018, 31, 04018058. [Google Scholar] [CrossRef]
  7. Cho, H.; Yoon, H.J.; Jung, J.Y. Effects of the ground resolution and thresholding on crack width measurements. Sensors 2018, 18, 2644. [Google Scholar] [CrossRef] [PubMed] [Green Version]
  8. Kim, H.; Lee, J.; Ahn, E.; Cho, S.; Shin, M.; Sim, S.H. Concrete crack identification using a UAV incorporating hybrid image processing. Sensors 2017, 17, 2052. [Google Scholar] [CrossRef] [PubMed] [Green Version]
  9. Liu, Y.F.; Nie, X.; Fan, J.S.; Liu, X.G. Image-based crack assessment of bridge piers using unmanned aerial vehicles and three-dimensional scene reconstruction. Comput. Aided Civ. Infrastruct. Eng. 2020, 35, 511–529. [Google Scholar] [CrossRef]
  10. Kang, D.; Cha, Y.J. Autonomous UAVs for structural health monitoring using deep learning and an ultrasonic beacon system with geo-tagging. Comput. Aided Civ. Infrastruct. Eng. 2018, 33, 885–902. [Google Scholar] [CrossRef]
  11. Munoz-Paniagua, J.; Garcia, J. Aerodynamic surrogate-based optimization of the nose shape of a high-speed train for crosswind and passing-by scenarios. J. Wind Eng. Ind. Aerodyn. 2019, 184, 139–152. [Google Scholar] [CrossRef]
  12. Yang, N.; Zheng, X.K.; Zhang, J.; Law, S.S.; Yang, Q.S. Experimental and numerical studies on aerodynamic loads on an overhead bridge due to passage of high-speed train. J. Wind Eng. Ind. Aerodyn. 2015, 140, 19–33. [Google Scholar] [CrossRef]
  13. Baker, C. The flow around high-speed trains. J. Wind Eng. Ind. Aerodyn. 2010, 98, 277–298. [Google Scholar] [CrossRef]
  14. Rocchi, D.; Tomasini, G.; Schito, P.; Somaschini, C. Wind effects induced by high speed train pass-by in open air. J. Wind Eng. Ind. Aerodyn. 2018, 173, 279–288. [Google Scholar] [CrossRef]
  15. Wang, S.; Burton, D.; Herbst, A.H.; Sheridan, J.; Thompson, M.C. The effect of the ground condition on high-speed train slipstream. J. Wind Eng. Ind. Aerodyn. 2018, 172, 230–243. [Google Scholar] [CrossRef]
  16. Xia, C.; Wang, H.; Shan, X.; Yang, Z.; Li, Q. Effects of ground configurations on the slipstream and near wake of a high-speed train. J. Wind Eng. Ind. Aerodyn. 2017, 168, 177–189. [Google Scholar] [CrossRef]
Figure 1. Schematics of the train-induced wind and unmanned aerial vehicle (UAV) thrust measurement systems installed on top of the Wolsan bridge.
Applsci 10 03495 g001
Figure 2. Installation locations of the 3-axis ultrasonic anemometers and UAV thrust measurement system. (a) Distances between the 3-axis ultrasonic anemometers and the train. (b) Installed train-induced wind and UAV thrust measurement systems.
Applsci 10 03495 g002aApplsci 10 03495 g002b
Figure 3. Two types of high-speed trains used in the experiment (a) KTX; (b) SRT.
Applsci 10 03495 g003
Figure 4. Train-induced wind velocity over time measured at a 0.8 m distance from the train surface.
Applsci 10 03495 g004
Figure 5. Train-induced wind velocity over time measured at 0.8 m from the train surface in each direction. (a) Train travel direction; (b) train width direction; (c) height direction.
Applsci 10 03495 g005aApplsci 10 03495 g005b
Figure 6. Maximum train-induced wind velocity according to the distance from the train surface during the passage of KTX trains.
Applsci 10 03495 g006
Figure 7. Train-induced wind velocity measured at 0.8, 1.3, 2.3, and 2.8 m distances from the train surface in each direction. (a) Train travel direction; (b) train width direction; (c) height direction.
Applsci 10 03495 g007aApplsci 10 03495 g007b
Figure 8. UAV thrust measured at the trackside on top of the Wolsan bridge during the passage of a KTX train.
Applsci 10 03495 g008
Table 1. Detailed specifications of the main components of the train-induced wind and UAV thrust measurement systems.
SystemComponentParameterValue
Train-induced wind measurement system3-axis ultrasonic anemometerWind velocity0–40 m/s
Resolution0.01 m/s
Accuracy±1%
Wind direction0–360°
Output speed32 Hz
UAV thrust test systemMotorSizeΦ55.6 × 33.9 mm
Configuration24N28P
Max. Power1000 W
PropellerLength/Pitch17 × 5.8 inch
Weight32.5 g
MaterialCarbon epoxy
Optimal RPM4000–6000