Article

Recovery Behavior of Fe-Based Shape Memory Alloys under Different Restraints

1
Department of Civil Engineering, Chungbuk National University, 1 Chungdae-ro, Seowon-Gu, Cheongju, Chungbuk 28644, Korea
2
Dongnam Regional Division, Korea Institute of Industrial Technology (KITECH), Yangsan 50623, Korea
3
Department of Mechanical Engineering, Pusan National University, Busan 46241, Korea
*
Author to whom correspondence should be addressed.
Appl. Sci. 2020, 10(10), 3441; https://doi.org/10.3390/app10103441
Submission received: 28 April 2020 / Revised: 15 May 2020 / Accepted: 15 May 2020 / Published: 16 May 2020

Abstract

:
This paper presents the experimental results of an evaluation of the recovery behavior of Fe-based shape memory alloys (Fe-SMAs) under different restraints. For the study, three types of Fe-SMA (FSMA-A, FSMA-B, FSMA-C) were produced. As a result of the direct tensile test, the yield strength of the FSMA-A specimen was nearly 34% higher than the strength of FSMA-B and FSMA-C. Under free restraint, the recovery strains are 0.00956, 0.01445, and 0.01977 for FSMA-A, FSMA-B and FSMA-C specimens, respectively, after activation when the pre-strain is 0.04, and the heating temperature 200 °C. Under rigid restraint, the final recovery stresses are 518, 391 and 401 MPa for FSMA-A, FSMA-B, FSMA-C specimens after activation when a pre-strain of 0.04 and heating temperature 200 °C. Additionally, under the rigid restraint, the effect of pre-strain on the final recovery stress was insignificant, whereas the final recovery stress increased as the heating temperature increased. When Fe-SMA was constrained during cooling, the recovery stress is 50% lower than under rigid restraint. Hence, in order to develop a large recovery stress, Fe-SMA must be constrained during heating. In addition, a method for calculating the effective confining stress of the Fe-SMA coupler for pipe joining was proposed based on the experimental results.

1. Introduction

Shape memory alloys (SMAs) are a special type of material that can be returned to their original shape by an external stimulus, such as heating or cooling, after having gone through a large plastic deformation [1]. The behavior of SMA exhibits a shape memory effect (SME), which is the phase transformation from the martensite phase to the austenite phase depending on the temperature [2]. Around 30 alloys that show a SME have been reported so far and nickel-titanium alloy (Nitinol), is the most common SMA [3]. Since these materials have a remarkable recovery characteristisc in the region of strain of 0.08, Nitinol has been used in a variety of industries including aerospace, mechanical, aeronautical and medical engineering [4,5]. However, the usage of Nitinol in any civil or architecture field has been limited due to the high cost of raw materials and limited temperature history [6,7].
Alternatively, many studies on Fe-based SMAs (Fe-SMA) have been carried out after a Fe-SMA was developed by Sato et al. [8]. Kajiwara et al. [9] reported that Nb and C particles enhanced the SME in the Fe-SMA without a training stage. Leinenbach et al. [2] developed an alloy that has a high recovery stress of 300 to 500 MPa at 130 to 160 °C using a Fe-17Mn-5Si-10Cr-4Ni-1(V, C)-based alloy. In particular, Fe-SMAs are favorable when applied to civil and architecture engineering because they are economically efficient compared to Nitinol [10]. Maruyama et al. [11] made a fishplate for crane rail joints and showed the availability of Fe-SMA for joint components. Michels et al. [12] examined the Fe-SMA bar by applying it to a concrete pre-stressing tendon. The Fe-SMA bar made of the Fe-17Mn-5Si-10Cr-4Ni-1(V,C) alloy had 0.04 of pre-strain, 300 MPa of recovery stress with a 200 °C activation temperature, and 10% of relaxation after 1000 h. Rojob and El-Hacha [13] studied the reinforcement of a concrete structure through the near surface mounted method (NSM) using Fe-SMA strips. In the study, the concrete structure was reinforced using Fe-SMA strips and it showed a better performance in the service stress and ultimate stress compared to the unreinforced structure [13]. Hong et al. [14] proceeded with a thermal mechanical test using Fe-17Mn-5Si-10Cr-4Ni-1(V, C) alloys in order to apply the Fe-SMAs to reinforcements in civil structures. In the test, about 208 MPa to 439 MPa of recovery stresses between 100 °C to 220 °C were monitored and the recovery stresses were considered to have an effect on the pre-stressing of the concrete structure [14].
Most of the studies regarding the Fe-SMA being applied to civil structures are focused on the recovery stress under rigid restraint, except for the work by Lee and his coworkers [1]. However, the behavior of Fe-SMAs in the civil structure varies as restraints change under various service conditions. In this study, the mechanical characteristics and recovery properties of Fe-SMA under different restraints are investigated through experiments. Especially, its applicability to the tendons of prestressed concrete and pipe couplers was experimentally examined.

2. Production of the Fe-SMA

In order to understand the mechanical and recovery characteristics of a Fe-SMA, Fe-SMA plates were manufactured. As seen in Table 1, two types of 50 kg Fe-SMA (FSMA-A, FSMA-B) ingots were made using vacuum induction melting of the Fe-SMA plate. Afterwards, a homogenization treatment was given for 6 hours at 1250 °C. The two types of ingots were forged and hot rolled at 1000 °C to 5 mm. Additional heat treatments at 750 °C for 2 h was given to some of FSMA-B plates which were designated as FSMA-C to evaluate the effect of the heat treatment as a recovery characteristic.

3. Experimental Program

3.1. Test Specimen

The test specimens were made based on the ASTM A370 [15] standard to better understand the mechanical characteristic and recovery property of Fe-SMA. The specimens were 12.5, 2.5 and 100 mm in width, thickness and length. The width and length of the zig were 20 and 40 mm. To avoid the stress concentration in the connected region between the zig and specimen, a 20 mm radius of fillet were used to connect the specimen to the zig.

3.2. Direct Tensile Test

Figure 1 shows the direct tensile test to obtain the mechanical properties such as modulus, yield strength and ultimate strength of the Fe-SMAs. Displacement control was conducted at 0.5 mm/min using a 100 kN universal testing machine (UTM). The mechanical behavior of the specimen was monitored using a strain gauge at the center of the specimen and the strain gauge signal was acquired through the DAQ system every 1 s.

3.3. Pre-Straining Method

Pre-straining of all the specimens considered in this study was applied using 100 kN UTM before the Fe-SMAs were activated. Displacement control at a rate of 0.25 mm/min was implemented for the pre-straining. As the pre-straining reached the target strain value, the displacement was released at 0.25 mm/min until the stress on the specimen reaches 0.

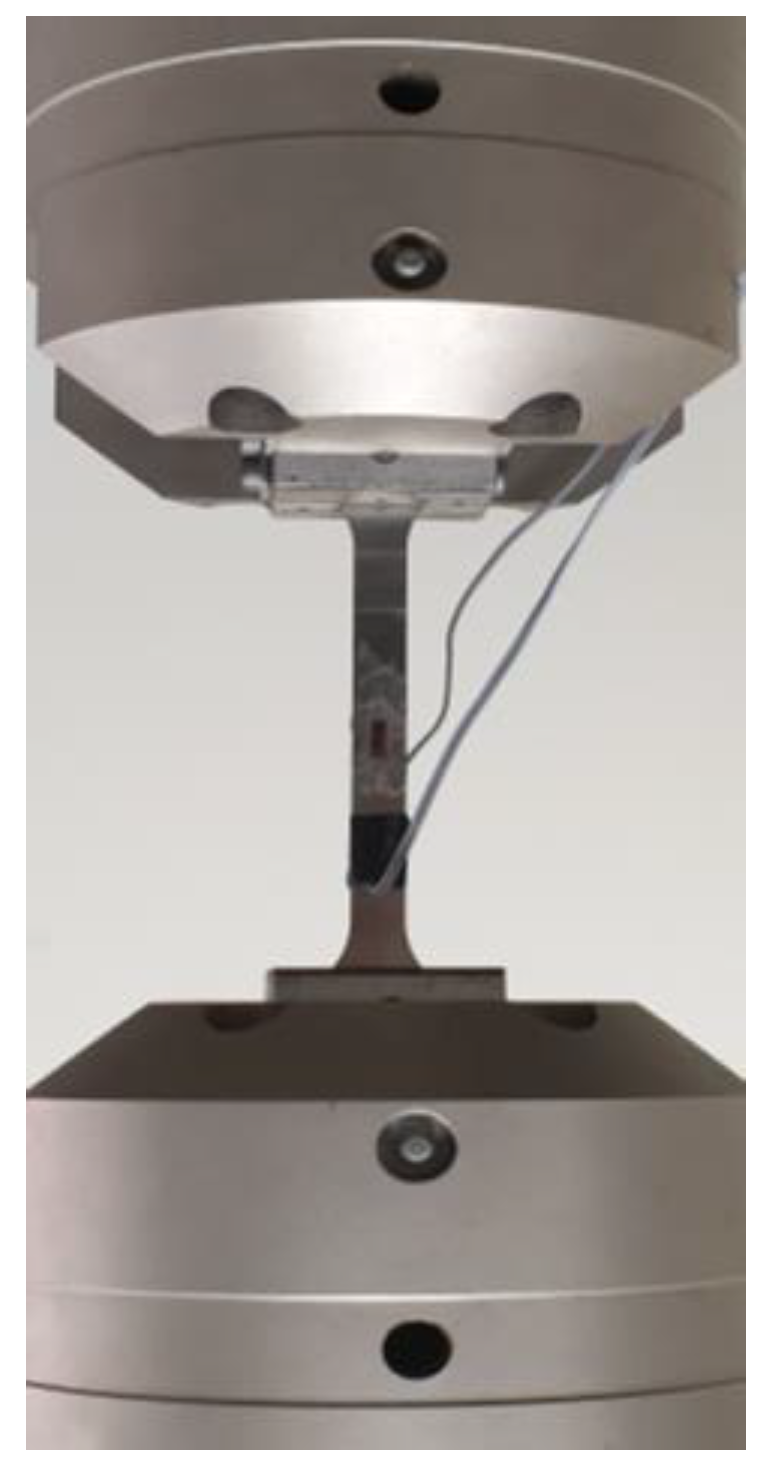
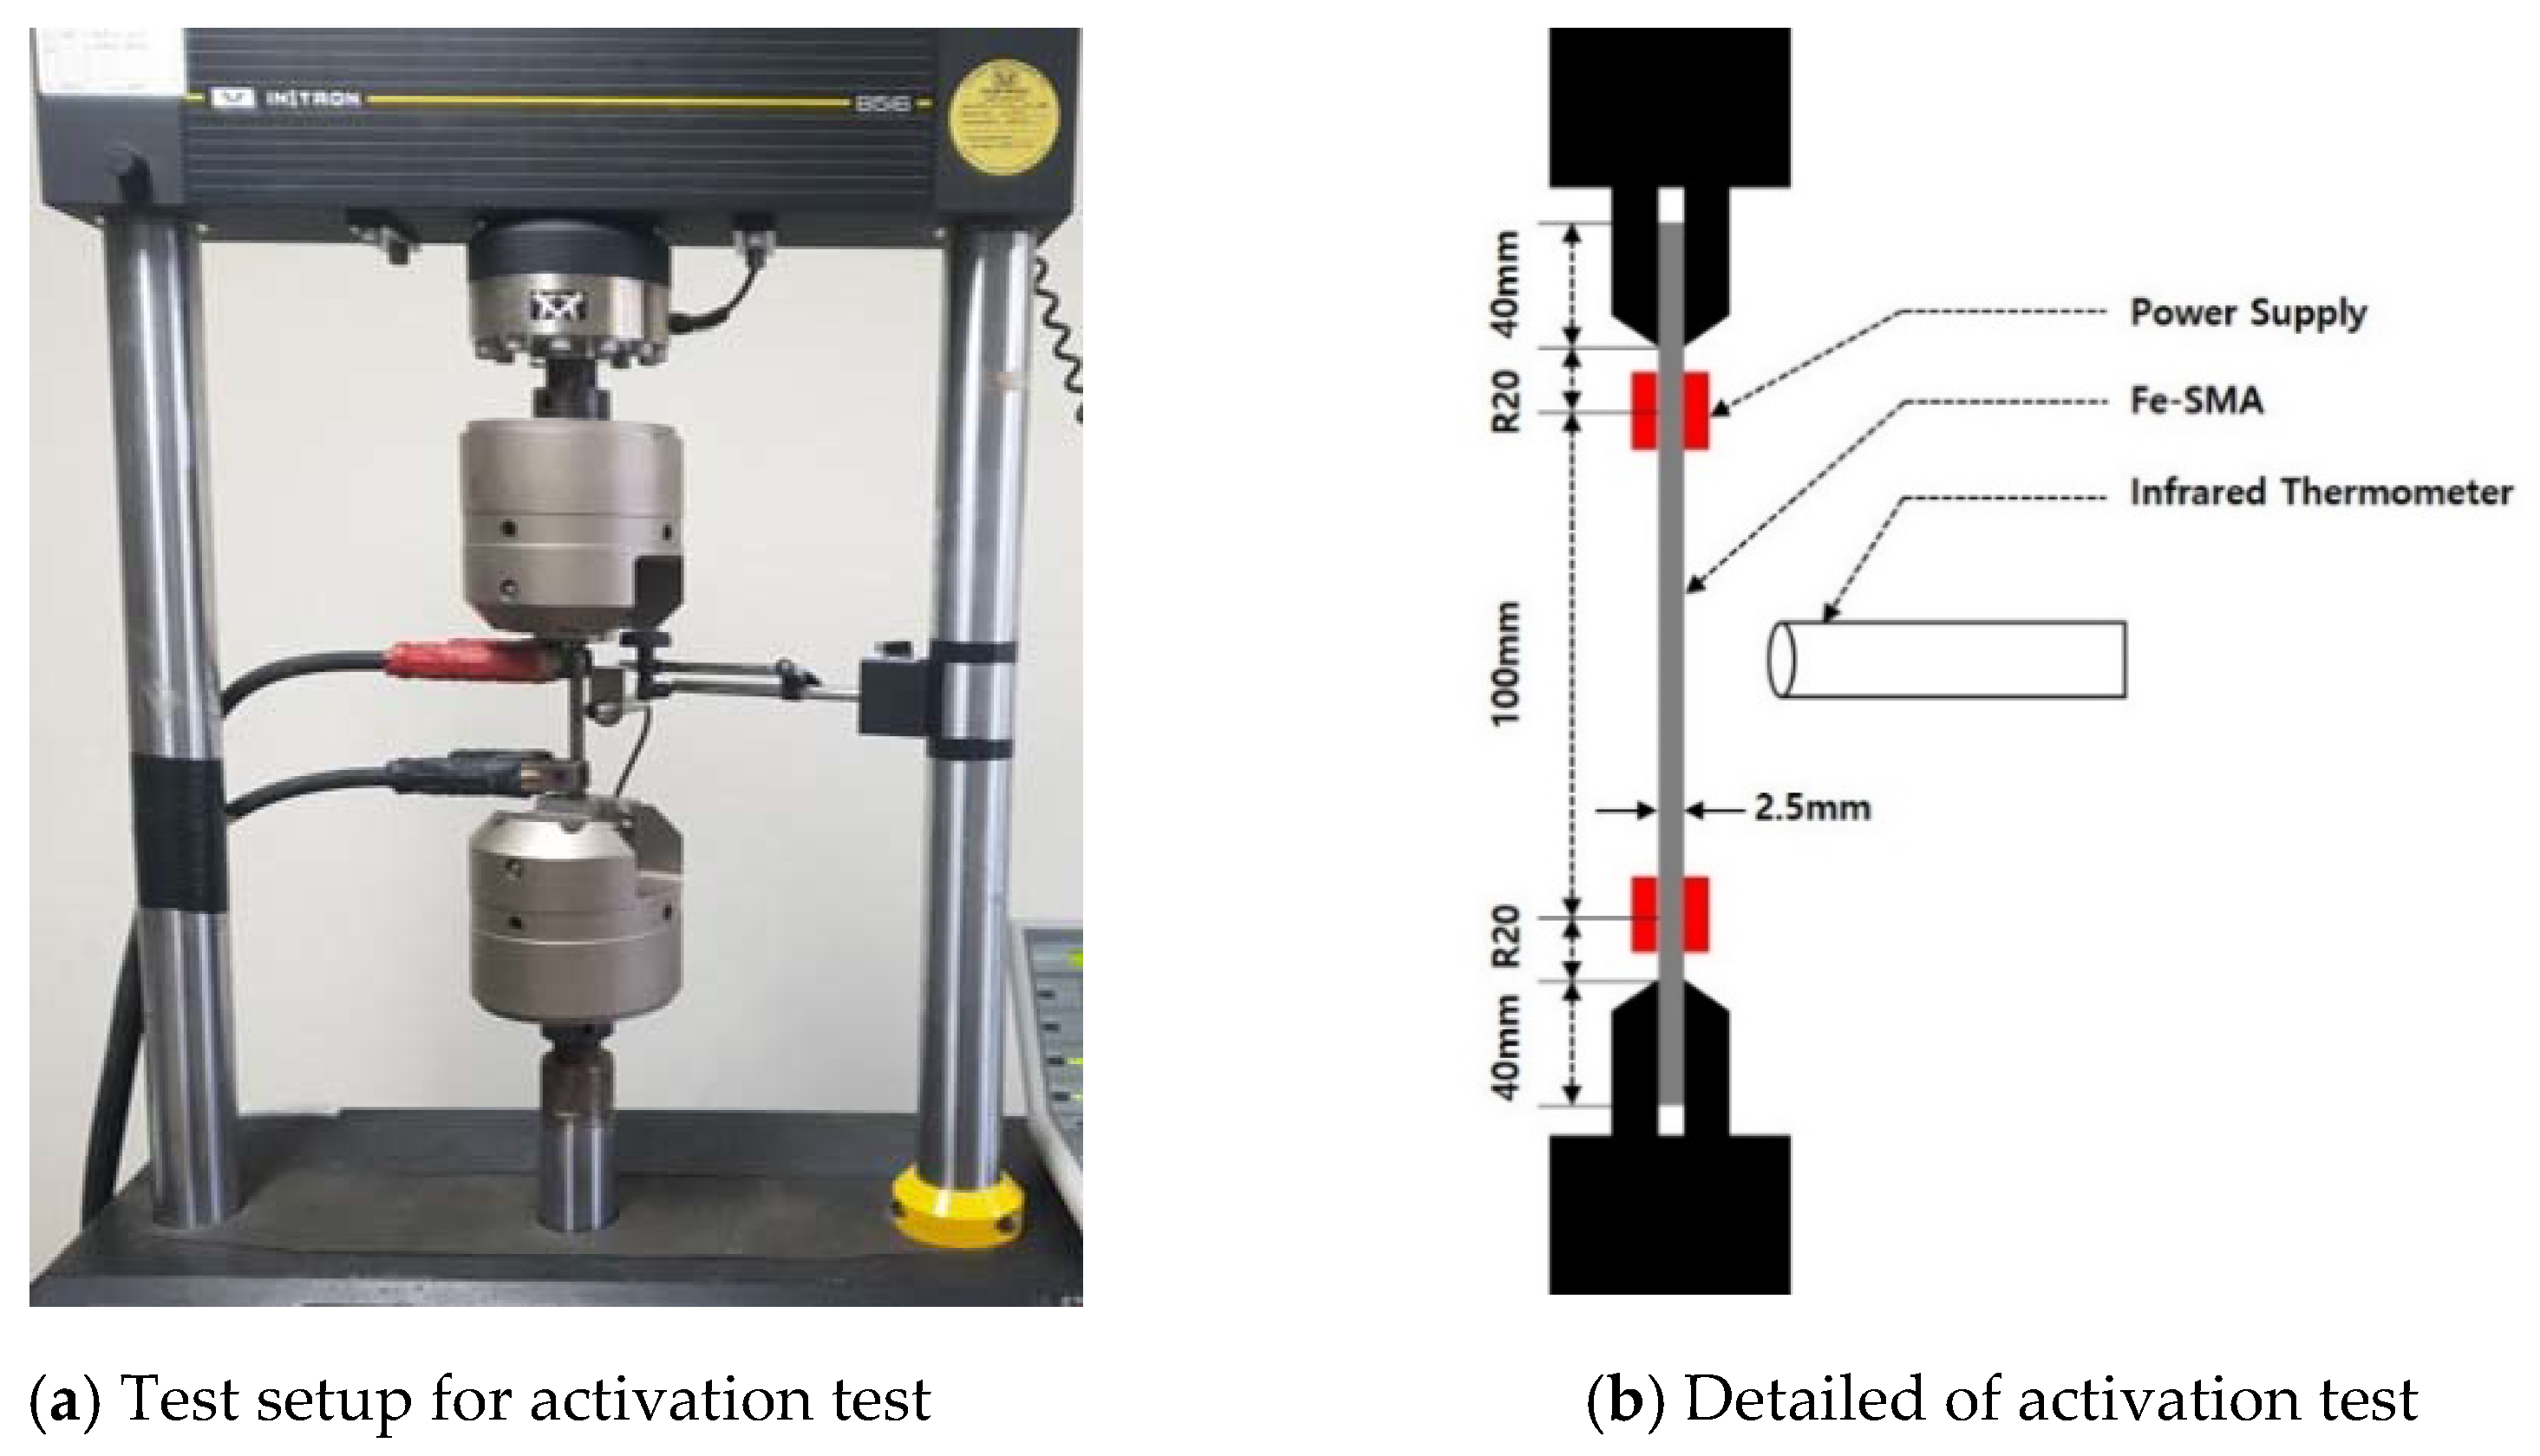
3.4. Activation Method

3.4.1. Free Restraint

After the stress was released by eliminating the pre-strain, residual strain still remained in the Fe-SMA specimens. When the Fe-SMAs were activated through the heat treatment, the residual strain partially recovered. This recovered strain is defined as recovery strain. In this study, 3 types of Fe-SMAs specimens (FSMA-A, FSMA-B, FSMA-C) were considered and the recovery strain was measured using 100 kN UTM with 0.04 pre-strain and heating at 200 °C. The test set-up sets to keep the stress in the specimens less than 5 MPa to simulate the free restraint.
The specimens were activated through electric resistance heating using an electric power system with 1 A/mm2. As the temperature in the specimen reached the target temperature, the electrical power was cut off to cool it back to an ambient temperature and the strain was monitored in the whole process. Infrared ray heat sensors were used to measure the temperature of the specimen during the heating and cooling processes and the temperature data was acquired through the DAQ system every 1 s. The test set-up of the activation test considered in this study is presented in Figure 2.

3.4.2. Rigid Restraint

The recovery stress in the Fe-SMA was investigated through an activation process using 100 kN UTM. Type of Fe-SMA (FSMA-A, FSMA-B, FSMA-C), level of pre-strain (0.02, 0.04, 0.06, 0.08) and heating temperature (120 °C, 160 °C, 200 °C, 240 °C) were considered as experimental variables. Test parameter details are given in Table 2. The first letters A, B and C represent the type of Fe-SMA, respectively. The following Arabic numbers 2, 4, 6 and 8 represent pre-strain of the Fe-SMA, respectively. Next to the symbol “-”, T, represents the temperature. The following Arabic numbers 120, 160, 200 and 240, represent the heating temperatures 120 °C, 160 °C, 200 °C and 240 °C, respectively. The displacement of the specimen with approximately 50 MPa of pre-stress was fixed to inhibit buckling behavior from the initial heat expansion in activation process. The specimen was activated using an electronic supply device as described in free restraint test. The temperature and stress were monitored through a DAQ system every 1 s.

3.4.3. Partial Restraint

A number of studies were conducted to apply Fe-SMAs to the couplers used in pipe joining [1,16]. As seen in Figure 3, an initial gap is present between the inner part of the coupler and the outer part of the pipes at the pipe joint. In the case of activation in the Fe-SMA, the initial gap is reduced by SEM. When the initial gap is fully closed between the Fe-SMA and the pipes, the recovery stress develops in the Fe-SMA. In order to simulate this situation, two types of restraint conditions were considered in the activation process in the Fe-SMA. Figure 4 shows the description of partial restraint. Firstly, the test was arranged with the stress being kept at less than 5 MPa in the specimen. The recovery strain developed freely in the Fe-SMA specimen. In the second step, the behavior of the Fe-SMA was considered as the gap between the coupler and the pipes fully closed. The Fe-SMA specimen was restraint to deform and the stress in the specimen was observed. The test was performed with a pre-strain of 0.04 at 200 °C for heating temperature. Two types of Fe-SMA (FSMA-A, FSMA-C) were considered and the contact temperatures were varied as listed in Table 3. The first letter A and C represent the type of Fe-SMA, respectively. Next to the symbol “-”, Arabic numbers 120, 160 and 200 represent the contact temperature (TC) 120 °C, 160 °C, and 200 °C, respectively. Finally, the last letters H and C represent the heating phase and cooling phase at which the Fe-SMA specimen was constrained. The contact temperature (TC) is the temperature at which the initial gap is fully closed in Figure 3 and the recovery strain is constrained by the SME of Fe-SMAs in Figure 4b. The activation method and data acquisition in the process are the same as the test described under the free restraint with varying heating and cooling temperatures.

4. Result and Discussion

4.1. Mechanical Properties of Fe-SMA

Figure 5 and Table 4 compare the stress-strain curves by the direct tensile tests and present a summary of the direct tensile test results. The ultimate strain and strength for the FSMA-A specimen are 0.22556 and 1140 MPa, respectively. The ultimate strengths for the FSMA-B and FSMA-C specimens, which have different chemical compositions from the FSMA-A, are reduced by 3% and 5% compared to the FSMA-A specimen. The ultimate strength for the FSMA-C specimen that has an additional heat treatment decreased by 2.33% compared to the FSMA-B specimen that has the same chemical composition as the FSMA-C specimen. It is thought that the internal stress from the work hardening is released/eliminated during the heat treatment which leads to a strength reduction [17]. The ultimate strain for the FSMA-B and FSMA-C specimens increased by 74.5% and 75.2% when compared to the FSMA-A specimen. The high ultimate stress and low strain in the FSMA-A specimen is considered to be the effect of dispersion hardening and grain refinement from Titanium carbide in the work hardening process [18,19]. The elastic modulus for the specimens was determined by a stress-strain curve that was in a range between 0 and 130 MPa. The elastic modulus for each type of specimen is 125, 126.14 and 123 GPa. This is thought to be the effect of chemical elements such as nickel, titanium or carbon in each specimen which is insignificant on the elastic modulus. In Fe-SMA, the yield point is ambiguous due to the nonlinear behavior from the phase transformation from the austenite phase to the martensite phase and plastic deformation [20]. So, the yield point of the Fe-SMA was determined using a 0.2% offset method. The yield stress of the FSMA-A specimen was 599 MPa and the yield stress for the FSMA-B and FSMA-C specimens increased to 36.6% and 31.6% with respect to the FSMA-A. Therefore, while the FSMA-A type is suitable for being applied to structural components which carry a large load, the FSMA-B and FSMA-C types may be more effectively employed in structural components that require a high ductility.

4.2. Fe-SMA Behavior under Free Restraint

Figure 6 and Table 5 present the comparison of temperature-recovery strain curves under free restraint and the activation test results of the Fe-SMA specimens with 0.04 pre-strain and 200 °C of heating temperature under free restraint. The residual strain for the FSMA-A specimen was 0.03033 before heating. The strain decreased to 0.02406 after being heated to 200 °C and subsequently dropped to 0.02077 when the FSMA-A specimen was cooled back to an ambient temperature. Thus, the recovery strain for the FSMA-A specimen was 0.00956. For the FSMA-B specimen, the residual strain was 0.03214 under a 0.04 pre-strain condition. In the heating stage, the strain was gradually reduced and reached 0.02103 at 200 °C because of SME. When the specimen was cooled back to an ambient temperature, the strain was 0.01769. Therefore, the recovery strain for the FSMA-B specimen was 0.01455 which is 51% higher than the FSMA-A specimen. Before heating, the residual strain for the FSMA-C specimen with a 0.04 pre-strain was 0.03234. The strain decreased to 0.01703 after being heated to 200 °C and subsequently dropped to 0.01257 when the FSMA-C specimen was cooled back to an ambient temperature. Thus, the recovery strain for the FSMA-C specimen was 0.01977. For the specimen that includes extra Ti composition, while the mechanical properties were enhanced, the recovery strain was lower. This is thought to be because the Ti added in the SMAs affects the mechanical properties and recovery strain. Even though the FSMA-B and FSMA-C have the same chemical composition, the recovery strain in the FSMA-C was 36.8% higher than the one from the FSMA-B. The growth of the recovery strain in the FSMA-C specimen was suspected to be caused by Carbon added in the FSMA-C specimen that encouraged it to have higher recovery strain [19,21]. Thus, the heat treatment in manufacturing Fe-SMA has been shown to be beneficial in imparting higher recovery strain.

4.3. Fe-SMA Behavior under Rigid Restraint

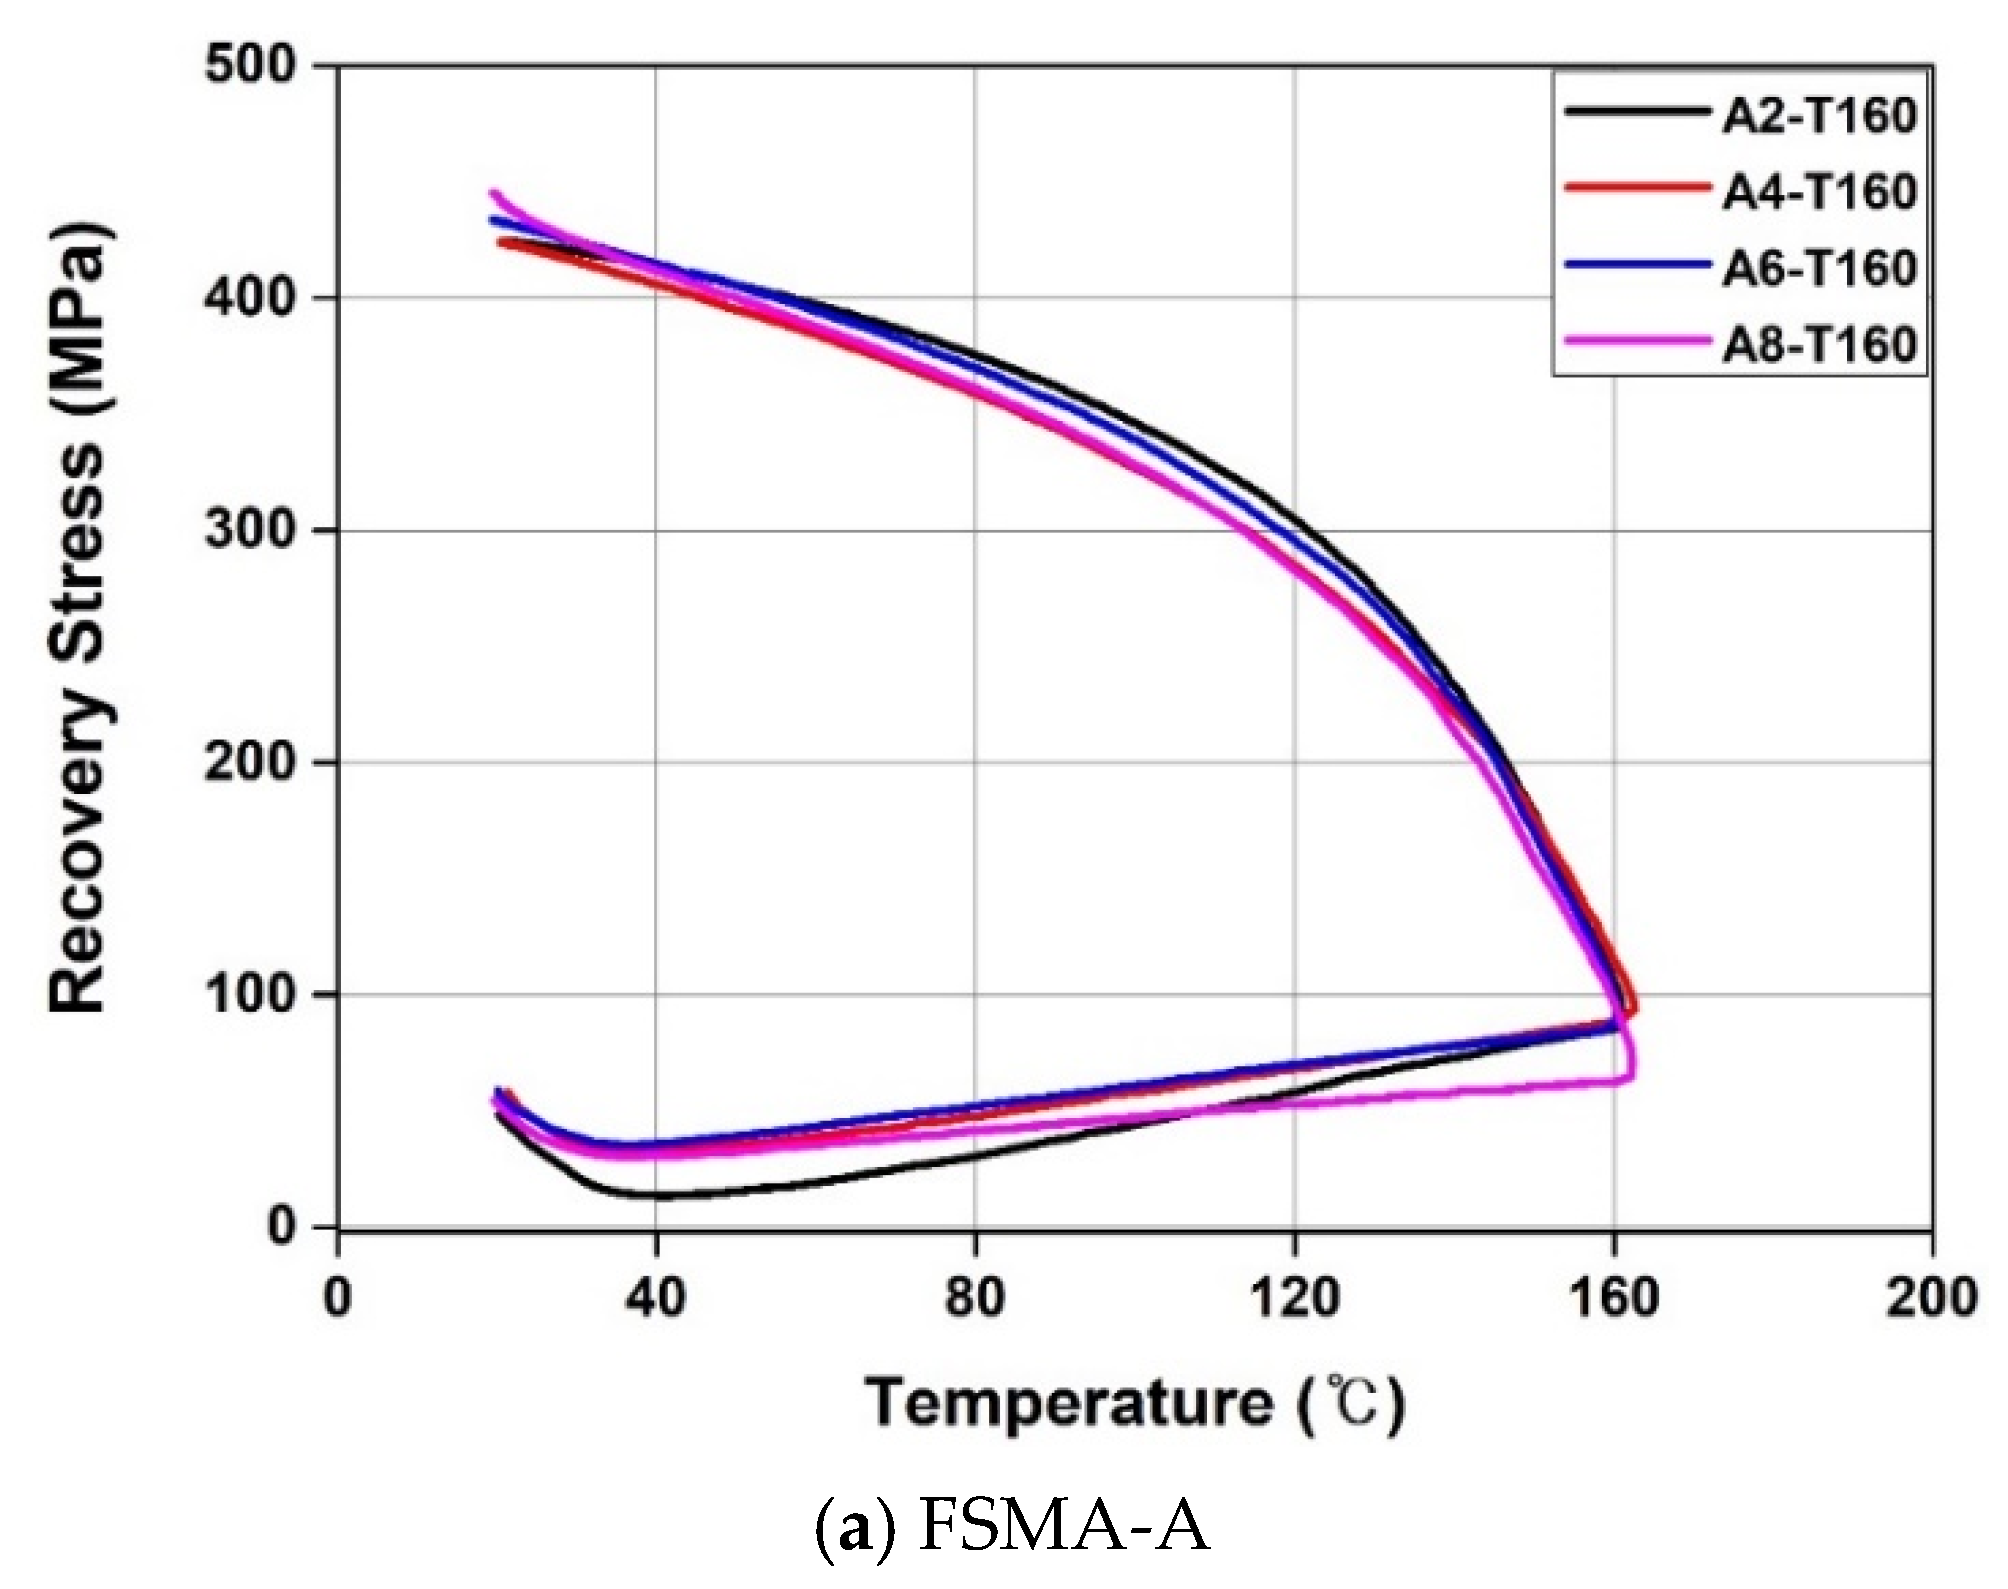
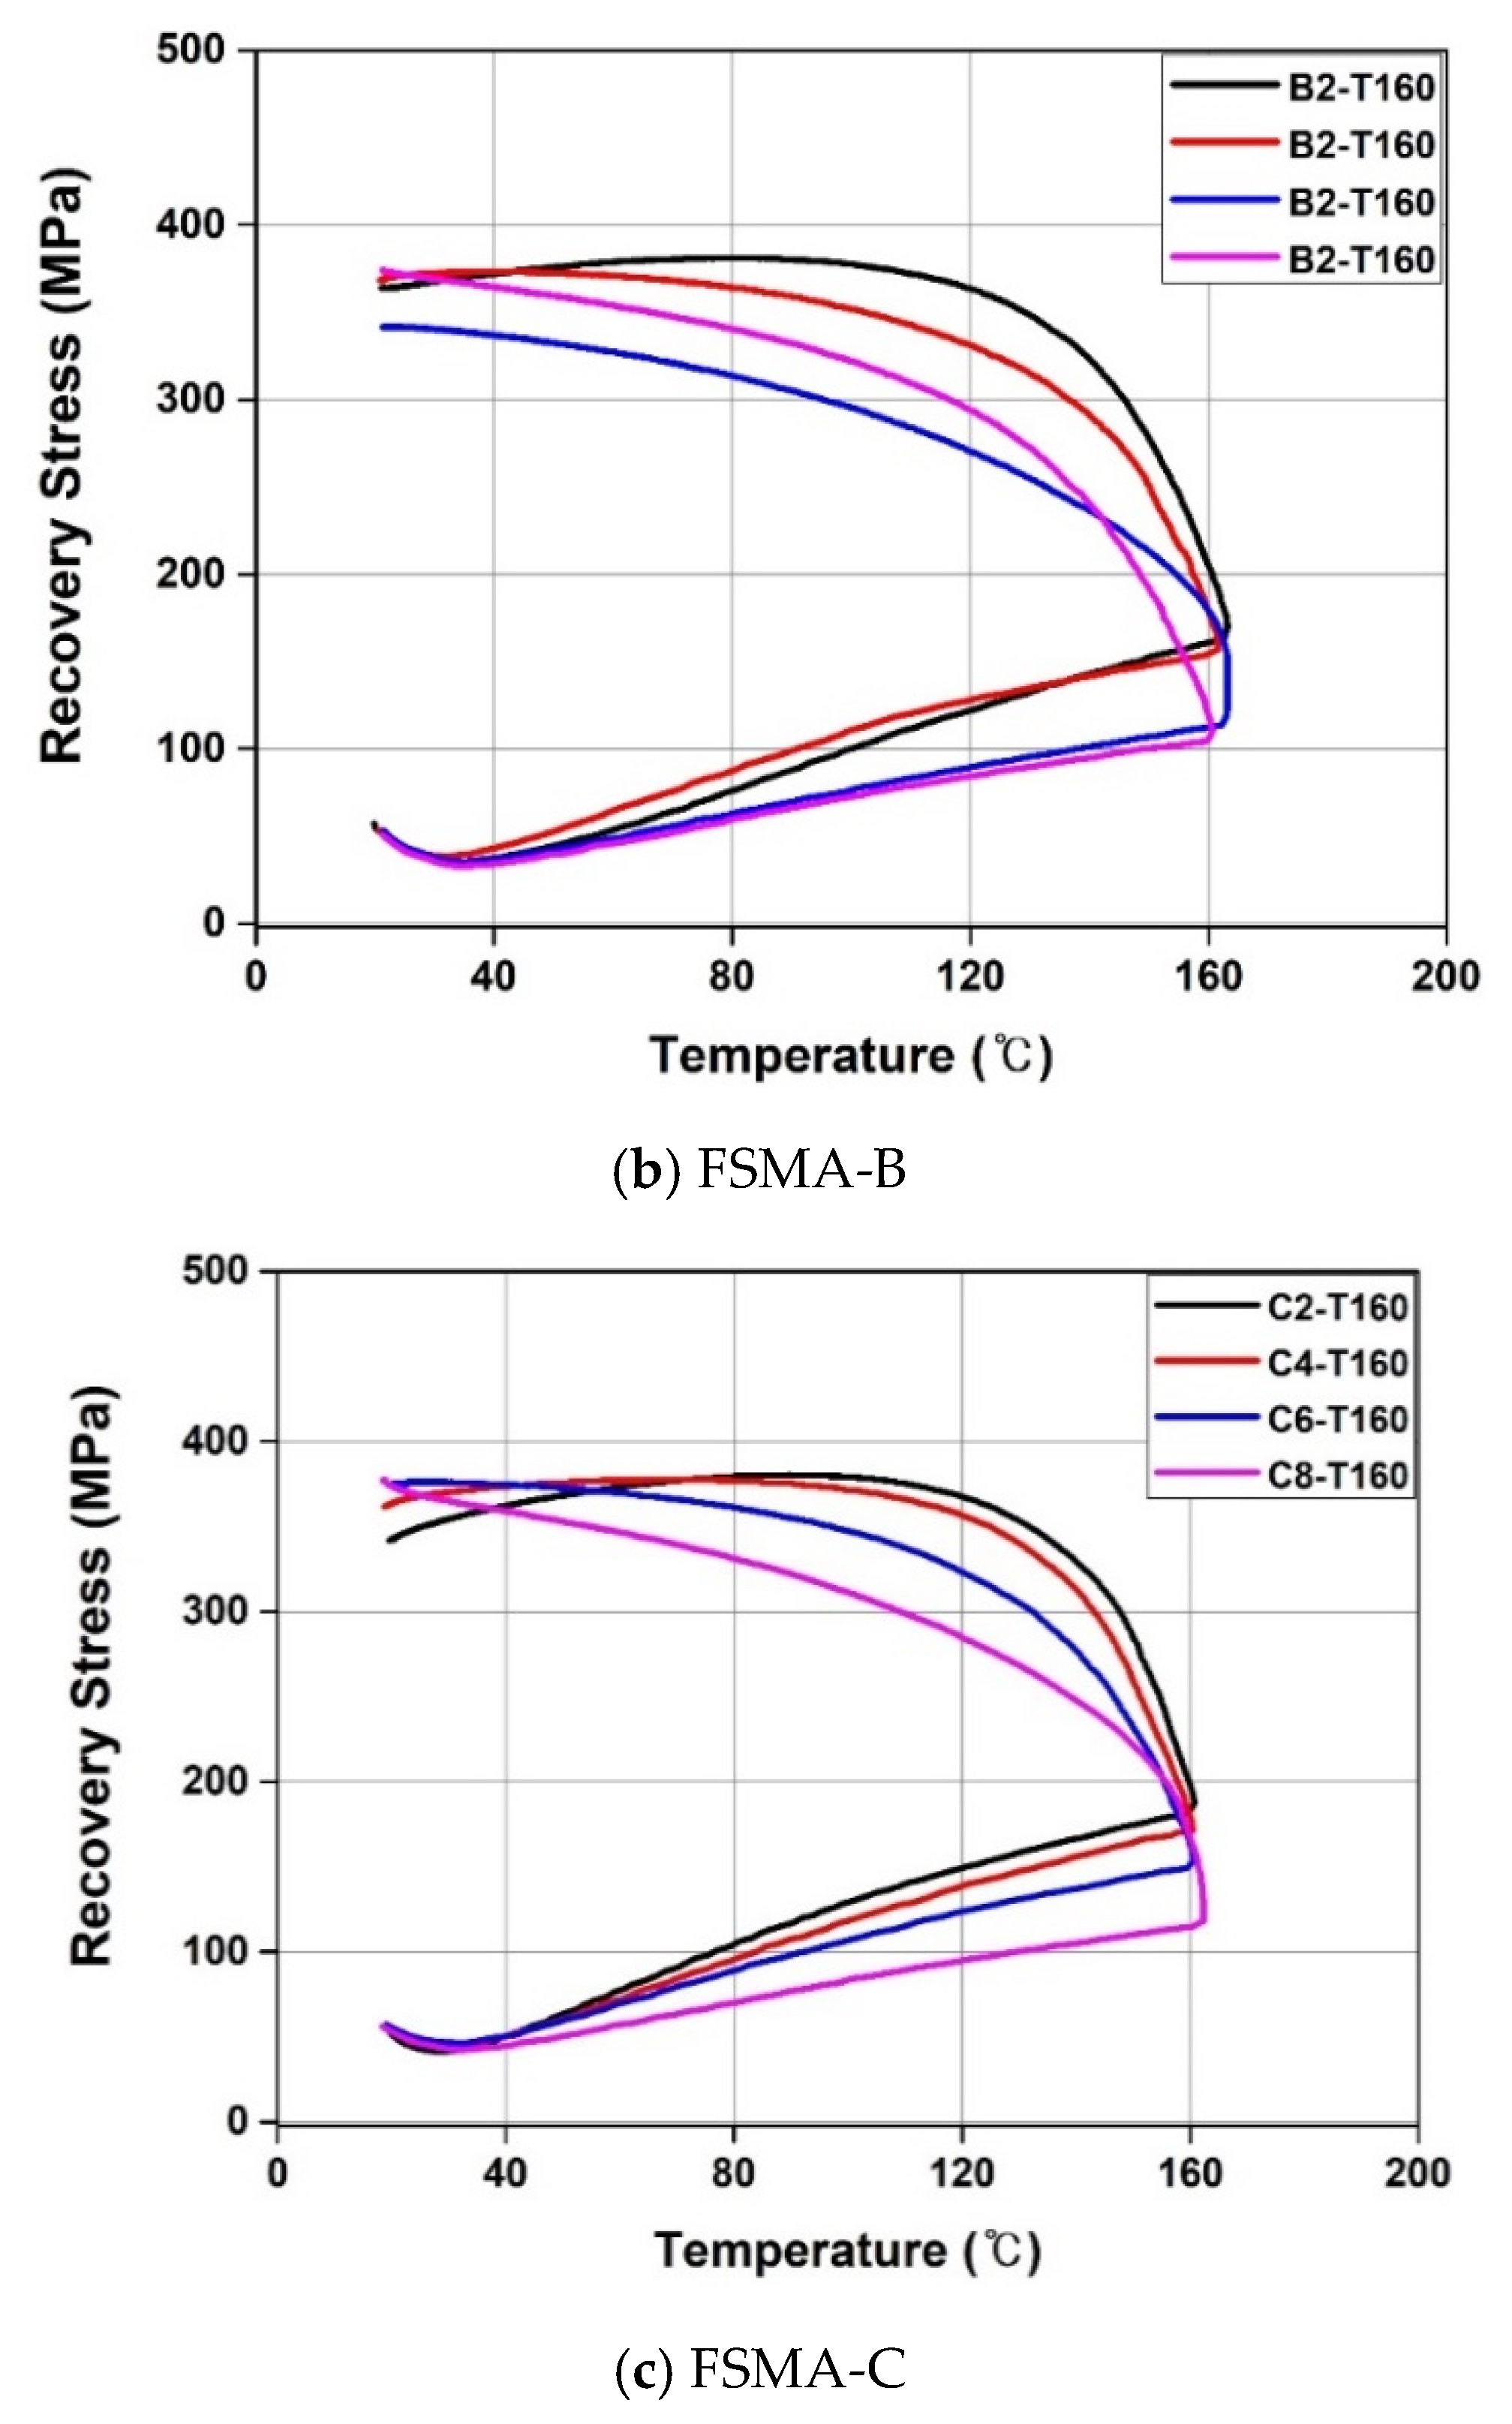
4.3.1. Effect of Pre-Straining

The temperature-stress relations that rely on the alloy type, pre-strain and heating temperatures under rigid restraint are summarized in Table 2. Figure 7 shows the comparison of temperature-recovery stress curves by pre-strain under rigid restraint. The recovery stress at maximum temperature ( σ m , T ) for the FSMA-A specimen with 0.02 to 0.06 of pre-strain was approximately 94 MPa. While the recovery stress within the range of 0.02 to 0.06 of pre-strain was slightly increased, the recovery stress at the maximum temperature in pre-strain specimen of 0.08 decreased to 73 MPa which is 22.8% lower. The final recovery stress ( σ f ) for the FSMA-A specimen in the range of 0.02 to 0.04 of pre-strain were similar to each other. Subsequently, the recovery strain gradually grew 10 MPa in every 0.02 of the pre-strain increase. Also, the maximum recovery stress ( σ m ) and final recovery stress ( σ f ) in the range of 0.02 to 0.08 were analogous to each other and short-term relaxation was not involved.
In contrast to the FSMA-A specimen, the recovery stress at the maximum temperature ( σ m , T ) steadily decreased 10 MPa for every 0.02 of pre-strain increase. However, the maximum recovery stress ( σ m ) and final recovery stress ( σ f ) were not affected by the increase of pre-straining in the FSMA-B specimen. This is because any pre-strain over 0.02 does not affect to the recovery stress in Fe-SMA [20]. With the same pre-strain level, the final recovery stress ( σ f ) in the FSMA-B specimen was approximately 19% smaller than one in the FSMA-A specimen. This is due to the fact that the recovery stress depends on the yield strength rather than the recovery strain [2]. The maximum recovery stress ( σ m ) and final recovery stress ( σ f ) with 0.02 of pre-strain in the FSMA-B specimen are 381 MPa and 364 MPa. The short-term relaxation of the FSMA-B specimen is evaluated at 17.21 MPa. Afterward, the short-term relaxation gradually decreased as the pre-strain increased. The short-term relaxations in pre-strains of 0.06 and 0.08 are 0.4 MPa and 0.13 MPa.
In a similar manner as the FSMA-B specimen, the recovery stress at the maximum temperature ( σ m , T ) in the FSMA-C specimen decreased 11 MPa for every 0.02 of pre-strain increase. The recovery stress at the maximum temperature ( σ m , T ) in the FSMA-C was 13% higher than the one in the FSMA-B at the same pre-strain. The magnitude of the pre-strain did not affect the maximum recovery stress ( σ m ) and final recovery stress ( σ f ). The maximum recovery stress ( σ m ) and final recovery stress ( σ f ). in the FSMA-C were different by 8.2% and 0.7% from the FSMA-B and the relaxation gradually decreased according to the increase in the pre-strain value. In the case of a pre-strain of 0.08, the short-term relaxation did not develop. However, short term relaxation of the FSMA-C, which had heating treatment, developed more than 50% when compared to the one in the FSMA-B.

4.3.2. Effect of Heating Temperature

Figure 8 shows the comparison of temperature-recovery stress curves by heating temperature under rigid restraint. The maximum recovery stress ( σ m ) and final recovery stress ( σ f ) in the FSMA-A specimen increased by 64 MPa as the heating temperature rose every 40 °C. As presented in Table 2, the maximum recovery stress ( σ m ) and final recovery stress ( σ f ) in the FSMA-A specimen was the highest and short-term relaxation nearly developed.
The maximum recovery stress ( σ m ) and final recovery stress ( σ f ) in the FSMA-B specimen grew approximately 35 MPa and 24 MPa as the heating temperature rose every 40 °C. However, the maximum recovery stress ( σ m ) and final recovery stress ( σ f ) over 200 °C increased less than 3% even though the heating temperature rose by 40 °C. The short term relaxation in the FSMA-B specimen was 5 MPa at a heating temperature of 160 °C. As the heating temperature reached 200 °C or 240 °C, the short-term relaxation developed to roughly 28 MPa.
In contrast with the FSMA-B specimen, the FSMA-C specimen had additional heat treatment. The maximum recovery stress ( σ m ) and final recovery stress ( σ f ) were in a range of 120 °C to 240 °C that linearly increased by 32.33% and 45.88% as the heating temperature rose every 40 °C. The short term relaxation in the FSMA-C specimen was 0.72 MPa at a heating temperature of 120 °C. However, the short term relaxation in the range of 160 °C to 200 °C was nearly 16 MPa and developed to 46 MPa at 240 °C.
In the same pre-strain and heating temperature level, the recovery stress of the FSMA-A was greater than one of the FSMA-B and FSMA-C. Therefore, it is considered that FSMA-A is more suitable for application as a prestressing tendon that requires high recovery stress. Also, Park et al. [22] claimed that temperatures higher than 160 °C delay the formation of ettringite at the interface between the cement and fine aggregate or destroys the formation of ettringite. Therefore, when Fe-SMA is used as the prestressing tendon, the upper limit of the heating temperature is considered to be 160 °C.
The effective prestressing force ( P i ) for Fe-SMA tendon is calculated from Equations (1) to (8). As shown in Figure 9, when the recovery stress is activated by heating Fe-SMA tendon, the compressive force that generates elastic shortening acts on the concrete. At this time, the concrete compressive strain at centroid of Fe-SMA tendon is same as the amount of change in the Fe-SMA strain Δ ε s m a , and it can be expressed as Equation (1). Subsequently, Equation (1) is expressed as Equation (3) by applying Hook’s law and the ratio of elastic modulus in Equation (4).
ε e = Δ ε s m a
σ c s E c = Δ σ s m a E s m a
Δ σ s m a = n σ c s
n = E s m a E c
where ε e is concrete compressive strain at centroid of Fe-SMA, Δ ε s m a is strain reduction of Fe-SMA due to elastic shortening, σ c s is concrete compressive stress at centroid of Fe-SMA, MPa; E c is elastic modulus of concrete, MPa; Δ σ s m a is stress reduction of Fe-SMA due to elastic shortening, MPa; E s m a is elastic modulus of Fe-SMA, MPa; and n is elastic modulus ratio. At this time, concrete compressive stress at centroid of Fe-SMA can be summarized in Equation (5). The effective pre-stressing force by Fe-SMA tendon can expressed as Equation. (6). For example, the final recovery stress ( σ f ) for FSMA-A with 4% pre-strain and 160 °C heating temperature can be taken as 423 MPa. Substituting Equation (5) and Equation (6) into Equation (3) yields Equation (7):
σ c s = P i A c ( 1 + e 2 r 2 ) M d I c e
P i = A s m a ( σ f Δ σ s m a )
Δ σ s m a = 1 + n ρ ( 1 + e 2 r 2 ) σ f n M d I c e 1 + n ρ ( 1 + e 2 r 2 )
ρ = A s m a A c
where, P i is initial pre-stressing force due to recovery stress of Fe-SMA, N; A c is area of the concrete, mm 2 ; e is eccentric distance, mm ; r is radius of gyration, mm ; M d moment due to self-weight of concrete beam, N · mm ; I c is moment of inertia of the section, mm 4 ; σ f is final recovery stress, MPa; and ρ is the reinforcement ratio.

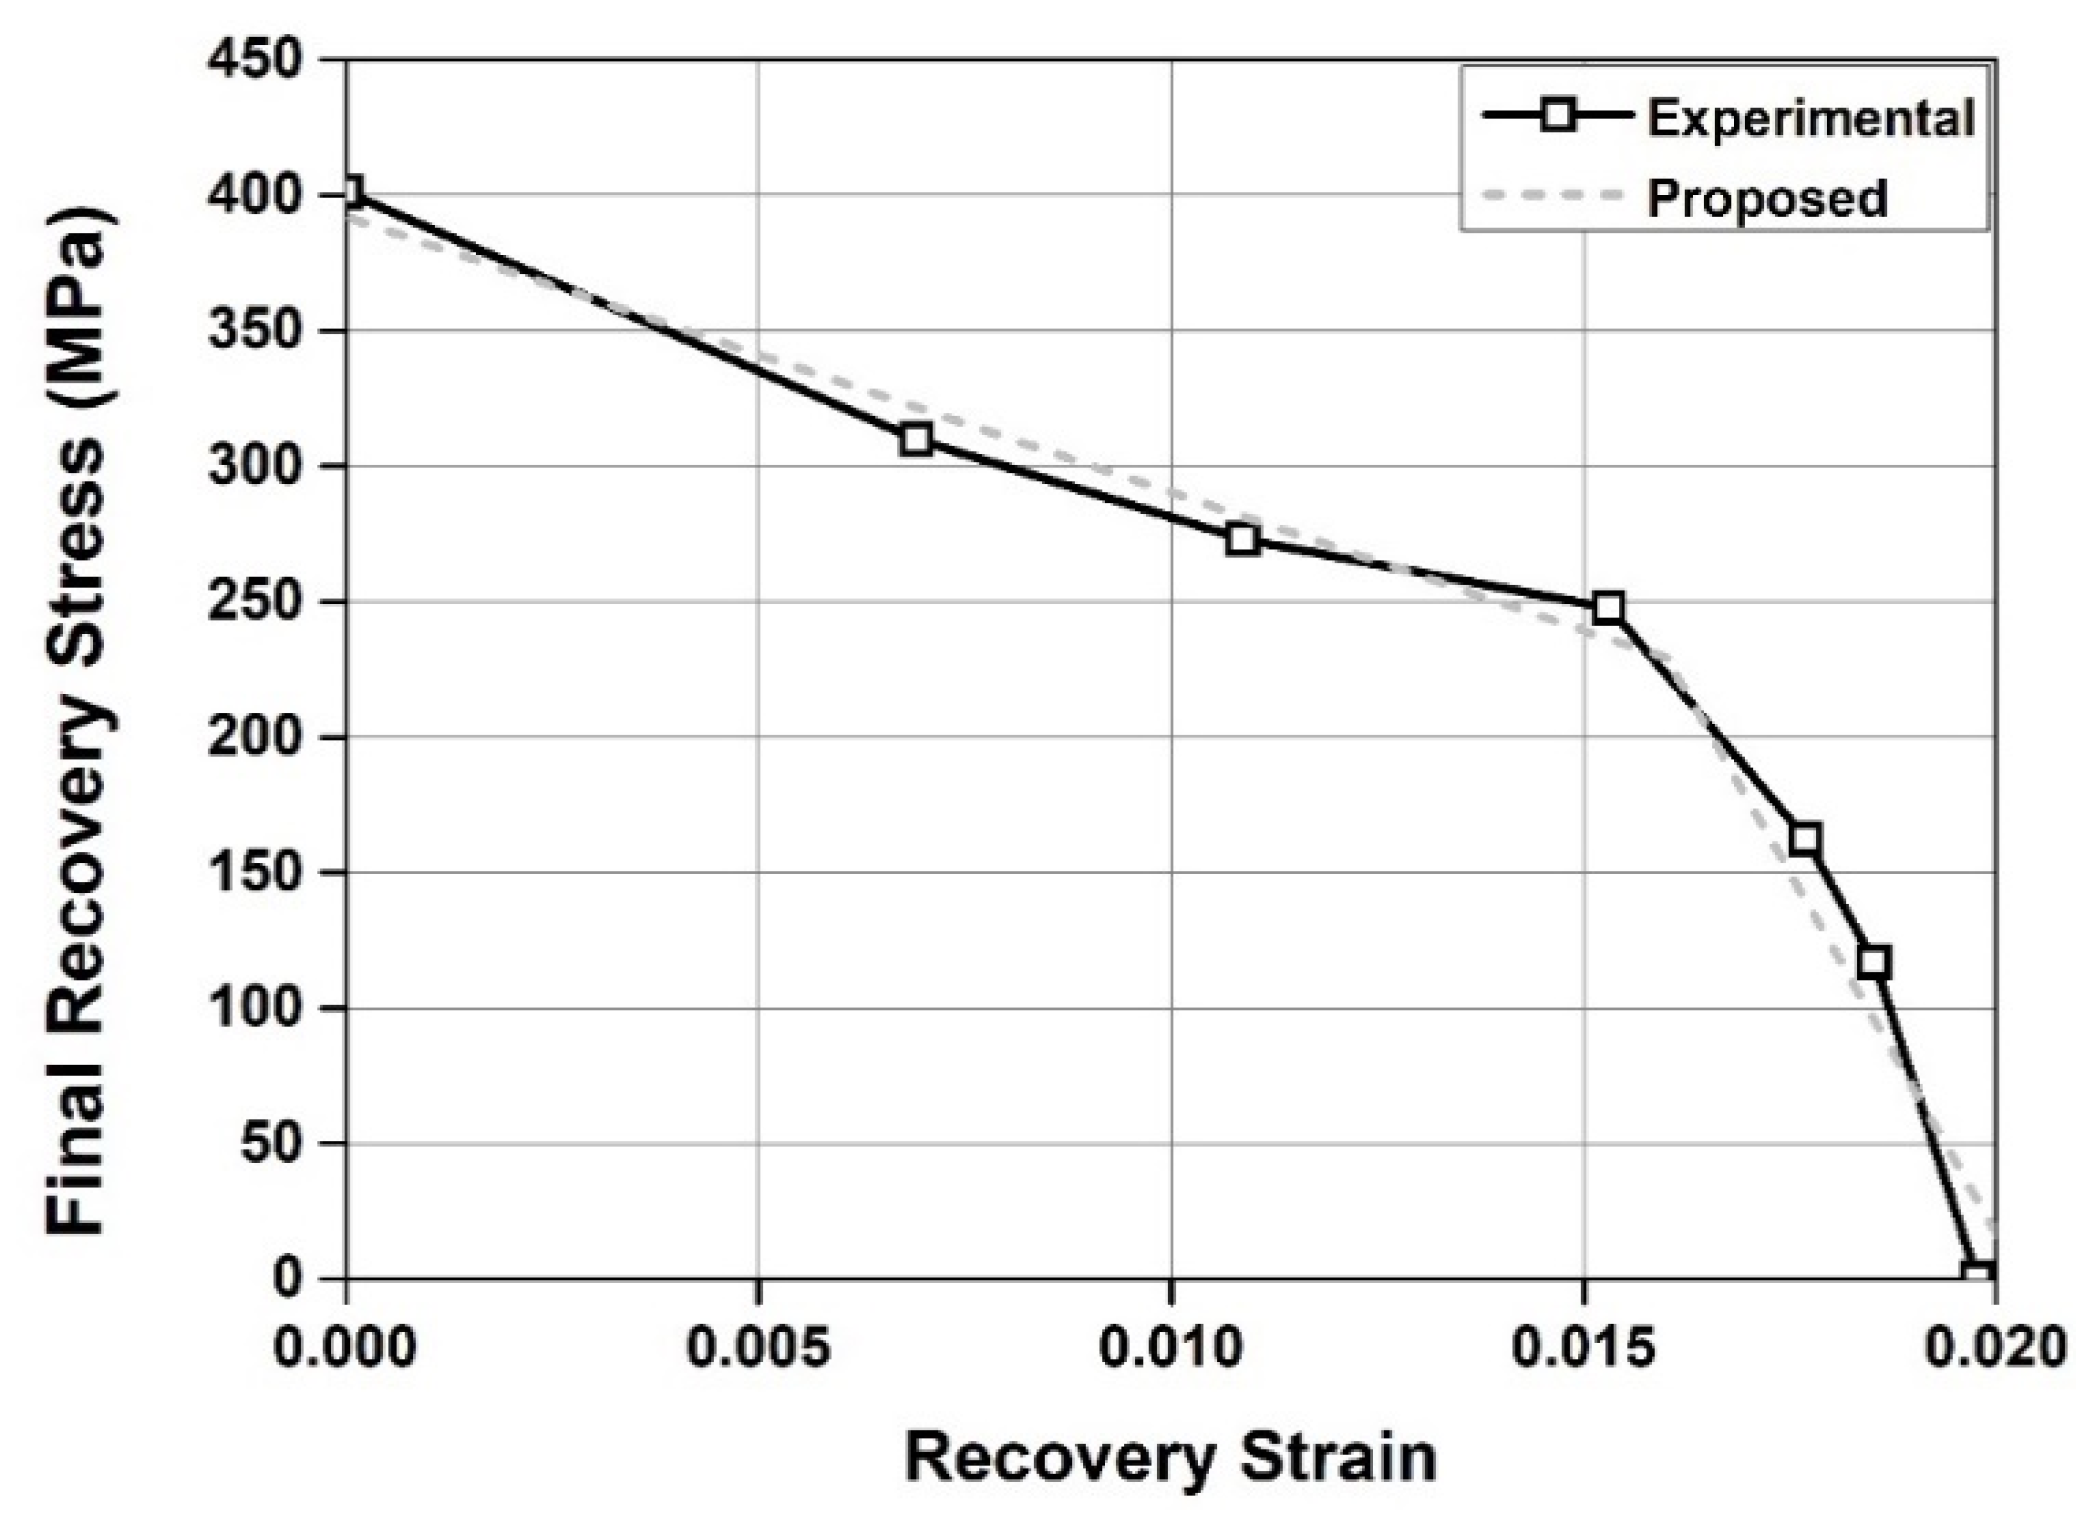
4.4. Fe-SMA Behavior under Partial Restraint

Table 3 shows the activation test results as the FSMA-A and FSMA-C specimens with 0.04 pre-strain were heated to 200 °C under different contact temperatures. The comparison of temperature-recovery stress curves under partial restraint for FSMA-A and FSMA-C are presented in Figure 10 and Figure 11. The recovery strains for the FSMA-A specimen constrained at 120 °C and 160 °C during heating were 0.00242 and 0.00401. Also, the recovery strain constrained at 200 °C was 0.00627 which is 65% of the recovery strain under free restraint. The recovery strain grew as the contact temperature mounted. In Figure 10a, when the heating temperature reached 200 °C, the stresses in the FSMA-A constrained at 120 °C and 160 °C were 101 MPa and 52 MPa. The recovery strain ( σ m , T ) decreased approximately 48.06 MPa as the contact temperature increased by 40 °C. Even though the temperature for each restraint point was set differently in the FSMA-A specimen, the short-term relaxation was small in both cases due to the steady maximum recovery stress ( σ m ) and final recovery stress ( σ f ). The final recovery stresses constrained at a heating of 120 °C and 160 °C were 396 MPa and 347 MPa. As the contact temperature increased, the final recovery stress ( σ f ) decreased by 49 MPa. In the cooling phase, the recovery strains for the FSMA-A specimen constrained at 120 °C and 160 °C were 0.00752 and 0.00818. These are nearly 78.7% and 85.6% of the total value when compared to the value under the free restraint. As presented in Figure 10b, the final recovery stresses constrained at 120 °C and 160 °C after cooling were 173 MPa and 114 MPa which are roughly 33.5% and 22.1% of the value compared to the value from the one under the rigid restraint.
In the case of the FSMA-C specimen, the recovery strains constrained at 120 °C and 160 °C during heating were 0.00692 and 0.01088. Also, the recovery strain constrained at 200 °C was 0.01531 which is 77.4% of the recovery strain under the free restraint. Like the FSMA-A specimen, the recovery strain increased when the contact temperature mounted. As shown in Figure 11a, the stresses in the specimen constrained at 120 °C and 160 °C were 105 MPa and 81 MPa when the heating temperature arrived at 200 °C. The recovery strain ( σ m , T ) decreased as the contact temperature increased. However, short-term relaxation developed in accordance with the variation in the maximum recovery stress ( σ m ) and final recovery stress ( σ f ). The maximum recovery stresses constrained at 120 °C and 160 °C in heating were 351 MPa and 325 MPa. Subsequently, the final recovery stresses became 310 MPa and 273 MPa. As the contact temperature increased, the maximum recovery stress and final recovery stress decreased. In the cooling phase, the recovery strains for the FSMA-C specimen constrained at 120 °C and 160 °C were 0.01769 and 0.01852 which are nearly 89.5% and 93.7% of the value compared to the values under free restraint. As described in Figure 11b, the maximum recovery stress and final recovery stress in the cooling phase were comparable. The recovery stress decreased in accordance with the decrease of the contact temperature and the final recovery stresses constrained at 120 °C and 160 °C were 40.5% and 29.2% from the recovery stress in the specimen under initially restraint condition.
Figure 12 presents the recovery stress-recovery strain relation when the FSMA-A and FSMA-C that have 0.04 pre-strain were heated to 200 °C. At the same contact temperature, the recovery strain in the FSMA-C specimen was greater than one in the FSMA-A specimen. Therefore, the FSMA-C type of Fe-SMA is practical to be used in pipe joining that requires a high recovery strain for work usability. The recovery strains in the FSMA-A specimen and FSMA-C specimen at a 200 °C contact temperature were developed over 50% when compared to those under the free restraint. Also, the recovery stresses in the FSMA-A and FSMA-C specimens at a 200 °C contact temperature developed over 50% compared to ones under initial restraint. Hosseini et al. [23] presented that the recovery stress of the Fe-SMA is hardly developed during cooling. Therefore, it is thought that the recovery stress and strain during cooling are dependent on the thermal contraction and that the management of the contact temperature in the heating phase encourages enhancement of the recovery stress and strain.
Equations (9) to (16) are equations for calculating the effective confining pressure acting by a pipe coupler made of FSMA-C. As shown in Figure 13, if the internal diameter of the non-expanded Fe-SMA coupler is D 0 and internal diameter of the expanded Fe-SMA coupler is D 1 , the internal circumference of expanded Fe-SMA coupler can be expressed as Equation (11).
D 1 = ( 1 + ε r e s ) D 0
l 1 = ( 1 + ε r e s ) l 0
l 1 = π D 1
where, D 0 is internal diameter of non-expanded Fe-SMA coupler, mm ; ε r e s is residual strain of Fe-SMA, D 1 is internal diameter of expanded Fe-SMA coupler, mm ; l 0 is internal circumference of non-expanded Fe-SMA coupler, mm ; and l 1 is internal circumference of expanded Fe-SMA coupler, mm . As shown in Figure 14, the initial gap between the internal diameter of the Fe-SMA coupler and the external diameter of the connected pipe can be taken as Equation (12). For example, if initial gap is 0, the internal circumference of Fe-SMA coupler is same as the external circumference of pipe. Also, the strain of internal circumference of Fe-SMA coupler is expressed by contact strain ( ε c t ) like Equation (13). Additionally, the confining strain of Fe-SMA coupler is same as Equation (14). Substituting Equations (10), (12), and (13) into Equation (14) yields Equation (15).
x = D 1 D 2 2
l 2 = ( 1 + ε c t ) l 0
ε r e c = ε r e s ε c t
ε r e c = 2 x D 0 = ( 1 + ε r e s ) ( 1 D 2 D 1 )
where, x is initial gap of Fe-SMA coupler and pipe, D 2 is external diameter of pipe, mm ; l 2 is external circumference of pipe, mm ; ε c t is contact strain, and ε r e c is recovery strain of Fe-SMA.
Thereafter, in order to calculate effective confining stress, the recovery stress- recovery strain relationship of FSMA-C on Figure 15 was assumed as bilinear like the dotted line. The dotted lines can be expressed as Equations (16) to (17).
σ e . c o n = 10179 ε r e c + 392                 f o r     ( 0 ε r e c < 0.016 )
σ e , c o n = 53013 ε r e c + 1077           f o r     ( 0.016 < ε r e c 0.02 )
where, σ e ,   r e c is effective recovery stress of Fe-SMA coupler. It was confirmed through the proposed formula and experimental results that the FSMA-C pipe coupler has the following characteristics. Namely, when FSMA-C is used for the pipe coupler, the internal diameter of coupler should not be larger than 102% of the external diameter of connected pipe. Additionally, in order to develop an effective confining stress more than 50% or more of its recovery stress, the internal diameter of FSMA-C coupler should not be larger than 101.6% of the external diameter of connected pipe.

5. Conclusions

In this study, a series of experiment were conducted to understand three types of Fe-SMAs and the conclusions are listed below:
(1)
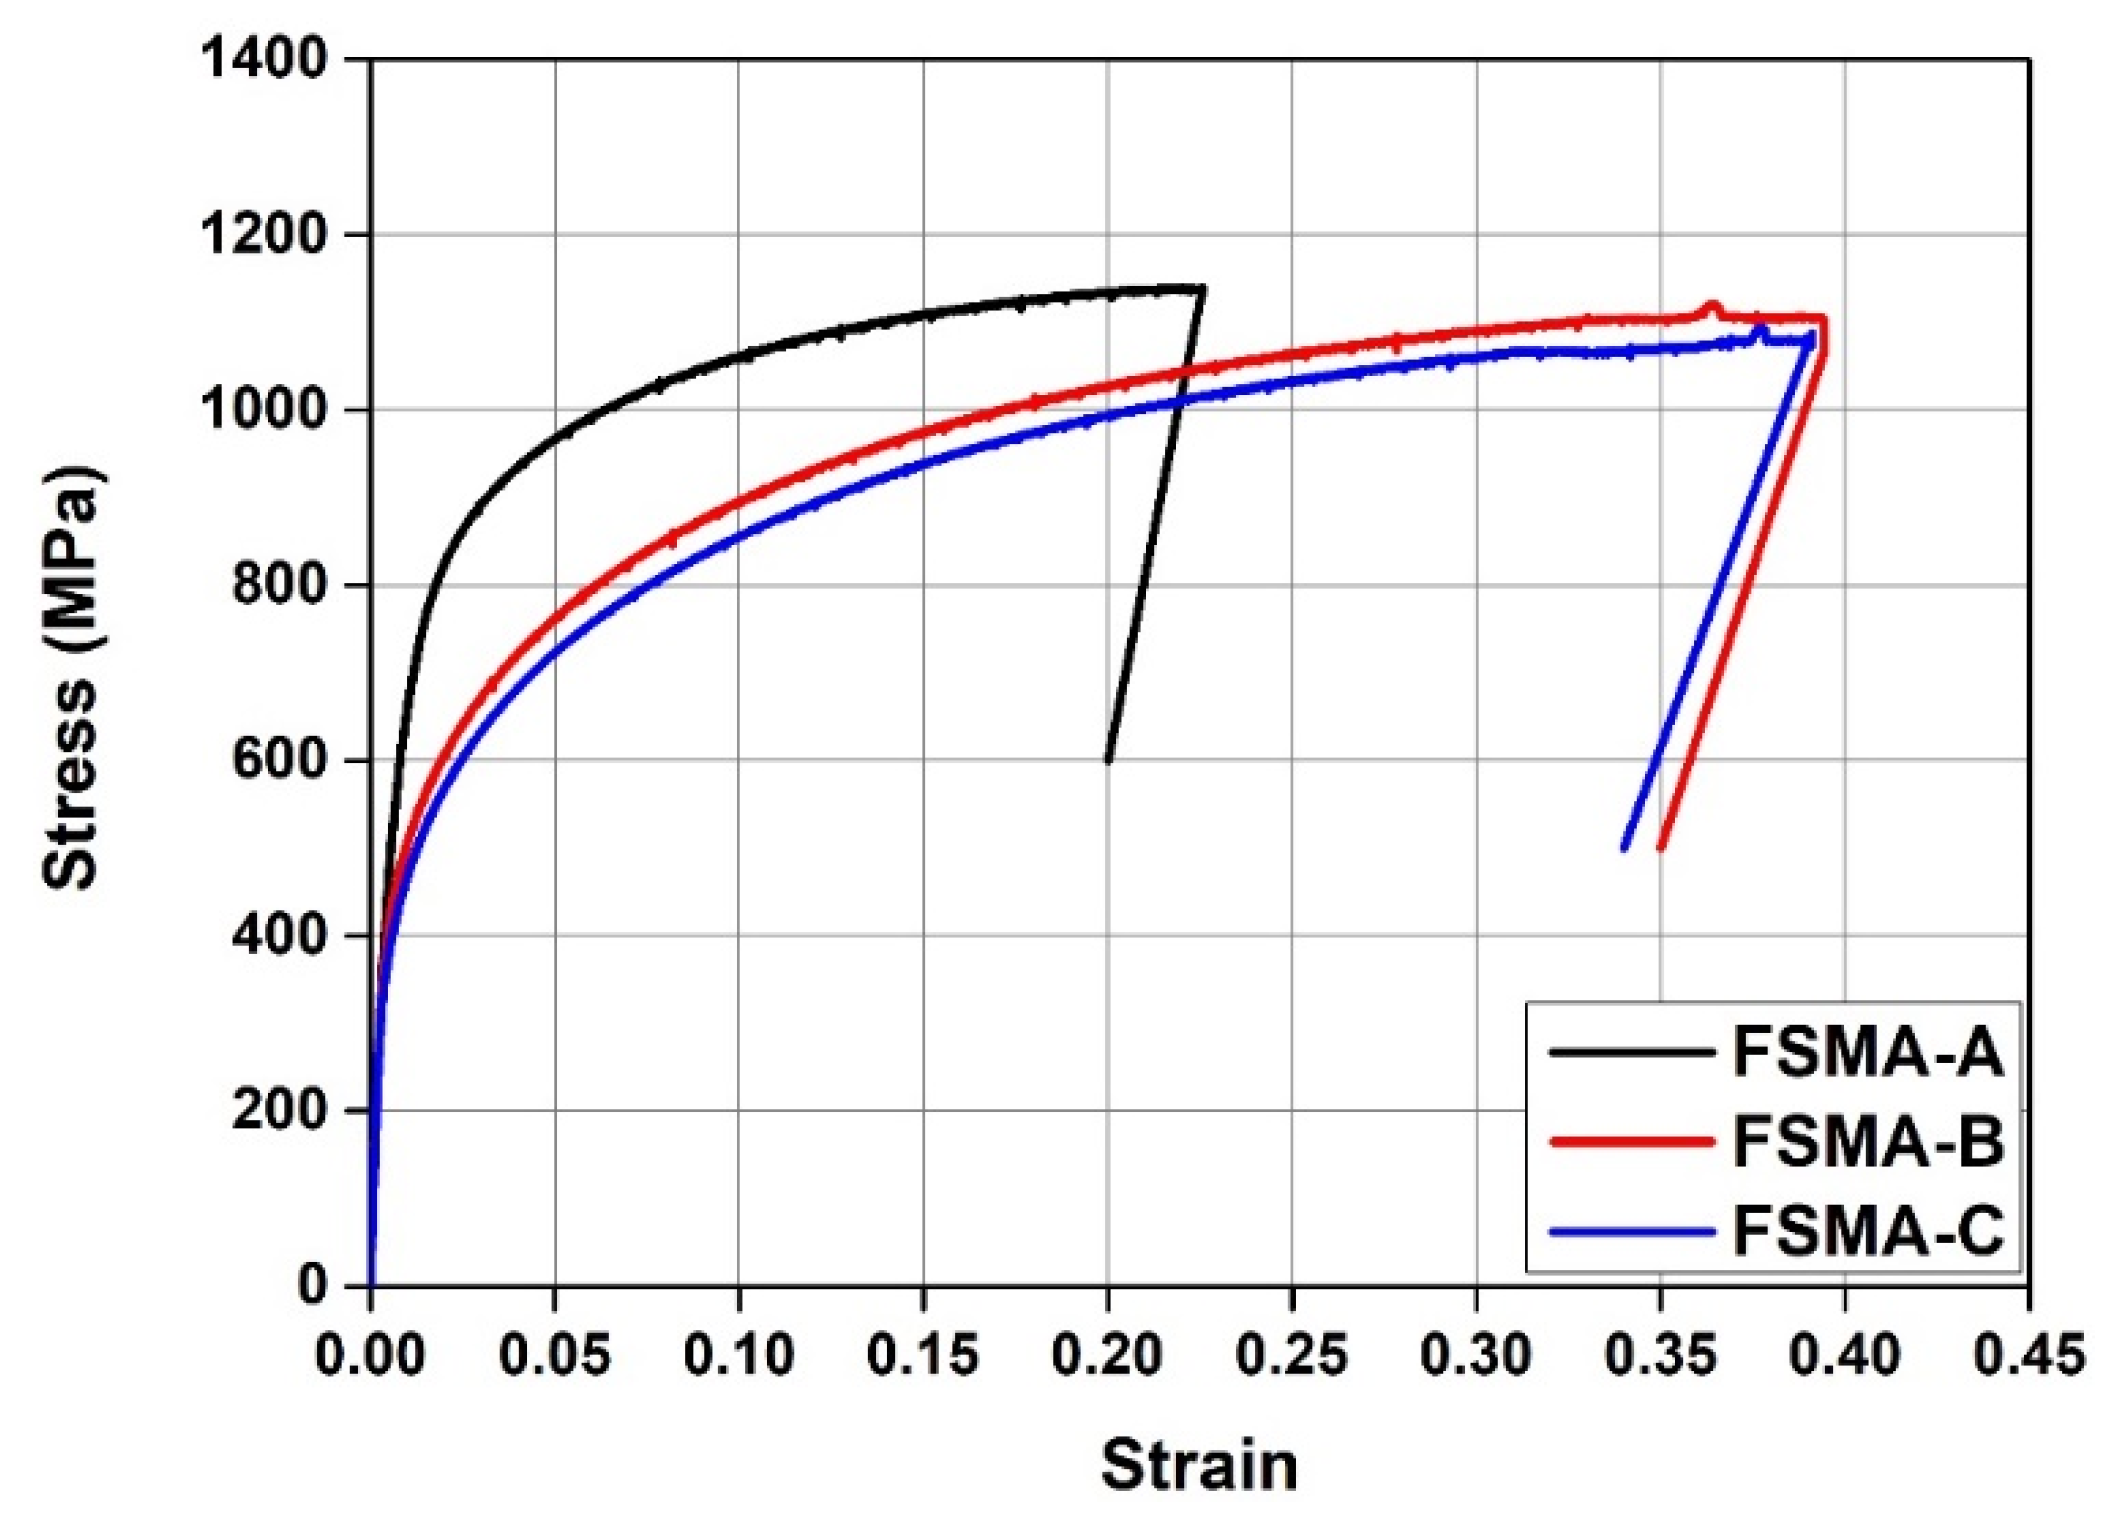
While the ultimate strain in the FSMA-A specimen was 0.2256, which is about 75% less than the strain from FSMA-B and FSMA-C specimen, the yield strength estimated used 0.2% of the offset method in FSMA-A specimen. It was 599 MPa which is nearly 34% higher than the strength from FSMA-B and FSMA-C specimen. The elastic modulus calculated from FSMA-A, FSMA-B and FSMA-C specimen varied between 123 and 126 GPa and the effect of chemical composition was insignificant to the mechanical property.
(2)
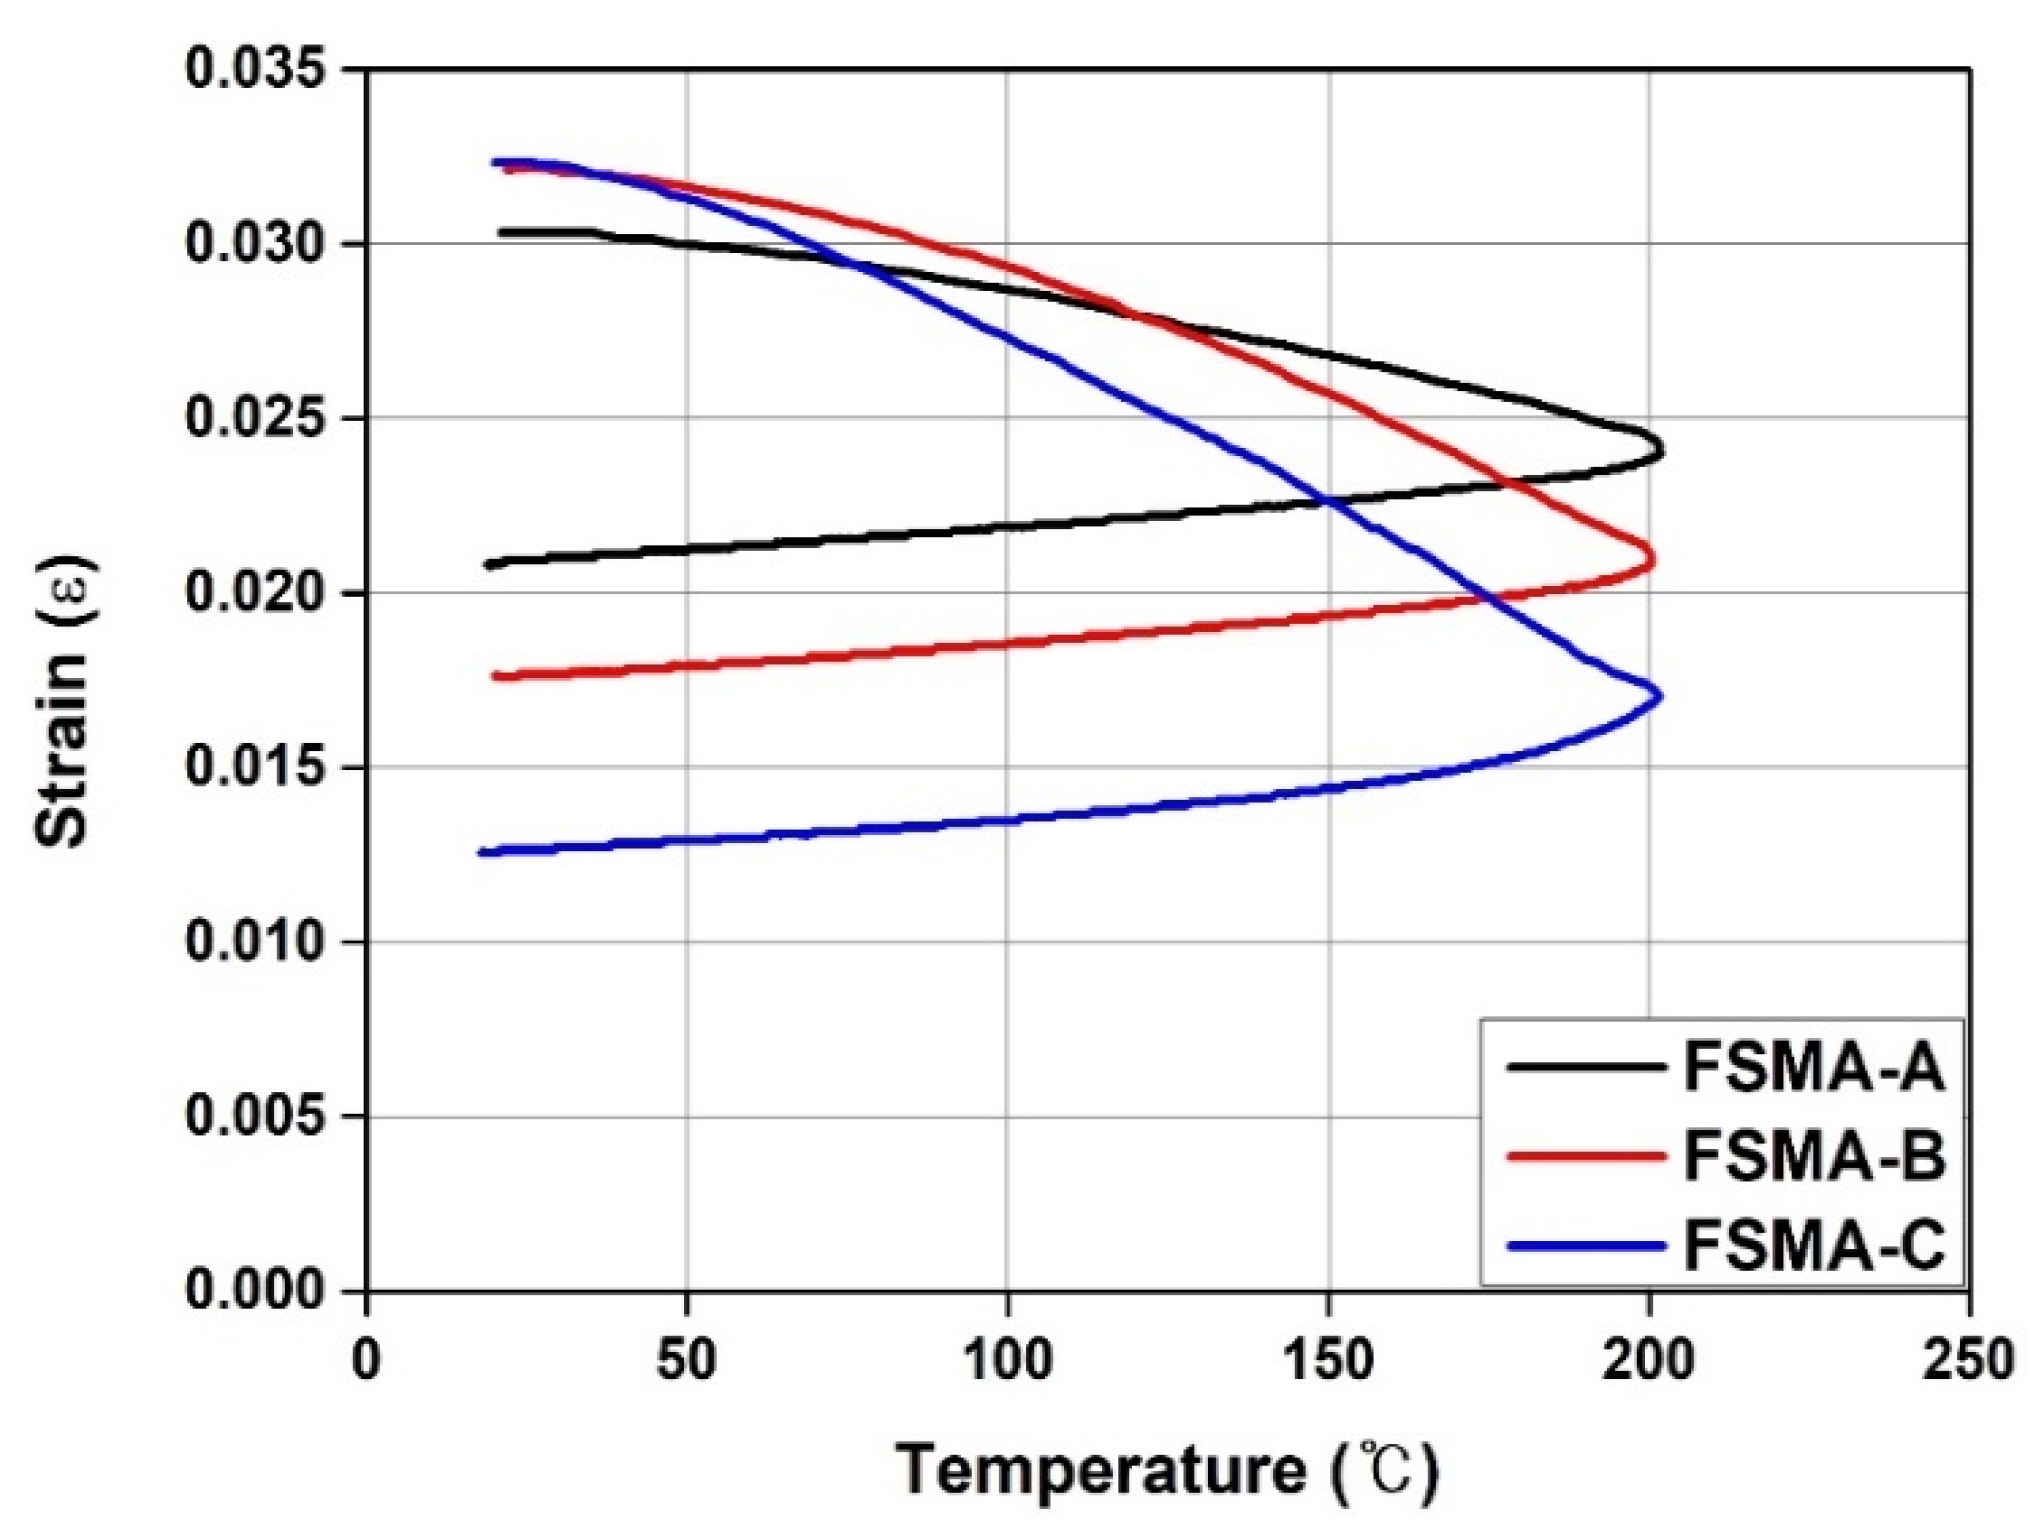
Under the free restraint, the recovery strains are 0.00956, 0.01445, and 0.01977 for FSMA-A, FSMA-B, FSMA-C specimens after activation. Although the chemical composition in the FSMA-B and FSMA-C specimens are the same, the recovery strain differed by more than 37%. Accordingly, the heat treatment is proposed to have a high recovery strain in the Fe-based SMAs.
(3)
Under the rigid restraint, the effects of pre-strain in the FSMA-A, FSMA-B and FSMA-C specimens was insignificant compared to the final recovery stress when the Fe-SMA was activated. The recovery stress increased as the heating temperature was raised. Also, the FSMA-A has the higher the recovery stress than that of FSMA-B and FSMA-C. Also, FSMA-A has the less the short-term relaxation was formed than FSMA-B and FSMA-C.
(4)
In cases where the recovery strain developed when the Fe-SMA was activated and constrained in the same condition, the recovery stress in the FSMA-A specimen was greater than the one from the FSMA-C specimen. Thus, the FSMA-A type is suitable to be applied to a component, such as pre-stressing tendons, which requires a high recovery stress over a FSMA-C type.
(5)
In the case that the recovery strain developed when the Fe-SMA was activated and constrained in the same restraint condition, the recovery strain in the FSMA-C specimen was greater than the one from the FSMA-A specimen. Therefore, the FSMA-C type is applicable for use in pipe joining that encourages the component to have a high recovery strain.
(6)
The recovery stress in the FSMA-A and FSMA-C specimen constrained during cooling was 50% lower than those from the rigid restraint. Hence, constraining the deformation before the heating temperature is favorable in order to develop a high recovery stress.
(7)
When FSMA-C is used for the pipe coupler, the internal diameter of coupler should not be larger than 102% of the external diameter of connected pipe. Additionally, in order to develop an effective confining stress more than 50% or more of its recovery stress, the internal diameter of FSMA-C coupler should not be larger than 101.6% of the external diameter of connected pipe.

Author Contributions

K.-N.H. and Y.-M.Y. conceptualized the study; Y.-M.Y. obtained field data; Y.-M.Y. and W.-B.S. implemented data processing under the supervision of K.-N.H.; the original draft of the manuscript was written by K.-N.H. and Y.-M.Y. with editorial contributions from W.-B.S. and D.-H.K. All authors have read and agreed to the published version of the manuscript.

Funding

This research was funded by the Korea Agency for Infrastructure Technology Advancement (KAIA) grant funded by the Ministry of Land, Infrastructure and Transport, Republic of Korea grant number 20CTAP-C151899-01.

Acknowledgments

This research was supported by a grant (20CTAP-C151899-02) from Technology Advancement Research Program (TARP) funded by Ministry of Land, Infrastructure and Transport of Korean government

Conflicts of Interest

The authors declare no conflict of interest.

References

  1. Lee, W.J.; Weber, B.; Leinenbach, C. Recovery stress formation in a restrained Fe–Mn–Si-based shape memory alloy used for prestressing or mechanical joining. Constr. Build. Mater. 2015, 95, 600–610. [Google Scholar] [CrossRef]
  2. Leinenbach, C.; Kramer, H.; Bernhard, C.; Eifler, D. Thermo-mechanical properties of an Fe-Mn-Si-Cr-Ni-VC shape memory alloy with low transformation temperature. Adv. Eng. Mater. 2012, 14, 62–67. [Google Scholar] [CrossRef]
  3. Kim, H. Pullout Behavior of Shape Memory Alloy Fiber Embedded in Mortar Matrices. Mater’s Thesis, Sejong University, Seoul, Korea, 2015. [Google Scholar]
  4. Hartl, D.J.; Mabe, J.H.; Benafan, O.; Coda, A.; Padan, R.; Van Doren, B. Standardization of shape memory alloy test methods toward certification of aerospace applications. Smart Mater. Struct. 2015, 24, 082001. [Google Scholar] [CrossRef] [Green Version]
  5. Park, N.J.; Park, S.B.; Cheong, C.C. Vibration and position tracking control of a smart structure using SMA actuators. J. Korean Soc. Precis. Eng. 1996, 13, 155–163. [Google Scholar]
  6. Janke, L.; Czaderski, C.; Motavalli, M.; Ruth, J. Applications of shape memory alloys in civil engineering structures—Overview, limits and new ideas. Mater. Struct. 2005, 38, 578–592. [Google Scholar]
  7. Czaderski, C.; Shahverdi, M.; Bronnimann, R.; Leinenbach, C.; Motavalli, M. Feasibility of iron-based shape memory alloy strips for prestressed strengthening of concrete structures. Constr. Build. Mater. 2014, 56, 94–105. [Google Scholar] [CrossRef]
  8. Sato, A.; Chishima, E.; Soma, K.; Mori, T. Shape memory effect in γ⇄ ϵ transformation in Fe-30Mn-1Si alloy single crystals. Acta Metall. 1982, 30, 1177–1183. [Google Scholar] [CrossRef]
  9. Kajiwara, S.; Liu, D.; Kikuchi, T.; Shinya, N. Remarkable improvement of shape memory effect in Fe-Mn-Si based shape memory alloys by producing NbC precipitates. Scr. Mater. 2001, 44, 2809–2814. [Google Scholar] [CrossRef]
  10. Shahverdi, M.; Czaderski, C.; Motavalli, M. Iron-based shape memory alloys for prestressed near-surface mounted strengthening of reinforced concrete beams. Constr. Build. Mater. 2016, 112, 28–38. [Google Scholar] [CrossRef]
  11. Maruyama, T.; Kurita, T.; Kozaki, S.; Andou, K.; Farjami, S.; Kubo, H. Innovation in producing crane rail fishplate using Fe–Mn–Si–Cr based shape memory alloy. Mater. Sci. Technol. 2008, 24, 908–912. [Google Scholar] [CrossRef]
  12. Michels, J.; Shahverdi, M.; Czaderski, C.; El-Hacha, R. Mechanical Performance of Iron-Based Shape-Memory Alloy Ribbed Bars for Concrete Prestressing. ACI Mater. J. 2018, 115, 877–886. [Google Scholar]
  13. Rojob, H.; El-Hacha, R. Self-prestressing using iron-based shape memory alloy for flexural strengthening of reinforced concrete beams. ACI Struct. J. 2015, 114, 523–532. [Google Scholar]
  14. Hong, K.; Lee, S.; Han, S.; Yeon, Y. Evaluation of Fe-Based Shape Memory Alloy (Fe-SMA) as Strengthening Material for Reinforced Concrete Structures. Appl. Sci. 2018, 8, 730. [Google Scholar] [CrossRef] [Green Version]
  15. ASTM A370-19e1. Standard Test Methods and Definitions for Mechanical Testing of Steel Products; ASTM International: West Conshohocken, PA, USA, 2019. [Google Scholar]
  16. Jee, K.K.; Han, J.H.; Jung, W.S.; Jang, W.Y. Suggestion of Pipe Coupling Method for Maximum and Uniform Joining Stress. Mater. Trans. 2006, 47, 750–752. [Google Scholar] [CrossRef] [Green Version]
  17. Kim, Y.S.; Choi, E.; Kim, W.J. Characterization of the microstructures and the shape memory properties of the Fe-Mn-Si-Cr-Ni-C shape memory alloy after severe plastic deformation by differential speed rolling and subsequent annealing. Mater. Charact. 2017, 136, 12–19. [Google Scholar] [CrossRef]
  18. Han, Y.; Shi, J.; Xu, L.; Cao, W.; Dong, H. TiC precipitation induced effect on microstructure and mechanical properties in low carbon medium manganese steel. Mater. Sci. Eng. A 2011, 530, 643–651. [Google Scholar] [CrossRef]
  19. Wang, G.; Peng, H.; Sun, P.; Wang, S.; Wen, Y. Effect of titanium addition on shape memory effect and recovery stress of training-free cast Fe–Mn–Si–Cr–Ni shape memory alloys. Mater. Sci. Eng. A 2016, 657, 339–346. [Google Scholar] [CrossRef]
  20. Shahverdi, M.; Michels, J.; Czaderski, C.; Motavalli, M. Iron-based shape memory alloy strips for strengthening RC members: Material behavior and characterization. Constr. Build. Mater. 2018, 173, 586–599. [Google Scholar] [CrossRef]
  21. Wen, Y.H.; Yan, M.; Li, N. Effects of carbon addition and aging on the shape memory effect of Fe–Mn–Si–Cr–Ni alloys. Scr. Mater. 2004, 50, 441–444. [Google Scholar] [CrossRef]
  22. Park, S.J.; Yim, H.J.; Kwak, H.G. Evaluation of microcracks in thermal damaged concrete using nonlinear ultrasonic modulation technique. J. Korea Concr. Inst. 2012, 24, 651–658. [Google Scholar] [CrossRef] [Green Version]
  23. Hosseini, E.; Ghafoori, E.; Leinenbach, C.; Motavalli, M.; Holdsworth, R. Stress recovery and cyclic behavior of an Fe–Mn–Si shape memory alloy after multiple thermal activation. Smart Mater. Struct. 2018, 27, 025009. [Google Scholar] [CrossRef] [Green Version]
Figure 1. Test setup for direct tensile test.
Applsci 10 03441 g001
Figure 2. Test setup for activation test.
Applsci 10 03441 g002
Figure 3. Schematics of pipe joining process by SMA.
Applsci 10 03441 g003
Figure 4. Description of partial restraint;(a) Stress-strain relationship, (b) Strain-temperature relationship
Applsci 10 03441 g004
Figure 5. Comparison of stress-strain curves by direct tensile test.
Applsci 10 03441 g005
Figure 6. Comparison of temperature-recovery strain curves under free restraint.
Applsci 10 03441 g006
Figure 7. Comparison of temperature-recovery stress curves by pre-strain under rigid restraint.
Applsci 10 03441 g007aApplsci 10 03441 g007b
Figure 8. Comparison of temperature-recovery stress curves by heating temperature under rigid restraint.
Applsci 10 03441 g008aApplsci 10 03441 g008b
Figure 9. Elastic shortening due to recovery stress of Fe-SMA.
Applsci 10 03441 g009
Figure 10. Comparison of FSMA-A’s temperature-recovery stress curves under partial restraint; (a) Heating; (b) Cooling
Applsci 10 03441 g010
Figure 11. Comparison of FSMA-C’s temperature-recovery stress curves under partial restraint; (a) Heating, (b) Cooling
Applsci 10 03441 g011
Figure 12. Recovery strain- stress relationship of FSMA-A and FSMA-C.
Applsci 10 03441 g012
Figure 13. Expanded Fe-SMA coupler for pre-straining.
Applsci 10 03441 g013
Figure 14. Pipe joining process by Fe-SMA coupler.
Applsci 10 03441 g014
Figure 15. Pipe joining process by Fe-SMA coupler.
Applsci 10 03441 g015
Table 1. Chemical composition of Fe-SMA.
Type of SMAChemical Composition (Weight %)Heat Treatment
FSMA-AFe-17Mn-5Si-5Cr-0.3C-1TNon-heat treated
FSMA-BFe-17Mn-5Si-5Cr-4Ni-0.1CNon-heat treated
FSMA-CHeat treated
Table 2. Details of variable and summary of activation test result under rigid restraint.
SpecimenType of SMAPre-StrainHeating Temperature (°C) Stress   at   Maximum   Temperature ,   σ m , T   ( MPa ) Maximum   Recovery   Stress ,   σ m     ( MPa ) Final   Recovery   Stress   σ f   ( MPa )
A2-T160FSMA-A0.0216093424424
A4-T1200.0412090372372
A4-T1600.0416097424424
A4-T2000.04200136519518
A4-T2400.04240139559555
A6-T1600.0616096434433
A8-T1600.0816073445445
B2-T160FSMA-B0.02160170381364
B4-T1200.04120132327327
B4-T1600.04160157373368
B4-T2000.04200180418391
B4-T2400.04240189431401
B6-T1600.06160124342341
B8-T1600.08160110374374
C2-T160FSMA-C0.02160188380342
C4-T1200.04120154322321
C4-T1600.04160171377362
C4-T2000.04200189416401
C4-T2400.04240213462416
C6-T1600.06160153376375
C8-T1600.08160118377377
Table 3. Details of variable and summary of activation test result under partial restraint.
SpecimenType of SMAConstraint Temperature
(°C)
Strain at Constraint PointRecovery Strain at Constraint Point Maximum   Recovery   Stress ,   σ m     ( MPa ) Final   Recovery   Stress   σ f   ( MPa )
A-120HFSMA-A120(Heat)0.027910.00242399396.01
A-160H160(Heat)0.026320.00401347347
A-200H200(Heat)0.024060.00627302298
A-160C160(Cool)0.022810.00752173173
A-120C120(Cool)0.022150.00818114114
C-120HFSMA-C120(Heat)0.025430.00692351310
C-160H160(Heat)0.021470.01088325273
C-200H200(Heat)0.017030.01531267248
C-160C160(Cool)0.014650.01769168163
C-120C120(Cool)0.013820.01852118117
Table 4. Summary of direct tensile test result.
Type of SMAYield StrainYield Stress
(MPa)
Ultimate StrainUltimate Stress (MPa)Elastic Modulus (GPa)
FSMA-A0.006665990.225561140125
FSMA-B0.004963800.393691105126
FSMA-C0.005304100.395101080123
Table 5. Summary of activation test result under free restrains.
Type of SMAResidual StrainStrain at 200 °CStrain after ActivationRecovery Strain
FSMA-A0.030330.024060.020770.00956
FSMA-B0.032140.021030.017690.01445
FSMA-C0.032340.017030.012570.01977

