Article

An Automated Data Acquisition System for Pinch Grip Assessment Based on Fugl Meyer Protocol: A Feasibility Study

1
Department of Electrical and Electronic Engineering, Faculty of Engineering, Universiti Putra Malaysia, Serdang 43400, Selangor, Malaysia
2
Laboratory of Computational Statistics and Operations Research, Institute for Mathematical Research, Universiti Putra Malaysia, Serdang 43400, Selangor, Malaysia
3
Department of Mechanical and Manufacturing Engineering, Faculty of Engineering, Universiti Putra Malaysia, Serdang 43400, Selangor, Malaysia
*
Authors to whom correspondence should be addressed.
Appl. Sci. 2020, 10(10), 3436; https://doi.org/10.3390/app10103436
Submission received: 27 February 2020 / Revised: 25 March 2020 / Accepted: 28 March 2020 / Published: 15 May 2020
(This article belongs to the Special Issue Human Health Engineering Volume II)

Abstract

:

Featured Application

This work was conducted to develop an automated data acquisition system to monitor the pinch grip in rehabilitation and assessment applications after a stroke.

Abstract

The Upper Extremity Fugl Meyer Assessment (UE-FMA) is the most comprehensive assessment for pinch impairment after stroke. The pinch test of UE-FMA is manually performed by pulling a pincer object away from the patient’s fingers while providing a visual observation that results in a subjective assessment. In this study, an automated data acquisition system that consists of a linear electric actuator applying automatic pulling to the customized pincer object held by the volunteer was developed. The pinch force was measured such that a strain gauge was placed on the pincer object while pulling force was measured using pulling force load cell connected in between the linear electric actuator and customized pincer object. The pincer object’s slip onset was detected using a displacement slip sensor. The mean pinch and pulling force values at the slip onset were 12.17 and 6.25 N for right hands, while mean pinch and pulling force values were 11.67 and 5.92 N for left hands of 50 healthy volunteers, respectively. Based on the paired t-test, there is no significant difference between right and left hands. The automated data acquisition system can objectively apply a pulling force, detect the slip onset, and measure the pinch and pulling forces.

1. Introduction

Globally, stroke is the first leading cause of long-term disability [1]. Many daily activities, for example, pinching an object, require dynamic manipulation of the thumb and index finger. Pinch impairment is defined as the inability of the thumb and index finger to produce strength with sufficient magnitude and directional control, leading to object slipping [2]. Several studies showed that the recovery of pinch grip takes a longer time than handgrip, and it requires long-term rehabilitation after stroke [3]. Besides, a recent study conducted by Katab et al. [4] showed that pinch strength can be used as an alternative assessment to hand strength for assessing muscle strength in patients. Thus, an effective evaluation of pinch grip is needed to determine the pinch deficits accurately and objectively [5]. Accurate and objective pinch assessment can be achieved via automation of traditional standard assessment systems based on available technology. Current technology involves pinch gauge and dynamometers to measure the maximum static pinch force which is not related to object manipulation involved in daily activities [6]. Therapists are still using the standard manual assessments to evaluate the pinch grip, which is subjective due to the different human interpretations of the procedures as well as the use of qualitative ordinal scoring. There is no single gold standard pinch assessment used in clinical and research practices [7]. Pinch evaluation is usually listed as part of upper limb standard assessments [8,9,10,11]. The UE-FMA is arguably the most comprehensive clinical tool for measuring pinch impairment after stroke [12,13]. The UE-FMA provides step-by-step procedures and protocols, which are performed by a UE-FMA therapist. The therapist tests the patient’s ability to pinch a pincer object (in which a pencil or pen is customarily used) and exert enough force to stabilize the pincer object against gentle pull generated manually by the therapist, as in Figure 1 [14]. A score of 0, 1, or 2 is assigned, which represents severe impairment, partial impairment, and no impairment rating, respectively. Score 0 is given when the patient cannot execute the pinching at all. Score 1 indicates that the pincer object is not held firmly against the gentle pull such that slippage occurs, while score 2 is given when the pincer object is held firmly without slippage against a gentle pull.
The motivation of carrying out this study stemmed from the lack of studies related to a complete automated assessment of pinch impairment. In addition, the pinch assessment using UE-FMA is subjective due to the different interpretations of using the original guideline of UE-FMA [15]. These difference in interpretations may result in the following variations in clinical practice:
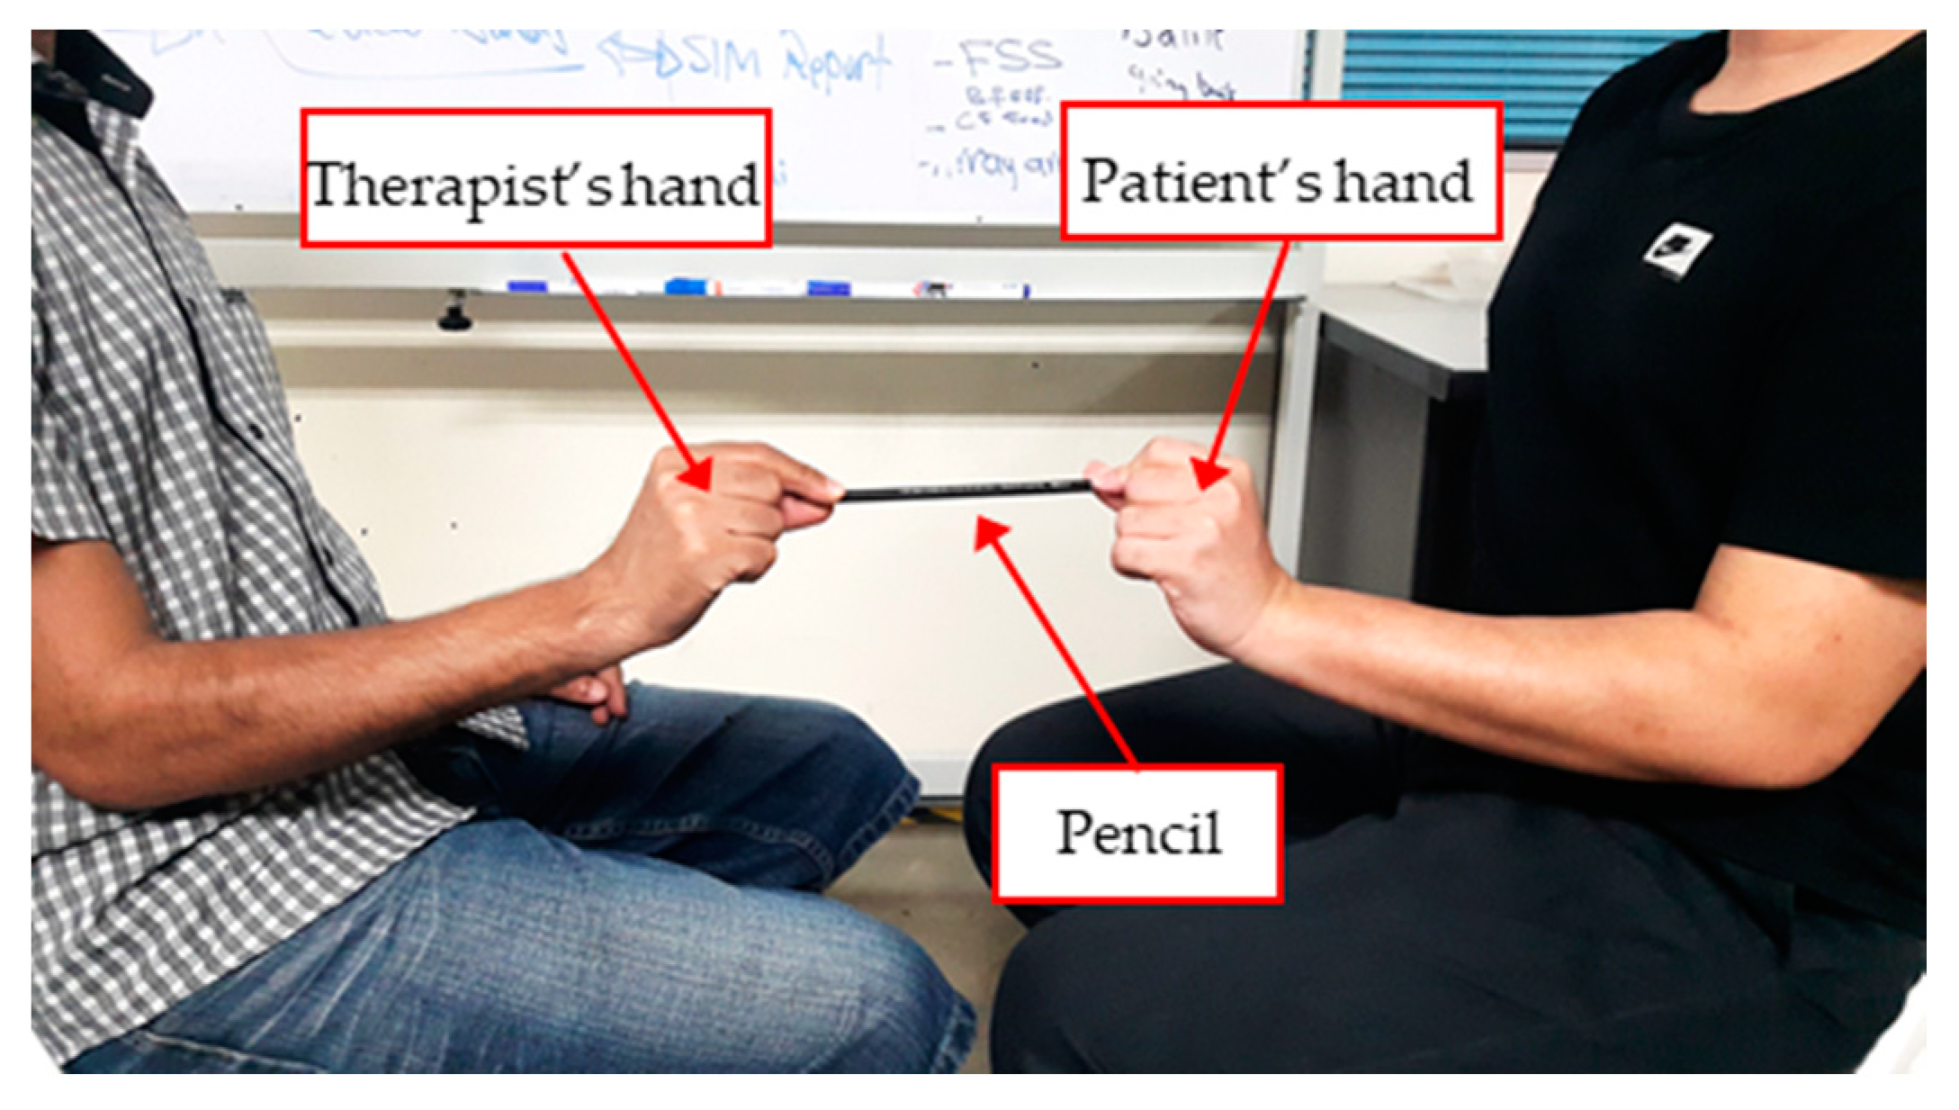
  • The orientation of the pincer object is not standardized. Some therapists pull the object horizontally, while others pull it vertically.
  • The posture of the patients’ shoulder, elbow, forearm, and hand may differ between each clinic resulting in different pinch force exerted at different postures.
  • The amount of pulling force actuated by the therapist is subjective [16]. This opens the possibility for low intra-rater and inter-rater reliability of pinch evaluation.
  • The occurrence of slippage, which results in score of either 1 or 2 is visually observed and sensitive to the therapist experience, skills, and appreciation [17,18,19,20,21,22,23].
Due to the previous drawbacks of using the original protocol of UE-FMA assessment, several studies have been conducted to improve the original UE-FMA protocol. In addressing the orientation of the pincer object, Page et al. [24] suggested that the therapist should horizontally pull the pincer object outwards away from the patient’s pinch grasp. Horizontal orientation choice is supported by other studies [25,26,27], which report that the brain response leading to pinch has higher latency responding to the pulling being applied vertically compared to horizontally. Page et al. [24] also proposed the upper limb posture and concurred with an independent study by Sullivan et al. [28]. Both studies recommend that the patient should be sitting on a chair in a 90°. Then, the patient should maintain shoulder at 0°, elbow at 90°, and forearm in resting position. The therapist, if necessary, may support the patient’s elbow at 90°. Sullivan has suggested that the therapist can use a bedside table to support the patient’s arm and elbow. The use of bedside table is supported by other studies, which reported that the arm weight leads to abnormal coupling between shoulder abduction and elbow flexion due to abnormal muscle co-activation required to compensate the weight of the arm [29]. Therefore, Ellis and colleagues used arm weight support to reduce the activation of those muscles (e.g., biceps), which otherwise would be involved in pinching [30,31].
Recently, the research community [21,32,33,34,35,36,37,38,39] have been working on automating UE-FMA, but few of them involved the pinch grip. Otten and his colleagues [40,41] implemented a glove with built-in Force Sensing Resistor (FSR) sensors as the data acquisition system to measure the patient’s pinch force during the evaluation process. Nevertheless, some post-stroke patients with severe to moderate impairment have muscle contracture and spasticity that lead to difficulties in wearing the glove. In later studies [42,43], the FSR sensor was attached to the pincer object such that the patient is no longer required to wear a glove. The pinch force threshold values that distinguish between slip (score 1) and non-slip (score 2) onsets are useful in determining the baseline measurements to evaluate the effectiveness of pinch rehabilitation for both right and left hands. In both studies, the discrimination between scores 1 and 2 was based on the ability of the subject to exert pinch force up to a threshold value. However, this threshold pinch force value was selected by the therapist which may open the possibility for uncertainty. Moreover, these studies still have not addressed the issues related to subjectivity of the manual pull and the limitations of the FSR sensors used in the data acquisition system.
Generally, FSR sensors (also known as a thin-film sensor) have been used for many applications [44] but they suffer from performance variation as well as low performance [45,46]. The variation in performance is attributed to the conductive material on the sensor layers being sensitive to temperature and deformation on the surface [47]. In addition, the variation in performance can be attributed to the inability to follow the standard calibration procedures resulting in different calibration results compared to those in the manufacturer’s datasheet. On the other hand, low performance can be attributed to variation in voltage gain, high hysteresis, nonlinearity, and inaccurate measurements in real-time pinching [48]. Likitlersuang et al. [49] investigated the performance of the thin-film sensor when attached directly to human skin. The results show a large measurement error of 23% using the standard calibration techniques. In addition, the pressure distribution on the sensing area may not be uniform during slippage due to different pinching contact location.
The main objective was to develop an automated data acquisition system for pinch assessment based on the standard UE-FMA protocol. In this study, the following research questions were addressed: (1) Does the slip onset occur at the maximum pinch force? (2) Is there any significant difference between right and left hands in pinch and pulling forces at the slip onset? In this study, the authors hypothesized that the maximum pinch force exerted by the volunteer against the automatic pulling would be located at the slip onset. The authors also hypothesized that the pinch and pulling force measurements of the right hands are significantly higher than pinch and pulling force measurements of left hands at the slip onset for right-handed volunteers.
To address the first question, an automated data acquisition system was developed. The automated system must be able to measure and acquire pinch and pulling forces as well as slip displacement accurately and automatically. The automated system uses linear electric actuator applying automatic pull, customized pinch force load cell measuring the pinch force, pulling force load cell measuring the pulling force, and Linear Variable Differential Transformer (LVDT) displacement sensor detecting the slip onset. The sensors and actuator were calibrated and then integrated together with Arduino® Due board. Subsequently, the data from 50 right-handed male volunteers within the age of 18–24 years were collected according to the UE-FMA protocol to establish the relationship between pulling and pinch forces in order to observe the slip onset. The paired t-test was performed on collected data to address the second question.

2. Materials and Methods

2.1. Pinch Data Acquisition System

The experimental setup of the data acquisition system is described in Figure 2. It consists of:
  • Displacement sensor: LVDT sensor (1) with Low Pass Filter (9).
  • Linear actuator system: including linear electric actuator (2) and servo motor driver (8).
  • Customized Pinch force load cell: pincer object (4), Wheatstone bridge (5), and an amplifier (6).
  • Pulling force load cell: load cell (3) and an amplifier (11).
  • Data acquisition card: Arduino® Due board (Arduino LLC, Torino, Italy) (11) and Arduino® IDE 1.8.5 software (arduino.cc) [50].
  • DC power supply (7).
In our previous work [51], a customized pinch force load cell based on strain gauge was designed, fabricated, and calibrated. The customized pinch force load cell is composed of three parts: pincer object, strain gauge, and signal conditioning circuit. The pincer object was fabricated to mimic a pencil, as used in UE-FMA, which represents a cylindrical object with a diameter of 12 mm and 150 mm length. In order for a strain gauge to measure the bending at the pinching location near the free edge of the pincer object, a 4 mm slot cut was created, as shown in Figure 3. The slot cut starts from the free end to the middle of the pincer object, similar to the shape of a tuning fork. The pinching location is within 20 mm from the free edge and is adequate to cover the fingertip length. A 350-ohm strain gauge (SGK-L1-D-K350P-PC11-E) was placed at the maximum stress point. The maximum stress point was determined based on the stress analysis performed using ANSYS® finite element software (Version 15.0, ANSYS Inc, Canonsburg, PA, USA) as shown in Figure 4. The conditioning circuit consists of a quarter Wheatstone bridge and an amplifier. The quarter Wheatstone bridge was implemented to convert the strain gauge resistance change to voltage change when pinching occurs. However, the voltage change was too small. Thus, a commercial amplifier (Wachendorff Strain Gauge Converter®, SENECA s.r.l., Padova, Italy) with a gain of 1000 was used.
The standard strain gauge calibration of force–voltage is usually performed for one contact location only. However, in the pinch test of UE-FMA, the contact location may vary due to the different initial pinching location of each volunteer. Furthermore, the contact location may also vary during the automatic pull, which causes slipping. Therefore, a continuous relationship of force–voltage for all possible contact points along the pinching length is required. This can be achieved by performing a multipoint calibration at five contact points away from the free edge (4.1, 5.8, 11.5, 16.5, and 20.2 mm). The multipoint calibration was performed using a mechanical testing system (INSTRON® 3366, Illinois Tool Works Inc, Norwood, MA, USA) by applying dynamic loading (0–50 N), as shown in Figure 5. The pincer object was held stationary on the INSTRON® 3366 base during calibration by applying glue on both sides of the pincer object to prevent any movement, as shown in Figure 5. As a result, five force–voltage curves were generated, as depicted in Figure 6a. The voltage and force data were recorded from the customized pinch force load cell and the INSTRON® 3366 machine. Subsequently, the continuous relationship of force as a function of voltage and position was modeled using linear regression function, as depicted in Figure 6b. The linear correlation coefficient R2 of 0.9896 indicates high linearity. Using the linear plane model equation (Equation (1)), the force measurements can be estimated at any contact point within pinching length given the measurements of voltage and position, which were collected from the pinch force load cell and the LVDT sensor, respectively.
Force = −0.9447 + 0.02371 × Voltage + 0.3632 × Position,
In performing the hysteresis test to the customized pinch force load cell, dynamic loading (0–50 N) and unloading (from 50 to 0 N) were applied at the contact point 11.5 mm, which is approximately at the midpoint of the pinching length. Figure A1 (Appendix A) shows the loading and unloading curves of voltage and force measurements recorded from the pinch force load cell and INSTRON® 3366 machine, respectively. The solid line is the force–voltage relationship for dynamic loading, while the dotted line is the force–voltage relationship for dynamic unloading. The hysteresis is defined as the difference in voltage offset between loading and unloading lines at the midpoint on the force axis. The following formula gives the percentage of hysteresis:
Hysteresis = 100% × (VmuVml)/(VmaxVmin) = 0.287%.
where Vmu (892.46 mV) is the voltage value on the unloading line in Figure A1 at midpoint force Fm (23.86 N), Vml (898.1 mV) is the voltage value on the loading line at Fm, Vmax (1960.86 mV) is the maximum voltage value on the loading line, and Vmin (0 mV) is the minimum voltage value on the unloading line. The hysteresis of 0.287% can be considered negligible [52]. Furthermore, it is much lower than the hysteresis of thin-film pressure sensors (5%) [53]. Similar hysteresis tests were performed at the other contact points resulting in similarly negligible hysteresis.
In performing the repeatability test, a dynamic loading (0–50 N) was applied three times at the contact point 11.5 mm. The Coefficient of Variation (CV) was used to calculate the repeatability. CV is given by the ratio between standard deviation and mean values of three repeated voltage measurements at each force point ranging from Fmin (2.28 N) to Fmax (50 N). Then, all CVs are averaged to provide a single CV [49,54]. The “Cfvar” function in SPSS Statistics® V21 was used to calculate the CV. The CV value of 1.43 ± 0.447% was obtained which indicates high repeatability [55]. In addition, it is smaller than the CV value of thin-film pressure sensors (2.1 ± 2.3%) [49].
In replacing the manual gentle pull by the therapist, a linear electric system was used. The linear actuator system consists of a linear electric actuator, AC servo motor, AC servo driver, and Arduino® Due. To run the linear electric actuator, an AC servo motor (SM0602—400 Watt) was coupled in-line to the drive cap of the linear electric actuator. The output analog signal of Arduino® Due controls the AC servo motor through the AC servo driver (M2DV˗3D02R). The linear actuator system can exert automatic pulling force ranging from 0 to 63.25 N with a resolution of 0.5 N.
A pulling force is produced when the volunteer pinches the pincer object and then resists the automatic pull generated by the linear actuator system. An off-the-shelf pulling force load cell (STA-1-50 Aluminium S Type Tension) is located between the pincer object and the linear electric actuator to measure the pulling force. The voltage–force relationship of the pulling force load cell was established by the manufacturer, as shown in Figure 7. The pulling force load cell has 0.03% accuracy, 0.01% repeatability, 0.05 N resolution, and R2 = 1 linearity.
In detecting the slip onset, the LVDT displacement sensor was used. The LVDT sensor and linear electric actuator were clamped together such that they move in parallel. The output signal of the LVDT sensor was filtered with an analog Low Pass Filter (LPF) of 20 Hz cut off frequency to remove the high-frequency noise. Since the pinching length is only 20 mm, the LVDT sensor was calibrated at 0-, 5-, 10-, 15-, and 20-mm displacement points using a standard digital caliper with 0.05 mm resolution. The calibration process was repeated three times to perform the repeatability test, as mentioned previously for the pinch force load cell. The three voltage–displacement relationships show high linearity of R2 = 0.9999, as shown in Figure 8. The repeatability of the LVDT sensor is 9.57 × 10⁻⁵%, which indicates high repeatability. The analog signals of the customized pinch force load cell, pulling force load cell, and LVDT sensors were converted to digital inside the Arduino® Due and then recorded in a PC installed with Arduino® IDE software. The diagram that illustrates the data acquisition process is shown in Figure 9.

2.2. Volunteers Recruitment and Experimental Protocol

Fifty right-handed healthy male students participated. All volunteers had no prior history of upper limb injury and passed the health status questionnaire (SF-36). To avoid bias in the force measurements, the study was conducted on a single-gender because males and females have different pinch strength [56]. Furthermore, the study excluded construction workers and professional sportsmen as they have stronger pinch force than the average male population [57]. The mean age, height, and weight for volunteers were 21.86 ± 1.41 years, 170.41 ± 7.03 cm, and 69.49 ± 17.9 kg, respectively. Ethical approval (Reference number: JKEUPM-2017-248) for this study was obtained from The Ethics Committee for Research Involving Human Subjects of Universiti Putra Malaysia.
In this study, the improved wrist/hand UE-FMA protocol by Page et al. [24] was adopted. The volunteers were instructed to sit at 90° on a chair, shoulder in the neutral position, elbow at 90°, and forearm in resting position. A bedside table was positioned to support the volunteer’s arm and elbow, as shown in Figure 10a. The volunteers were also instructed to clean and dry their hands before commencing the experiment to avoid any influence of moisture through sweat. Then, they were instructed to hold the pincer object comfortably using their thumb and index fingertips, as in Figure 10b. Once the linear actuator started to pull the pincer object, the volunteers attempted to resist this pulling as much as possible. Since no visual feedback was provided, the volunteer had to react and adjust accordingly to the perceived amount of pulling force. To achieve pinch stability, the pinch force had to be adjusted in proportion to the changes in the pulling force. The linear actuator stopped exerting pulling force the moment the pincer object had totally slipped away from the volunteer’s fingers, and this was indicated by a 20-mm displacement slip. Figure A2 (Appendix A) demonstrates the flowchart to execute the experiment. The data collection involved both right and left hands. The duration of one trial began when the linear actuator received the control signal from the Arduino® Due, and ended the instant the pincer object slipped totally away. The analysis of the recorded data showed the pinch and pulling force values at the slip onset. The slip onset was defined as the moment when the pincer object started to shift with respect to the starting position, indicating that the object slipped away from the volunteer’s fingers. During the trial, one set of measurements, which included the pinch force, pulling force, and displacement, were recorded, resulting in 300 datasets (50 volunteers × 2 hands × 3 trials per hand). To reduce the effect of the physical and mental fatigue, an adequate resting period of 3 min was given between each trial. Cronbach’s alpha (α) was used to measure the reliability among the three trials of the hand, which as computed using the following formula [58]:
α = N . c ¯ v + ( N 1 ) . c ¯
where N is the number of trials, c ¯ is the average inter-item covariance among the trials, and v is the average variance.

3. Results

Figure 11a shows data recorded from one trial of one volunteer. The pinch force, pulling force, and displacement signals were recorded from the customized pinch force load cell, pulling force load cell, and the LVDT sensor, respectively. The linear electric actuator started to pull the pincer object, as indicated by a sudden increase in the pinch and pulling force signals at 3 s. The volunteer exerted pinch force increased as the pulling force increased gradually. From this point, the pincer object totally slipped away from volunteer’s fingers, as indicated by a sudden increase in displacement measurements at 20 s. For each trial, it was important to extract the pinch and pulling force values at the slip onset. The slip onset is the point that differentiates between slip and non-slip where the pincer object begins to slip and is the first instance where the displacement started to increase from a relatively flat level. In Figure 11a, it is difficult to determine the slip onset visually due to the small magnitude of the increase in the displacement absolute scale (mm). In addition, the increase in displacement is nonlinear, thus a nonlinear scaling is required. Subsequently, the nonlinear decibel scale (dB) was used such that the logarithm base 10 of the displacement absolute value was multiplied by 20 to provide the necessary scaling. Upon that, the slip onset was precisely determined at 12 s, as shown in Figure 11b. The pinch and pulling force values at the slip onset (12 s) were 15.39 and 7.05 N, respectively.
Since the static coefficient of friction of copper alloy is constant, it is expected that the relationship between pinch and pulling force prior to slip onset is linear. Figure 12 shows the pinch–pulling force relationship before and after the slip onset. It was observed that the volunteer initially exerted excessive resistance (indicated by a sudden increase in pulling force), because he had to react and adjust the pinch force according to the perceived automatic pull generated by the linear actuator. There was also some nonlinearity observed at 12 and 14.5 N pinch forces that were probably due to the absence of visual feedback as well as the continuous increase in the amount of automatic pull. Prior to the slip onset, the pinch–force relationship had high linearity of R2 = 0.8971, while the linearity decreased to R2 = 0.5845 after the slip onset. This decrease in linearity as due to the inability of the volunteer to exert pinch force according to the continuous increasing of pulling force, which was indicated by the continuous slipping. The COF was computed as the ratio of pulling force to the pinch force at the slip onset, which was equal to 0.45 (7.05/15.39).
For each hand, three trials were recorded, and then the pinch and pulling force values were extracted at the slip onsets using the same criteria involved in the above trial. Figure A3a (Appendix A) shows the three trials collected from the right hand of a volunteer. It can be observed that the pinch force signals were close to each other during the three trials, and they had excellent reliability (Cronbach’s alpha = 0.989). This was also observed for pulling force signals (Cronbach’s alpha = 0.969). Based on the displacement measurements after being converted to decibels, the slip onsets were at 17, 14, and 12 s for Trials 1–3, respectively, as shown in Figure A3b. The pinch and pulling force values at the slip onsets as well as the static COFs are summarized in Table 1. The interpretation is that this volunteer could exert an average pinch force of 15.93 N against the maximum automatic pull of 7.65 N without slipping.
For each hand of the 50 volunteers, the pinch and pulling force values as well as the static COFs of the three trials were averaged, resulting in three averaged values (as demonstrated in Table 1). Figure 13 shows the distribution of averaged values collected from the right and left hands of the 50 volunteers. It is clear that the distribution has an approximately normal bell-shape and no skewness exists. The mean, standard deviation, and range of pinch and pulling force values as well as static COF of right and left hands are summarized in Table 2. It was found that the mean pinch and pulling force values of right hands were slightly higher than those of lefts hands by 4.1% and 5.28%, respectively. However, there were no significant differences between right and left hands based on the paired t-test at the confidence level of p = 0.05. The paired t-test shows a p-value of 0.298 and 0.275 for pinch and pulling force, respectively. The average time duration for each hand was around 7 min, which included three trials (around 20 s for each trial depending on the amount of time for the pincer object to slip away from the fingers) with two resting periods in between (3 min for each resting period). Considering each volunteer performed the same experiment with both hands, a total time duration of around 14 min was involved.

4. Discussion

In 274 trials (91.3% of total trials), the volunteers could adjust the pinch force in proportion to the changes in pulling force. However, the remaining trials were excluded prior to analysis due to improper adjustment of pinch force to the pulling force. This is considered as human errors such that the volunteers might not follow the experiment’s procedures and instructions probably due to delay in reaction, missing the instructions, or absence of visual feedback. According to the UE-FMA protocol, the subject should resist a gentle pull to avoid slip. This means that the pincer object slips when the subject is no longer able to exert enough pinch force. In this study, it was initially hypothesized that the slip onset was expected at the maximum pinch force just before the point where the pincer object totally slipped. Interestingly, it was found that the slip onset occurred much earlier and was subjected to a sub-maximal pinch force. This result opens up the possibility of using the slip onset as a measurement of pinch improvement such that the patient would develop a stronger pinch force over rehabilitation time at the slip onset. Furthermore, the continuous changes of slip onset would improve the responsiveness of the pinch assessment such that the scoring is not subjected only to score 1 and 2 as in the current UE-FMA scoring criteria.
The pinch–force relationship was found to be linear prior to the slip onset as the static COF between human skin and copper alloy was constant. However, there was some variability in pinch and pulling force, as indicated by peaks approximately at 7.5, 12, and 14.5 N, as depicted in Figure 12. The highest variability was observed at 7.5 N pinch force at the loading phase in which the linear electric actuator started to pull. This is consistent with previous studies stated that the subjects generally show stronger pinch forces at the loading phase [59]. Besides, the pinch force rate (N/s) reached the highest at the loading phase when the volunteer was subjected to unpredictable loading [27]. The study conducted by Takamuku et al. [60] showed that pinch force variability is lower when visual feedback is provided to the subject. In addition, the pinch force control is greatly influenced by the safety margin factor during the unpredictable loading [61]. The safety margin is an additional amount of pinch force applied to guard against slip, which is different from volunteer to volunteer [62]. The other two peaks at 12 and 14.5 N can be interpreted such that the volunteer should adapt his pinch force against the continuous automatic pull without visual feedback; hence, the safety margin is continuously changed to adapt the continuous increase in pulling force. Therefore, it is possible that the volunteer may unconsciously fail to adapt his pinch force to the increase in pulling force at some events. The safety margin is also influenced by the static COF [63], such that it will be high in the case of slippery object as in copper alloy used in our experiment. The pinch–pulling force relationship can be used as an assessment for pinch force control against unpredictable loading for stroke patients.
The CV value (represented by standard deviation divided by the mean) indicates how well the mean values of pinch and pulling forces summarizes the whole dataset. Interpretation of CV may vary; the rule of thumb can be used, which states the CV value of under 1 shows a small variance [64]. In this study, the CV values were 0.248 and 0.35 for pinch and pulling forces of the right hands, respectively. The CV values were 0.241 and 0.31 for pinch and pulling forces of left hands, respectively. Hence, the mean pinch and pulling force values are a reasonable representation of healthy adults in Malaysia. The results also indicate that the pinch and pulling force vary among the volunteers at the slip onset, which is expected as each volunteer has a different body size, hand size, and amount of safety margin. For instance, a bigger fingertip size leads to a larger contact area between the fingertip and the object’s surface. Consequently, larger contact area would lead to larger pinch force, as reported in a related study by Derler et al. [65], who showed that there is a positive association between contact area and force exerted by the index finger. In addition, each volunteer has different skin characteristics such as oiliness, moisture, roughness, and age that may affect the friction between fingertip skin and pincer object’s surface. In this study, the mean static COFs for right and left hands were computed as 0.518 ± 0.146 and 0.517 ± 0.145, respectively. This is relatively consistent with previous findings related to measuring COF between human skin and copper material, reported by Sivamani et al. [66] (mean COF = 0.55) and Li et al. [67] (mean COF = 0.58).
In the literature, many studies have reported a significant difference in maximum pinch force between right and left hands [68]. Although our results show a slight increase in the means of pinch and pulling force for right hand compared to the left hand, there was no significant difference (p > 0.05). Thus, it is not required to distinguish between right and left hands when a single-gender group is recruited for further research. Furthermore, the unaffected hand can be used as a reference for the affected hand during the rehabilitation of post-stroke patients. The explanation of this result can be that the volunteers did not exert their maximum pinch force at the slip onset. This is consistent with a study conducted by Li and Yu [69], who reported that there is no significant difference between left and right hands when the grip force is at 25%, 50%, and 75% of the maximum force. The results of their study indicate that there is a significant difference only at maximum grip force.
Recently, three main components of the assessment system are required for an assessment system to be fully automated: administration, data acquisition, and rating [19]. Administration involves the instructions and procedures to evaluate the patient, while the data acquisition involves obtaining the outcome measurements from patients. Rating is the criteria to evaluate the outcome measurements of the patients, which are usually designed as an ordinal scale. In this study, only the pinch data acquisition system is automated based on UE-FMA protocol. The limitation of this study is that the administration and rating components are not yet automated. In the future, this limitation will be addressed, such that stroke patients with pinch deficits at different levels of impairment (severe, moderate, and mild) will be recruited to determine the threshold values for each level so that an automated rating process can be performed. In addition, the administration of the pinch test will be automated by including a graphical user interface to visualize the instructions and procedures.
To use the automated data acquisition system in clinical practice based on UE-FMA protocol, the design can be improved to be more compact, less wires, and portable by: (1) replacing the DC power supply with a portable DC battery to power the two amplifiers and LVDT sensor; (2) using a customized small size linear electric actuator as the with pulling force of smaller than 15 N; and (3) using a wireless connection (e.g., ZigBee module) to transmit/receive digitalized signals to/from the PC instead of signal wires. This improvement will be addressed in the future work.

5. Conclusions

In this paper, an automated data acquisition system for pinch assessment based on UE-FMA protocol is presented. The automated system is able to provide objective measurements of pinch and pulling forces and detect slip onset rather than the subjective manual gentle pull and visual observation of slipping occurrence. In addition, the therapist’s gentle pull has been replaced with a linear actuator sub-system exerting a consistent amount of pulling force. Right and lefts hands of 50 volunteers were recruited to investigate the pinch and pulling force measurements at the slip onset using the developed system. The pinch–pulling force relationship is linear, which is indicated by a proportional increase of pinch force against the continuous increase of pulling force prior to slip onset. In addition, the volunteers were subjected to submaximal pinch force at the slip onset. The mean pinch force values at the slip onset were 12.17 and 11.67 N for right and left hands, respectively. The mean pulling force values at the slip onset were 6.25 and 5.92 N for right and left hands, respectively. It was found that there is no significant difference in force measurements between right and left hands. A further study can be conducted to investigate the hypothesis of considering slip onset and pinch–pulling force relationship as a pinch assessment for stroke patients.

Author Contributions

A.A. (Abdallah Alsayed) and R.K. designed and developed the pinch assessment system; H.R. performed the integration of sensors and actuator; A.A. (Azizan As’arry) performed CAD and finite element analysis as well as provided access to volunteers; A.A. (Abdallah Alsayed) performed data collection and results analysis; and all authors contributed to writing and editing the paper. All authors have read and agreed to the published version of the manuscript

Funding

This research was funded by Universiti Putra Malaysia, grant number IPS No. 9574400.

Acknowledgments

We would like to thank Yayasan Khazanah Berhad, Malaysia for their technical and financial support.

Conflicts of Interest

The authors declare no conflict of interest.

Data Availability

The data and codes used in this study are available from the corresponding author upon request.

Appendix A

Figure A1. Force–voltage relationship during loading and unloading.
Applsci 10 03436 g0a1
Figure A2. Flowchart of experiment execution.
Applsci 10 03436 g0a2
Figure A3. (a) Three trials recorded from one volunteer; and (b) displacement in decibel scale.
Applsci 10 03436 g0a3

References

  1. Miyasaka, H.; Takeda, K.; Ohnishi, H.; Orand, A.; Sonoda, S. Effect of Sensory Loss on Improvements of Upper-Limb Paralysis Through Robot-Assisted Training: A Preliminary Case Series Study. Appl. Sci. 2019, 9, 3925. [Google Scholar] [CrossRef] [Green Version]
  2. Li, K.; Nataraj, R.; Marquardt, T.L.; Li, Z.-M. Directional coordination of thumb and finger forces during precision pinch. PLoS ONE 2013, 8, e79400. [Google Scholar] [CrossRef] [PubMed]
  3. Pessina, M.A.; Bowley, B.G.; Rosene, D.L.; Moore, T.L. A method for assessing recovery of fine motor function of the hand in a rhesus monkey model of cortical injury: An adaptation of the Fugl-Meyer Scale and Eshkol-Wachman Movement Notation. Somatosens. Mot. Res. 2019, 36, 69–77. [Google Scholar] [CrossRef]
  4. El-Katab, S.; Omichi, Y.; Srivareerat, M.; Davenport, A. Pinch grip strength as an alternative assessment to hand grip strength for assessing muscle strength in patients with chronic kidney disease treated by haemodialysis: A prospective audit. J. Hum. Nutr. Diet. 2016, 29, 48–51. [Google Scholar] [CrossRef] [PubMed]
  5. Murphy, M.A.; Resteghini, C.; Feys, P.; Lamers, I. An overview of systematic reviews on upper extremity outcome measures after stroke. BMC Neurol. 2015, 15, 29. [Google Scholar] [CrossRef] [Green Version]
  6. Valero-Cuevas, F.J.; Smaby, N.; Venkadesan, M.; Peterson, M.; Wright, T. The strength-dexterity test as a measure of dynamic pinch performance. J. Biomech. 2003, 36, 265–270. [Google Scholar] [CrossRef]
  7. Harrison, J.K.; McArthur, K.S.; Quinn, T.J. Assessment scales in stroke: Clinimetric and clinical considerations. Clin. Interv. Aging 2013, 8, 201. [Google Scholar]
  8. Yozbatiran, N.; Der-Yeghiaian, L.; Cramer, S.C. A standardized approach to performing the action research arm test. Neurorehabilit. Neural Repair 2008, 22, 78–90. [Google Scholar] [CrossRef] [Green Version]
  9. Johansson, G.M.; Häger, C.K. A modified standardized nine hole peg test for valid and reliable kinematic assessment of dexterity post-stroke. J. Neuroeng. Rehabil. 2019, 16, 8. [Google Scholar] [CrossRef]
  10. Sears, E.D.; Chung, K.C. Validity and responsiveness of the jebsen–taylor hand function test. J. Hand Surg. 2010, 35, 30–37. [Google Scholar] [CrossRef] [Green Version]
  11. Wolf, S.L.; Catlin, P.A.; Ellis, M.; Archer, A.L.; Morgan, B.; Piacentino, A. Assessing Wolf motor function test as outcome measure for research in patients after stroke. Stroke 2001, 32, 1635–1639. [Google Scholar] [CrossRef] [PubMed] [Green Version]
  12. Raghavan, P. Upper limb motor impairment after stroke. Phys. Med. Rehabil. Clin. 2015, 26, 599–610. [Google Scholar] [CrossRef] [PubMed] [Green Version]
  13. Page, S.J.; Fulk, G.D.; Boyne, P. Clinically important differences for the upper-extremity Fugl-Meyer Scale in people with minimal to moderate impairment due to chronic stroke. Phys. Ther. 2012, 92, 791–798. [Google Scholar] [CrossRef] [PubMed] [Green Version]
  14. Fugl-Meyer, A.R.; Jääskö, L.; Leyman, I.; Olsson, S.; Steglind, S. The post-stroke hemiplegic patient. 1. A method for evaluation of physical performance. Scand. J. Rehabil. Med. 1975, 7, 13–31. [Google Scholar] [PubMed]
  15. Deakin, A.; Hill, H.; Pomeroy, V.M. Rough guide to the Fugl-Meyer Assessment: Upper limb section. Physiotherapy 2003, 89, 751–763. [Google Scholar] [CrossRef]
  16. Paternostro-Sluga, T.; Grim-Stieger, M.; Posch, M.; Schuhfried, O.; Vacariu, G.; Mittermaier, C.; Bittner, C.; Fialka-Moser, V. Reliability and validity of the Medical Research Council (MRC) scale and a modified scale for testing muscle strength in patients with radial palsy. J. Rehabil. Med. 2008, 40, 665–671. [Google Scholar] [CrossRef] [Green Version]
  17. Van Beers, R.J.; Haggard, P.; Wolpert, D.M. The role of execution noise in movement variability. J. Neurophysiol. 2004, 91, 1050–1063. [Google Scholar] [CrossRef]
  18. Tanaka, K.; Yano, H. Errors of visual judgement in precision measurements. Ergonomics 1984, 27, 767–780. [Google Scholar] [CrossRef]
  19. Simbaña, E.D.O.; Baeza, P.S.-H.; Jardón, A.; Balaguer, C. Review of Automated Systems for Upper Limbs Functional Assessment in Neurorehabilitation. IEEE Access 2019, 7, 32352–32367. [Google Scholar] [CrossRef]
  20. de los Reyes-Guzmán, A.; Dimbwadyo-Terrer, I.; Trincado-Alonso, F.; Monasterio-Huelin, F.; Torricelli, D.; Gil-Agudo, A. Quantitative assessment based on kinematic measures of functional impairments during upper extremity movements: A review. Clin. Biomech. 2014, 29, 719–727. [Google Scholar] [CrossRef] [Green Version]
  21. Yu, L.; Xiong, D.; Guo, L.; Wang, J. A remote quantitative Fugl-Meyer assessment framework for stroke patients based on wearable sensor networks. Comput. Methods Programs Biomed. 2016, 128, 100–110. [Google Scholar] [CrossRef] [PubMed]
  22. Woytowicz, E.J.; Rietschel, J.C.; Goodman, R.N.; Conroy, S.S.; Sorkin, J.D.; Whitall, J.; Waller, S.M. Determining levels of upper extremity movement impairment by applying a cluster analysis to the Fugl-Meyer assessment of the upper extremity in chronic stroke. Arch. Phys. Med. Rehabil. 2017, 98, 456–462. [Google Scholar] [CrossRef] [PubMed] [Green Version]
  23. Yu, L.; Wang, J.; Guo, L.; Zhang, Q.; Li, P.; Li, Y.; Yu, X.; Huang, Y.; Wu, Z. Transfer learning based quantitative assessment model of upper limb movement ability for stroke survivors. In Proceedings of the 2017 2nd International Conference on Information Technology (INCIT), Nakhon Pathom, Thailand, 2–3 November 2017; pp. 1–4. [Google Scholar]
  24. Page, S.J.; Levine, P.; Hade, E. Psychometric properties and administration of the wrist/hand subscales of the Fugl-Meyer Assessment in minimally impaired upper extremity hemiparesis in stroke. Arch. Phys. Med. Rehabil. 2012, 93, 2373–2376. [Google Scholar] [CrossRef] [PubMed] [Green Version]
  25. Westling, G.; Johansson, R. Factors influencing the force control during precision grip. Exp. Brain Res. 1984, 53, 277–284. [Google Scholar] [CrossRef]
  26. Hu, W.; Wei, N.; Li, Z.-M.; Li, K. Effects of muscle fatigue on directional coordination of fingertip forces during precision grip. PLoS ONE 2018, 13, e0208740. [Google Scholar] [CrossRef] [Green Version]
  27. Häger-Ross, C.; Cole, K.J.; Johansson, R.S. Grip-force responses to unanticipated object loading: Load direction reveals body-and gravity-referenced intrinsic task variables. Exp. Brain Res. 1996, 110, 142–150. [Google Scholar] [CrossRef]
  28. Sullivan, K.J.; Tilson, J.K.; Cen, S.Y.; Rose, D.K.; Hershberg, J.; Correa, A.; Gallichio, J.; McLeod, M.; Moore, C.; Wu, S.S. Fugl-Meyer assessment of sensorimotor function after stroke: Standardized training procedure for clinical practice and clinical trials. Stroke 2011, 42, 427–432. [Google Scholar] [CrossRef] [Green Version]
  29. Frisoli, A.; Procopio, C.; Chisari, C.; Creatini, I.; Bonfiglio, L.; Bergamasco, M.; Rossi, B.; Carboncini, M.C. Positive effects of robotic exoskeleton training of upper limb reaching movements after stroke. J. Neuroeng. Rehabil. 2012, 9, 36. [Google Scholar] [CrossRef] [Green Version]
  30. Ellis, M.D.; Schut, I.; Dewald, J.P. Flexion synergy overshadows flexor spasticity during reaching in chronic moderate to severe hemiparetic stroke. Clin. Neurophysiol. 2017, 128, 1308–1314. [Google Scholar] [CrossRef]
  31. Straathof, P.T.; Lobo-Prat, J.; Schilder, F.; Kooren, P.N.; Paalman, M.I.; Stienen, A.H.; Koopman, B.F. Design and control of the A-Arm: An active planar arm support for adults with Duchenne muscular dystrophy. In Proceedings of the 2016 6th IEEE International Conference on Biomedical Robotics and Biomechatronics (BioRob), Singapore, 26–29 June 2016; pp. 1242–1247. [Google Scholar]
  32. Heyer, P.; Orihuela-Espina, F.; Castrejón, L.R.; Hernández-Franco, J.; Sucar, L.E. Sensor Abstracted Extremity Representation for Automatic Fugl-Meyer Assessment. In Applications for Future Internet; Springer: Cham, Switzerland, 2017; pp. 152–163. [Google Scholar]
  33. Wang, J.; Yu, L.; Wang, J.; Guo, L.; Gu, X.; Fang, Q. Automated Fugl-Meyer assessment using SVR model. In Proceedings of the 2014 IEEE International Symposium on Bioelectronics and Bioinformatics (IEEE ISBB 2014), Chung Li, Taiwan, 11–14 April 2014; pp. 1–4. [Google Scholar]
  34. Villán-Villán, M.A.; Pérez-Rodríguez, R.; Gómez, C.; Opisso, E.; Tormos, J.M.; Medina, J.; Gómez, E.J. A First Step for the Automation of Fugl-Meyer Assessment Scale for Stroke Subjects in Upper Limb Physical Neurorehabilitation. In Proceedings of the International Conference on Informatics, Management and Technology in Healthcare, Athens, Greece, 9–11 July 2015; pp. 45–48. [Google Scholar]
  35. Oña, E.D.; Jardón, A.; Monge, E.; Molina, F.; Cano, R.; Balaguer, C. Towards Automated Assessment of Upper Limbs Motor Function Based on Fugl-Meyer Test and Virtual Environment. In Proceedings of the International Conference on NeuroRehabilitation, Pisa, Italy, 16–20 October 2018; pp. 297–301. [Google Scholar]
  36. Eichler, N.; Hel-Or, H.; Shimshoni, I.; Itah, D.; Gross, B.; Raz, S. 3D motion capture system for assessing patient motion during Fugl-Meyer stroke rehabilitation testing. IET Comput. Vis. 2018, 12, 963–975. [Google Scholar] [CrossRef] [Green Version]
  37. Kim, W.-S.; Cho, S.; Baek, D.; Bang, H.; Paik, N.-J. Upper extremity functional evaluation by Fugl-Meyer assessment scoring using depth-sensing camera in hemiplegic stroke patients. PLoS ONE 2016, 11, e0158640. [Google Scholar] [CrossRef] [PubMed]
  38. Lee, W.W.; Yen, S.-C.; Tay, E.B.A.; Zhao, Z.; Xu, T.M.; Ling, K.K.M.; Ng, Y.-S.; Chew, E.; Cheong, A.L.K.; Huat, G.K.C. A smartphone-centric system for the range of motion assessment in stroke patients. IEEE J. Biomed. Health Inform. 2014, 18, 1839–1847. [Google Scholar] [CrossRef] [PubMed]
  39. Olesh, E.V.; Yakovenko, S.; Gritsenko, V. Automated assessment of upper extremity movement impairment due to stroke. PLoS ONE 2014, 9, e104487. [Google Scholar] [CrossRef] [PubMed]
  40. Otten, P.; Kim, J.; Son, S. A framework to automate assessment of upper-limb motor function impairment: A feasibility study. Sensors 2015, 15, 20097–20114. [Google Scholar] [CrossRef] [Green Version]
  41. Otten, P.; Son, S.H.; Kim, J. Automating stroke patient evaluation using sensor data and SVM. In Proceedings of the 2014 IEEE 7th International Conference on Service-Oriented Computing and Applications, Matsue, Japan, 17–19 November 2014; pp. 223–229. [Google Scholar]
  42. Lee, S.; Lee, Y.-S.; Kim, J. Automated evaluation of upper-limb motor function impairment using Fugl-Meyer assessment. IEEE Trans. Neural Syst. Rehabil. Eng. 2017, 26, 125–134. [Google Scholar] [CrossRef]
  43. Lee, S.-H.; Song, M.; Kim, J. Towards clinically relevant automatic assessment of upper-limb motor function impairment. In Proceedings of the 2016 IEEE-EMBS International Conference on Biomedical and Health Informatics (BHI), Las Vegas, NV, USA, 24–27 February 2016; pp. 148–151. [Google Scholar]
  44. Kim, Y.M.; Son, Y.; Kim, W.; Jin, B.; Yun, M.H. Classification of children’s sitting postures using machine learning algorithms. Appl. Sci. 2018, 8, 1280. [Google Scholar] [CrossRef] [Green Version]
  45. Paredes-Madrid, L.; Emmi, L.; Garcia, E.; De Santos, P.G. Detailed study of amplitude nonlinearity in piezoresistive force sensors. Sensors 2011, 11, 8836–8854. [Google Scholar] [CrossRef] [Green Version]
  46. Parmar, S.; Khodasevych, I.; Troynikov, O. Evaluation of flexible force sensors for pressure monitoring in treatment of chronic venous disorders. Sensors 2017, 17, 1923. [Google Scholar] [CrossRef]
  47. Rivera, J.; Carrillo, M.; Chacón, M.; Herrera, G.; Bojorquez, G. Self-calibration and optimal response in intelligent sensors design based on artificial neural networks. Sensors 2007, 7, 1509–1529. [Google Scholar] [CrossRef] [Green Version]
  48. Almassri, A.; Wan Hasan, W.; Ahmad, S.; Shafie, S.; Wada, C.; Horio, K. Self-calibration algorithm for a pressure sensor with a real-time approach based on an artificial neural network. Sensors 2018, 18, 2561. [Google Scholar] [CrossRef] [Green Version]
  49. Likitlersuang, J.; Leineweber, M.J.; Andrysek, J. Evaluating and improving the performance of thin film force sensors within body and device interfaces. Med. Eng. Phys. 2017, 48, 206–211. [Google Scholar] [CrossRef] [PubMed]
  50. Ide, D.T.A. Available online: https://www.arduino.cc/en/Main/Software (accessed on 1 January 2019).
  51. Alsayed, A.; Kamil, R.; Ramli, H.R.; As’arry, A. Design and Calibration of Pinch Force Measurement Using Strain Gauge for Post-Stroke Patients. Int. J. Integr. Eng. 2019, 11. [Google Scholar] [CrossRef]
  52. Oh, J.; Kim, J.O.; Kim, Y.; Choi, H.B.; Yang, J.C.; Lee, S.; Pyatykh, M.; Kim, J.; Sim, J.Y.; Park, S. Highly Uniform and Low Hysteresis Piezoresistive Pressure Sensors Based on Chemical Grafting of Polypyrrole on Elastomer Template with Uniform Pore Size. Small 2019, 15, 1901744. [Google Scholar] [CrossRef] [PubMed]
  53. Matute, A.; Paredes-Madrid, L.; Gutierrez, E.; Vargas, C.A.P. Characterization of drift and hysteresis errors in force sensing resistors considering their piezocapacitive effect. In Proceedings of the 2017 IEEE SENSORS, Glasgow, UK, 29 October–1 November 2017; pp. 1–3. [Google Scholar]
  54. Reed, G.F.; Lynn, F.; Meade, B.D. Use of coefficient of variation in assessing variability of quantitative assays. Clin. Diagn. Lab. Immunol. 2002, 9, 1235–1239. [Google Scholar] [CrossRef] [Green Version]
  55. Zheng, Y.; Zhao, M.; Jiang, J.; Song, L. Dynamic Force Transducer Calibration Based on Electrostatic Force. IEEE Access 2019, 7, 48998–49003. [Google Scholar] [CrossRef]
  56. Maleki-Ghahfarokhi, A.; Dianat, I.; Feizi, H.; Asghari-Jafarabadi, M. Influences of gender, hand dominance, and anthropometric characteristics on different types of pinch strength: A partial least squares (PLS) approach. Appl. Ergon. 2019, 79, 9–16. [Google Scholar] [CrossRef]
  57. Angst, F.; Drerup, S.; Werle, S.; Herren, D.B.; Simmen, B.R.; Goldhahn, J. Prediction of grip and key pinch strength in 978 healthy subjects. BMC Musculoskelet. Disord. 2010, 11, 94. [Google Scholar] [CrossRef] [Green Version]
  58. Cronbach, L.J. Coefficient alpha and the internal structure of tests. Psychometrika 1951, 16, 297–334. [Google Scholar] [CrossRef] [Green Version]
  59. Blennerhassett, J.M.; Carey, L.M.; Matyas, T.A. Grip force regulation during pinch grip lifts under somatosensory guidance: Comparison between people with stroke and healthy controls. Arch. Phys. Med. Rehabil. 2006, 87, 418–429. [Google Scholar] [CrossRef] [PubMed]
  60. Takamuku, S.; Gomi, H. Better grip force control by attending to the controlled object: Evidence for direct force estimation from visual motion. Sci. Rep. 2019, 9, 13114. [Google Scholar] [CrossRef] [Green Version]
  61. Roberge, J.-P.; Ruotolo, W.; Duchaine, V.; Cutkosky, M. Improving industrial grippers with adhesion-controlled friction. IEEE Robot. Autom. Lett. 2018, 3, 1041–1048. [Google Scholar] [CrossRef]
  62. Miall, R.C.; Rosenthal, O.; Ørstavik, K.; Cole, J.D.; Sarlegna, F.R. Loss of haptic feedback impairs control of hand posture. Exp. Brain Res. 2019, 237. [Google Scholar] [CrossRef] [PubMed] [Green Version]
  63. Barrea, A.; Bulens, D.C.; Lefèvre, P.; Thonnard, J.-L. Simple and reliable method to estimate the fingertip static coefficient of friction in precision grip. IEEE Trans. Haptics 2016, 9, 492–498. [Google Scholar] [CrossRef] [PubMed]
  64. Hall, D. (e) in Normandy: The sociolinguistics, phonology and phonetics of the Loi de Position. J. Fr. Lang. Stud. 2019, 29, 1–33. [Google Scholar] [CrossRef] [Green Version]
  65. Derler, S.; Gerhardt, L.-C.; Lenz, A.; Bertaux, E.; Hadad, M. Friction of human skin against smooth and rough glass as a function of the contact pressure. Tribol. Int. 2009, 42, 1565–1574. [Google Scholar] [CrossRef]
  66. Sivamani, R.K.; Wu, G.C.; Gitis, N.V.; Maibach, H.I. Tribological testing of skin products: Gender, age, and ethnicity on the volar forearm. Ski. Res. Technol. 2003, 9, 299–305. [Google Scholar] [CrossRef] [PubMed]
  67. Li, W.; Qu, S.; Zhou, Z. Reciprocating sliding behaviour of human skin in vivo at lower number of cycles. Tribol. Lett. 2006, 23, 165. [Google Scholar] [CrossRef]
  68. Petersen, P.; Petrick, M.; Connor, H.; Conklin, D. Grip strength and hand dominance: Challenging the 10% rule. Am. J. Occup. Ther. 1989, 43, 444–447. [Google Scholar] [CrossRef] [Green Version]
  69. Li, K.W.; Yu, R. Assessment of grip force and subjective hand force exertion under handedness and postural conditions. Appl. Ergon. 2011, 42, 929–933. [Google Scholar] [CrossRef]
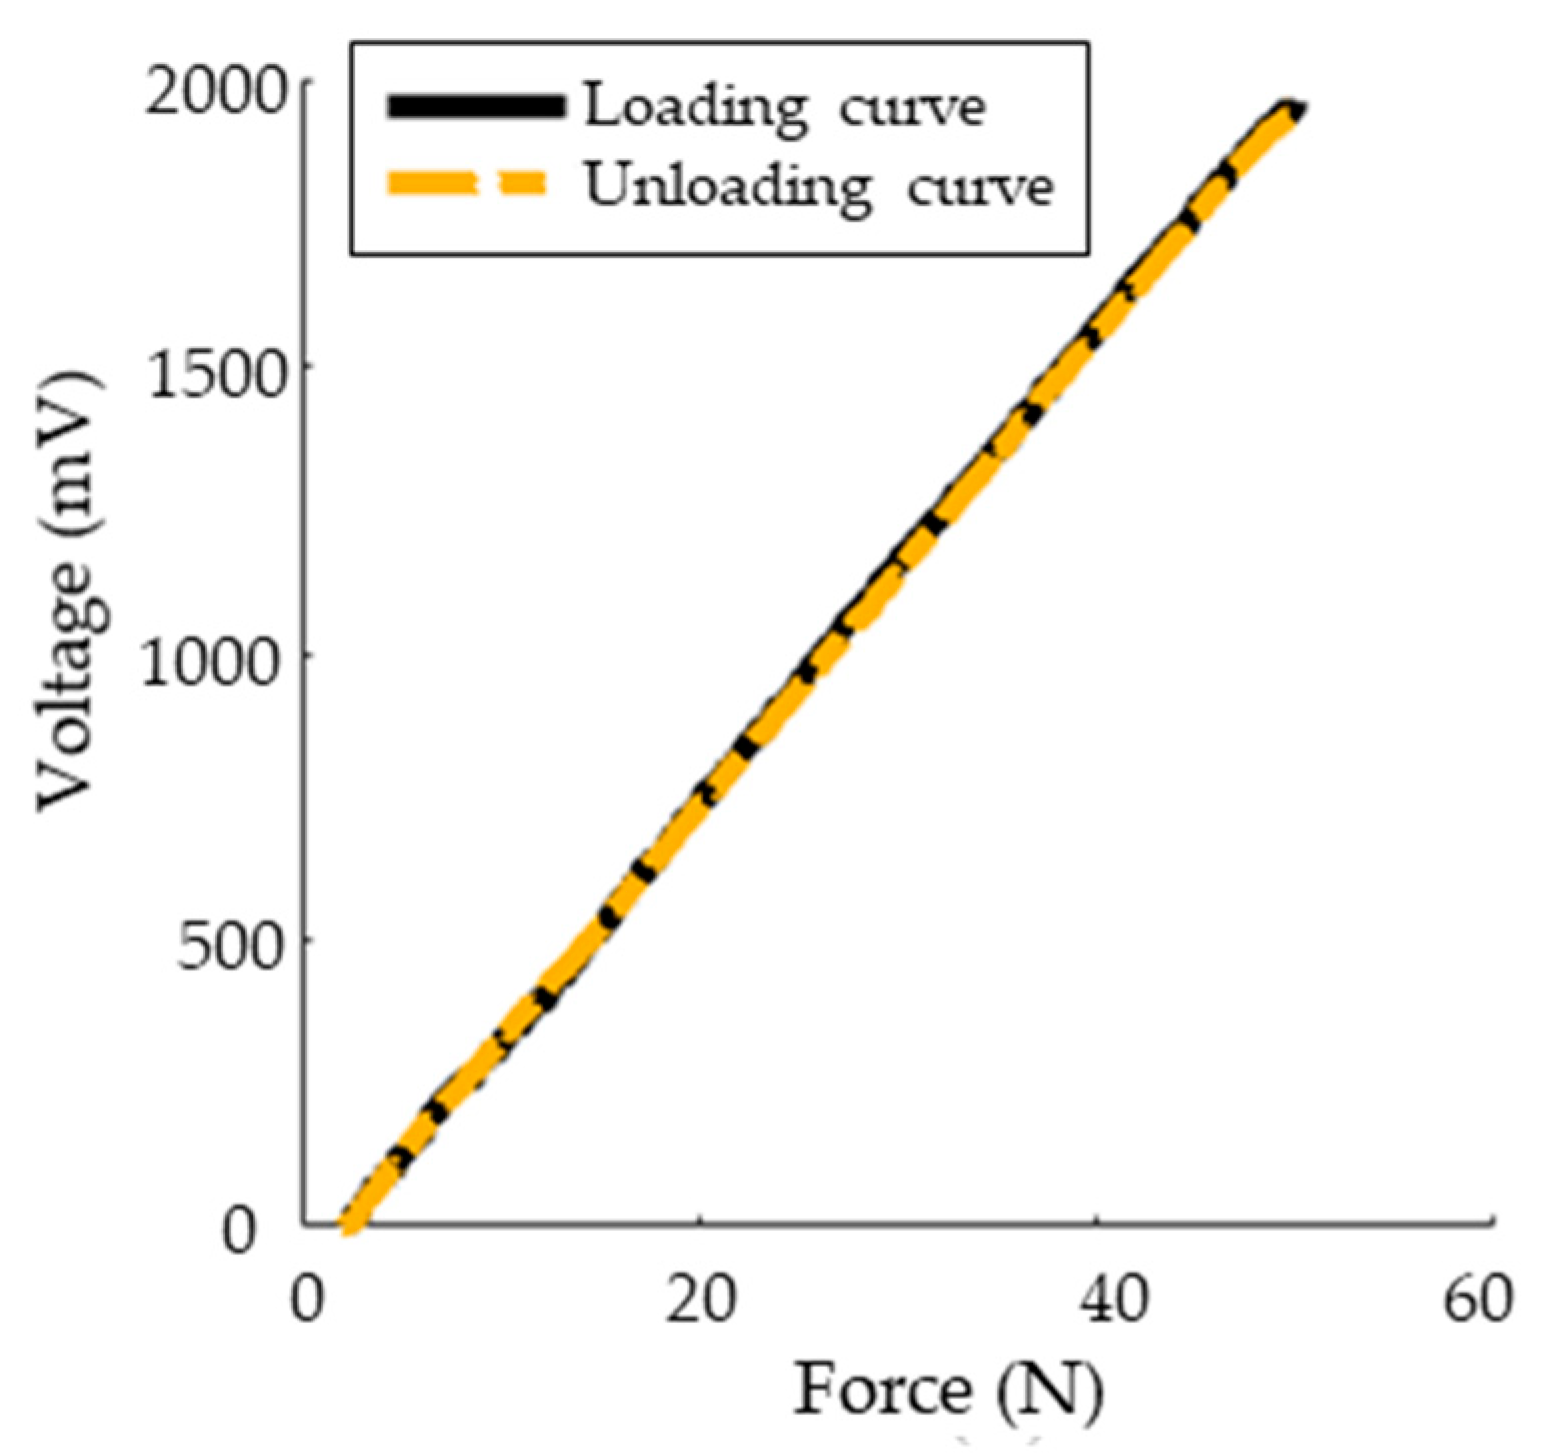
Figure 1. Pinch test as in the UE-FMA protocol.
Applsci 10 03436 g001
Figure 2. Experimental Setup of data acquisition system for pinch assessment.
Applsci 10 03436 g002
Figure 3. Pinch force load cell.
Applsci 10 03436 g003
Figure 4. Stress analysis of the pincer object where an external force is applied at the free end.
Applsci 10 03436 g004
Figure 5. Calibration setup of the pinch force load cell.
Applsci 10 03436 g005
Figure 6. (a) Force–voltage curves at five contact points; and (b) estimated plane of force as a function of voltage and position.
Applsci 10 03436 g006aApplsci 10 03436 g006b
Figure 7. Voltage–force relationship for pulling force load cell.
Applsci 10 03436 g007
Figure 8. Displacement–voltage relationships of three times calibration.
Applsci 10 03436 g008
Figure 9. Block diagram of the data acquisition process.
Applsci 10 03436 g009
Figure 10. (a) Body and upper limb positioning during the experiment; and (b) thumb and index finger opposed onto the pincer object. Note that the volunteer should resist the automatic pull applied by the linear actuator system.
Applsci 10 03436 g010
Figure 11. (a) One trial recorded from one volunteer; and (b) displacement in decibel scale.
Applsci 10 03436 g011
Figure 12. Pinch–pulling force relationship.
Applsci 10 03436 g012
Figure 13. Distribution of: (a) pinch force; (b) pulling force; and (c) static COF for 50 volunteers.
Applsci 10 03436 g013
Table 1. Measurements recorded from the right hand of a volunteer.
VariablesTrial 1Trial 2Trial 3Average
Pinch force (N)14.6117.8115.3915.93
Pulling force (N)7.298.617.057.65
Static COF0.4980.4830.4580.48
Table 2. Summary of pinch force, pulling force, and static COF values at slip onset for 50 volunteers.
VariableMeanStandard DeviationRange
Pinch force (N)Right hand12.17 3.025.36–18.48
Left hand11.672.826.79–17.67
Pulling force (N)Right hand6.252.192.37–10.77
Left hand5.921.86 1.88–10.67
Static COFRight hand0.5180.1460.27–0.85
Left hand0.5170.1450.23–0.81

