Automatic Test Data Generation Using the Activity Diagram and Search-Based Technique


1
Department of Software Engineering, Jeonbuk National University, Jeonju-si 54896, Korea
2
Department of Software Engineering, CAIIT, Jeonbuk National University, Jeonju-si 54896, Korea
*
Author to whom correspondence should be addressed.
Appl. Sci. 2020, 10(10), 3397; https://doi.org/10.3390/app10103397
Submission received: 17 April 2020
/
Revised: 5 May 2020
/
Accepted: 12 May 2020
/
Published: 14 May 2020
(This article belongs to the Section Computing and Artificial Intelligence)
Abstract
:In software testing, generating test data is quite expensive and time-consuming. The manual generation of an appropriately large set of test data to satisfy a specified coverage criterion carries a high cost and requires significant human effort. Currently, test automation has come at the cost of low quality. In this paper, we are motivated to propose a model-based approach utilizing the activity diagram of the system under test as a test base, focusing on its data flow aspect. The technique is incorporated with a search-based optimization heuristic to fully automate the test data generation process and deliver test cases with more improved quality. Our experimental investigation used three open-source software systems to assess and compare the proposed technique with two alternative approaches. The experimental results indicate the improved fault-detection performance of the proposed technique, which was 11.1% better than DFAAD and 38.4% better than EvoSuite, although the techniques did not differ significantly in terms of statement and branch coverage. The proposed technique was able to detect more computation-related faults and tends to have better fault detection capability as the system complexity increases.
1. Introduction
Test case design is an important activity that consumes a large share of the budget and effort required for software testing. In particular, generating test data for executable test cases is a major challenge [1]. Accordingly, building a system to generate test data that maximizes fault detection effectiveness and minimizes the cost and effort is essential. The use of software models to automate the test generation process and reduce the testing cost and effort has been an active area of research for a long time [2,3,4]. Interest in model-based test automation has expanded along with the acceptance of Unified Modeling Language (UML) diagrams as the de facto standard for modeling software systems. Recent advances in model-based testing (MBT) have increased the feasibility and effectiveness of using MBT to automate or semiautomate the entire test generation process [2,3].
In automated MBT, a model representing the expected behavior of the system under test (SUT) is developed and automatically analyzed to identify a set of test cases [5]. More recently, MBT practitioners have focused on using behavioral models of the SUT as a test basis to automate the test generation process [6]. Among the behavioral models, the activity diagram (AD), which has a rich symbolic vocabulary, is considered one of the most comprehensive and outstanding design artifacts for modeling all the intended behaviors of the SUT [7,8]. Existing studies focused mainly on analyzing control flow among activities in an AD from the high-level business process (HLBP) to detect various control flow errors (e.g., loops, concurrency, and synchronization) [7,9,10,11,12,13].
Generating abstract test cases to examine the control flow among design elements such as the AD on its own is inadequate to test the complete behavior of systems. Most software systems deliver functionality in terms of data; consequently, errors can easily occur if the flow of data is inappropriately modeled, defined, and used. Data flow testing was initially introduced to supplement control flow testing by incorporating the data flow information, referred to as definition-use (def-use) pair [14,15]. Since then, a number of studies have been conducted, from a different perspective with different strategies, for the identification of def-use pairs information and evaluation of its effectiveness [16,17]. The underlying idea behind data flow testing (DFT) is to detect inappropriate use of data or bad use of calculations. This idea is well-suited to the AD-based approach because ADs represent the sequences of actions that embody lower-level steps in the overall activity and are central to the data flow aspect of activities [18].
With growing software complexity and rapid change in business demands, smart automation of the test design process has become inevitable. The literature shows that automatic test generation using search-based metaheuristic algorithms to provide an appropriate set of test data for a specified coverage criterion has a high-cost efficiency and can reduce the human effort required compared with manual techniques [19]. The search-based testing technique using metaheuristic optimization algorithms, such as genetic algorithm (GA), has been widely studied and practiced, mostly in structural testing, to speed up the test design process [19,20,21,22]. Speeding up the test design process to reduce the testing cost and effort is good, but unfortunately, the increase in test automation speed has come at the cost of very low quality. With the motivation to fully automate the test data generation process while adding more precision, our objective in this paper is to use the ADs of the SUT for test data generation by using a GA. For this purpose, we present an algorithm for the automatic identification of data flow information and a fitness function to cover the maximum number of def-use pairs.
We call the approach AutoTDGen, and we implement it in a simple prototype tool. The notable advantage of AutoTDGen is reducing the risks of randomly generating redundant, low-quality, and unreliable test cases. In contrast to the existing automated test generation tools, following a model-based approach utilizing the ADs of the SUT as a test base incorporated with the optimization heuristic not only automates the test generation process but also reduces the risk of generating incorrect random test cases by accurately identifying what behavior of the system to test with what data values, and it exposes many requirement related issues in the early stage of software development life cycle. This paper extends our previous work [23] with the following additional contributions.
- Automate the entire test data generation process. For this purpose, we introduce a search-based approach using a GA with a fitness function designed to reward maximum coverage of def-use pairs.
- In addition to automating the test data generation process, this approach, unlike our previous study on manually annotating the flow of data in an AD and converting it into an intermediate test model [24], can directly generate test cases from models of the SUT without transforming them into intermediate test models.
- We have empirically compared and contrasted the effectiveness of AutoTDGen with that of DFAAD and EvoSuite.
To compare the fault detection effectiveness and statement and branch coverage performance of AutoTDGen with the two alternative approaches, we performed an experimental investigation using three software systems chosen from open-source libraries. Through the experiments, we also aimed to evaluate if there is any variation in the types of faults detected by the proposed AutoTDGen and alternative approaches along with the interaction relationship between the test coverage and fault detection effectiveness of the adopted techniques and subject properties.
The rest of this paper is organized as follows: Section 2 introduces related work. Section 3 presents the background of this study, revisiting the data flow representation and concepts in an AD. It also provides an example and some definitions. Section 4 introduces the main concepts and activities for automatic test data generation using the AD and search-based technique. An experimental investigation to assess and compare the proposed technique with two alternative approaches in terms of fault detection effectiveness and coverage performance is described in Section 5. Section 6 discusses the findings based on the reported results. Finally, Section 7 discusses possible threats to the validity of this research, with the conclusion and future work presented in Section 8.
2. Related Work
This section introduces previous work relevant to AD-based test case generation techniques, as well as evolutionary approaches towards automatic test generation using search-based metaheuristic optimization algorithms. The section also provides a simple illustrative AD.
2.1. AD-Based Test Case Generation
Previously, ADs have been mostly regarded as a modeling tool for business processes and workflows. However, ADs have a reach symbolic vocabulary that plays a significant role in specifying low-level system behaviors, which can be manipulated by automatic means for generating test cases. Currently, an extensive body of literature describes different strategies for using the ADs of the SUT for automated test case generation [6,7]. However, most of the studies have investigated mainly by identifying abstract test scenarios (the sequence of activities) without clearly specifying their test data generation method [25,26,27,28]. The most important aspects of identifying test cases are the decision on what behavior of the system to test with what data values. According to a systematic mapping study [7] on MBT using UML ADs, some of the commonly adopted methods for test data generation are category-partition, combinatorial logic coverage, data-object trees, and condition-classification trees. For instance, a gray-box method was proposed [29] to use a UML AD to generate test cases directly from ADs without the cost of creating an extra test model. That study adopted the category-partition method to generate a rational combination of input values and output values. Another UML AD-based test-case generation technique [30] transformed an AD into software success and fault trees using combinatorial logic coverage for test data generation. Data-object trees were also proposed for test data generation [31], along with a condition-classification tree method [10]. Another study on semantics and verification of data flow in activities was performed by [32]. The study defines formal semantics of ADs in UML 2.0 covering control flow, concurrency, and data flow.
Most previous papers are poorly stated and do not precisely specify the test input generation methods. Furthermore, the support for those proposed approaches used very simple examples. Moreover, the results reported by those studies are mainly concerned with control flow-based testing issues from the HLBP. In this study, we examine the ADs from a lower level (system level behavior rather than business processes and workflows) to explicitly analyze the flow of data among activities. We also perform an experimental investigation using relatively extensive open-source systems.
2.2. Evolutionary Approaches Using Metaheuristic Algorithms
The search-based technique using metaheuristic optimization algorithms for test case generation is common in the existing literature [19,33,34]. A recent study [35] used metaheuristic algorithms to adapt a model checker for integration testing of systems specified by graph transformation and generate a test suite that satisfies all def-use coverage criteria. In addition, several studies suggested model-based test-case generation and prioritization using ADs and GAs. For instance, [36] applied a GA to prioritize test case scenarios generated from UML ADs by identifying the critical path clusters. Other test-case prioritization techniques in the context of model-based testing using ADs and GAs were proposed in [37] and [38]. A UML AD-based approach using an evolutionary algorithm for transition sequence exploration is presented in [39]. It generates test cases that include both test scenarios and test data. Lately, a so-called bio-inspired methodology using the ant colony algorithm applied on concurrent subpart of ADs to identify different feasible test scenarios [13]. The study is inspired by the food search pattern of an ant for exploring paths to reduce duplicity in the test scenarios.
In conclusion, a large body of literature uses the ADs of the SUT for automatic test-case generation with different strategies, including search-based metaheuristic algorithms. Currently, AD-based testing methods focus on test automation mainly from the HLBP, analyzing control flow information that is missing important aspects (data flow). Previously, we performed an experimental investigation of data flow annotated activity diagram (DFAAD)-based testing [24], in which the flow of data is explicitly annotated in the ADs of the SUT manually to investigate the feasibility of using ADs to meet the data flow coverage criterion. Regarding the application of the search-based technique, our study differs from the existing studies because we follow a different approach using a different fitness function that enforces maximum coverage of def-use pair paths.
2.3. Revisiting Data Flow Representation and Concepts in ADs
This section presents the background for this study, revisiting the data flow representation and concepts in ADs [23] and providing an example and related definitions.
An activity is a behavior specified as a sequence of subordinate units using a control and data flow model [18]. Actions are executable nodes required for any significant capability of an activity; they embody lower-level steps in the overall activity. Action notation appears only in the AD and is central to the data flow aspects of activities [18]. Actions can invoke other behaviors and operations, access and modify objects, and perform more advanced coordination of other actions. For example, Figure 1a has two actions: a CreateObject action that creates an object of type Activity B and a CallBehavior action that calls Activity B. Actions also have a specialized form of object nodes (Pins) so that object flows can get and provide data. For example, Figure 1b has a SendObject action that sends an object via its output Pin and another action that gets the object via its input Pin and manipulates its contents.
These object flows provide the primary means for exchanging data between activities. Activities also introduce parameters and structural features or variables. As depicted in Figure 1c, the use of variables in an AD effectively provides indirect data flow paths from the point at which a value is written to the variable to all the points at which the value is read from the variable [18]. By analyzing an action sequence and its behavior and using the information in action Pins, activity parameters, and decision constraints, it is possible to automatically track the flow of data among activities in an AD.
Definition 1.
An AD is a directed graph that can be described formally as an activity model, M = (A, E, C, V, aI, aF) where:
- -
- A = {a1, a2, …., an} is a set of executable nodes (actions are the only kind of executable node, and object nodes are attached to actions as action Pins by executable nodes; we indicate the lower-level steps in the overall activities).
- -
- E denotes a set E of edges, where E ⊆ {A x A}.
- -
- C = {c1, c2, …., cn} = DN ∪ JN ∪ FN ∪ MN is a set of control nodes such that DN is a set of decision nodes; JN is a set of join nodes; FN is a set of fork nodes, and MN is a set of merge nodes. In terms of data flow, DN is analogous with predicate use.
- -
- aI is an initial activity node, where aI ⊆ A and aI ≠ Ø.
- -
- aF is a set of final nodes, where aF ⊆ A and aF ≠ Ø.
- -
- V = {v1, v2, …., vi} is a set of variables s.t. V includes both object variables and structural attributes (variables).
Definition 2.
Variables can appear in different contexts in an AD. Let M be a model that has a set of variables V:
- -
- Variable vi ∈ V is defined in node an of M, indicated as , meaning that variable vi is defined in node an if vi is initialized in the corresponding node or its value has been modified by the execution of a certain action.
- -
- Variable vi ∈ V is in predicate use (pu) in decision node dn of M, indicated as , meaning that variable vi is in pu in decision node dn if it appears as a constraint of DN.
- -
- Variable vi ∈ V is in computation use (cu) in node an of M, indicated as , meaning that variable vi is in cu in node an if the corresponding node behavior is involved in any sort of computation.
3. AutoTDGen Approach
This section introduces the main concepts and activities for automatic test-data generation using the AD and search-based technique. In our approach, tests are generated directly from the ADs of the SUT without converting them into another graphical intermediate test model. However, the ADs are converted into Extensible Markup Language (XML), and the XML documents are represented as an ElementTree (ET) using a Python built-in library for the ease of reading and manipulating the automatic data flow analysis.
Figure 2 illustrates the major activities in our approach, including the associated input and output artifacts. The plus sign indicates a newly introduced activity, and the activity without a plus sign is an extension from our previous study. Taking the ADs of the SUT as input, the ADs are converted into XML documents, and the XML documents are parsed as an ET. Using the ET, the flow of data among the activities in each AD is automatically analyzed to identify the def-use pairs. Finally, a GA is applied to generate test data and make the test cases executable. Each activity is described in more detail in the following subsections.
3.1. Convert ADs into XML
For automatic manipulation of the ADs for data flow analysis, the first step is converting the AD models into XML. Depending on the UML modeling tools used, converting an AD model into an XML file is as straightforward as a few simple clicks. Most UML modeling tools, including the one we used, support the easy export of models in XML format.
3.2. Parse XML to ElementTree
XML documents originally use a hierarchical data format that can easily be represented as a tree-like structure. Figure 3 shows a high-level schematic diagram of an XML document represented as an ET. As depicted in the figure, the ADs contain four major elements that are useful for data flow analysis: Activity element, Action element, ActionPin element, and Decision element, each of which has properties, links, and tags.
3.3. Automatic Data Flow Analysis and Test Data Generation
This section presents the main idea of our study: automatic data flow analysis and search-based test data generation using a GA. The test data are generated in terms of the data flow coverage criterion, specifically all definition use coverage. The flow of data among activities is directly identified from the ADs of the SUT without transformation into an intermediate test model. Section 3.3.1 describes the automatic data flow analysis, specifically the algorithm for generating def-use pairs. The GA and its fitness function for test data generation are provided in Section 3.3.2.
3.3.1. Data Flow Analysis
This subsection presents how the flow of data among activities in an AD is analyzed automatically. Algorithm 1 describes the generation of def-use pairs from an AD represented as an ET.
| Algorithm 1.ExtractDuPairs (M, c, ai, v, P[]: The algorithm for automatically generating the def—use pair paths. |
 |
The algorithm takes a model M of an AD in the form of an ET; a given node c, which is the current node from which the tester wants to initiate the search; an initial node ai; an object variable v; and a path P. Starting from the given node c in M (and ensuring that c is not in P), the algorithm checks the properties for the corresponding node c. If v is not in def, the algorithm appends c to P, sets the incoming node as the current node, and makes a recursive call. The iteration continues until it finds a node in which v is in def and returns the discovered def-use pair path P. The algorithm also checks whether the path P is subsumed by another path or not via comparing the currently discovered P with the one previous appended to the list L. The subsumed relationship indicates the reachability of a path concerning individual test data. As depicted in Table 1, if the path P is subsumed, its prefix is set to Y which means that the path P is subsumed and appends the discovered path P to the list L. Otherwise, its prefix is set to N, meaning that the path P is not subsumed and appends the discovered P to L. Simply put, the algorithm finds the def of vi used in a given node anywhere in the model by searching backward or forward based on the tester’s preference.
An example of generated def-use pair paths is depicted in Table 1. To save space, the textual element names are denoted as numerical values except for the decision element that includes guard conditions used to guide the search. The prefix “Y” signifies that the def-use pair is subsumed by another path, and the prefix “N” means that the def-use pair is not subsumed by any other path or paths. The corresponding AD for Table 1 is provided in Figure A1, the appendix section (Appendix A).
3.3.2. Test Data Generation
After the def-use pairs are automatically identified from the ADs of the SUT, the GA is used as a search algorithm to generate an optimized set of test data for satisfying the data flow coverage criterion.
Genetic Algorithms: A basic GA starts with randomly initializing the population, which is a set of solutions. A fitness function is used to evaluate the fitness of an individual. The individuals are chosen based on their measured fitness scores. Then the selected individuals are going throw the process of crossover and mutation for mating and altering the offspring. The fitness evaluation, selection, crossover, and mutation steps are repeated until the stopping criterion is met or the maximum resources are spent [40]. A key aspect of generating test data using GA is designing a fitness function to determine how the test data generated by the GA fit the desired solution (the target def-use pairs). Thus, designing an appropriate fitness function to guide the search is the key to the entire search-based test data optimization technique.
Fitness Function: In this paper, we focus on data flow coverage as the test coverage criterion, but our proposed technique is not limited to a certain test criterion. It can be generalized to any test criterion. In data flow-based testing, an individual test datum can satisfy more than one def-use pair (Table 1). Thus, to guide parent selection and evaluate how the test data generated by the GA cover the target def-use pairs, we designed a fitness function that rewards maximum coverage of def-use pairs. For example, if more than one def-use pair is reachable and subsumed by another def-use pair, the prefix guides the algorithm to reward the one that is not subsumed or dominated.
To guide the search toward the target def-use pairs, we use the def-use pair coverage level (DUPCL) and the guard condition distance (GCD) for the fitness function. The DUPCL is calculated based on the number of def-use pairs covered by an individual test datum, and the GCD is calculated using the guard condition in the activity DN (Definition 1). The guard conditions are value specifications that are commonly used in DN. The GCD heuristic is used for test data generation and evaluates how close a decision in an activity is to being estimated as satisfied or not satisfied. For instance, if we consider a guard condition [id ≥ 6], in a decision clause “id” with the value id = 2, the guard condition distance will be calculated as 6 – 2 + n, with the number n > 0. The GCD is normalized to guarantee to maximize the def-use pair coverage as well as to ensure that all the def-use pairs are adequately covered. Some of the common normalization techniques for structural criteria like branch distance and their importance is discussed by [41]. Our designed fitness function rewards the test cases that are very close to the guard condition boundary. Guiding the search towards generating test data that are very close to the boundary has further the advantage of allowing to easily generate follow-up test data by simply adding or subtracting a small number from the original data so that tester can select multiple test cases for testing the invalid boundary domain as well.
For example, in a guard condition [sales ≥ 1000], a test data t = 1799 will have the fitness value f = 1.27 regardless of both satisfying the guard condition and def-use pairs, whereas, t = 1001 will have a fitness value f < 1 depending on the number of def-use pairs covered. The def-use pairs coverage fitness function to minimize the DUPCL and GCD for an individual vi and a target def-use pair (dup) is defined as:
To optimize the def-use pairs coverage it is important to make sure that all the def-use pairs are covered. Therefore, the function is defined as:
where:
Here, Ttar is the total number of target def-use pairs to be covered related to a specific object variable, Ccov refers to the targets covered by an individual vi, Tttcov is the total number of remaining target def-use pairs after the Ccov subtraction, and len (L) is a constant for normalizing the DUPCL [0,1], where L is the entire set of target def-use pairs. It enables the search algorithm to yield an optimal solution wherever a guard condition is covered for a specific target def-use pair and keeps searching to find a solution for the remaining targets. Hence, an individual is considered to be optimal when it covers at least one target def-use pair and its fitness value is .
In the following example, consider the dup set (8, sales) in Table 1, which has a total of six def-use pairs associated with it, when len (L) = 5. The variable sales is in the form of a function composition such that the range of three variables (locks, stocks, and barrels) is its domain. That is, three individuals are involved in this case, one for each variable, and they must be adjusted to calculate the fitness (e.g., locks × 45 + stocks × 30 + barrels × 25 = sales).
As shown below in Equation (2), the guard condition involved in this case is [sales ≥ 1800]; the individuals searched by the algorithm to satisfy the GCD are 24, 14, and 12 for locks, stocks, and barrels, respectively; the Ccov of these individuals is recorded as 3; and the fitness is calculated . In this example, the GCD has been covered, and the fitness, , indicating that targets remain to be covered. As shown below in Equation (3), because Tttcov = Ttar − Ccov = 3, the guard condition involved in this case is [sales ≥ 1,000], and the solutions (individuals) found by the algorithm are 4, 4, and 28. The Ccov of these individuals is 2, and the fitness is calculated as , indicating that still more targets need to be covered. That evaluation process is repeated until . As shown below in Equation (4), when the fitness reaches zero, the test data covering all def-use pairs associated with the variable sales have been optimized. The example in Equation (5) shows a situation in which neither the guard condition is covered nor the DUPCL has reached zero. Therefore, , indicating that the individuals are not optimal test data.
The overall fitness function to minimize a set of test data V on a set of def-use pairs L is thus as follows:
Search Operators: From a high-level, GAs are mostly similar for creating a solution to all kinds of engineering problems. When it is used to solve a specific problem, the search operators need to be adjusted accordingly. Hence, we have defined the search operators as follows.
Selection: The selection is used to pick individual test data from the current test data population set as parents of the next generation. We have used the tournament selection strategy to pick a random number of test data from the current test data population set, then pick the one with the best fitness value from that group and repeat until the pool is completed. Simply put, we select n number of test data (individuals) from the test data population, and based on the ranking of their fitness values, we pick the fittest individual from the n individuals as the next generation which then goes through crossover and mutation and the steps are repeated until we have the final candidates passing to the next generation.
Crossover: The crossover operator is used to create two new test data offspring from the two parents. We have used a single-point crossover operator in which we first select the two target parents and then randomly select the crossover point p (p = 0 to n − 1).
Mutation: The test data mutation is performed after the crossover operation using the uniform mutation strategy, with the mutation probability p = (1/pop_size). In this case, every individual test data has an equal probability to undergo mutation. We pick a random integer “count” from (2, Len(genes) and calculate its initial fitness value. While the count is greater than zero, we select two random samples a and b from the current population, swap the two samples, calculate the fitness value, if the calculated fitness value is greater than the initial fitness, then the mutation is performed.
Table 2 summarizes the generated test data and associated information for all the def-use pairs in Table 1. The table displays the object variable, the target def-use path set, the generated optimal test data (individuals) with the best fitness, the correlated guard condition, and the number of def-use pairs covered with an individual.
As an example, Figure 4 shows a snapshot of the test data generated for variable locks. The figure displays the object variables and their associated test data (individuals) generated by the algorithm, the calculated fitness value, the number of def-use pairs covered by each individual, and the related guard conditions, as well as the time spent. As can be seen in the figure, the algorithm’s run time for generating the test data is very short. Although the algorithm runs several times, it does not affect the execution time. The efficiency of this automated test data generation is thus not comparable with the manual generation of test data by humans, and we will not further consider its cost-effectiveness or efficiency in contrast to manual test-data generation.
4. Experiment Description
Our goal for this experiment was to assess and compare AutoTDGen with two alternative approaches, DFAAD and EvoSuite. Following existing guidelines for empirical studies [42,43] and experimental investigations [44] in software engineering, we here detail the experiments we carried out to assess the proposed AutoTDGen and answer our four research questions (RQs). The experimental subjects are described in Section 4.1. Section 4.2 presents the experiment planning, including the RQs, baseline and variable selection, mutation seeding, and experimental protocol. The experiment was carried out following the major activities given in Section 4.
4.1. Experimental Subjects
The context of our study is a manual selection of the three java implemented open-source software systems that we used in our previous experiment on DFAAD [24]. The Elevator and Cruise Control systems were chosen from the Software-artifact Infrastructure Repository, an open-source repository of software-related artifacts for experimentation. The Coffee Maker system is used as an example of black-box testing by the North Carolina State University (NCSU) computer science department. Table 3 summarizes the three experimental subjects in more detail, showing their size in terms of lines of code and number of classes. The table also reports the minimum, mean, and maximum number of branches, statements, and mutants for each subject, which indicates the complexity properties of the subjects.
Admittedly, the size of our experimental subjects (the line of code (LOC) and number of classes) is not very large. In fact, finding large open-source software systems with all our requirements (e.g., use cases) and design artifacts (e.g., class diagrams, sequence diagrams) is quite difficult. Understanding and modeling system behavior without the availability of such documentation is very difficult. However, as also stated in [45], it is important to remember that in model-based development, ADs are used to model the intended behavior of the SUT in individual use cases rather than modeling the whole system in a single AD. Therefore, even when the subject systems are small, the ADs can be quite large and complex in terms of the flow of control among activities, decision constraints, activity parameters, etc.
Because the task of generating the ADs of the SUT manually is quite time-consuming, as detailed in a systematic mapping study for MBT using ADs [7], most of the existing literature used small examples for validation. In our previous experiment, we also considered those systems to be adequate in terms of their size and complexity [24,45]. Because the three systems used in [45] are very similar in terms of the system behavior, we used the Coffee Maker instead of OrdSet to ensure the diversity of the subjects for better assessment, especially when comparing AutoTDGen with EvoSuite.
4.2. Experiment Planning
This section presents our experimental plan: the RQs, baseline selection, mutant seeding, and experimental protocol.
4.2.1. Research Questions
The goal of this experiment is to assess and compare AutoTDGen with the two alternative approaches (Section 3). Hence, its evaluation against alternative approaches depends on several variables. By taking these variables into account for testing the proposed technique against the defined goal, referring to the guideline on how to from RQs [42], the experimental investigation aims to empirically address the following RQs:
- RQ1: How do the tests generated by the proposed AutoTDGen perform, compared with alternative approaches, in terms of statement and branch coverage?
- RQ2: What is the difference in fault detection effectiveness between the tests generated by the proposed AutoTDGen and alternative approaches?
- RQ3: Is there any variation in the types of faults detected by the proposed AutoTDGen and alternative approaches?
- RQ4: What is the interaction relationship between the test coverage and fault detection effectiveness of the adopted techniques and subject properties?
RQ1, RQ2, and RQ3 compare the proposed AutoTDGen with alternative approaches in terms of the percentage of coverage attained and the test effectiveness, indicated by the proportion of artificially seeded faults (mutants) detected and variations in the types of faults detected (e.g., various mutation operators). RQ4 investigates whether the performance of the applied testing techniques is affected by the properties (e.g., complexity, concurrency, or real-time behavior) of the subject systems.
4.2.2. Baseline Selection
To answer our RQs, we selected the following two testing techniques for comparison with AutoTDGen:
DFAAD: An experimental investigation of data flow annotated AD-based testing from our previous study [24]. In DFAAD, the flow of data is explicitly marked manually across the ADs of the SUT. We used DFAAD to investigate the feasibility and benefits of using ADs to derive test cases for data flow testing. The previous study converted the ADs into an intermediate test model, a data flow graph, and provided the test inputs manually. Therefore, we used DFAAD as a baseline for our RQs.
EvoSuite: An open-source test suite generator for Java classes that uses an evolutionary approach based on a GA [20,46]. EvoSuite has been evaluated in various open-source and industrial software systems. In academia, particularly in search-based testing, EvoSuite is considered to be a state-of-the-art testing tool.
To investigate the possible benefits gained when the test data generation process is automated and test cases are optimized, DFAAD is a reasonable baseline for comparison. Since DFAAD is a manual model-based approach and closely related, it well confirms our need as a baseline. We found it difficult to choose other AD-based testing techniques from the literature as a baseline, because either they are poorly stated or follow a different approach that requires lots of effort to draw the ADs for larger subject systems. In addition, to test the claim that test automation should not come at the cost of losing test quality, we found EvoSuite to be another good baseline, because EvoSuite is a white box state-of-the-art test automation tool empowered with GA which also won the 2017 SBST tool contest [47]. There are also possibilities for selecting other techniques or tools as a baseline. However, there are also possibilities that these approaches may introduce confounding factors that cannot be controlled due to the usage of varying approach or the implemented methods, which may pose a threat to internal validity [44]. The motivation behind choosing the DFAAD and EvoSuite as the alternative approaches is to avoid possible confounding factors.
4.2.3. Fault Seeding
Finding subject systems of suitable size and properties with real faults to assess test techniques is difficult. Even if subjects with real faults exist, their faults are not diverse enough to be valuable for an experimental investigation. One solution to this problem is seeding a large number of distinct artificial faults either manually or automatically. A study on the appropriateness of fault seeding for experimental studies suggested that artificially seeded faults are adequately similar to real faults [48].
Because manually seeding a large number of faults is difficult, we applied pitest (PIT), a mutation testing tool, to introduce faults into the SUT automatically. PIT is a state-of-the-art mutation testing tool that is fast and scalable. In our experiment, we used the default mutator group: Conditional Boundary Mutator, Increments Mutator, Invert Negatives Mutator, Math Mutator, Negate Conditionals Mutator, Return Values Mutator, and Void Method Call Mutator. The reliability of PIT was demonstrated against other mutation testing tools in [49].
4.2.4. Variable Selection
In this experiment, the independent variable is the approach applied as a basis for test generation (AutoTDGen, DFAAD, or EvoSuite). Our dependent variables are the percentage of statements and branches covered, fault-detection effectiveness (the number of faults detected/failed to detect), and the type of faults detected (faults related to different mutation operators).
4.2.5. Parameter Setting
The following are the experimental settings performed comparatively well in our case. However, the initial population, the mutation rate, and the crossover probabilities can freely experiment using different input parameters.
- Population size: The initial population is 2000, a set of valid integer test data in the range of 1 to 2000.
- Crossover: As a crossover operator, we use a single-point crossover, and the crossover probability is determined based on the fitness value.
- Mutation: We perform the mutation using a uniform mutation strategy, with the mutation probability p = (1/population size). Where the population size is the number of test data to be mutated.
- Selection: The selection strategy we use here in this experiment is the tournament selection, with the pool size equal to 20.
4.2.6. Experimental Protocol
Our experiments compared the proposed AutoTDGen with the two baselines as alternative approaches. Traditionally, the effectiveness of a test is measured based on the proportion of statements, lines, or branches covered. However, that coverage measures only which part of the code is executed. In other words, a higher statement or branch coverage might not always reflect the actual effectiveness of a test. Therefore, we performed mutation testing to inject artificial faults into the SUT and ensure that all the statements or branches have truly been tested.
To answer RQ1 and RQ2, the statement coverage (SC), branch coverage (BC), and fault detection (FD) ratio were measured as follows:
A high fault-detection ratio indicates that an approach is effective. All the testing techniques were applied to the three subject systems with the same number of seeded faults. We expected AutoTDGen to achieve a higher mutation coverage than EvoSuite and DFAAD.
5. Experimental Results
This section presents the results of the experiments by answering the RQs. Table 4 summarizes the overall SC, BC, and FD results achieved by the three techniques across the subject systems.
RQ1: How do the tests generated by the proposed AutoTDGen perform, compared with alternative approaches, in terms of statement and branch coverage? The results presented in Table 3 for SC indicate that AutoTDGen performed slightly better than DFAAD and EvoSuite on two subjects, although EvoSuite had the best SC coverage (one hundred percent) in one subject (Coffee Maker). In terms of BC, AutoTDGen achieved greater BC than EvoSuite in only a single subject (Elevator), but it outperformed DFAAD in all subjects. On the other hand, except for the Elevator system, EvoSuite performed very well in terms of BC. The average coverage achieved by EvoSuite was higher than that of DFAAD, but AutoTDGen performed better on average, with an improvement in covered branches of 3.67 percent. Thus, on average, AutoTDGen achieved higher or nearly equal branch and statement coverage compared with both DFAAD and EvoSuite. However, as reported in Table 3, the magnitude of the differences is small.
RQ2: What is the difference in fault detection effectiveness between the tests generated by the proposed AutoTDGen and alternative approaches? The overall results for fault detection effectiveness are also reported in Table 3. AutoTDGen outperformed both EvoSuite and DFAAD in all experimental subjects, with a mean effectiveness difference of 31.53 percent and 8.23 percent, respectively.
To provide a better view of fault detection effectiveness, Figure 5 highlights the number of detected and failed to detect faults as well as the fault detection ratio across subject systems and applied techniques. As shown in Figure 5, the best fault-detection result achieved by AutoTDGen was for Elevator, which is large and complex with 247 seeded mutants, of which AutoTDGen detected 212 mutants, compared with 60 and 172 mutants detected by EvoSuite and DFAAD, respectively. The reason for that difference is further discussed below.
RQ3: Is there any variation in the types of faults detected by the proposed AutoTDGen and alternative approaches? The types of fault detected across the experimental subjects and techniques are reported in Table 5, Table 6, and Table 7. The tables list the total number of faults (mutants) seeded per mutation operator, the number of faults detected, the number of failed to detect faults, and the percentage of faults detected per mutation operator by each technique. The best results for each condition are bolded.
RQ3 investigates whether AutoTDGen is more likely to detect certain types of faults compared with the alternative approaches. The results indicate a great variation in the number and types of faults detected by the applied techniques. For instance, out of the 30 MM seeded faults for the Elevator system, 26 faults were detected by AutoTDGen and 14 faults were detected by DFAAD, but none of the MM faults seeded in the Elevator system were detected by EvoSuite. In summary, the results indicate that AutoTDGen better detected certain type of faults (e.g., MM, INM, CBM) than the two alternative approaches.
RQ4: What is the interaction relationship between the test coverage and fault detection effectiveness of the adopted techniques and subject properties? In terms of fault detection effectiveness, the results indicate a remarkable relationship between the subject properties and adopted techniques. Among the experimental subjects, the Elevator system is peculiar and difficult to test due to its concurrency and complex behavior, and AutoTDGen managed to detect more of its faults than the other techniques. On the other hand, in terms of statement and branch coverage, the results showed no notable relationship between the performance of a technique and the properties of the subjects, though the small improvement attained by AutoTDGen in terms of the statement and branch coverage was in the Elevator system. Furthermore, the DFAAD and AutoTDGen performance on SC and BC was comparatively consistent across the subjects, whereas the EvoSuite performance varied from subject to subject depending on the subject properties. Specifically, EvoSuite achieved poor SC for Elevator and the best coverage for Coffee Maker.
In summary, the reported results indicate that the concurrency, dynamicity, and complexity of the subjects are a good indicator of the adopted technique’s capability for fault detection. However, unlike the fault detection capability, the statement and branch coverage performance of the techniques were not much affected by the properties of the subjects.
6. Discussion
Our experimental results showed slight differences among the three test generation techniques in terms of the statement and branch coverage. EvoSuite is a powerful tool for maximizing statement and branch coverage, in some cases achieving even greater coverage than AutoTDGen and DFAAD. Although the notable improvement accomplished by AutoTDGen was for Elevator, overall, the reported results indicate that the properties of the experimental subjects do not have much effect on the statement and branch coverage performance of the applied test generation techniques. For example, despite the real-time behavior and complexity of the Elevator system over Cruise Control and that of Cruise Control over Coffee Maker, which provides comparatively simple functionality, all three applied test techniques achieved entirely satisfactory coverage of all three subjects. However, it is important to remember that the statement and branch coverage measures only which statements or branches are executed by the test; it does not fully reflect the completeness of the test.
The experimental results indicate that AutoTDGen outperformed both EvoSuite and DFAAD for all experimental subjects in fault detection. Unlike the statement and branch coverage, this result shows that the properties and functionality of the experimental subjects affect the fault detection effectiveness of the applied testing techniques in important ways, as shown by Figure 5 and the percentage and number of faults detected and failed to be detected by each technique.
The three applied test techniques showed an important variation in the types of faults detected. Because the experimental subjects with complex properties involve more computation, they have more computational-related operators (MM). AutoTDGen and DFAAD outperformed EvoSuite in detecting computational-related faults, possibly because of the modeling capability of ADs in capturing the concurrency and real-time properties of the system, which could allow the AD-based techniques to generate more suitable tests than EvoSuite when the criteria are well-defined.
Summary: Our main observation is that when the complexity of the experimental subjects increases, EvoSuite tends to have lower fault detection capability than AutoTDGen and DFAAD, as shown by EvoSuite’s large number of undetected MM faults across experimental subjects, especially in the case of Elevator, where it had zero coverage. On the other hand, AutoTDGen and DFAAD are good at handling the real-time behaviors and properties of the SUT. Therefore, EvoSuite needs further improvement to handle concurrency and real-time behaviors. Overall, an important variation between the applied techniques regarding the types of faults detected is that the proposed technique detected more computation-related faults than the other techniques. The results also show a relationship between the performance of the adopted techniques and the properties of the subjects such that the proposed technique tends to have better fault detection capability as the system complexity increases. Our results also show that the difference between DFAAD and AutoTDGen is relatively small. However, the first one is manually generated and the latter is automated, so even a small difference can lead to a much greater efficiency.
7. Threats to Validity
This section discusses four possible types of threats to the validity [42] of our experimental results.
External Validity. A common threat to external validity in all experimental studies is the size and types of SUT used. A lack of available open-source systems with sufficient specifications and design artifacts limited our study to small experimental subjects. Despite our best effort in manually selecting experimental subjects that varied by size, behavior, and complexity, our study did not escape this threat to validity. However, in model-based practice using ADs, software systems are not modeled in a single AD, and even small systems can have very complex ADs.
Construct Validity. A threat to construct validity could be that we applied PIT, an automatic mutation testing tool, to generate synthetic faults. Using systems with real faults or seeding faults manually, or even using different mutation testing tools might yield different results. However, in software testing experiments, mutation testing (injecting artificial faults into the SUT) has become a common practice because finding systems with real faults is difficult. Previous studies have claimed that artificially injected faults are adequately representative of real faults [48,49], and no contradictory results have yet been reported.
Internal Validity. Keeping in mind that in MBT, the quality of the test is always directly related to the quality of the test model, a threat to internal validity could be related to the individuals modeling the SUT, which could influence the extracted results. A poor modeling exercise in practice could lead to different results.
Conclusion Validity. A major threat to conclusion validity in our study is a lack of statistical analysis. To better specify our experimental goals, we could have performed hypothesis testing. However, because our results are quite intuitive and the differences are notable, we believe such statistical testing is unnecessary.
8. Conclusion and Future Work
Currently, with the ever-increasing software complexity, automation of the testing tasks has become a must. The existing literature has applied various search-based metaheuristic algorithms to speed up the test case generation process. However, the increase in test automation has come at the cost of poor test quality. In this paper, we have presented a search-based technique to automatically generate test data for data flow testing using ADs and a GA. Our experimental investigation used three open-source systems to compare and assess the applicability of the proposed technique against two alternative approaches. The experimental results show the superiority of the proposed technique in terms of fault detection effectiveness, as indicated by an improved fault detection ratio. However, in terms of statement and branch coverage, the results indicated no significant differences among the applied techniques.
Even though the experimental data indicate that this approach has better fault detection capability, our technique could be further investigated and improved. For instance, further investigation could be conducted using different software systems with varying complexity and size. Moreover, our prototype tool can be extended and improved to incorporate other kinds of search heuristics algorithms. In the future, we intend to extend our approach by incorporating different kinds of search heuristics. Following the extension of our tool, which is currently in an early prototype stage, with extra search heuristics, we want to further evaluate it against other baselines using even more comprehensive subject systems from different domains.
Author Contributions
Conceptualization, A.J. and J.L.; methodology, A.J, and J.L, investigation, A.J.; writing—original draft preparation, A.J.; writing—review and editing, J.L., and C.-J.Y.; supervision, C.-J.Y., and J.L.; All authors have read and agreed to the published version of the manuscript.
Funding
This research received no external funding.
Conflicts of Interest
The authors declare no conflict of interest.
Appendix A
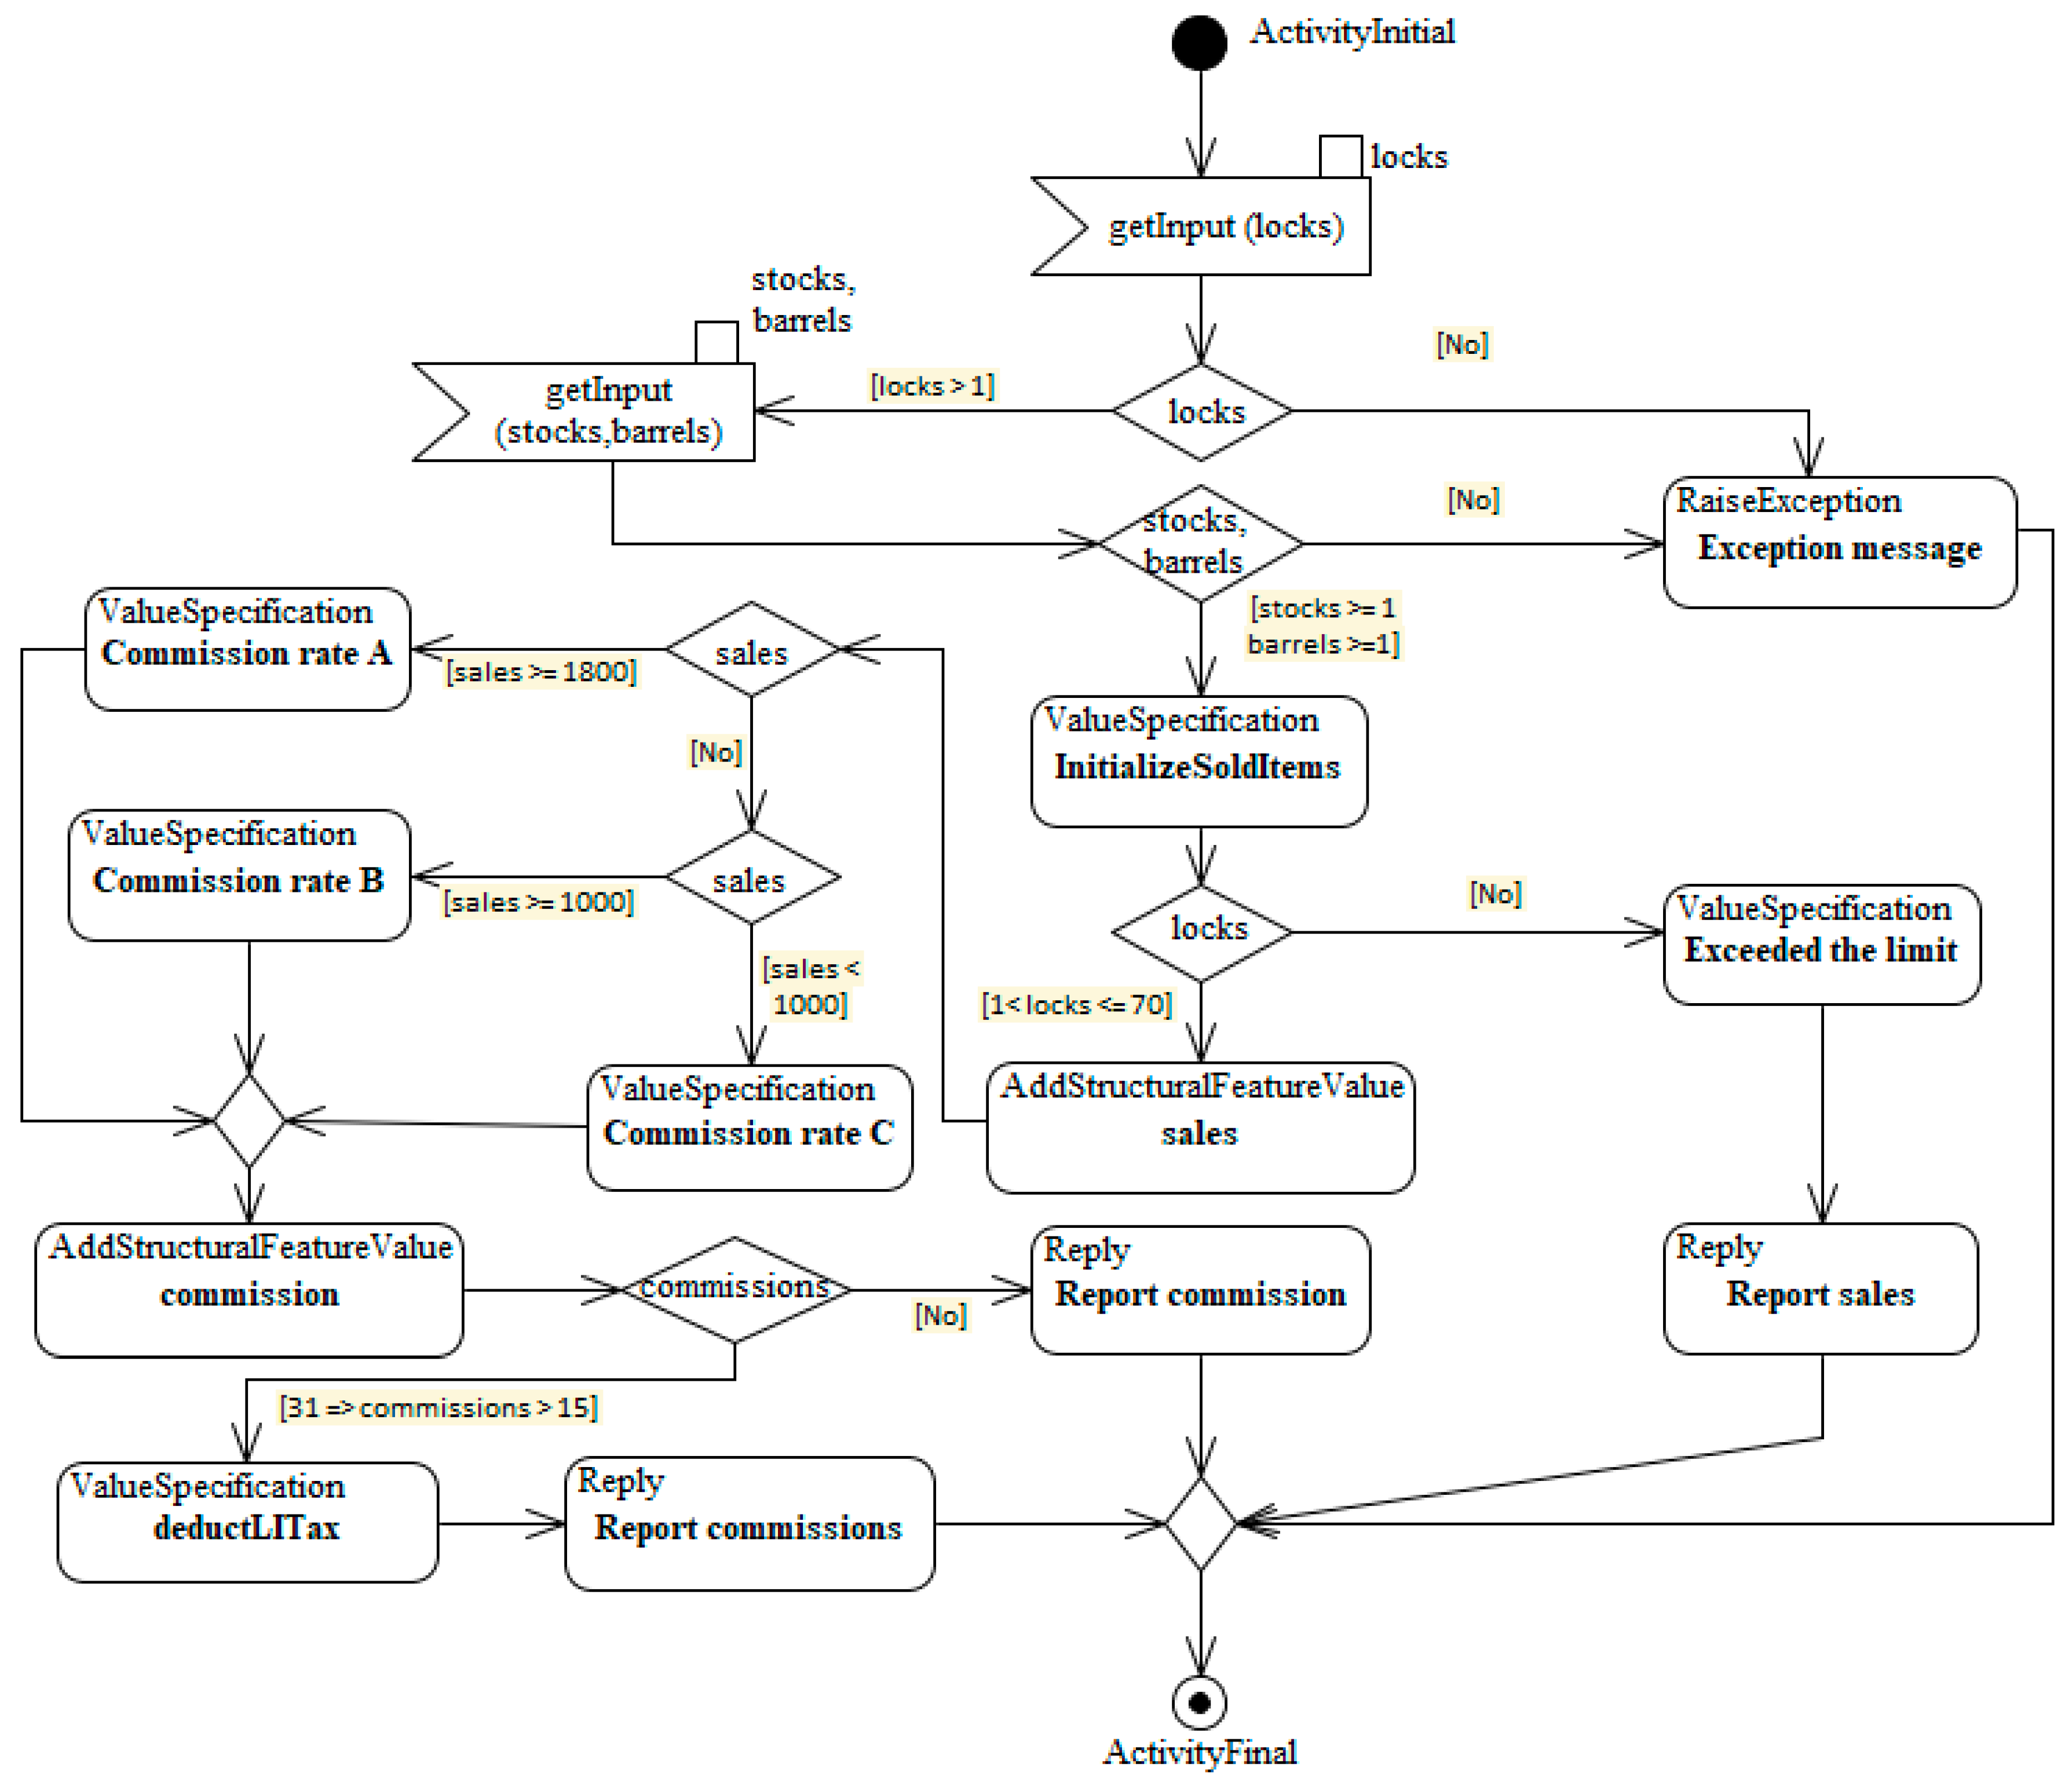
As a running example, we have used the commission problem, which is a simple commercial computing application. This problem is well suited for data flow testing, due to its interesting mixed functionalities of both computation and decision-making. The purpose of the application is to compute the sales and commission for the numbers of rifle items sold by a salesperson monthly. The seller has to sell at least one item (lock, stock, barrel) per month. The limit for the number of locks to sell is seventy locks for a month. The salesperson will be given a 10% commission for sales less than or equal to $1000, 15% for the extra $80, and 20% for sales over $1800. Figure A1 illustrates the commission problem AD. The diagram will be used as an example in the subsequent sections.
Figure A1.
The commission problem activity diagram.
References
- Ali, S.; Iqbal, M.Z.; Arcuri, A.; Briand, L. A search-based OCL constraint solver for model-based test data generation. In Proceedings of the 11th International Conference on Quality Software (IEEE 2011), Madrid, Spain, 13–14 July 2011; pp. 41–50. [Google Scholar]
- Utting, M.; Legeard, B.; Bouquet, F.; Fourneret, E.; Pereux, F.; Vernotte, A. Recent advances in model-based testing. Adv. Comput. 2016, 101, 53–120. [Google Scholar]
- Utting, M.; Legeard, B. The challenge. In Practical Model-Based Testing: A Tools Approach; Elsevier Inc.: San Francisco, CA, USA, 2007; pp. 1–18. [Google Scholar]
- Schieferdecker, I. Model-Based Testing. IEEE Softw. 2012, 29, 14–18. [Google Scholar] [CrossRef]
- Jorgensen, P.C. The Craft of Model-Based Testing; CRC Press: Boca Raton, FL, USA, 2017; pp. 3–13. [Google Scholar]
- Shirole, M.; Kumar, R. UML behavioral model based test case generation: A survey. ACM SIGSOFT Softw. Eng. Notes 2013, 38, 1–13. [Google Scholar] [CrossRef]
- Ahmad, T.; Iqbal, J.; Ashraf, A.; Truscan, D.; Porres, I. Model-based testing using UML activity diagrams: A systematic mapping study. Comp. Sci. Rev. 2019, 33, 98–112. [Google Scholar] [CrossRef] [Green Version]
- Felderer, M.; Herrmann, A. Comprehensibility of system models during test design: A controlled experiment comparing UML activity diagrams and state machines. Softw. Qual. J. 2019, 27, 125–147. [Google Scholar] [CrossRef] [Green Version]
- Boghdady, P.N.; Badr, N.L.; Hashim, M.A.; Tolba, M.F. An enhanced test case generation technique based on activity diagrams. In Proceedings of the 2011 International Conference on Computational Science (IEEE ICCS 2011), Singapore, 1–3 June 2011; pp. 289–294. [Google Scholar]
- Kansomkeat, S.; Thiket, P.; Offutt, J. Generating test cases from UML activity diagrams using the Condition-Classification Tree Method. In Proceedings of the The 2nd International Conference on Software Technology and Engineering (ICSTE 2010), San Juan, PR, USA, 3–5 October 2010; pp. V1-62–V1-66. [Google Scholar]
- Kundu, D.; Samanta, D. A novel approach to generate test cases from UML activity diagrams. J. Object Technol. 2009, 8, 65–83. [Google Scholar] [CrossRef]
- Nayak, A.; Samanta, D. Synthesis of test scenarios using UML activity diagrams. Softw. Syst. Model. 2011, 10, 63–89. [Google Scholar] [CrossRef]
- Arora, V.; Singh, M.; Bhatia, R. Orientation-based Ant colony algorithm for synthesizing the test scenarios in UML activity diagram. Inf. Softw. Technol. 2020, 123, 106292. [Google Scholar] [CrossRef]
- Badlaney, J.; Ghatol, R.; Jadhwani, R. An Introduction to Data-Flow Testing; North Carolina State University Department of Computer Science: Raleigh, NC, USA, 2006. [Google Scholar]
- Frankl, P.G.; Weyuker, E.J. An applicable family of data flow testing criteria. IEEE Trans. Softw. Eng. 1988, 14, 1483–1498. [Google Scholar] [CrossRef] [Green Version]
- Xiang, D.; Liu, G.; Yan, C.; Jiang, C. Detecting data-flow errors based on Petri nets with data operations. IEEE/CAA J. Autom. Sin. 2017, 5, 251–260. [Google Scholar] [CrossRef]
- Su, T.; Wu, K.; Miao, W.; Pu, G.; He, J.; Chen, Y.; Su, Z. A Survey on Data-Flow Testing. ACM Comput. Surv. 2017, 50. [Google Scholar] [CrossRef]
- OMG. Unified Modeling Language® (OMG UML®); Version 2.5.1; OMG: Needham, MA, USA, 2017. [Google Scholar]
- Rodrigues, D.S.; Delamaro, M.E.; Correa, C.G.; Nunes, F.L.S. Using Genetic Algorithms in Test Data Generation: A Critical Systematic Mapping. ACM Comput. Surv. 2018, 51, 1–23. [Google Scholar] [CrossRef]
- Fraser, G.; Arcuri, A. EvoSuite: Automatic test suite generation for object-oriented software. In Proceedings of the 19th ACM SIGSOFT Symposium and the 13th European Conference on Foundations of Software Engineering, Szeged, Hungary, 5–9 September 2011; pp. 416–419. [Google Scholar]
- Fraser, G.; Arcuri, A.; McMinn, P. A memetic algorithm for whole test suite generation. J. Syst. Softw. 2015, 103, 311–327. [Google Scholar] [CrossRef] [Green Version]
- Panichella, A.; Kifetew, F.M.; Tonella, P. Automated test case generation as a many-objective optimisation problem with dynamic selection of the targets. IEEE Trans. Softw. Eng. 2017, 44, 122–158. [Google Scholar] [CrossRef] [Green Version]
- Jaffari, A.; Yoo, C.-J.; Lee, J. Automatic Data Flow Analysis to Generate Test Cases from Activity Diagrams. In Proceedings of the 21st Korea Conference on Software Engineering (KCSE 2019), Pyeongchang, Korea, 28–30 January 2019; pp. 136–139. [Google Scholar]
- Jaffari, A.; Yoo, C.-J. An Experimental Investigation into Data Flow Annotated-Activity Diagram-Based Testing. J. Comput. Sci. Eng. 2019, 13, 107–123. [Google Scholar] [CrossRef]
- Heinecke, A.; Brückmann, T.; Griebe, T.; Gruhn, V. Generating Test Plans for Acceptance Tests from UML Activity Diagrams. In Proceedings of the 17th IEEE International Conference and Workshops on Engineering of Computer-Based Systems (ECBS 2010), Oxford, UK, 22–26 March 2010; pp. 57–66. [Google Scholar]
- Chandler, R.; Lam, C.P.; Li, H. AD2US: An automated approach to generating usage scenarios from UML activity diagrams. In Proceedings of the 12th Asia-Pacific Software Engineering Conference (APSEC 2005), Taipei, Taiwan, 15–17 December 2005; p. 8. [Google Scholar]
- Dong, X.; Li, H.; Lam, C.P. Using adaptive agents to automatically generate test scenarios from the UML activity diagrams. In Proceedings of the 12th Asia-Pacific Software Engineering Conference (APSEC 2005), Taipei, Taiwan, 15–17 December 2005; p. 8. [Google Scholar]
- Hettab, A.; Kerkouche, E.; Chaoui, A. A Graph Transformation Approach for Automatic Test Cases Generation from UML Activity Diagrams. In Proceedings of the Eighth International C* Conference on Computer Science & Software Engineering, Yokohama, Japan, 13–15 July 2015; pp. 88–97. [Google Scholar]
- Linzhang, W.; Jiesong, Y.; Xiaofeng, Y.; Jun, H.; Xuandong, L.; Guoliang, Z. Generating test cases from UML activity diagram based on gray-box method. In Proceedings of the 11th Asia-Pacific Software Engineering Conference (APSEC 2004), Busan, Korea, 30 November–3 December 2004; pp. 284–291. [Google Scholar]
- Tiwari, S.; Gupta, A. An approach to generate safety validation test cases from uml activity diagram. In Proceedings of the 20th Asia-Pacific Software Engineering Conference (APSEC 2013) IEEE, Bangkok, Thailand, 2–5 December 2013; pp. 189–198. [Google Scholar]
- Bai, X.; Lam, C.P.; Li, H. An approach to generate the thin-threads from the UML diagrams. In Proceedings of the 28th International Computer Software and Applications Conference (COMPSAC 2004), Hong Kong, China, 27–30 September 2004; pp. 546–552. [Google Scholar]
- Störrle, H. Semantics and verification of data flow in UML 2.0 activities. Electron. Notes Theor. Comput. Sci. 2005, 127, 35–52. [Google Scholar] [CrossRef] [Green Version]
- Fraser, G.; Arcuri, A. Whole test suite generation. IEEE Trans. Softw. Eng. 2012, 39, 276–291. [Google Scholar] [CrossRef] [Green Version]
- Xiao, M.; El-Attar, M.; Reformat, M.; Miller, J. Empirical evaluation of optimization algorithms when used in goal-oriented automated test data generation techniques. Empir. Softw. Eng. J. 2007, 12, 183–239. [Google Scholar] [CrossRef]
- Kalaee, A.; Rafe, V. Model-based test suite generation for graph transformation system using model simulation and search-based techniques. Inf. Softw. Technol. 2019, 108, 1–29. [Google Scholar] [CrossRef]
- Sharma, C.; Sabharwal, S.; Sibal, R. Applying genetic algorithm for prioritization of test case scenarios derived from UML diagrams. Int. J. Comput. Sci. Issues 2014, 8, 433–444. [Google Scholar]
- Mahali, P.; Acharya, A.A. Model based test case prioritization using UML activity diagram and evolutionary algorithm. Int. J. Comput. Sci. Inform. 2013, 3, 42–47. [Google Scholar]
- Nejad, F.M.; Akbari, R.; Dejam, M.M. Using memetic algorithms for test case prioritization in model based software testing. In Proceedings of the 1st Conference on Swarm Intelligence and Evolutionary Computation IEEE (CSIEC 2016), Bam, Iran, 9–11 March 2016; pp. 142–147. [Google Scholar]
- Shirole, M.; Kommuri, M.; Kumar, R. Transition sequence exploration of UML activity diagram using evolutionary algorithm. In Proceedings of the 5th India Software Engineering Conference (ISEC 2012), Kanpur, India, 22–25 February 2012; pp. 97–100. [Google Scholar]
- Kramer, O. Chapter 2 Genetic Algorithms. In Genetic Algorithm Essentials; Springer: Berlin, Germany, 2017. [Google Scholar]
- Arcuri, A. It Does Matter How You Normalise the Branch Distance in Search Based Software Testing. In Proceedings of the Third International Conference on Software Testing, Verification and Validation, Paris, France, 6–9 April 2010; pp. 205–214. [Google Scholar]
- Malhotra, R. Empirical Research in Software Engineering: Concepts, Analysis, and Applications; Chapman & Hall/CRC: London, UK, 2015. [Google Scholar]
- Kitchenham, B.A.; Pfleeger, S.L.; Pickard, L.M.; Jones, P.W.; Hoaglin, D.C.; El Emam, K.; Rosenberg, J. Preliminary guidelines for empirical research in software engineering. IEEE Trans. Softw. Eng. 2002, 28, 721–734. [Google Scholar] [CrossRef] [Green Version]
- Wohlin, C.; Runeson, P.; Höst, M.; Ohlsson, M.C.; Regnell, B.; Wesslén, A. Experimentation in Software Engineering; Springer: Berlin, Germany, 2012. [Google Scholar]
- Mouchawrab, S.; Briand, L.C.; Labiche, Y.; Di Penta, M. Assessing, Comparing, and Combining State Machine-Based Testing and Structural Testing: A Series of Experiments. IEEE Trans. Softw. Eng. 2011, 37, 161–187. [Google Scholar] [CrossRef]
- Fraser, G.; Arcuri, A. Evolutionary Generation of Whole Test Suites. In Proceedings of the 11th International Conference on Quality Software, Madrid, Spain, 13–14 July 2011; pp. 31–40. [Google Scholar]
- Fraser, G.; Rojas, J.M.; Campos, J.; Arcuri, A. EvoSuite at the SBST 2017 tool competition. In Proceedings of the 10th International Workshop on Search-Based Software Testing, Buenos Aires, Argentina, 22–23 May 2017; pp. 39–41. [Google Scholar]
- Andrews, J.H.; Briand, L.C.; Labiche, Y. Is mutation an appropriate tool for testing experiments? In Proceedings of the 27th International Conference on Software Engineering, St. Louis, MO, USA, 15–21 May 2005; pp. 402–411. [Google Scholar]
- Kintis, M.; Papadakis, M.; Papadopoulos, A.; Valvis, E.; Malevris, N.; Le Traon, Y. How effective are mutation testing tools? An empirical analysis of Java mutation testing tools with manual analysis and real faults. Empir. Softw. Eng. 2018, 23, 2426–2463. [Google Scholar] [CrossRef] [Green Version]
Figure 1.
Data flow representation and concepts in activity diagrams (Ads). (a) create object and call activity action, (b) send object action, (c) value specification and guard condition.
Figure 1.
Data flow representation and concepts in activity diagrams (Ads). (a) create object and call activity action, (b) send object action, (c) value specification and guard condition.
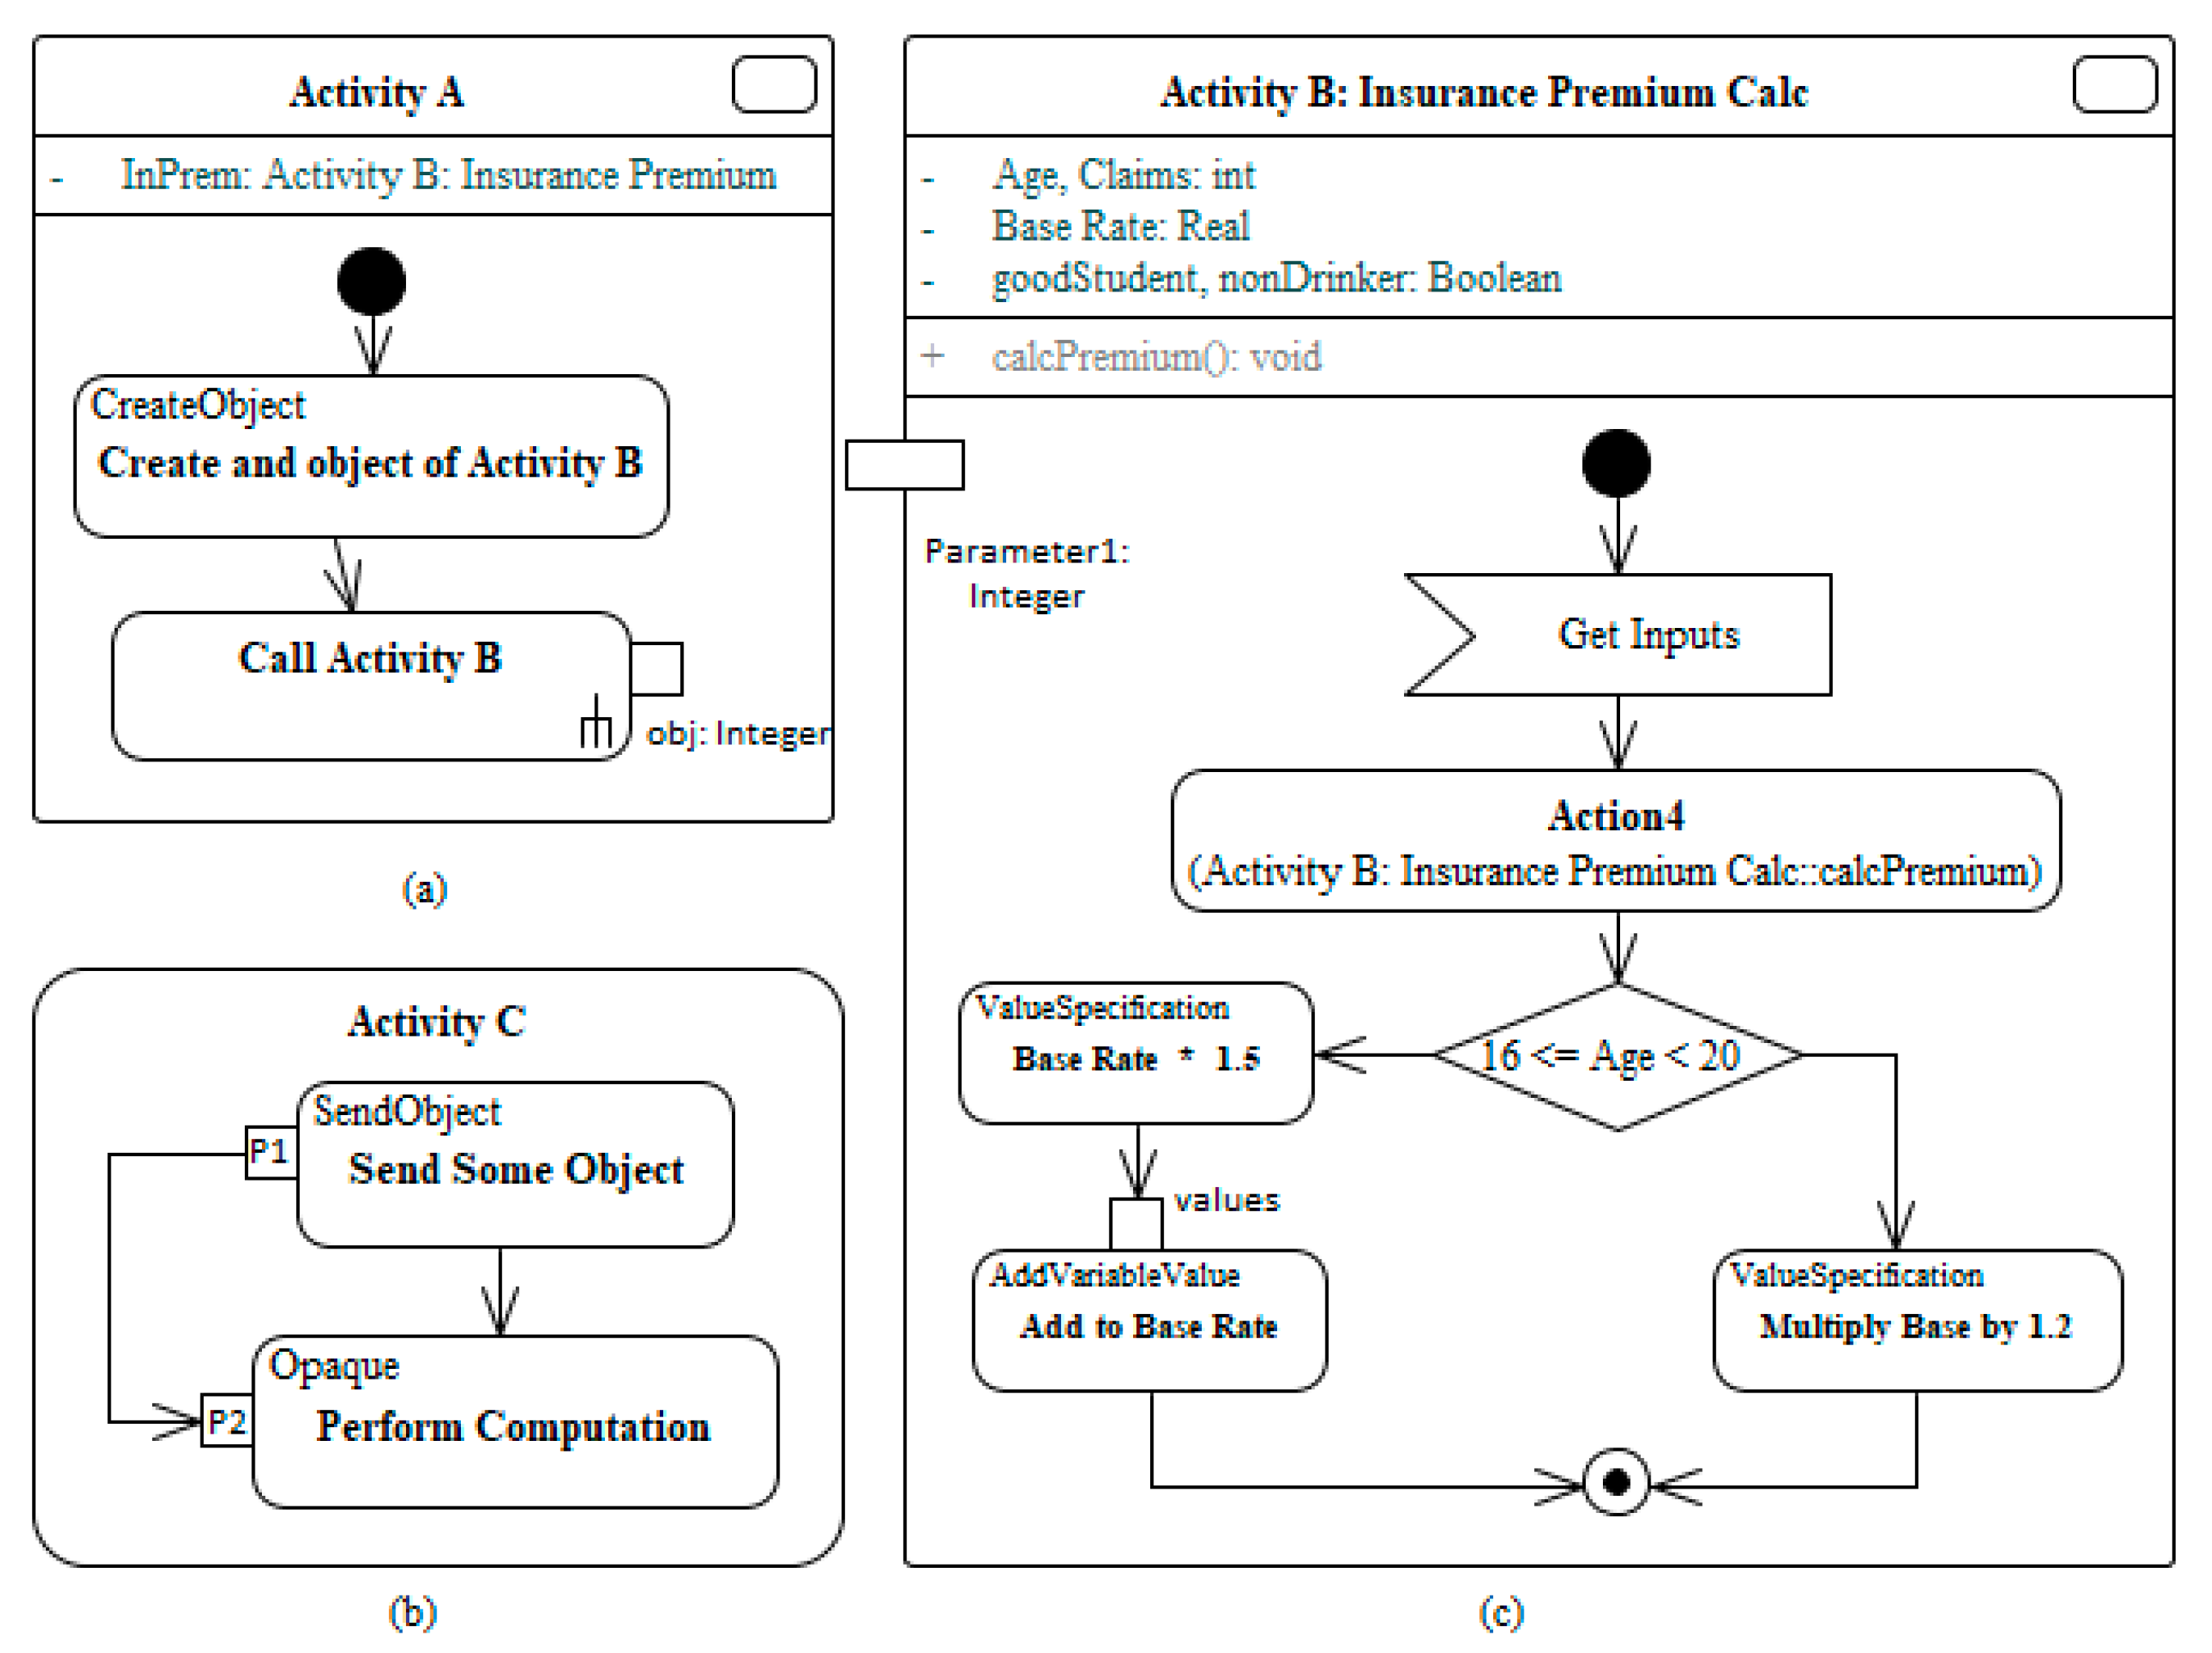
Figure 2.
Overview of the major activities in our approach.

Figure 3.
A high-level XML ElementTree schematic diagram.

Figure 4.
Snapshot of the test data generated for variable locks.

Figure 5.
The percentage and number of mutants detected and failed to detect.


Table 1.
An example of generated def-use pair paths.
| Variable | Def-Use Path Set | Def-Use Pair Paths | Prefix |
|---|---|---|---|
| Locks | (1, locks) (5, locks) | [1, locks ≥ 1] [1, locks ≥ 1, 3, 4, 5] | Y N |
| [5, 1 < locks ≤ 70] [5, 1 < locks ≤ 70, 7] | Y N | ||
| Stocks | (3, stocks) | [3, stocks ≥ 1] [3, stocks ≥ 1, 5, 6, 7] | Y N |
| Barrels | (3, barrels) | [3, barrels ≥ 1] [3, barrels ≥ 1, 5, 6, 7] | Y N |
| Commissions | (14, commissions) | [14, 31≥commissions && commissions >15, 16] | N |
| Sales | (7, sales) | [7, sales ≥ 1800] [7, sales ≥ 1800, 9] [7, sales ≥ 1800, 9, 13, 14] [7, 9, sales ≥ 1000] [7, 8, sales ≥ 1000, 11, 13, 14] [7, 8, 10, sales ≤ 999, 12, 13, 14] | Y Y N Y N N |
Table 2.
The generated test data and associated information.
| Variable | Dup Path Set | Test Data | Guard Condition | #Dup Covered |
|---|---|---|---|---|
| locks | (1, locks) (5, locks) | 1 | [locks ≥ 1] | 2 |
| locks | 24 | [1 ≤ locks && locks ≤ 70] | 2 | |
| stocks | (3, stocks) | 1 | [stocks ≥ 1] | 2 |
| Barrels | (3, barrels) | 2 | [barrels ≥ 1] | 2 |
| commission | (14, commissions) | 20 | [15 < commission ≤ 31] | 1 |
| sales | (7, sales) | 19, 18, 18 | [sales ≥ 1800] | 3 |
| sales | 14, 11, 3 | [sales ≥ 1000 | 2 | |
| sales | 8, 4, 20 | [sales < 1000] | 1 |
Table 3.
Experimental subjects.
| Systems | #LOC | #Classes | Branches | Statements | Mutants | ||||||
|---|---|---|---|---|---|---|---|---|---|---|---|
| Min | Mean | Max | Min | Mean | Max | Min | Mean | Max | |||
| Cruise Control | 358 | 4 | 10 | 16.5 | 28 | 31 | 41.5 | 62 | 15 | 27.25 | 48 |
| Elevator | 581 | 8 | 0 | 17.5 | 72 | 8 | 45.75 | 152 | 2 | 30.9 | 111 |
| Coffee Maker | 393 | 4 | 16 | 26.7 | 48 | 42 | 52.7 | 72 | 24 | 39 | 68 |
Table 4.
The overall statement coverage (SC), branch coverage (BC), and fault detection (FD) ratio achieved across subjects and applied techniques.
Table 4.
The overall statement coverage (SC), branch coverage (BC), and fault detection (FD) ratio achieved across subjects and applied techniques.
| Subject Systems | DFAAD | EvoSuite | AutoTDGen | ||||||
|---|---|---|---|---|---|---|---|---|---|
| SC | BC | FD | SC | BC | FD | SC | BC | FD | |
| Cruise Control | 97.6 | 77.3 | 67.9 | 97 | 95.5 | 44 | 99 | 83.3 | 73 |
| Elevator | 96.2 | 86.4 | 69.6 | 77 | 63 | 24.3 | 96.5 | 87.4 | 85.82 |
| Coffee Maker | 98 | 90 | 84.6 | 100 | 100 | 83.8 | 99.4 | 98.7 | 88 |
| Mean | 97.3 | 84.6 | 74 | 91.25 | 86.13 | 50.7 | 98.3 | 89.8 | 82.33 |
Table 5.
Comparison results for the types of mutations covered in Cruise Control.
| Mutation Operators | Total Mutants | Cruise Control | ||||||||
|---|---|---|---|---|---|---|---|---|---|---|
| AutoTDGen | DFAAD | EvoSuite | ||||||||
| Detected | Failed | Pct. (%) | Detected | Failed | Pct. (%) | Detected | Failed | Pct. (%) | ||
| IM | 0 | 0 | 0 | 0 | 0 | 0 | 0% | 0 | 0 | 0 |
| VMCM | 26 | 23 | 3 | 88 | 19 | 7 | 73 | 1 | 25 | 3.8 |
| RVM | 20 | 20 | 0 | 100 | 18 | 2 | 90 | 18 | 2 | 90 |
| MM | 20 | 10 | 10 | 50 | 6 | 14 | 30 | 3 | 17 | 15 |
| NCM | 33 | 32 | 1 | 97 | 31 | 2 | 94 | 26 | 7 | 78.8 |
| INM | 0 | 0 | 0 | 0 | 0 | 0 | 0 | 0 | 0 | 0 |
| CBM | 10 | 0 | 10 | 0 | 0 | 10 | 0 | 0 | 10 | 0 |
IM: Increments Mutator; VMCM: Void Method Call Mutator; RVM: Return Values Mutator; MM: Math Mutator; NCM: Negate Conditionals Mutator; INM: Invert Negatives Mutator; CBM: Conditional Boundary Mutator.
Table 6.
Comparison results for the types of mutations covered in Elevator.
| Mutation Operators | Total Mutants | Elevator | ||||||||
|---|---|---|---|---|---|---|---|---|---|---|
| AutoTDGen | DFAAD | EvoSuite | ||||||||
| Detected | Failed | Pct. (%) | Detected | Failed | Pct. (%) | Detected | Failed | Pct. (%) | ||
| IM | 4 | 4 | 0 | 100 | 4 | 0 | 100 | 3 | 1 | 75 |
| VMCM | 76 | 54 | 22 | 71 | 45 | 31 | 59 | 11 | 65 | 14 |
| RVM | 45 | 39 | 6 | 87 | 34 | 11 | 76 | 16 | 29 | 35 |
| MM | 30 | 26 | 4 | 87 | 14 | 16 | 47 | 0 | 30 | 0 |
| NCM | 70 | 69 | 1 | 99 | 62 | 8 | 89 | 18 | 43 | 26 |
| INM | 1 | 1 | 0 | 100 | 1 | 0 | 100 | 0 | 1 | 0 |
| CBM | 21 | 19 | 2 | 90 | 12 | 9 | 57 | 12 | 9 | 57 |
Table 7.
Comparison results for the types of mutations covered in Coffee Maker.
| Mutation Operators | Total Mutants | Coffee Maker | ||||||||
|---|---|---|---|---|---|---|---|---|---|---|
| AutoTDGen | DFAAD | EvoSuite | ||||||||
| Detected | Failed | Pct. (%) | Detected | Failed | Pct. (%) | Detected | Failed | Pct. (%) | ||
| IM | 6 | 6 | 0 | 100 | 6 | 0 | 100 | 6 | 0 | 100 |
| VMCM | 12 | 12 | 0 | 100 | 12 | 0 | 100 | 7 | 5 | 58 |
| RVM | 26 | 25 | 1 | 96 | 25 | 1 | 96 | 26 | 0 | 100 |
| MM | 9 | 9 | 0 | 100 | 9 | 0 | 100 | 4 | 5 | 44 |
| NCM | 40 | 40 | 0 | 100 | 40 | 0 | 100 | 40 | 0 | 100 |
| INM | 0 | 0 | 0 | 0 | 0 | 0 | 0 | 0 | 0 | 0 |
| CBM | 24 | 11 | 13 | 46 | 7 | 17 | 29 | 15 | 9 | 62 |
© 2020 by the authors. Licensee MDPI, Basel, Switzerland. This article is an open access article distributed under the terms and conditions of the Creative Commons Attribution (CC BY) license (http://creativecommons.org/licenses/by/4.0/).
Share and Cite
MDPI and ACS Style
Jaffari, A.; Yoo, C.-J.; Lee, J. Automatic Test Data Generation Using the Activity Diagram and Search-Based Technique. Appl. Sci. 2020, 10, 3397. https://doi.org/10.3390/app10103397
AMA Style
Jaffari A, Yoo C-J, Lee J. Automatic Test Data Generation Using the Activity Diagram and Search-Based Technique. Applied Sciences. 2020; 10(10):3397. https://doi.org/10.3390/app10103397
Chicago/Turabian StyleJaffari, Aman, Cheol-Jung Yoo, and Jihyun Lee. 2020. "Automatic Test Data Generation Using the Activity Diagram and Search-Based Technique" Applied Sciences 10, no. 10: 3397. https://doi.org/10.3390/app10103397
Note that from the first issue of 2016, this journal uses article numbers instead of page numbers. See further details here.