Article

Automatic Pancreas Segmentation Using Coarse-Scaled 2D Model of Deep Learning: Usefulness of Data Augmentation and Deep U-Net

1
Department of Diagnostic Imaging and Nuclear Medicine, Kyoto University Graduate School of Medicine, 54 Kawahara-cho, Shogoin, Sakyo-ku, Kyoto 606-8507, Japan
2
Human Brain Research Center, Kyoto University Graduate School of Medicine, 54 Kawahara-cho, Shogoin, Sakyo-ku, Kyoto 606-8507, Japan
*
Author to whom correspondence should be addressed.
Appl. Sci. 2020, 10(10), 3360; https://doi.org/10.3390/app10103360
Submission received: 27 March 2020 / Revised: 6 May 2020 / Accepted: 9 May 2020 / Published: 12 May 2020
(This article belongs to the Special Issue Machine Learning/Deep Learning in Medical Image Processing)

Abstract

:
Combinations of data augmentation methods and deep learning architectures for automatic pancreas segmentation on CT images are proposed and evaluated. Images from a public CT dataset of pancreas segmentation were used to evaluate the models. Baseline U-net and deep U-net were chosen for the deep learning models of pancreas segmentation. Methods of data augmentation included conventional methods, mixup, and random image cropping and patching (RICAP). Ten combinations of the deep learning models and the data augmentation methods were evaluated. Four-fold cross validation was performed to train and evaluate these models with data augmentation methods. The dice similarity coefficient (DSC) was calculated between automatic segmentation results and manually annotated labels and these were visually assessed by two radiologists. The performance of the deep U-net was better than that of the baseline U-net with mean DSC of 0.703–0.789 and 0.686–0.748, respectively. In both baseline U-net and deep U-net, the methods with data augmentation performed better than methods with no data augmentation, and mixup and RICAP were more useful than the conventional method. The best mean DSC was obtained using a combination of deep U-net, mixup, and RICAP, and the two radiologists scored the results from this model as good or perfect in 76 and 74 of the 82 cases.

1. Introduction

Identification of anatomical structures is a fundamental step for radiologists in the interpretation of medical images. Similarly, automatic and accurate organ identification or segmentation is important for medical image analysis, computer-aided detection, and computer-aided diagnosis. To date, many studies have worked on automatic and accurate segmentation of organs, including lung, liver, pancreas, uterus, and muscle [1,2,3,4,5].
An estimated 606,880 Americans were predicted to die from cancer in 2019, in which 45,750 deaths would be due to pancreatic cancer [6]. Among all major types of cancers, the five-year relative survival rate of pancreatic cancer was the lowest (9%). One of the reasons for this low survival rate is the difficulty in the detection of pancreatic cancer in its early stages, because the organ is located in the retroperitoneal space and is in close proximity to other organs. A lack of symptoms is another reason for the difficulty of its early detection. Therefore, computer-aided detection and/or diagnosis using computed tomography (CT) may contribute to a reduction in the number of deaths caused by pancreatic cancer, similar to the effect of CT screenings on lung cancer [7,8]. Accurate segmentation of pancreas is the first step in the computer-aided detection/diagnosis system of pancreatic cancer.
Compared with conventional techniques of organ segmentation, which use hand-tuned filters and classifiers, deep learning, such as convolutional neural networks (CNN), is a framework, which lets computers learn and build these filters and classifiers from a huge amount of data. Recently, deep learning has been attracting much attention in medical image analysis, as it has been demonstrated as a powerful tool for organ segmentation [9]. Pancreas segmentation using CT images is challenging because the pancreas does not have a distinct border with its surrounding structures. In addition, pancreas has a large shape and size variability among people. Therefore, several different approaches to pancreas segmentation using deep learning have been proposed [10,11,12,13,14,15].
Previous studies designed to improve the deep learning model of automatic pancreas segmentation [10,11,12,13,14,15] can be classified using three major aspects: (i) dimension of the convolutional network, two-dimensional model (2D) versus three-dimensional model (3D); (ii) use of coarse-scaled model versus fine-scaled model; (iii) improvement of network architecture. In (i), the accuracy of pancreas segmentation was improved in a 3D model and compared with a 2D model; the 3D model makes it possible to fully utilize the 3D spatial information of pancreas, which is useful for grasping the large variability in pancreas shape and size. In (ii), an initial coarse-scaled model was used to obtain a rough region of interest (ROI) of the pancreas, and then the ROI was used for segmentation refinement using a fine-scaled model of pancreas segmentation. The difference in mean dice similarity coefficient (DSC) between the coarse-scaled and find-scaled models ranged from 2% to 7%. In (iii), the network architecture of a deep learning model was modified for efficient segmentation. For example, when an attention unit was introduced in a U-net, the segmentation accuracy was better than in a conventional U-net [12].
In previous studies, the usefulness of data augmentation in pancreas segmentation was not fully evaluated; only conventional methods of data augmentation were utilized. Recently proposed methods of data augmentation, such as mixup [16] and random image cropping and patching (RICAP) [17], were not evaluated.
In conventional data augmentation, horizontal flipping, vertical flipping, scaling, rotation, etc., are commonly used. It is necessary to find an effective combination of these, since among the possible combinations, some degrade the performance. Due to the number of the combinations, it is relatively cumbersome to eliminate the counterproductive combinations in conventional data augmentation. For this purpose, AutoAugment finds the best combination of data augmentation [18]. However, it is computationally expensive due to its use of reinforcement learning. In this regard, mixup and RICAP are easier to adjust than conventional data augmentation because they both have only one parameter.
The purpose of the current study is to evaluate and validate the combinations of different types of data augmentation and network architecture modification of U-net [19]. A deep U-net was used, to evaluate the usefulness of network architecture modification of U-net.

2. Materials and Methods

The current study used anonymized data extracted from a public database. Therefore, institutional review board approval was waived.

2.1. Dataset

The public dataset (Pancreas-CT) used in the current study includes 82 sets of contrast-enhanced abdominal CT images, where pancreas was manually annotated slice-by-slice [20,21]. This dataset is publicly available from The Cancer Imaging Archive [22]. The Pancreas-CT dataset is commonly used to benchmark the segmentation accuracy of pancreas on CT images. The CT scans in the dataset were obtained from 53 male and 27 female subjects. The age of the subjects ranged from 18 to 76 years with a mean age of 46.8 ± 16.7. The CT images were acquired with Philips and Siemens multi-detector CT scanners (120 kVp tube voltage). Spatial resolution of the CT images is 512 × 512 pixels with varying pixel sizes, and slice thickness is between 1.5−2.5 mm. As a part of image preprocessing, the pixel values for all sets of CT images were clipped to [−100, 240] Hounsfield units, then rescaled to the range [0, 1]. This preprocessing was commonly used for the Pancreas-CT dataset [15].

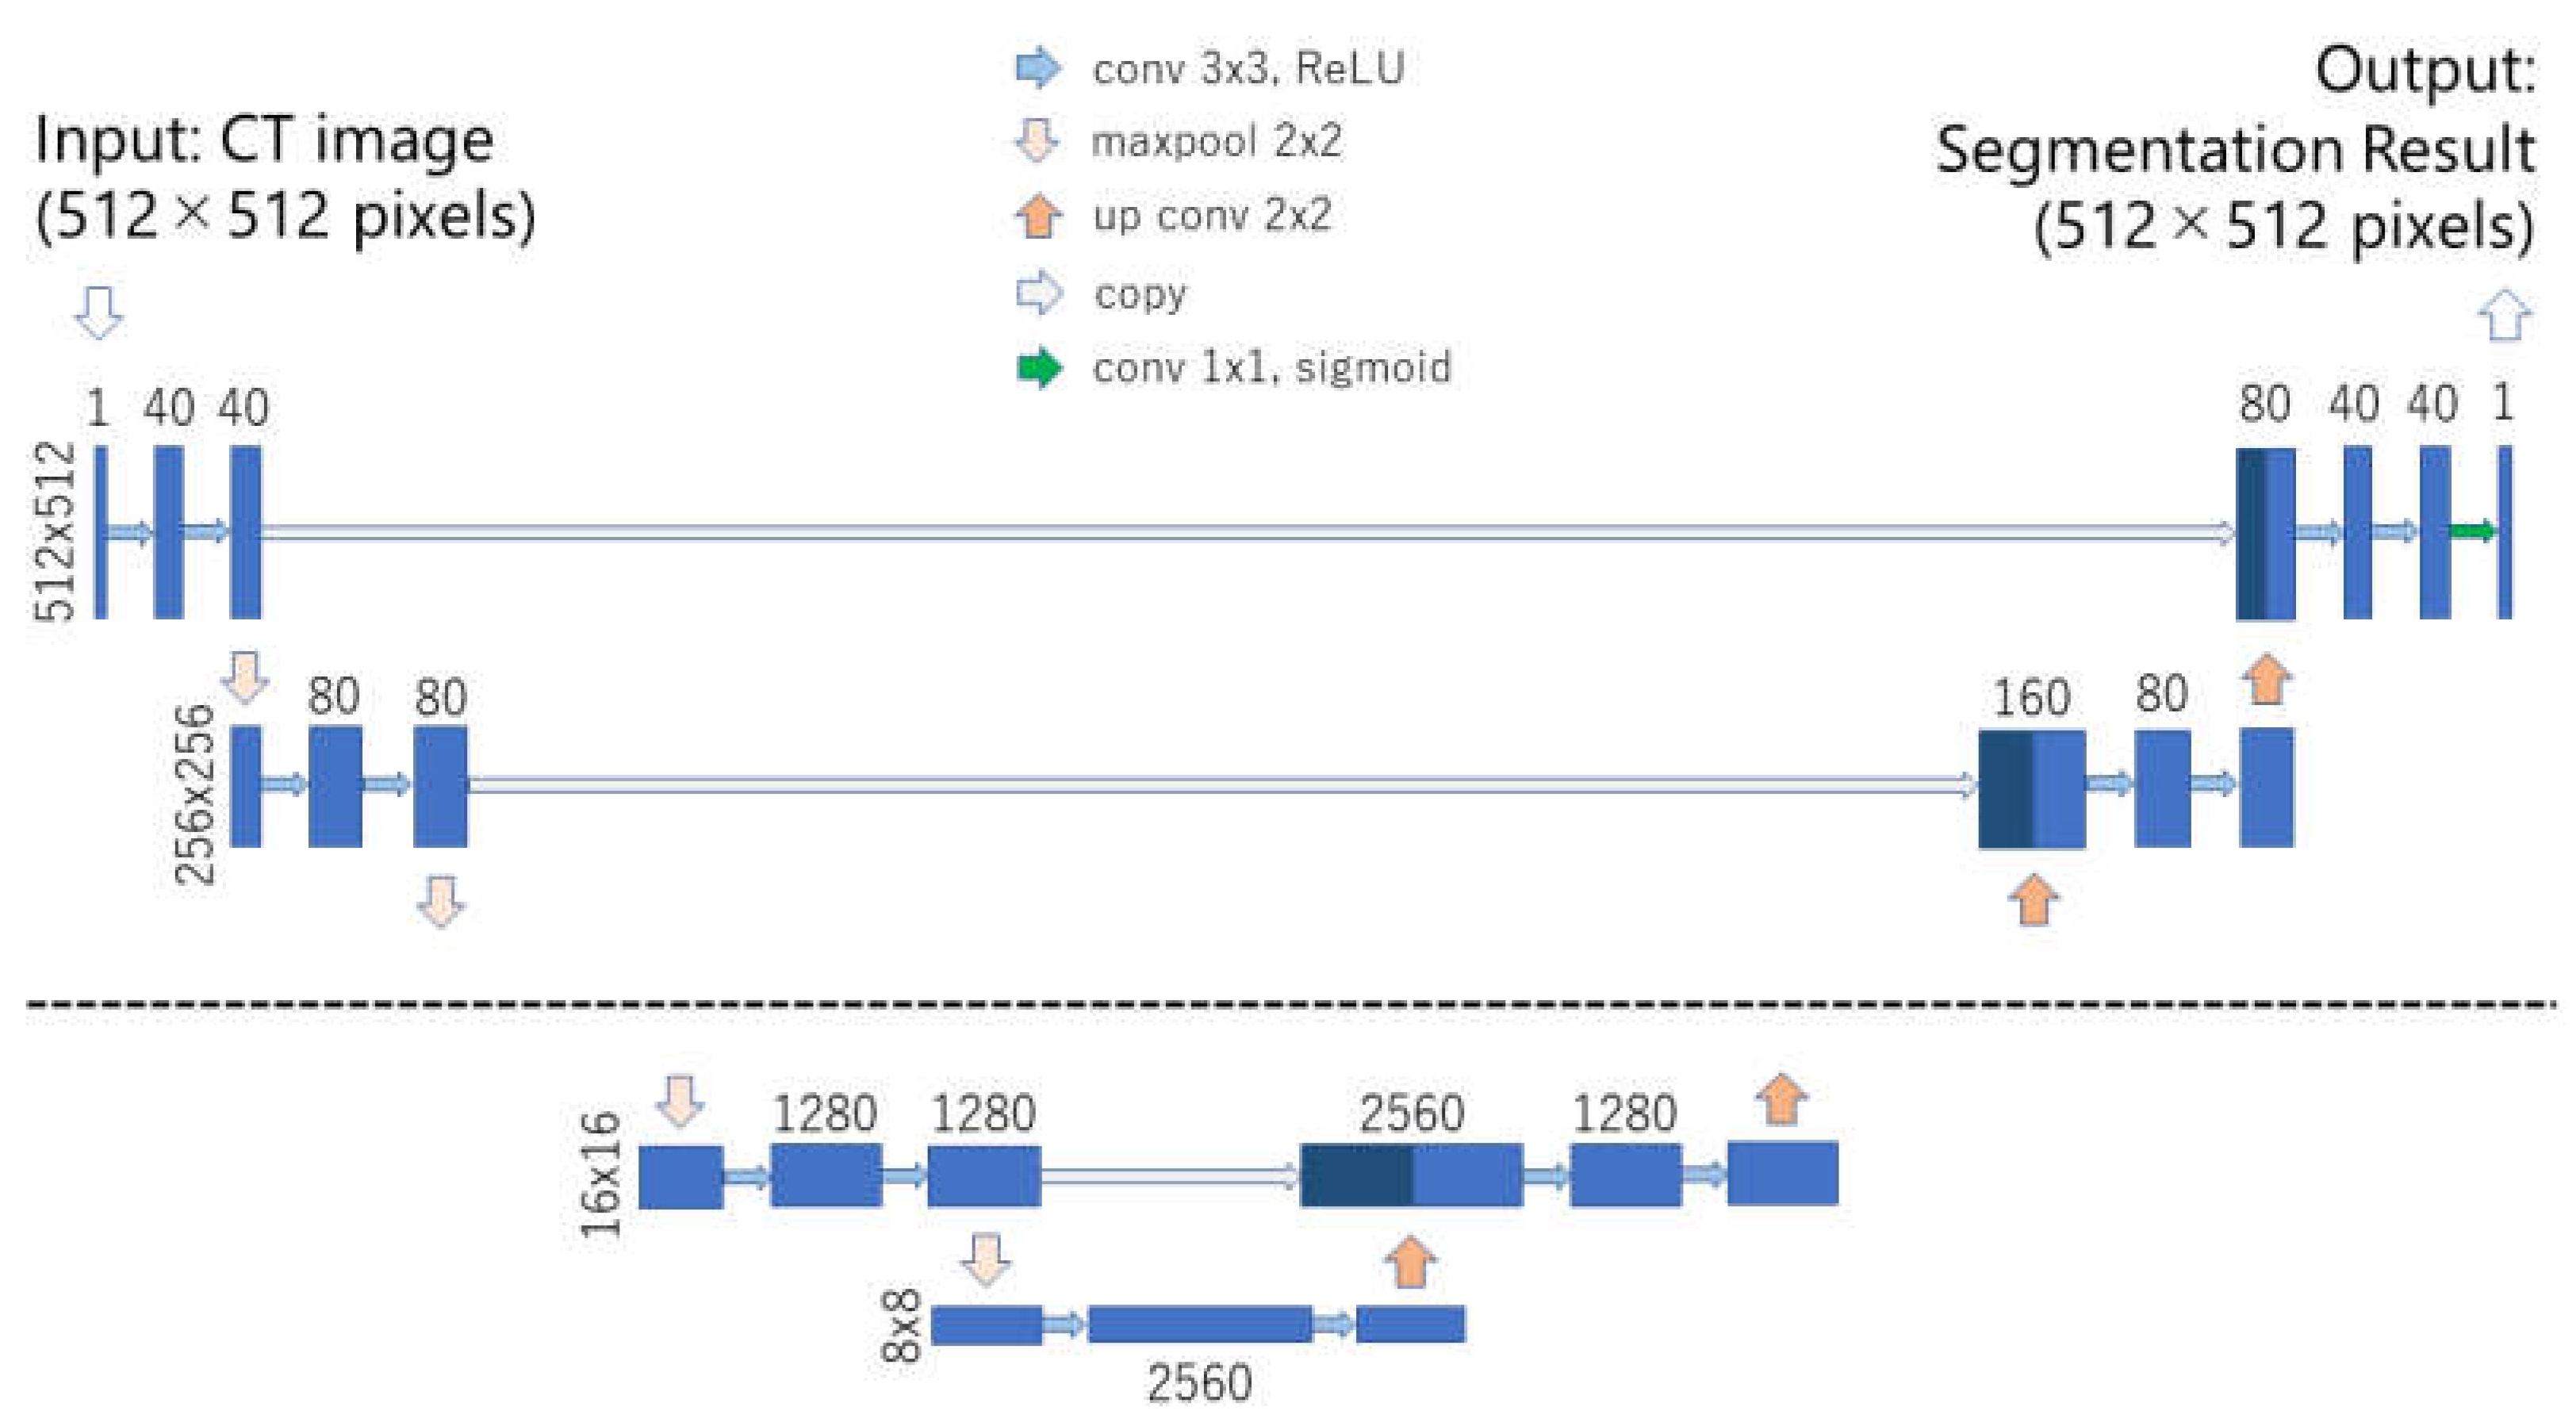
2.2. Deep Learning Model

U-net was used as a baseline model of deep learning in the current study [19]. U-net consists of encoding–decoding architecture. Downsampling and upsampling are performed in the encoding and decoding parts of U-net, respectively. The most important characteristic of U-net is the presence of shortcut connections between the encoding part and the decoding part at equal resolution. While the baseline U-net performs downsampling and upsampling 4 times [19], deep U-net performs downsampling and upsampling 6 times. In addition to the number of downsampling and upsampling, the number of feature maps in the convolution layer and the use of dropout were changed in the deep U-net; the number of feature maps in the first convolution layer equaled to 40 and dropout probability to 2%. In the baseline U-net, 64 feature maps and no dropout were used. In both, the baseline U-net and the deep U-net, the number of feature maps in the convolution layer was doubled after each downsampling. Figure 1 presents the deep U-net model of the proposed method. Both the baseline U-net and deep U-net utilized batch normalization. Keras (https://keras.io/) with Tensorflow (https://www.tensorflow.org/) backends was used for the implementation of the U-net models. Image dimension of the input and output in the two U-net models was 512 × 512 pixels.

2.3. Data Augmentation

To prevent overfitting in the training of the deep learning model, we utilized the following three types of data augmentation methods: conventional method, mixup [16], and RICAP [17]. Although mixup and RICAP were initially proposed for image classification tasks, we utilized them for segmentation by merging or cropping/patching labels in the same way as is done for images.
Conventional augmentation methods included ±5° rotation, ±5% x-axis shift, ±5% y-axis shift, and 95%–105% scaling. Both image and label were changed by the same transformation when using a conventional augmentation method.
Mixup generates a new training sample from linear combination of existing images and their labels [16]. Here, two sets of training samples are denoted by (x, y) and (x’, y‘), where x and x’ are images, and y and y’ are their labels. A generated sample (x#, y#) is given by:
x #   = λ x + ( 1 λ ) x
y #   = λ y + ( 1 λ ) y
where λ ranges from 0 to 1 and is distributed according to beta distribution: λ~Beta(β, β) for β ∈ (0, ∞). The two samples to be combined are selected randomly from the training data. The hyperparameter β of mixup was set to 0.2 empirically.
RICAP generates a new training sample from four randomly selected images [17]. The four images are randomly cropped and patched according to a boundary position (w, h), which is determined according to beta distribution: w~Beta(β, β) and h~Beta(β, β). We set the hyperparameter β of RICAP to 0.4 empirically. For four images to be combined, the coordinates (xk, yk) (k = 1, 2, 3, and 4) of the upper left corners of the cropped areas are randomly selected. The sizes of the four cropped images are determined based on the value (w, h), such that they do not increase the original image size. A generated sample is obtained by combining the four cropped images. In the current study, the image and its label were cropped at the same coordinate and size.

2.4. Training

Dice loss function was used as the optimization target of the deep learning models. RMSprop was used as the optimizer, and its learning rate was set to 0.00004. The number of training epochs was set to 45. Following previous works on pancreas segmentation, we used 4-fold cross-validation to assess the robustness of the model (20 or 21 subjects were chosen for validation in folds). The hyperparameters related with U-net and its training were selected using random search [23]. After the random search, the hyperparameters were fixed. The following 10 combinations of deep learning models and data augmentation methods were used:
  • Baseline U-net + no data augmentation,
  • Baseline U-net + conventional method,
  • Baseline U-net + mixup,
  • Baseline U-net + RICAP,
  • Baseline U-net + RICAP + mixup,
  • Deep U-net + no data augmentation,
  • Deep U-net + conventional method,
  • Deep U-net + mixup,
  • Deep U-net + RICAP,
  • Deep U-net + RICAP + mixup.

2.5. Evaluation of Pancreas Segmentation

For each validation case of the Pancreas-CT dataset, three-dimensional CT images were processed slice-by-slice using the trained deep learning models, and the segmentation results were stacked. Except for the stacking, no complex postprocessing was utilized. Quantitative and qualitative evaluations were performed for the automatic segmentation results.
The metrics of quantitative evaluation were calculated using the three-dimensional segmentation results and annotated labels. Four types of metrics were used for the quantitative evaluation of the segmentation results: dice similarity coefficient (DSC), Jaccard index (JI), sensitivity (SE), and specificity (SP). These metrics are defined by the following equations:
D S C = 2 | P L | | P | + | L |
J I = | P L | | P | + | L | | P L |
S E = | P L | | L |
S P = 1 | P | | P L | | I | | L |
where |P|, |L|, and |I| denote the number of voxels for pancreas segmentation results, annotated label of pancreas segmentation, and three-dimensional CT images, respectively. | P L | represents the number of voxels where the deep learning models can accurately segment pancreas (true positive). Before calculating the four metrics, a threshold of 0.5 was used for obtaining pancreas segmentation mask from the output of the U-net [24]. The threshold of 0.5 was fixed for all the 82 cases. A Wilcoxon signed rank test was used to test statistical significance among the DSC results of 10 combinations of deep learning models and data augmentation methods. Bonferroni correction was used for controlling family wise error rate. p-values less than 0.05/45 = 0.00111 was considered as statistical significance.
For the qualitative evaluation, two radiologists with 14 and 6 years of experience visually evaluated both the manually annotated labels and automatic segmentation results using a 5-point scale: 1, unacceptable; 2, slightly unacceptable; 3, acceptable; 4, good; 5, perfect. Inter-observer variability between the two radiologists were evaluated using weighted kappa with squared weight.

3. Results

Table 1 shows results of the qualitative evaluation of the pancreas segmentation of Deep U-net + RICAP + mixup and the manually annotated labels. The mean visual scores of manually annotated labels were 4.951 and 4.902 for the two radiologists, and those of automatic segmentation results were 4.439 and 4.268. The mean score of automatic segmentation results demonstrates that the accuracy of the automatic segmentation was good; more than 92.6% (76/82) and 87.8% (74/82) of the cases were scored as 4 or above. Notably, Table 1 shows that the manually annotated labels were scored as 4 (good, but not perfect) in four and eight cases by the two radiologists. Weighted kappa values between the two radiologists were 0.465 (moderate agreement) for the manually annotated labels and 0.723 (substantial agreement) for the automatic segmentation results.
Table 2 shows the results of the quantitative evaluation of pancreas segmentation. Mean and standard deviation of DSC, JI, SE, and SP are calculated from the validation cases of 4-fold cross validation for the Pancreas-CT dataset. Mean DSC of the deep U-net (0.703–0.789) was better than the mean DSC of the baseline U-net (0.686–0.748) across all data augmentation methods. Because mean SP was 1.00 in all the combinations, non-pancreas lesions were not segmented by the models. Therefore, mean DSC was mainly affected by mean SE (segmentation accuracy only for pancreas lesion) as shown in Table 2. Table 2 also shows the usefulness of data augmentation. In both, the baseline U-net and deep U-net, the model combined with any of the three types of data augmentation performed better than the model with no data augmentation. In addition, mixup and RICAP were more useful than the conventional method; the best mean DSC was obtained using the combination of mixup and RICAP. The best mean DSC was obtained using the deep U-net with RICAP and mixup.
Table B1 of Appendix B shows the results of the Wilcoxon signed rank test. After the Bonferroni correction, the DSC differences between Deep U-net + RICAP + mixup and the other six models were statistically significant.
Representative images of pancreas segmentation are shown in Figure 2 and Figure 3. In the case of Figure 2, the manually annotated label was scored as 4 by the two radiologists because the main pancreas duct and its surrounding tissue were excluded from the label.

4. Discussion

The results of the present study show that the three types of data augmentation were useful for the pancreas segmentation in both the baseline U-net and deep U-net. In addition, the deep U-net, which is characterized by additional layers, was overall more effective for automatic pancreas segmentation than the baseline U-net. In data augmentation, not only the conventional method, but also mixup and RICAP were useful for pancreas segmentation; the combination of mixup and RICAP was the most useful.
Table 3 summarizes results of previous studies using the Pancreas-CT dataset. While Table 3 includes the studies with coarse-scaled models, Table A1 includes the studies with fine-scaled models. As shown in Table 3, the coarse-scaled 2D model of the current study achieved sufficiently high accuracy, comparable to those of previous studies. While the present study focused on the 2D coarse-scaled models, the data augmentation methods used in the present study can be easily applied to 3D fine-scaled models. Therefore, it can be expected that the combination of the proposed data augmentation methods and 3D fine-scaled models might lead to further improvement of automatic pancreas segmentation.
Data augmentation was originally proposed for the classification model, and the effectiveness of mixup was validated for segmentation on brain MRI images [25]. The results of the current study demonstrate the effectiveness of multiple types of data augmentation methods for the two models of U-net for automatic pancreatic segmentation. To the best of our knowledge, the current study is the first to validate the usefulness of multiple types of data augmentation methods in pancreas segmentation.
Table 2 shows that deep U-net was better than baseline U-net. Deep U-net included additional layers in its network architecture, compared with baseline U-net. It is speculated that these additional layers could lead to performance improvement for pancreas segmentation. Nakai et al. [26] showed that deeper U-net could efficiently denoised low-dose CT images. They also showed that deeper U-net was better than baseline U-net. Kurata et al. [4] showed that their U-net with additional layers was effective for uterine segmentation. The results of the current study are consistent with the results of these studies. The effectiveness of deep/deeper U-net has not been sufficiently investigated so far. Because U-net can be used for segmentation, image denoising, detection, and modality conversion, it is necessary to evaluate what tasks the deep/deeper U-net is effective for.
Combined use of mixup and RICAP was the best for data augmentation in the current study. The combination of mixup and RICAP was also used in the study of bone segmentation [24]. The results of bone segmentation show that effectiveness of data augmentation was observed in the dataset with limited cases, and the optimal combination was conventional method and RICAP. Based on the studies of bone and pancreas segmentation, usefulness of combination of conventional method, mixup, and RICAP should be further investigated.
Sandfort et al. used CycleGAN as data augmentation to improve generalizability in organ segmentation on CT images [27]. CycleGAN was also used for data augmentation in the classification task [28]. Because the computational cost of training CycleGAN is relatively high, the use of CycleGAN as a data augmentation method needs some consideration. In this regard, computational cost of mixup and RICAP is relatively low, and mixup and RICAP are easy to implement.
Accuracy of pancreas segmentation was visually evaluated by the two radiologists in the current study. To our knowledge, there was no study of deep learning to evaluate the segmentation accuracy of pancreas structure visually. The results of visual scores mean that automatic segmentation model of the current study was good. It is expected that the proposed model may be useful for clinical cases if the clinical CT images have similar condition and quality to those of the Pancreas-CT dataset.
In the current study, we evaluated automatic pancreas segmentation using the public dataset called Pancreas-CT. Although this dataset was used in several studies as shown in Table 3, the manually annotated labels of four or eight cases were scored as not perfect based on the visual assessment of the current study. In most of the cases, the labels for the pancreas head were assessed as low-quality. It is presumed that the low-quality labeling is caused by the fact that annotators did not fully understand the boundary between the pancreas and other organs (e.g., duodenum). To evaluate the segmentation accuracy, reliable labeling is mandatory. For this purpose, a new database for pancreas segmentation is desirable.
There were several limitations to the present study. First, we investigated the usefulness of data augmentation only in segmentation models. The usefulness of data augmentation should be evaluated for other models such as classification, detection, and image generation. Second, the 3D fine-tuned model of pancreas segmentation was not evaluated. Because U-net, mixup, and RICAP were originally suggested for 2D models, we constructed and evaluated the 2D model of pancreas segmentation. We will apply the proposed methods to the 3D fine-tuned model in future research.

5. Conclusions

The combination of deep U-net with mixup and RICAP achieved automatic pancreas segmentation, which the radiologists scored as good or perfect. We will further investigate the usefulness of the proposed method for the 3D coarse-scaled/fine-scaled models to improve segmentation accuracy.

Author Contributions

Conceptualization, M.N.; methodology, M.N.; software, M.N. and S.N.; validation, M.N. and S.N.; formal analysis, M.N.; investigation, M.N.; resources, M.N. and K.F.; data curation, M.N. and SN; writing—original draft preparation, M.N.; writing—review and editing, M.N., S.N., and K.F.; visualization, M.N.; supervision, K.F.; project administration, M.N.; funding acquisition, M.N. All authors have read and agreed to the published version of the manuscript.

Funding

The present study was supported by JSPS KAKENHI, grant number JP19K17232.

Conflicts of Interest

The authors declare no conflict of interest. The funders had no role in the design of the study; in the collection, analyses, or interpretation of data; in the writing of the manuscript, or in the decision to publish the results.

Appendix A

Table A1. Summary of fine-scaled models using Pancreas-CT dataset.
Name of Model2D/3DCoarse/FineMean DSCData Splitting
Holistically Nested 2D FCN Stage-2 [11]2Dfine0.811 ± 0.0734-fold CV
2D FCN + Recurrent Network [13]2Dfine0.824 ± 0.0674-fold CV
Fine-scaled Model 2D FCN [14]2Dfine0.824 ± 0.0574-fold CV
Fine-scaled Model 3D U-net [15]3Dfine0.860 ± 0.0454-fold CV

Appendix B

Table B1. Results of Statistical significance for DSC difference.
Target 1Target 2p-ValueStatistical Significance for DSC Difference
120.727381623No
130.560489877No
140.921405534No
150.037061458No
160.727381623No
170.148802462No
180.553863735No
190.012907274No
1105.45 × 10−5Yes
230.85904175No
240.87456599No
250.080182031No
260.958034301No
270.211395881No
280.856459499No
290.029961825No
2100.000143632Yes
340.422285602No
350.057745373No
360.668985055No
370.331951771No
380.85904175No
390.033624033No
3103.72 × 10−5Yes
450.047352438No
460.764727204No
470.157310432No
480.529901132No
490.024270868No
4100.000120757Yes
560.067465313No
570.649935631No
580.067465313No
590.580595554No
5100.031228349No
670.227439002No
680.784877257No
690.028739708No
6109.60 × 10−5Yes
780.292611693No
790.355409719No
7100.017108607No
890.040470933No
8105.23 × 10−5Yes
9100.185045722No
Note: In Target 1 and Target 2, values of cells mean the followings: (1) Baseline U-net + no data augmentation, (2) Baseline U-net + conventional method, (3) Baseline U-net + mixup, (4) Baseline U-net + RICAP, (5) Baseline U-net + RICAP + mixup, (6) Deep U-net + no data augmentation, (7) Deep U-net + conventional method, (8) Deep U-net + mixup, (9) Deep U-net + RICAP, (10) Deep U-net + RICAP + mixup. p-values less than 0.05/45 = 0.00111 was considered as statistical significance.

References

  1. Nakagomi, K.; Shimizu, A.; Kobatake, H.; Yakami, M.; Fujimoto, K.; Togashi, K. Multi-shape graph cuts with neighbor prior constraints and its application to lung segmentation from a chest CT volume. Med. Image Anal. 2013, 17, 62–77. [Google Scholar] [CrossRef] [PubMed]
  2. Seo, H.; Huang, C.; Bassenne, M.; Xiao, R.; Xing, L. Modified U-Net (mU-Net) with Incorporation of Object-Dependent High Level Features for Improved Liver and Liver-Tumor Segmentation in CT Images. IEEE Trans. Med. Imaging 2020, 39, 1316–1325. [Google Scholar] [CrossRef] [PubMed] [Green Version]
  3. Asaturyan, H.; Gligorievski, A.; Villarini, B. Morphological and multi-level geometrical descriptor analysis in CT and MRI volumes for automatic pancreas segmentation. Comput. Med. Imaging Graph. 2019, 75, 1–13. [Google Scholar] [CrossRef] [PubMed]
  4. Kurata, Y.; Nishio, M.; Kido, A.; Fujimoto, K.; Yakami, M.; Isoda, H.; Togashi, K. Automatic segmentation of the uterus on MRI using a convolutional neural network. Comput. Biol. Med. 2019, 114, 103438. [Google Scholar] [CrossRef] [PubMed]
  5. Hiasa, Y.; Otake, Y.; Takao, M.; Ogawa, T.; Sugano, N.; Sato, Y. Automated Muscle Segmentation from Clinical CT using Bayesian U-Net for Personalized Musculoskeletal Modeling. IEEE Trans. Med. Imaging 2020, 39, 1030–1040. [Google Scholar] [CrossRef] [Green Version]
  6. Siegel, R.L.; Miller, K.D.; Jemal, A. Cancer statistics, 2019. CA Cancer J. Clin. 2019, 69, 7–34. [Google Scholar] [CrossRef] [PubMed] [Green Version]
  7. Ardila, D.; Kiraly, A.P.; Bharadwaj, S.; Choi, B.; Reicher, J.J.; Peng, L.; Tse, D.; Etemadi, M.; Ye, W.; Corrado, G.; et al. End-to-end lung cancer screening with three-dimensional deep learning on low-dose chest computed tomography. Nat. Med. 2019, 25, 954–961. [Google Scholar] [CrossRef] [PubMed]
  8. National Lung Screening Trial Research Team; Aberle, D.R.; Adams, A.M.; Berg, C.D.; Black, W.C.; Clapp, J.D.; Fagerstrom, R.M.; Gareen, I.F.; Gatsonis, C.; Marcus, P.M.; et al. Reduced lung-cancer mortality with low-dose computed tomographic screening. N. Engl. J. Med. 2011, 365, 395–409. [Google Scholar]
  9. Hesamian, M.H.; Jia, W.; He, X.; Kennedy, P. Deep Learning Techniques for Medical Image Segmentation: Achievements and Challenges. J. Digit. Imaging 2019, 32, 582–596. [Google Scholar] [CrossRef] [Green Version]
  10. Kumar, H.; DeSouza, S.V.; Petrov, M.S. Automated pancreas segmentation from computed tomography and magnetic resonance images: A systematic review. Comput. Methods Programs Biomed. 2019, 178, 319–328. [Google Scholar] [CrossRef]
  11. Roth, H.R.; Lu, L.; Lay, N.; Harrison, A.P.; Farag, A.; Sohn, A.; Summers, R.M. Spatial aggregation of holistically-nested convolutional neural networks for automated pancreas localization and segmentation. Med. Image Anal. 2018, 45, 94–107. [Google Scholar] [CrossRef] [PubMed] [Green Version]
  12. Oktay, O.; Schlemper, J.; Folgoc, L.L.; Lee, M.; Heinrich, M.; Misawa, K.; Mori, K.; McDonagh, S.; Hammerla, N.Y.; Kainz, B.; et al. Attention U-Net: Learning Where to Look for the Pancreas. In Proceedings of the 1st Conference on Medical Imaging with Deep Learning (MIDL2018), Amsterdam, The Netherlands, 4–6 July 2018. [Google Scholar]
  13. Cai, J.; Lu, L.; Xie, Y.; Xing, F.; Yang, L. Improving deep pancreas segmentation in CT and MRI images via recurrent neural contextual learning and direct loss function. In Proceedings of the MICCAI 2017, Quebec City, QC, Canada, 11–13 September 2017. [Google Scholar]
  14. Zhou, Y.; Xie, L.; Shen, W.; Wang, Y.; Fishman, E.K.; Yuille, A.L. A fixed-point model for pancreas segmentation in abdominal CT scans. In Proceedings of the MICCAI 2017, Quebec City, QC, Canada, 11–13 September 2017. [Google Scholar]
  15. Zhao, N.; Tong, N.; Ruan, D.; Sheng, K. Fully Automated Pancreas Segmentation with Two-stage 3D Convolutional Neural Networks. arXiv 2019, arXiv:1906.01795. [Google Scholar]
  16. Zhang, H.; Cisse, M.; Dauphin, Y.N.; Lopez-Paz, D. mixup: Beyond Empirical Risk Minimization. arXiv 2017, arXiv:1710.09412. [Google Scholar]
  17. Takahashi, R.; Matsubara, T.; Uehara, K. Data Augmentation using Random Image Cropping and Patching for Deep CNNs. arXiv 2018, arXiv:1811.09030. [Google Scholar] [CrossRef] [Green Version]
  18. Cubuk, E.D.; Zoph, B.; Mane, D.; Vasudevan, V.; Le, Q.V. AutoAugment: Learning Augmentation Policies from Data. In Proceedings of the Computer Vision and Pattern Recognition (CVPR2019), Long Beach, CA, USA, 16–20 June 2019. [Google Scholar]
  19. Ronneberger, O.; Fischer, P.; Brox, T. U-net: Convolutional networks for biomedical image segmentation. In Proceedings of the International Conference on Medical Image Computing and Computer-Assisted Intervention, Munich, Germany, 5–9 October 2015; Volume 9351, pp. 234–241. [Google Scholar]
  20. Roth, H.R.; Farag, A.; Turkbey, E.B.; Lu, L.; Liu, J.; Summers, R.M. Data from Pancreas-CT. The Cancer Imaging Archive. 2016. Available online: http://doi.org/10.7937/K9/TCIA.2016.tNB1kqBU (accessed on 13 February 2020).
  21. Roth, H.R.; Lu, L.; Farag, A.; Shin, H.-C.; Liu, J.; Turkbey, E.B.; Summers, R.M. DeepOrgan: Multi-level Deep Convolutional Networks for Automated Pancreas Segmentation. In Proceedings of the MICCA 2015, Munich, Germany, 5–9 October 2015; Volume 9349, pp. 556–564. [Google Scholar]
  22. Clark, K.; Vendt, B.; Smith, K.; Freymann, J.; Kirby, J.; Koppel, P.; Moore, S.; Phillips, S.; Maffitt, D.; Pringle, M.; et al. The Cancer Imaging Archive (TCIA): Maintaining and Operating a Public Information Repository. J. Digit. Imaging 2013, 26, 1045–1057. [Google Scholar] [CrossRef] [PubMed] [Green Version]
  23. Bergstra, J.; Bardenet, R.; Bengio, Y.; Kégl, B. Algorithms for Hyper-Parameter Optimization. In Proceedings of the 25th Annual Conference on Neural Information Processing Systems 2011, Granada, Spain, 12–15 December 2011; Available online: http://dl.acm.org/citation.cfm?id=2986743 (accessed on 5 May 2020).
  24. Noguchi, S.; Nishio, M.; Yakami, M.; Nakagomi, L.; Togashi, K. Bone segmentation on whole-body CT using convolutional neural network with novel data augmentation techniques. Comput. Biol. Med. 2020, 121, 103767. [Google Scholar] [CrossRef] [PubMed]
  25. Eaton-Rosen, Z.; Bragman, F.; Ourselin, S.; Cardoso, M.J. Improving Data Augmentation for Medical Image Segmentation. In Proceedings of the 1st Conference on Medical Imaging with Deep Learning (MIDL 2018), Amsterdam, The Netherlands, 4–6 July 2018. [Google Scholar]
  26. Nakai, H.; Nishio, M.; Yamashita, R.; Ono, A.; Nakao, K.K.; Fujimoto, K.; Togashi, K. Quantitative and Qualitative Evaluation of Convolutional Neural Networks with a Deeper U-Net for Sparse-View Computed Tomography Reconstruction. Acad. Radiol. 2020, 27, 563–574. [Google Scholar] [CrossRef] [PubMed]
  27. Sandfort, V.; Yan, K.; Pickhardt, P.J.; Summers, R.M. Data augmentation using generative adversarial networks (CycleGAN) to improve generalizability in CT segmentation tasks. Sci. Rep. 2019, 9, 16884. [Google Scholar] [CrossRef] [PubMed]
  28. Muramatsu, C.; Nishio, M.; Goto, T.; Oiwa, M.; Morita, T.; Yakami, M.; Kubo, T.; Togashi, K.; Fujita, H. Improving breast mass classification by shared data with domain transformation using a generative adversarial network. Comput. Biol. Med. 2020, 119, 103698. [Google Scholar] [CrossRef] [PubMed]
Figure 1. Illustration of the deep U-net model. The number of downsampling and upsampling is 6 in the deep U-net. Except for the last convolution layer, dropout and convolution layer are coupled. Abbreviations: convolution layer (conv), maxpooling layer (maxpool), upsampling and convolution layer (up conv), rectified linear unit (ReLU).
Applsci 10 03360 g001
Figure 2. Representative image of automatic pancreas segmentation. (a) Original computed tomography (CT) image; (b) CT image with manually annotated label in red, scored as not perfect by two radiologists; (c) CT image with automatic segmentation in blue.
Applsci 10 03360 g002
Figure 3. Representative image of a low-quality automatic pancreas segmentation. (a) Original computed tomography (CT) image; (b) CT image with manually annotated label in red; (c) CT image with automatic segmentation in blue, with part of the pancreas excluded from the segmentation.
Applsci 10 03360 g003
Table 1. Results of qualitative evaluation of automatic pancreas segmentation and manually annotated labels.
RadiologistTargetNumber of Score 1Number of Score 2Number of Score 3Number of Score 4Number of Score 5
Radiologist 1manually annotated label 000478
Radiologist 1automatic segmentation0333145
Radiologist 2manually annotated label 000874
Radiologist 2automatic segmentation0264232
Table 2. Results of quantitative evaluation of automatic pancreas segmentation from the 82 cases using 4-fold cross validation.
Type of Model and Data AugmentationDSCJISESP
Baseline U-net + no data augmentation0.686 ± 0.1860.548 ± 0.1860.618 ± 0.2211.000 ± 0.000
Baseline U-net + conventional method0.694 ± 0.1820.556 ± 0.1830.631±0.2201.000 ± 0.000
Baseline U-net + mixup0.733 ± 0.1060.588 ± 0.1220.698 ± 0.1551.000 ± 0.000
Baseline U-net + RICAP0.699 ± 0.1550.557 ± 0.1690.624 ± 0.2001.000 ± 0.000
Baseline U-net + RICAP + mixup0.748 ± 0.1270.611 ± 0.1410.700 ± 0.1761.000 ± 0.000
Deep U-net + no data augmentation0.703 ± 0.1660.563 ± 0.1690.645 ± 0.2011.000 ± 0.000
Deep U-net + conventional method0.720 ± 0.1710.586 ± 0.1760.685 ± 0.2101.000 ± 0.000
Deep U-net + mixup0.725 ± 0.1250.582 ± 0.1370.694 ± 0.1581.000 ± 0.000
Deep U-net + RICAP0.740 ± 0.1600.609 ± 0.1690.691 ± 0.2001.000 ± 0.000
Deep U-net + RICAP + mixup0.789 ± 0.0830.658 ± 0.1030.762 ± 0.1201.000 ± 0.000
Note: data are shown as mean ± standard deviation. Abbreviations: Random image cropping and patching (RICAP), dice similarity coefficient (DSC), Jaccard index (JI), sensitivity (SE), and specificity (SP).
Table 3. Summary of coarse-scaled models using the Pancreas-CT dataset.
Name of Model2D/3DCoarse/FineMean DSCData Splitting
Holistically Nested 2D FCN Stage-1 [11]2Dcoarse0.768 ± 0.1114-fold CV
2D FCN [13]2Dcoarse0.803 ± 0.094-fold CV
Coarse-scaled Model 2D FCN [14]2Dcoarse0.757 ± 0.1054-fold CV
Single Model 3D U-net [12] (trained from scratch)3Dcoarse0.815 ± 0.05761 training and 21 test sets randomly selected
Single Model 3D Attention U-net [12] (trained from scratch)3Dcoarse0.821 ± 0.06861 training and 21 test sets randomly selected
Coarse-scaled Model 3D U-net [15]3Dcoarse0.819 ± 0.0684-fold CV
Proposed model2Dcoarse0.789 ± 0.0834-fold CV

