Article

Nondestructive Detection of Gaps between Railway Track Slabs and Soil Foundation Using Leaked Air Waves

1
Civil Engineering Division, Infrastructure Management Department, KORAIL, Daejeon 34618, Korea
2
GSG Co. Ltd, Daejeon 34324, Korea
3
Department of Civil and Railroad Engineering, Paichai University, Daejeon 35345, Korea
*
Author to whom correspondence should be addressed.
Appl. Sci. 2020, 10(10), 3347; https://doi.org/10.3390/app10103347
Submission received: 1 February 2020 / Revised: 28 April 2020 / Accepted: 1 May 2020 / Published: 12 May 2020
(This article belongs to the Section Civil Engineering)

Abstract

:

Featured Application

A nondestructive test (NDT) method to detect gaps between railway track slabs and soil foundation using leaked air waves.

Abstract

Gaps generated underneath railway track slabs may cause unstable conditions. Such gaps can form because of different reasons, including settlement of soft soil, unsuitable construction of a concrete slab on loosely compacted soil, and drastic stiffness change in a transition zone between the bridge deck and embankment. The gaps underneath railway track slabs are not easily detectable by common nondestructive test methods. A nondestructive test (NDT) based on a wavelet time–frequency concept is proposed for the practical purpose of detecting gaps under track slabs. The method uses a microphone sensor to catch leaked Rayleigh acoustic waves in the air and an accelerometer to measure surface Rayleigh waves on the slab. In order to investigate the possibility of developing the test system, a finite element analysis (FEA) was performed to simulate Rayleigh wave generation on the concrete surface and in the air. A test system module composed of a microphone and an accelerometer, data acquisition system (DAQ), and an analyzer program was also assembled for a small backyard pilot test. It was verified that the new NDT test system could be successfully adapted for detecting gaps underneath railway track slabs and track bed soil.

1. Introduction

Many concrete structures are built for multiple purposes. These structures include railway track slabs, Portland cement concrete (PCC) pavements, bridge decks and piers, building columns, pipes, and so on. However, old concrete structures may possess severe damage, such as cracks, exfoliation, and voids, and it becomes essential to investigate the damage of old structures before attempting to repair or reconstruct them. Railway concrete slab tracks are a particular concrete structure that can be exposed to harsh operating and environment conditions during service after construction. They experience repetitive and heavy wheel loading and severe temperature variation all day and night and even seasonally. Railway authorities have recently taken interest in new technologies to detect gaps generated at the interface of railway track slabs and track bed soil foundations. It was pointed out that because of subgrade settlements, which is the main cause of making gaps, it is necessary to further optimize the slab–soil interaction [1].
Among the many causes of generating the gaps, soil settlement under railway track structures is noted as the main reason for inducing instabilities in a railway track [2]. All defects and damages including gaps in railway track slabs may decrease the design life of a railway track and prohibit the stable operation of a railway. Thus, it is important to detect gaps between railway track slabs and trackbed soil foundations accurately. Presently available nondestructive test (NDT) methods however, are not effective tools to find gaps generated at the interface of railway track slabs and track bed soil foundations.
Most available NDT methods used for detecting defects in concrete structures are based on sensors that should be installed on and be fully in contact with the surface of the structure. In order to obtain reasonable and reliable test data from this kind of sensor-based NDT method, the structure surface must be carefully prepared. A rough concrete slab surface may impose difficult problems on the NDT tester. It takes time for the NDT tester to prepare the concrete surface to be clean, planar, and smooth by grinding and polishing to get reliable test data. One alternative technique is to adapt a noncontact NDT method that excludes physical direct surface contact between the sensor and the structure to be tested. The noncontact NDT method can reduce the time for treating data collection and data processing. This kind of NDT test method includes RADAR electro-magnetic pulsed waves, X-ray, and infrared thermography [3]. However, it is not easy for the non-contacting NDT methods to display the location and size of defects or gaps in or underneath concrete track slabs. It is difficult to distinguish a gap from the slab when it is surrounded by soils.
An NDT method based on elastic stress waves can detect defects in concrete structures using sensors placed directly on the surface of the structure to obtain propagated elastic stress waves. Such an NDT method used for concrete structures has been adapted in the field to measure slab thickness [4,5,6] or identify the location (depth) and size of the defects in a structure and also to monitor strength of a concrete structure [7,8]. Various types and concepts of NDT methods based on non-contacting acoustic waves have been proposed and developed [9,10,11]. An NDT method based on leaky Rayleigh acoustic waves (NDT-RAWs) is a noncontact method since it uses a microphone to catch leaky Rayleigh acoustic waves in the air above the structure. In short, the NDT-RAW method has the merit of using air waves without direct contact with and influence of the surface of a structure.
A comprehensive study was performed recently for investigating and summarizing state-of-the art developments in the field of nondestructive testing of materials in civil engineering that were mainly related with the detection of flaws and defects in concrete parts and structures and specifically acoustic methods mostly used in the field [10]. Two different methods of NDT were proposed recently to identify a gap under a concrete slab track based on an impact echo test method with wavelet transform analysis [12] and on wave activated stiffness [13], respectively. A new impact echo analysis method was adapted recently where the signals recorded from the microphones were analyzed using percentage of energy information to detect in situ damages. Specially, in this method, an artificial neural network (ANN) was used in order to test the feasibility of using the automaticity of the impact echo test method [14].
One of the NDT methods, GPR (ground penetrating radar), has been used for detecting reinforcement bars in concrete structures and locating underground utility in general. GPR uses radio waves to locate objects and subsurface structures in materials such as soil, rock, concrete, and asphalt pavement. It was found in several studies that a change of properties (dielectric permittivity and relative conductivity) between concrete and air was sensitive enough in cases of voids existence under the concrete structure since strong reflections were measured in GPR data [15,16].
However, restriction of using the GPR method for detecting a gap generated under concrete structures is high interference at shallow depths due to the presence of rebar in the concrete structures that causes a lot of chaotic reflections. This means that GPR is not a proper NDT method to detect gaps between railway track slabs and trackbed soil foundations accurately since densely woven reinforcement rebar exist at the bottom of the concrete slab.
In this study, first, finite element analysis was performed to investigate the possibility, applicability, and effectiveness of using the NDT-RAW method as a sensing method to detect gaps existing immediately underneath concrete slabs of railway tracks. ABAQUS, a general finite element analysis software, was used for this purpose. An imaginary impact load was simulated and applied to the top surface of a concrete slab in order to generate air waves in the air and elastic waves in the concrete slab simultaneously. Leaked acoustic Rayleigh waves transmitted from the top surface of the concrete slab to the air and elastic waves generated in the concrete slab by the imaginary impact load were analyzed with a size and a depth of an imaginary gap underneath the concrete slab and with a surrounding soil stiffness. Second, for verification purposes, a small concrete slab was built on a test site for simulating a slab of a railway concrete track and for obtaining wave propagation simulation by applying an impact load to the surface of the slab. Leaky acoustic wave and elastic wave were obtained from the impact test and were analyzed to obtain useful information that can be used for developing a new NDT-RAW technique for the detection of gaps between slabs of railway tracks and trackbed soil foundations.

2. Signal Processing

Short-Time Fourier Transform

Wave propagation obtained in the time domain does not provide any information on the change in frequency content of the response due to the presence of a gap underneath a slab. It is useful to adapt spectral analysis with the analysis of the response in frequency domain. However, it is not easy to consider the time location of the changes in the spectrum when Fourier transform is used.
Even though Fourier transform is a powerful signal processing technique, time information is not revealed properly in the frequency domain. Thus, Fourier transform is not good for nonstationary signals that vary over time. Gabor [17] suggested an alternative way of active Fourier transform that analyzes only a small section of a signal at a time. This technique is known as short-time Fourier transform (STFT) and contains both time and frequency information.
For a slab with a gap, it may be supposed that wave reflections from the gap boundaries change both the time history and the spectrum of the response recorded at the slab surface. Therefore, time–frequency analysis of the surface response is superior to time domain or frequency domain only. Unlike Fourier analysis, STFT can be used to explain the change of spectrum in a time–frequency plane simultaneously.
With the discrete time domain signal x, the STFT can be obtained from the usual Fourier transform by multiplying the time signal x by an appropriate sliding time window w [18,19,20]. The location of the sliding window adds a time dimension and results in a time varying frequency analysis. The windowed signal wave propagation obtained in the time domain does not provide any information on the change in frequency content of the response due to the presence of a gap underneath a slab. It is useful to adapt spectral analysis with the analysis of the response in frequency domain. However, it is not easy to consider the time location of the changes in the spectrum when Fourier transform is used.
The windowed signal y ( k t h ) consisting of N w points is computed for the (k−th) window position, as follows [19]:
y i ( k t h ) = w i x i + k q
w k = 0.5 0.5 cos ( 2 π k N w ) ,   k = 0 ,   ,   N w 1
where x is the time domain signal, w is the Hanning window, and N w is the number of points in the Hanning window. By adapting this logical procedure that is applied for each of the windowed signals, the discrete Fourier transform (DFT) provides a k−th sub-matrix of the Y matrix:
Y ( k t h ) = D F T ( y ( k t h ) )
Frequency characteristics are obtained at each time step. By repeating the procedure described, a Y matrix defines the STFT of the time signal x as follows:
Y = S T F T ( x )
As described by Song [20], the STFT algorithm can be briefly explained.
It was pointed out that the time window width and the overlap between two successive time windows should be selected properly for computing the STFT since a wide window in the time domain improves the frequency resolution but impairs the time resolution. Therefore, the successful implementation of the STFT depends on balancing the trade-off between the frequency and time resolutions [19,20]. In this study, 1024 discrete time signal data points were obtained from FEA computed data and were short-time Fourier transformed with 128 window points at the center of each of the 16 time sections. A fixed single function called mother wavelet is scaled and translated into wavelets.

3. Finite Element Analysis of a Railway Track Slab with a Gap

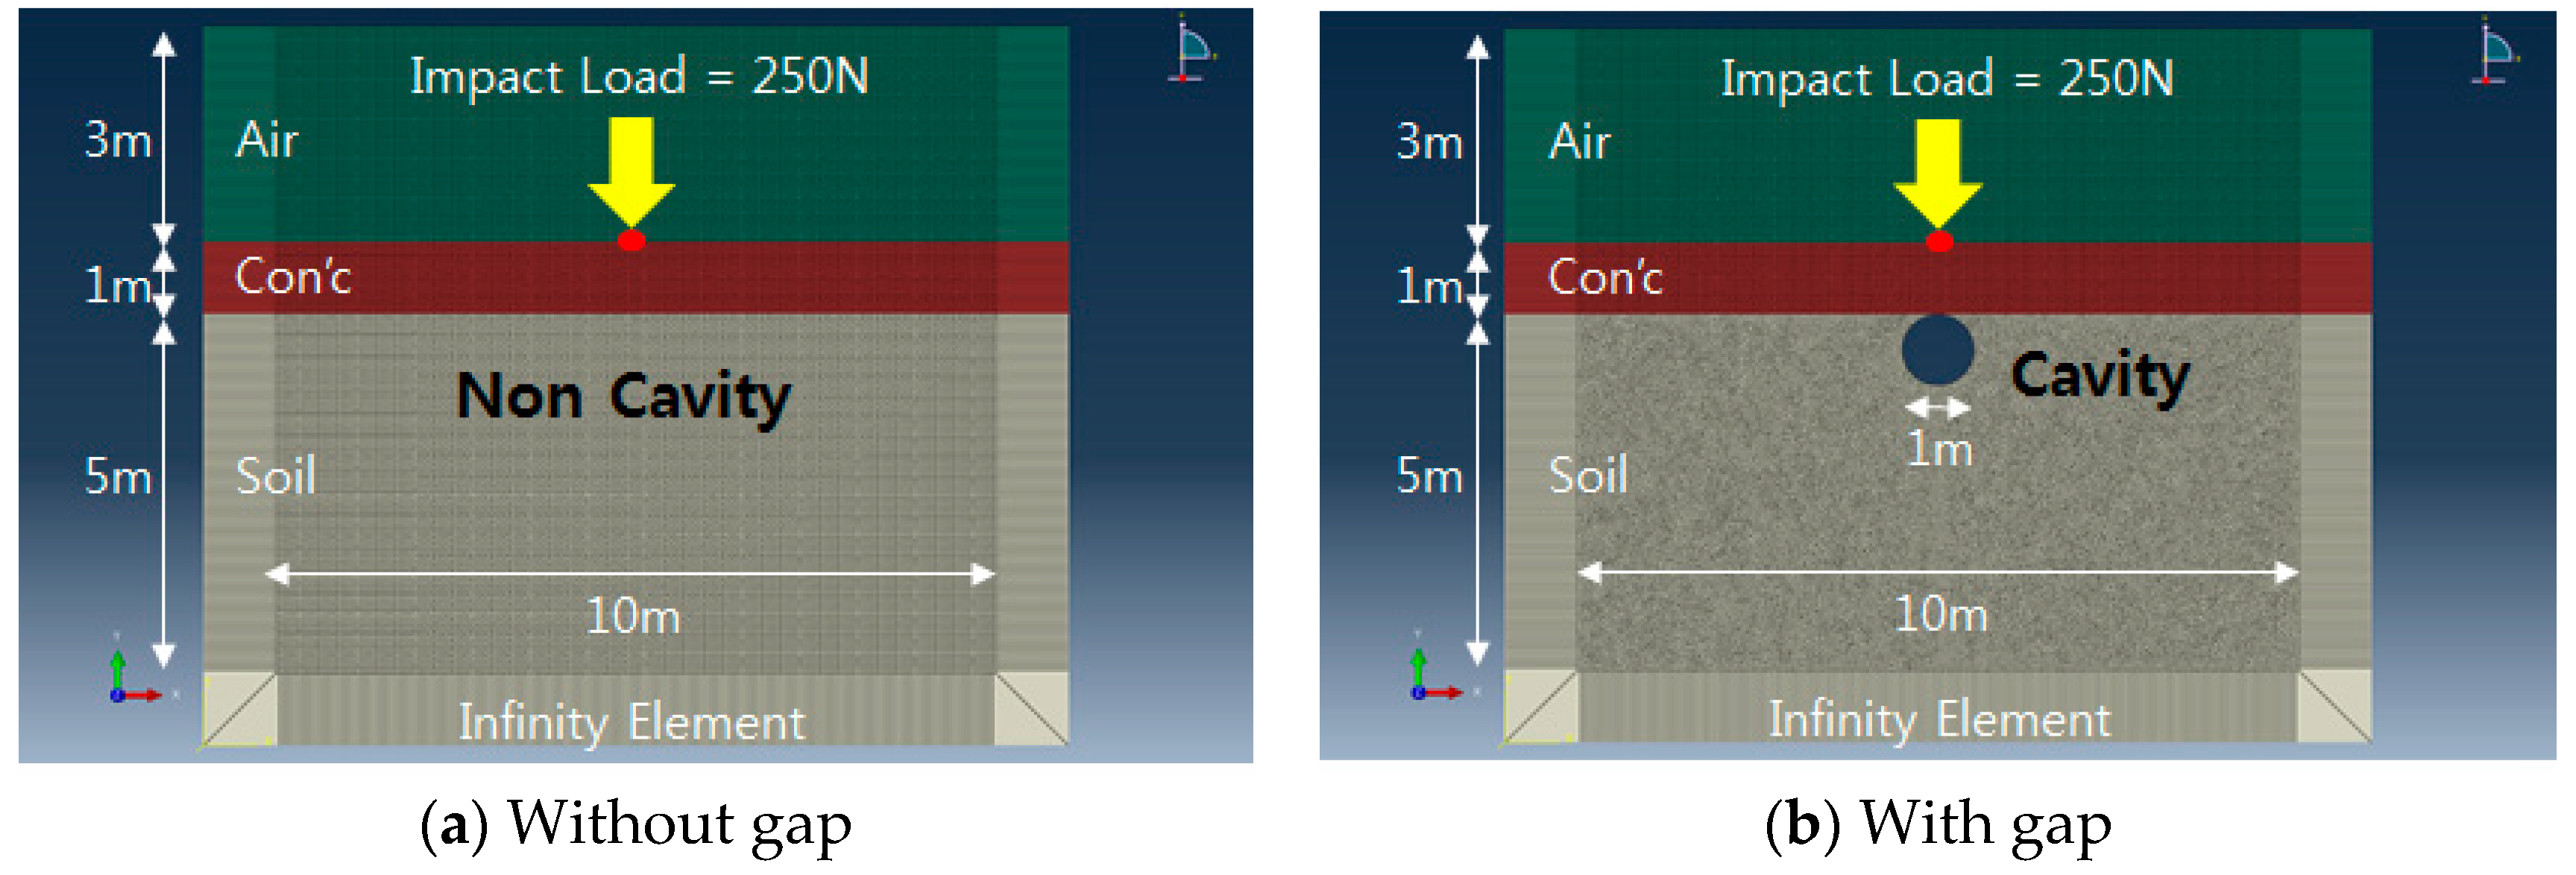
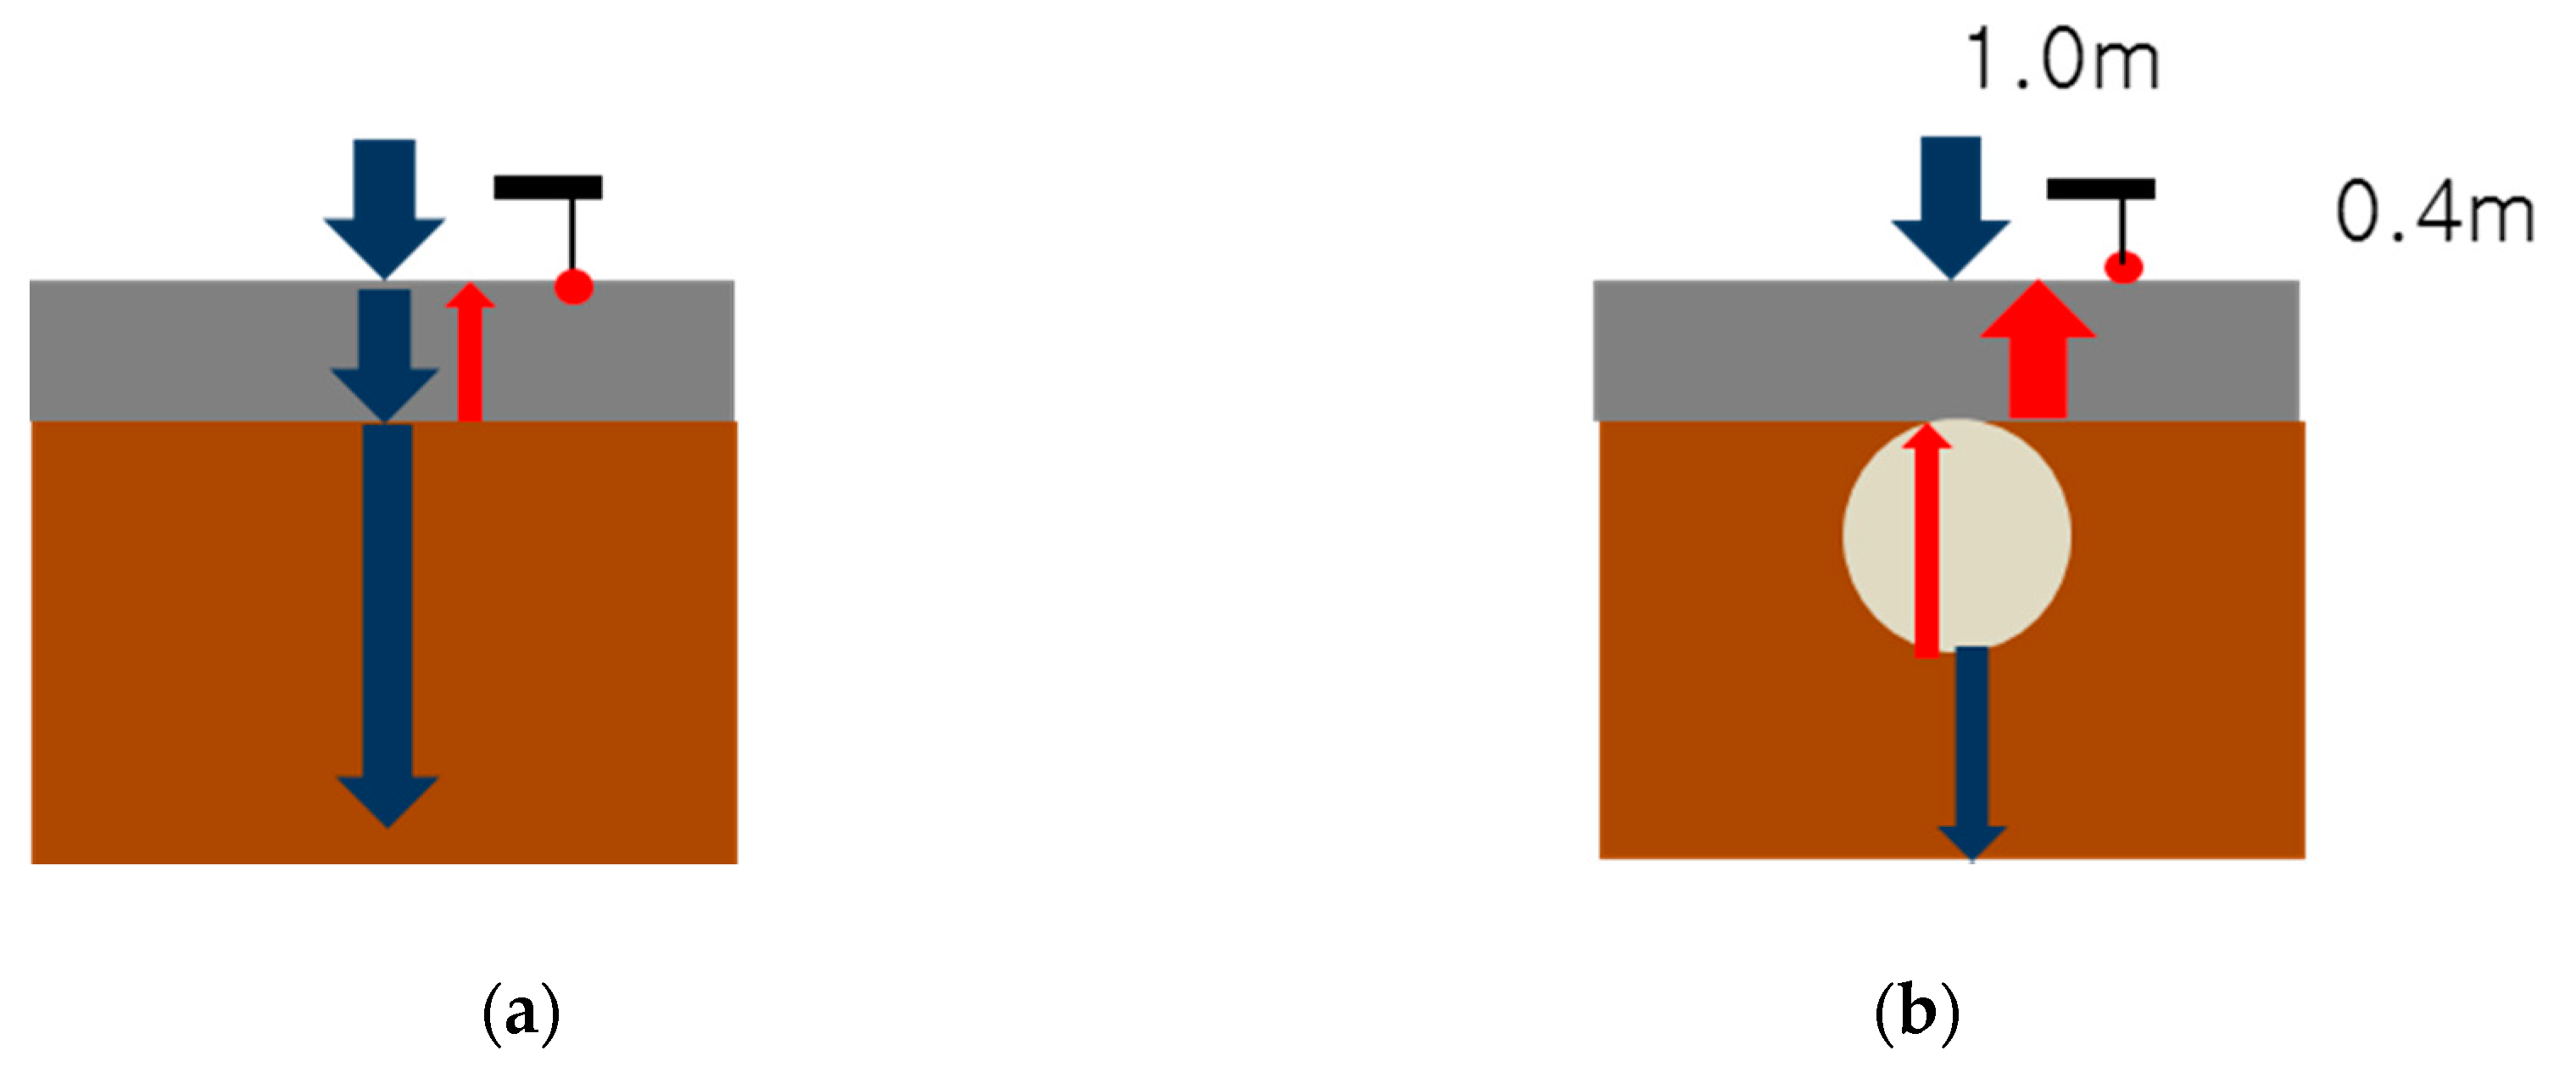
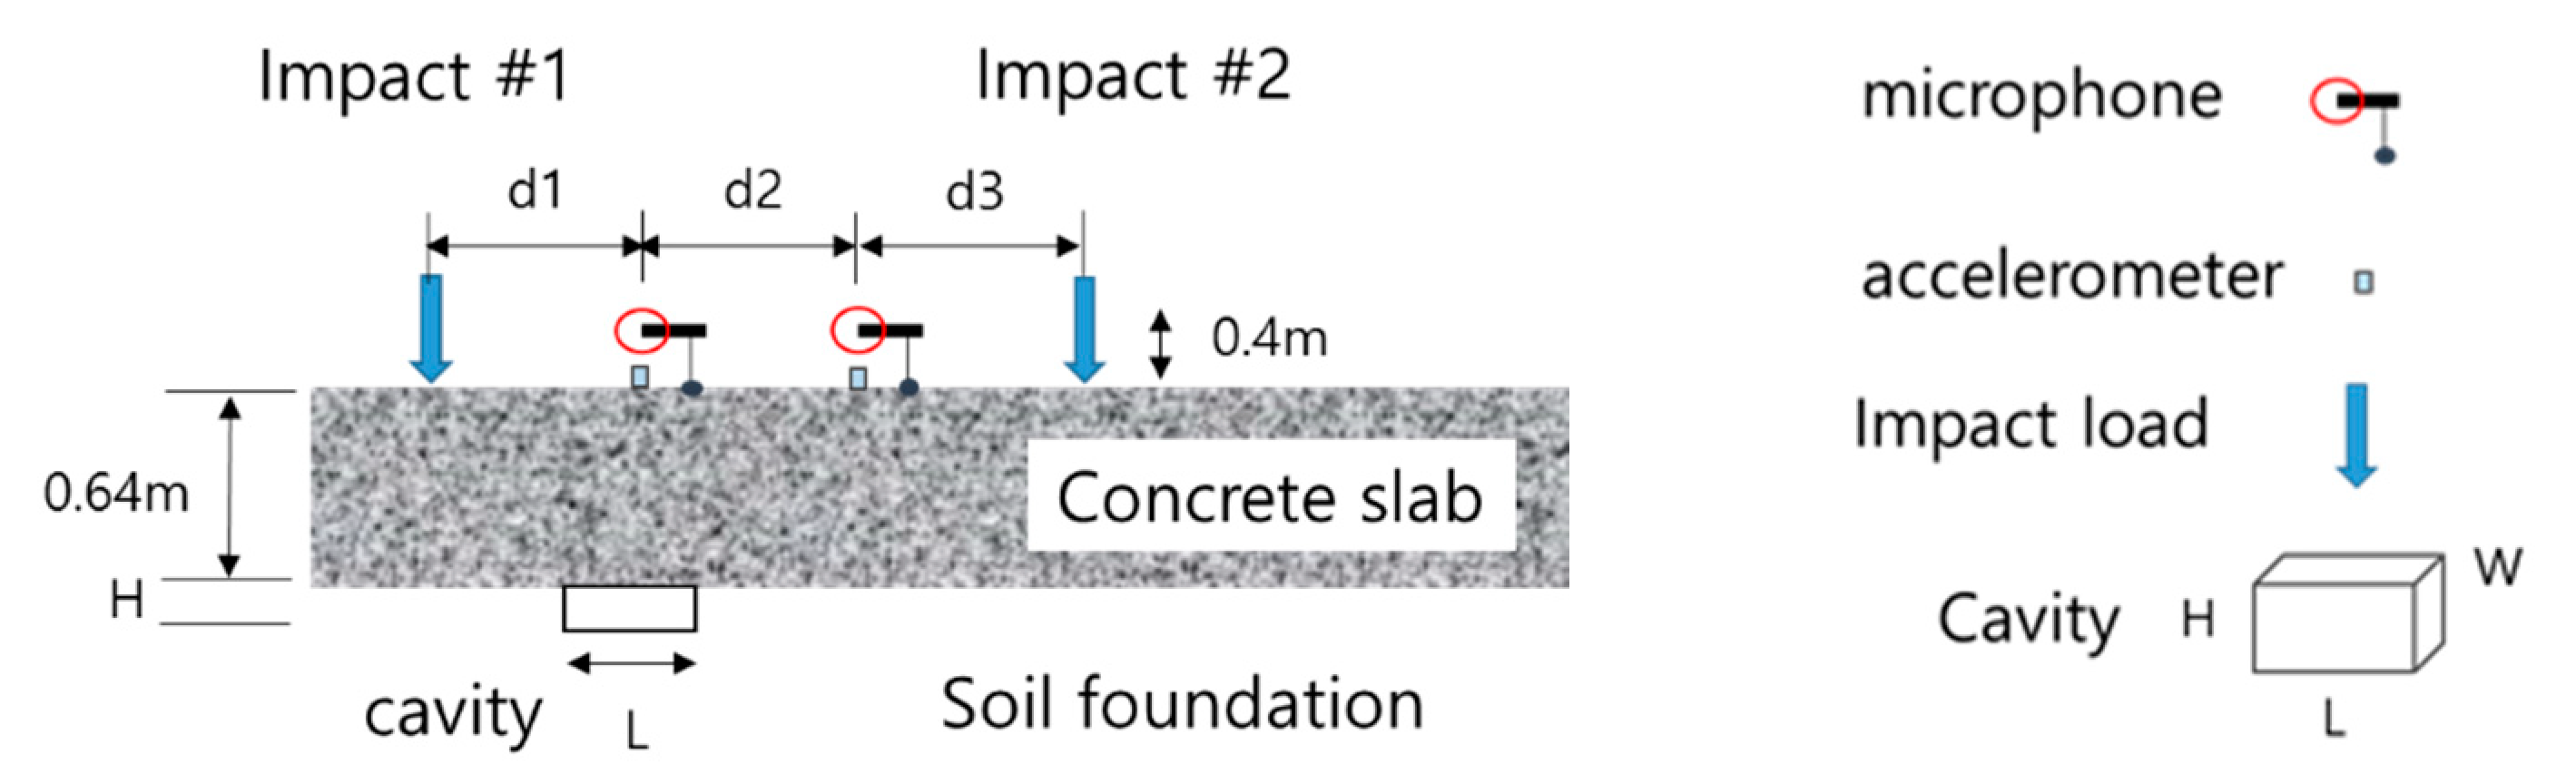
3.1. Numerical Modeling of Track Slab

In this study, ABAQUS software [21] was used for simulating a nondestructive test (NDT) on a concrete slab representing a high-speed railway track ballast. Stress wave propagation was simulated through a transient response analysis on a plane strain finite element model by applying an imaginary impact load to a model concrete slab surface. A concrete slab was modeled to be constructed on a homogeneous half space.
Two models of a railway track slab were assumed for simulation comparison purposes. One was modeled as a section of railway track slab with a gap (diameter D = 1.0 m), and the other was modeled as a section of railway track slab without a gap, as shown in Figure 1. The diameter of the gap was selected from the results of a previous study that was focused on investigation of the stability of trackbed foundation with different sizes of gap loaded by railway car on top of a concrete slab track [22]. From the developed stability chart, a sensitive parameter consisting of gap depth z = 0 m, gap diameter D = 1.0 m, and soil modulus E = 40 MPa was chosen in this study since this sensitive parameter is located on a threshold curve in the chart where the trackbed foundation under the slab can be endangered. In addition, in a practical point of view for the authority (KORAIL), a gap smaller than 1.0 m diameter of the gap is little bit more difficult to be detected using the spectrum generated by rail car wheel load since the concrete slab is severely thick (1.0 m) and its bending stiffness EI (E=concrete elastic modulus, I= moment of inertia) in the longitudinal direction is big enough [22].
The finite element model was 10 m high, 9 m wide, and included air elements above the slab. For simple modeling, the elastic modulus of the soil was assumed as 40 MPa, the concrete was 3 GPa, and the air was 0.1 MPa, which was obtained from the ideal gas equation. The depth of the soil below the track slab was 5.0 m. The thickness of the concrete slab was 1.0 m, and this simulated the real thickness of a high-speed railway track slab. The air zone above the track was modeled as 3.0 m high.
An imaginary impact load was applied to the concrete surface for 3.0 × 10⁻⁵ s, and it was simulated as being a half sine wave and its peak load was 250 N. The simulated maximum load was obtained from the impact of a sledgehammer as a general impact echo (IE) test applied onto the concrete surface in the field. The duration time of the impact t c was calculated by considering the following equation:
t c = 5.97 [ ρ s ( δ s + δ p ) ] 0.4 ( R s p h e r e / H 0.1 )
where δ p = ( 1 ν p 2 ) / E p , δ s = ( 1 ν s 2 ) / E s , ρ s is the density of the imaginary steel ball or sledge hammer head, R s p h e r e is the radius of the steel ball, ν s is the Poisson’s ratio of the steel ball, and E p is the elastic modulus of the steel ball.
For the time of impact loading ( t c ), impact energy equivalent to the energy level of the sledge hammer loading applied to the slab surface was used to compute it by considering an imaginary falling height of an equivalent small steel ball with the same weight of the sledge hammer head.
Sansalone and Street [23] proposed that the maximum frequency of an impact test could be represented as:
f max = 1.25 / t c
Therefore, the minimum wavelength can be calculated by the following basic equation:
λ = V c / f max
where V c = the compressive P-wave velocity of the material to be tested.
For the characteristics of force–time function and frequency distribution, Song [20] studied the distribution of the frequency according to the diameter of various steel balls and the force–time function.
The element size is critically important for this kind of dynamic analysis problem using FEM. If element dimensions are too large, high frequencies are filtered. On the other hand, those that are too small cause numerical instability and require considerable computational resources [20,24,25]. The proper size of the finite element should be determined by taking into account the lowest velocity and the highest frequency of the wave propagation. Thus, the proper finite element size Δx must be decided by considering the minimum wavelength of a propagating wave ( λ min ), the minimum wave velocity of the medium ( V min ), and the highest frequency of a propagating wave ( f max ). The maximum frequency of interest of a wave propagating into air generated by impact load was assumed to be 1700 Hz. The maximum frequency ( f max ) of a wave propagating into air was observed from field impact load test on a model concrete slab [26]. Therefore, the element size Δx can be computed based on the proposed criteria as the following given by Zerwer et al. [27].
Δ x C · λ m i n
where λ m i n is the minimum wavelength of a propagating wave. C is a constant (C = 0.25 for consistent mass matrices whereas C = 0.2 for lumped mass matrices). Thus, considering the highest frequency range of a propagating wave generated by an impact load in air as described, the element size Δx = 0.05 m was selected for FEA where acoustic wave speed was 340 m/s at 15 °C.
Infinite elements were applied to boundaries of the finite element mesh in order to reduce the influence of reflected waves induced by the impact load. For investigating the differences of transmitted leaky waves into the air from the concrete slab surface and elastic stress waves in the concrete body with a gap or without a gap, a ball-shaped gap assumed as the gap with a diameter of 1.0 m was simulated to be generated exactly underneath the track slab and at the top of the track bed foundation soil, as shown in Figure 1.
Table 1 describes the input parameter values for the FEA modeling of railway track section.
Leaky Rayleigh waves and stress waves were generated by the impact load applied at the center of the top surface of the concrete slab. Some of the stress waves generated in the concrete leaked and transmitted into the air. The transmitted leaked waves in the air and the stress waves generated in the concrete slab were obtained first in the time domain and were converted to the frequency domain by fast Fourier transform (FFT).

3.2. Analysis of Computed Results by Finite Element Analysis

Figure 2 elaborates on the concept of generating and receiving stress waves in the concrete slab and leaked Rayleigh waves in the air separately in this FE simulation of NDT in cases of with and without a gap. As can be seen in Figure 2, a marginal number of reflected waves is going to be transmitted into the air if a gap does not exist underneath a slab, as can be easily expected. However, a considerable number of waves is going to be transmitted into the air after the waves are reflected at the boundaries between the slab and the soil as well as between the gap bottom and the soil, respectively. These characteristics of wave transmission are investigated in this study in detail by analyzing wavelet distribution and autospectrum density after studying generated amplitude changes in frequency and time domains, respectively.

3.2.1. Comparison of Acceleration Level with Time

Figure 3 illustrates the variation of acceleration amplitudes with time obtained for 0.05 s generated on the top surface of the concrete slab. The acceleration amplitudes were computed at the surface of the slab 1.0 m away from the point of impact loading. It was clearly identified that the peak amplitude generated in the case of with a gap was six times larger than that of the case of without a gap. In the case of with a gap, immediately after peak acceleration was generated in a relatively short time after impacting, it decreased much more greatly in a short time compared to the case of without a gap.
Figure 4 describes the variation of acceleration amplitudes of leaked Rayleigh waves into air computed 0.4 m above the concrete slab surface and 1.0 m away from the impact loading point for the cases of without a gap and with a gap separately. For the case of with a gap, the generated maximum amplitude was about seven times larger than that of the case of without a gap. In the case of without a gap, the peak value was generated at 0.027 s after impact loading. However, in the case of with a gap, the peak value was generated at 0.016 s after impact loading. This means that the peak value appeared much more quickly in the case of with a gap than without a gap.

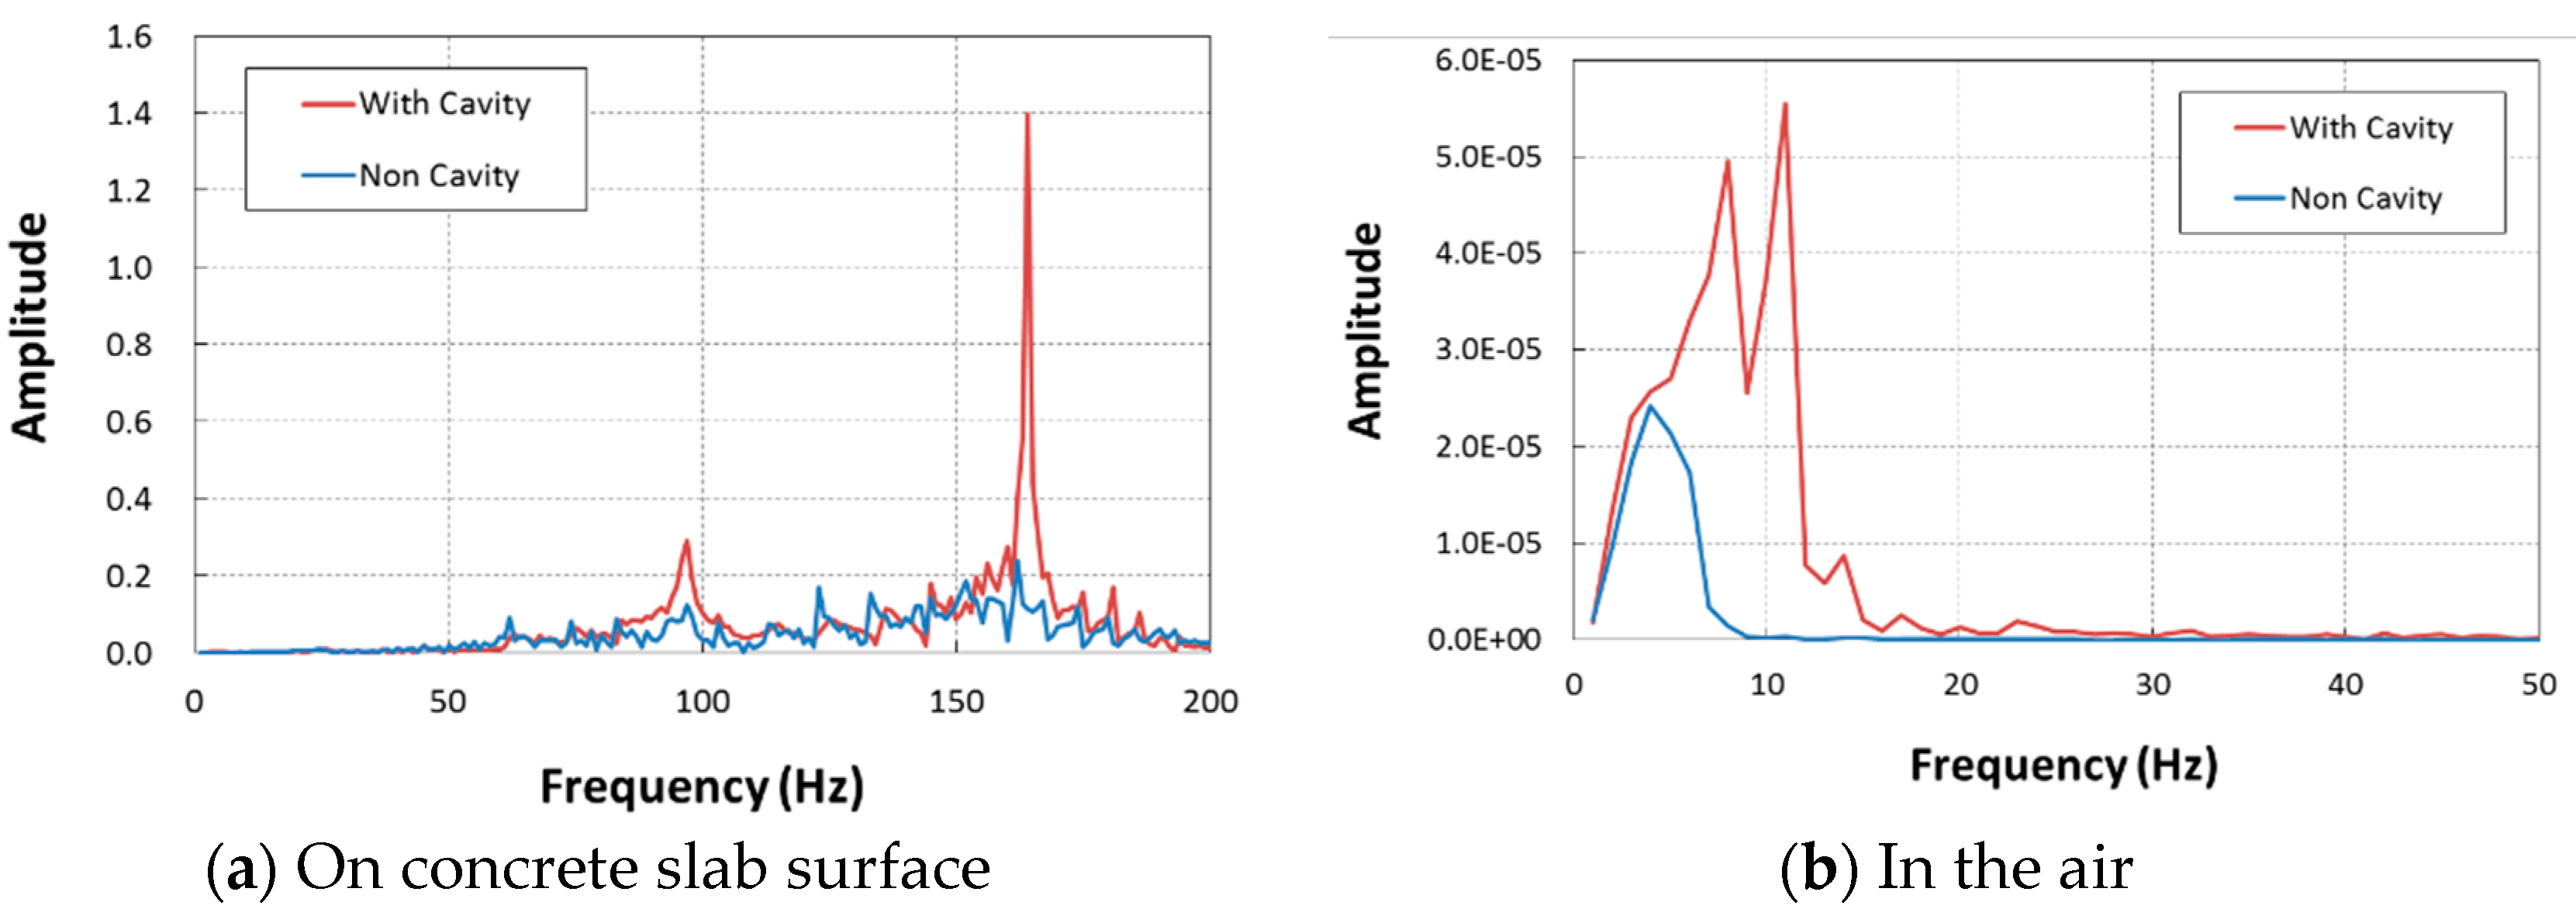
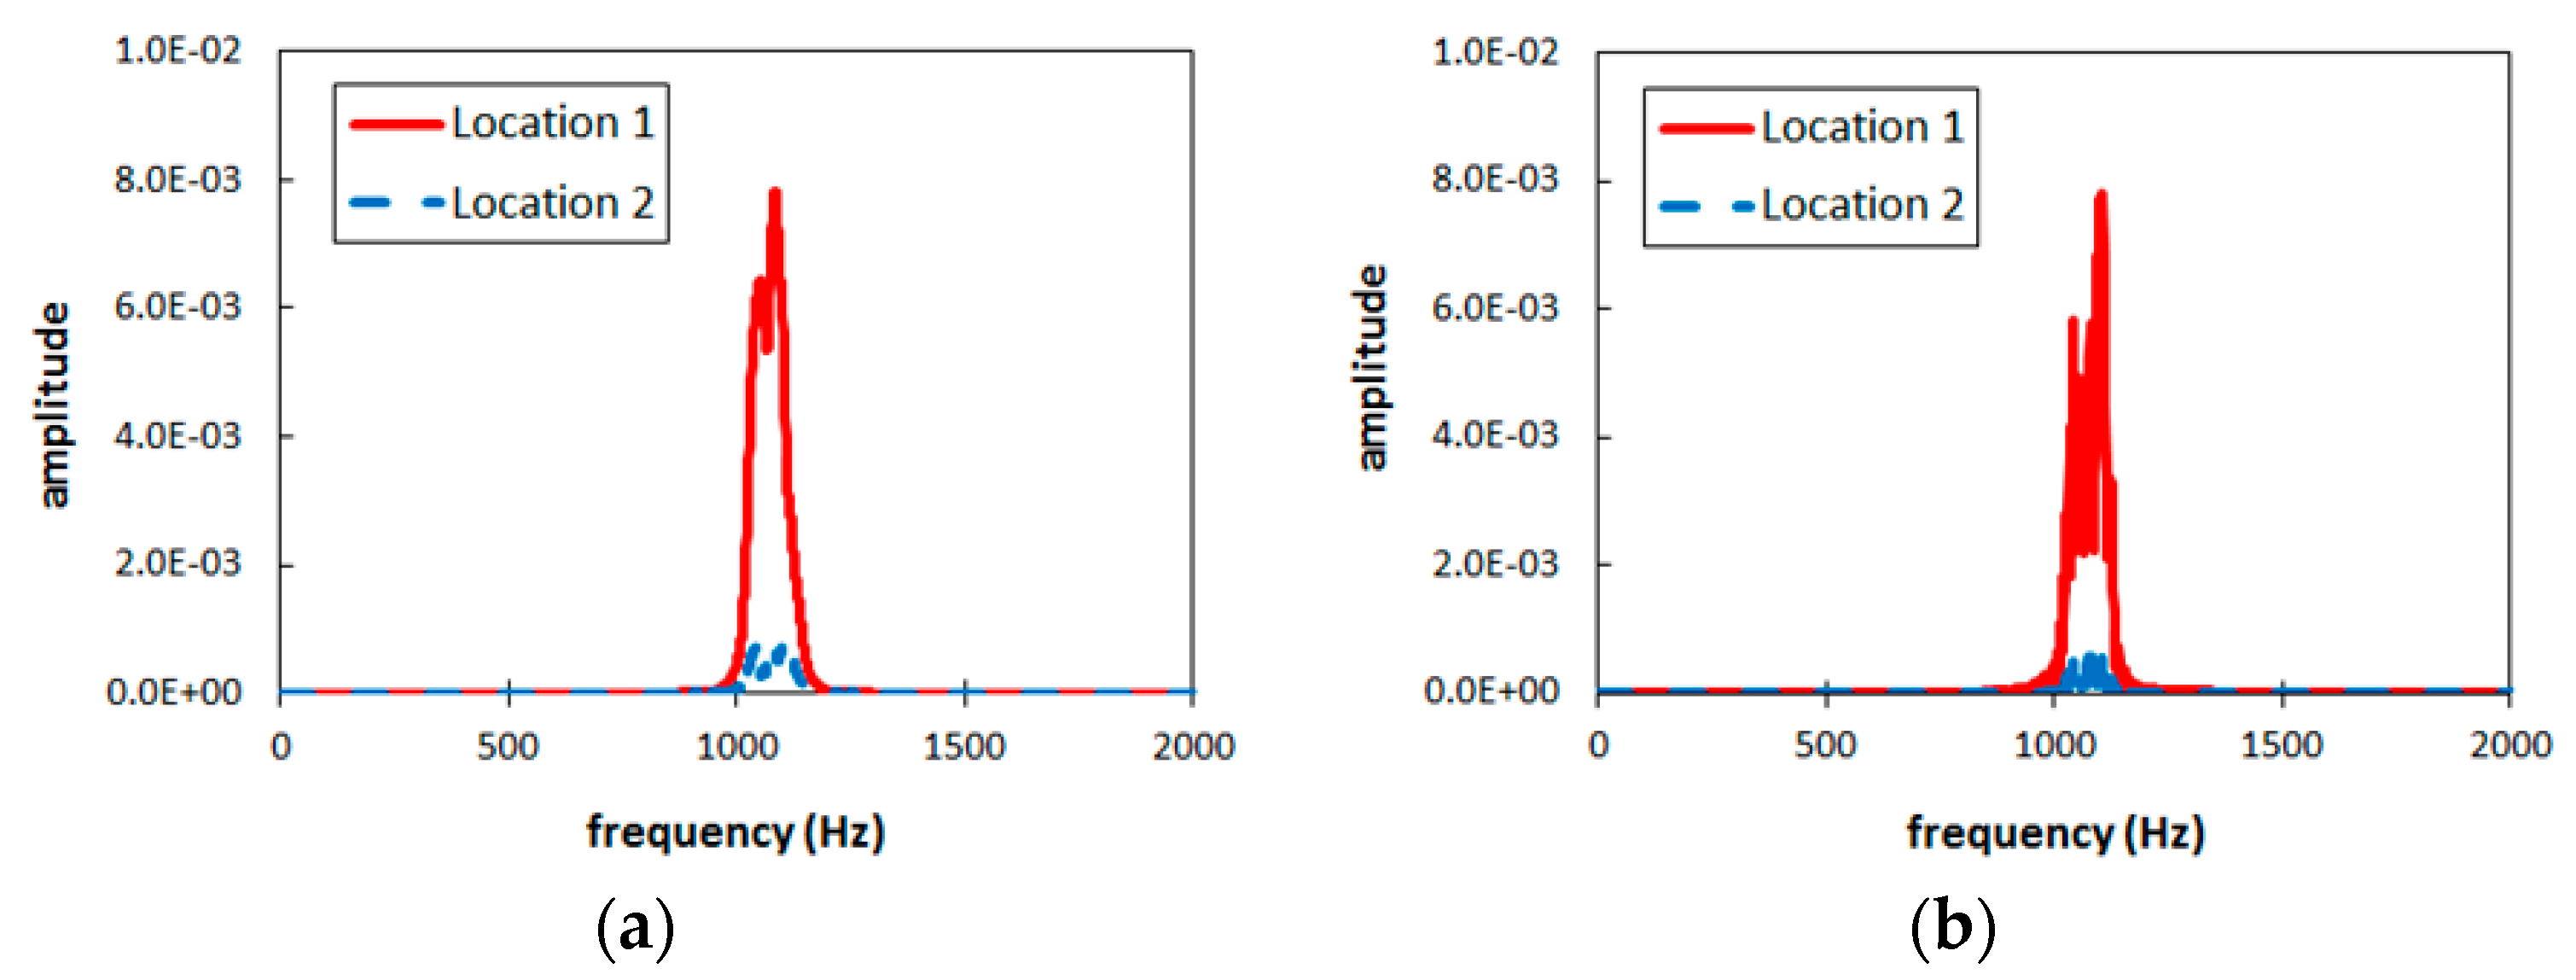
3.2.2. Comparison of Acceleration Level in Frequency Domain

Figure 5 compares the variation of acceleration amplitudes generated on the concrete surface and leaked into the air, respectively. These were both obtained by FFT of obtained data computed by ABAQUS in the time domain. The amplitude graph obtained on the concrete surface produced peak modes clearly at certain higher frequency ranges in the case of with a gap compared to without a gap. The peaks of amplitudes are much higher than those of the non-gap case. In addition, at the second mode of peak that was generated at resonant frequency of around 170 Hz, the peak value was seven times larger than that of the non-gap cases. At the first mode of resonance generated around 90 Hz, the peak value in the case of with gap was not much bigger than that of the without gap. The first mode resonance was thought to be generated due to total body of the slab and soil ground. However, the second mode resonance was generated mainly due to the slab itself, which was interfaced directly with the gap. The leaked Rayleigh waves into air were also converted into the frequency domain. In the case of gap existence, peak amplitude was generated at 7 to 12 Hz, which was much lower than those captured on the concrete surface. The peak values of the case of with a gap were two times larger than those of the without a gap case. In addition, amplitude generated in the gap case was distributed over a wider range of frequency than that in the non-gap case.

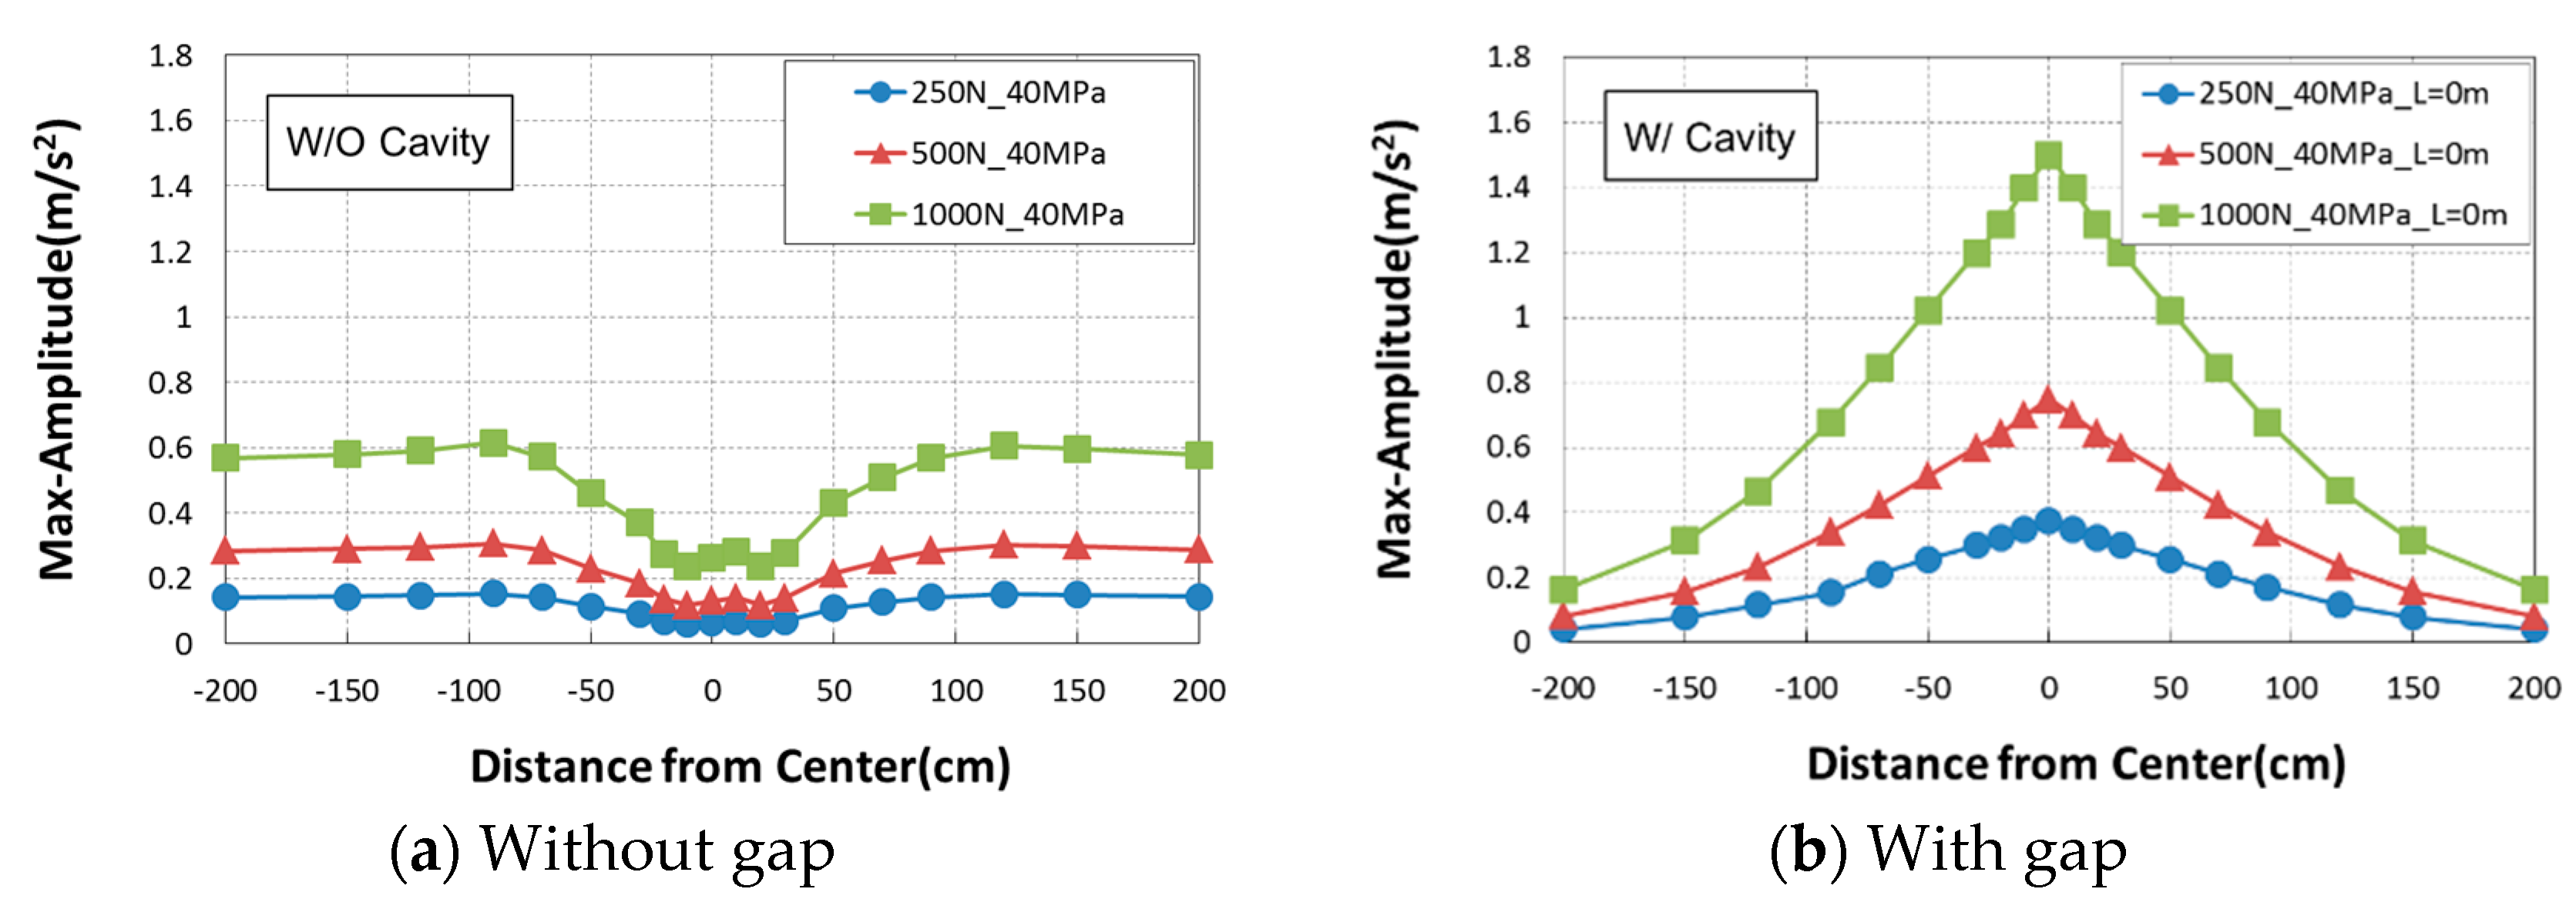
3.2.3. Comparison of Maximum Acceleration Level

After applying an impact load on the concrete slab surface, the maximum acceleration a max generated on the surface was investigated.
As described in Figure 6, maximum acceleration a max was obtained on the concrete surface with change of impact load size at a given assumed soil stiffness of 40 MPa. As can be seen in Figure 6, in the case of without a gap, it was easily verified that the maximum acceleration a max increased with distance proportionally somehow from the impact position. In addition, near the center, maximum acceleration a max was lower than the values computed at the outside area. The maximum acceleration a max increased also with impact load size.
However, in the case of with a gap, the maximum acceleration a max was larger near the gap center where the impact load was applied and compared with other places. Notably, the maximum acceleration a max produced a peak at the center, then decreased with distance from the center. The maximum acceleration a max contour looks like a conical shape. In the case of with a gap, Figure 6 illustrates that the nearer the loading point in the case of a gap, the higher the a max generated on the top surface of the concrete slab. All values of a max were obtained by FFT of generated data.
After applying an impact load on the concrete slab surface, the maximum acceleration amplitude generated in the air was investigated. Figure 7 illustrates that much higher maximum amplitudes were generated intensively near the impact loading point in the case of with a gap as opposed to without a gap. Only a slightly small maximum amplitude was generated at the loading point in the case of without a gap. Additionally, increments of the maximum amplitude with increase of impact load level were clearly identified in the gap case compared to without a gap case.

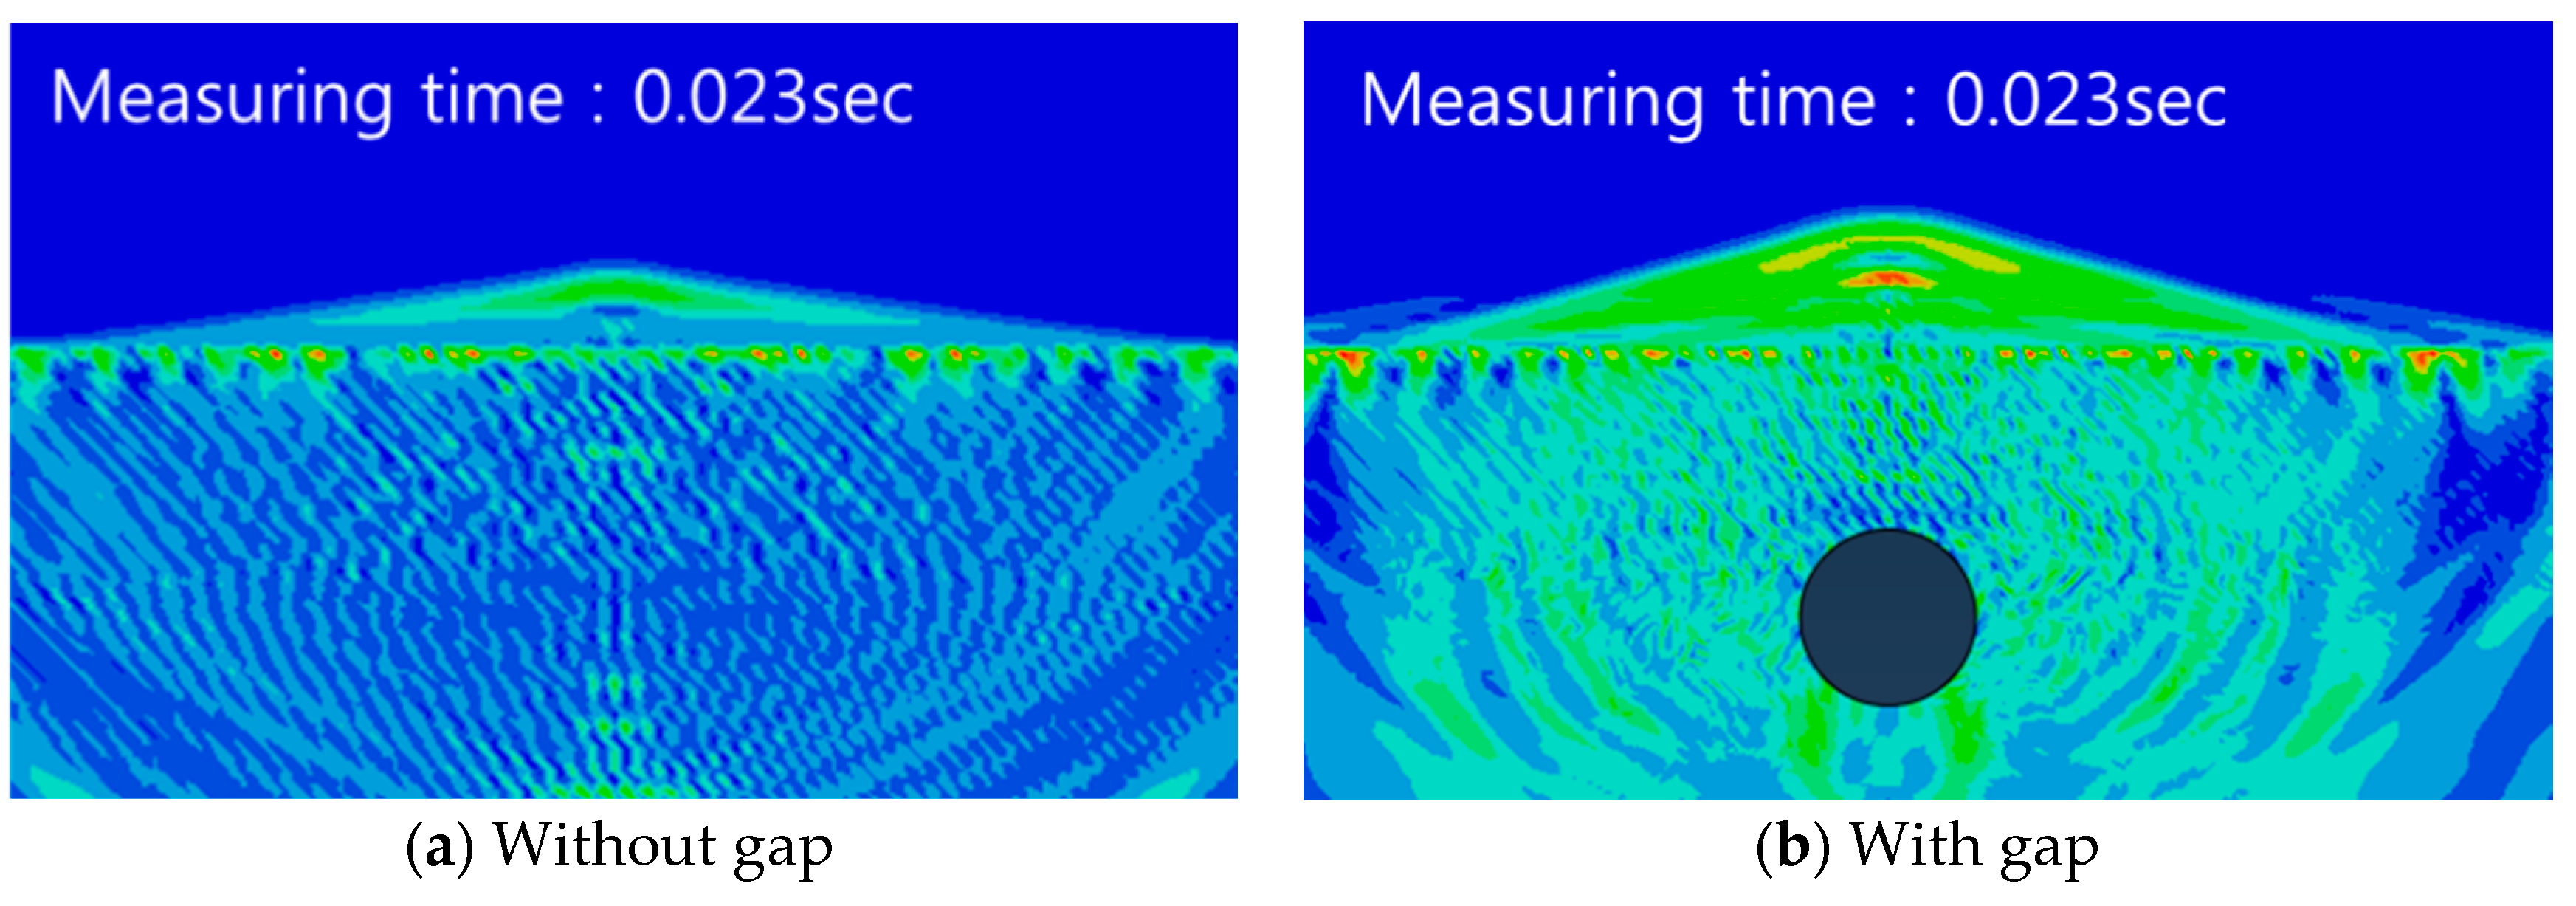
3.2.4. Contours of Acceleration Level in Slab and Air

Figure 8 compares the contours of acceleration level for the slab without a gap and with a gap separately. The spread acceleration contours in the air and in the concrete slab were obtained at 0.023 s after impact loading of 250 N was applied to the slab surface. As can be seen in Figure 8, acceleration levels were much higher in the air and in the concrete slab, as depicted by the wide red and yellow colored images for with a gap than those generated for without a gap.

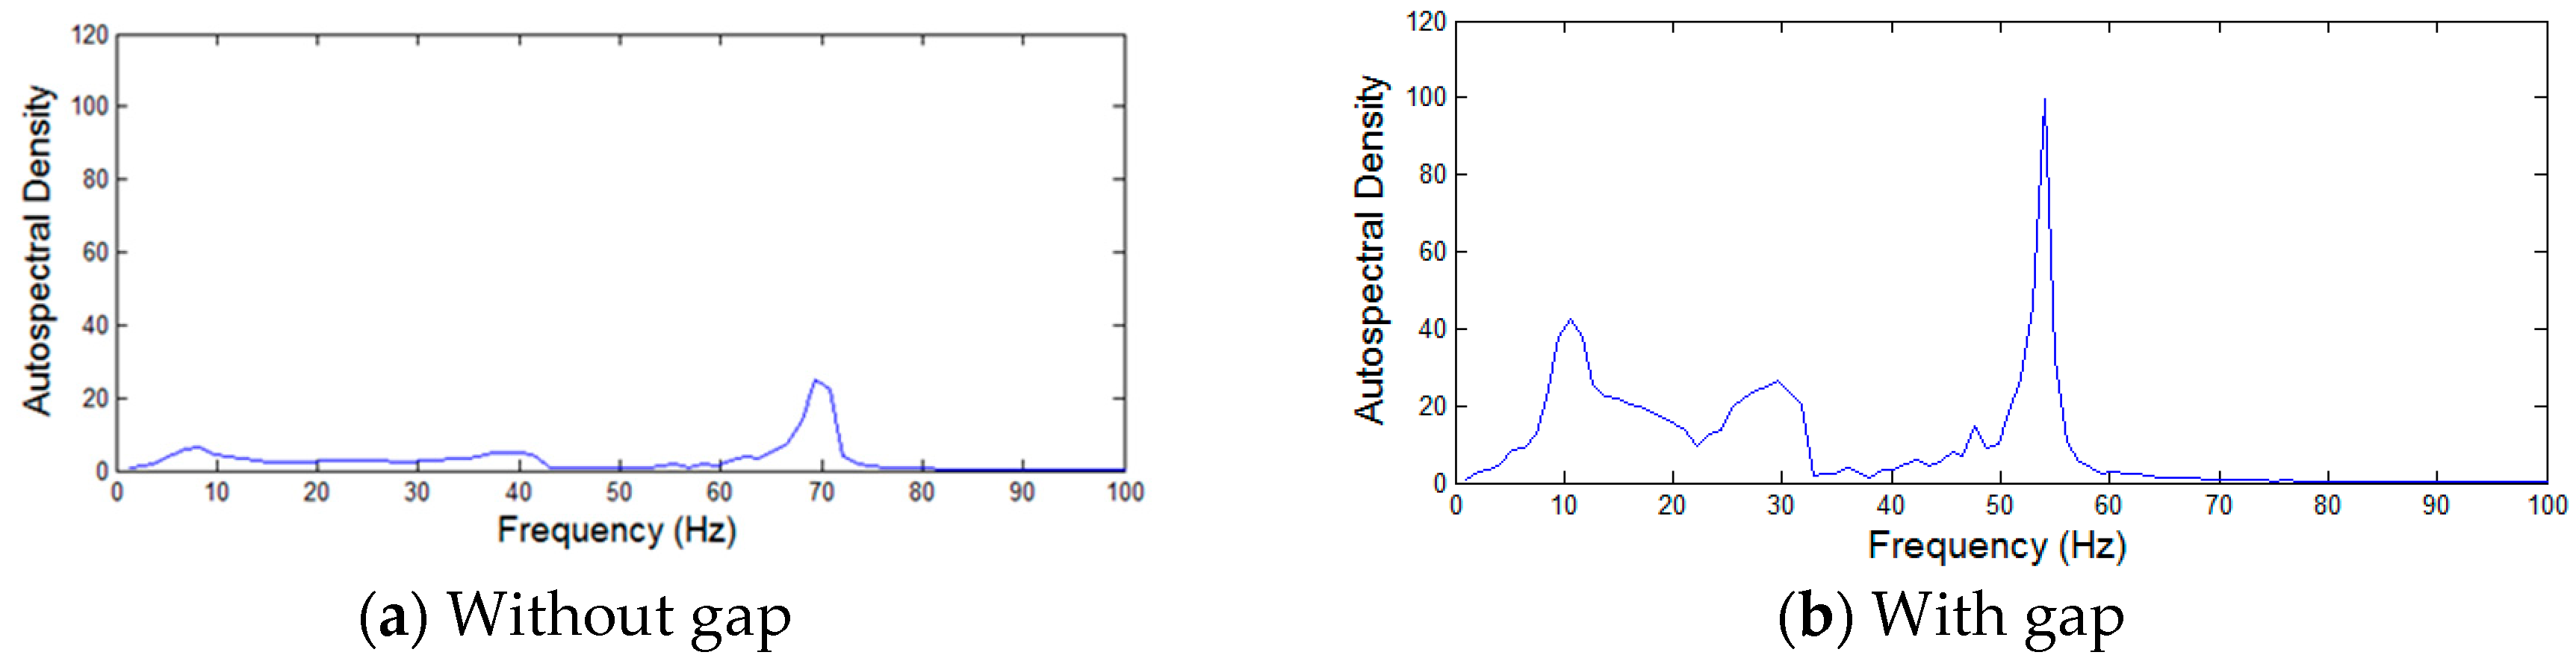
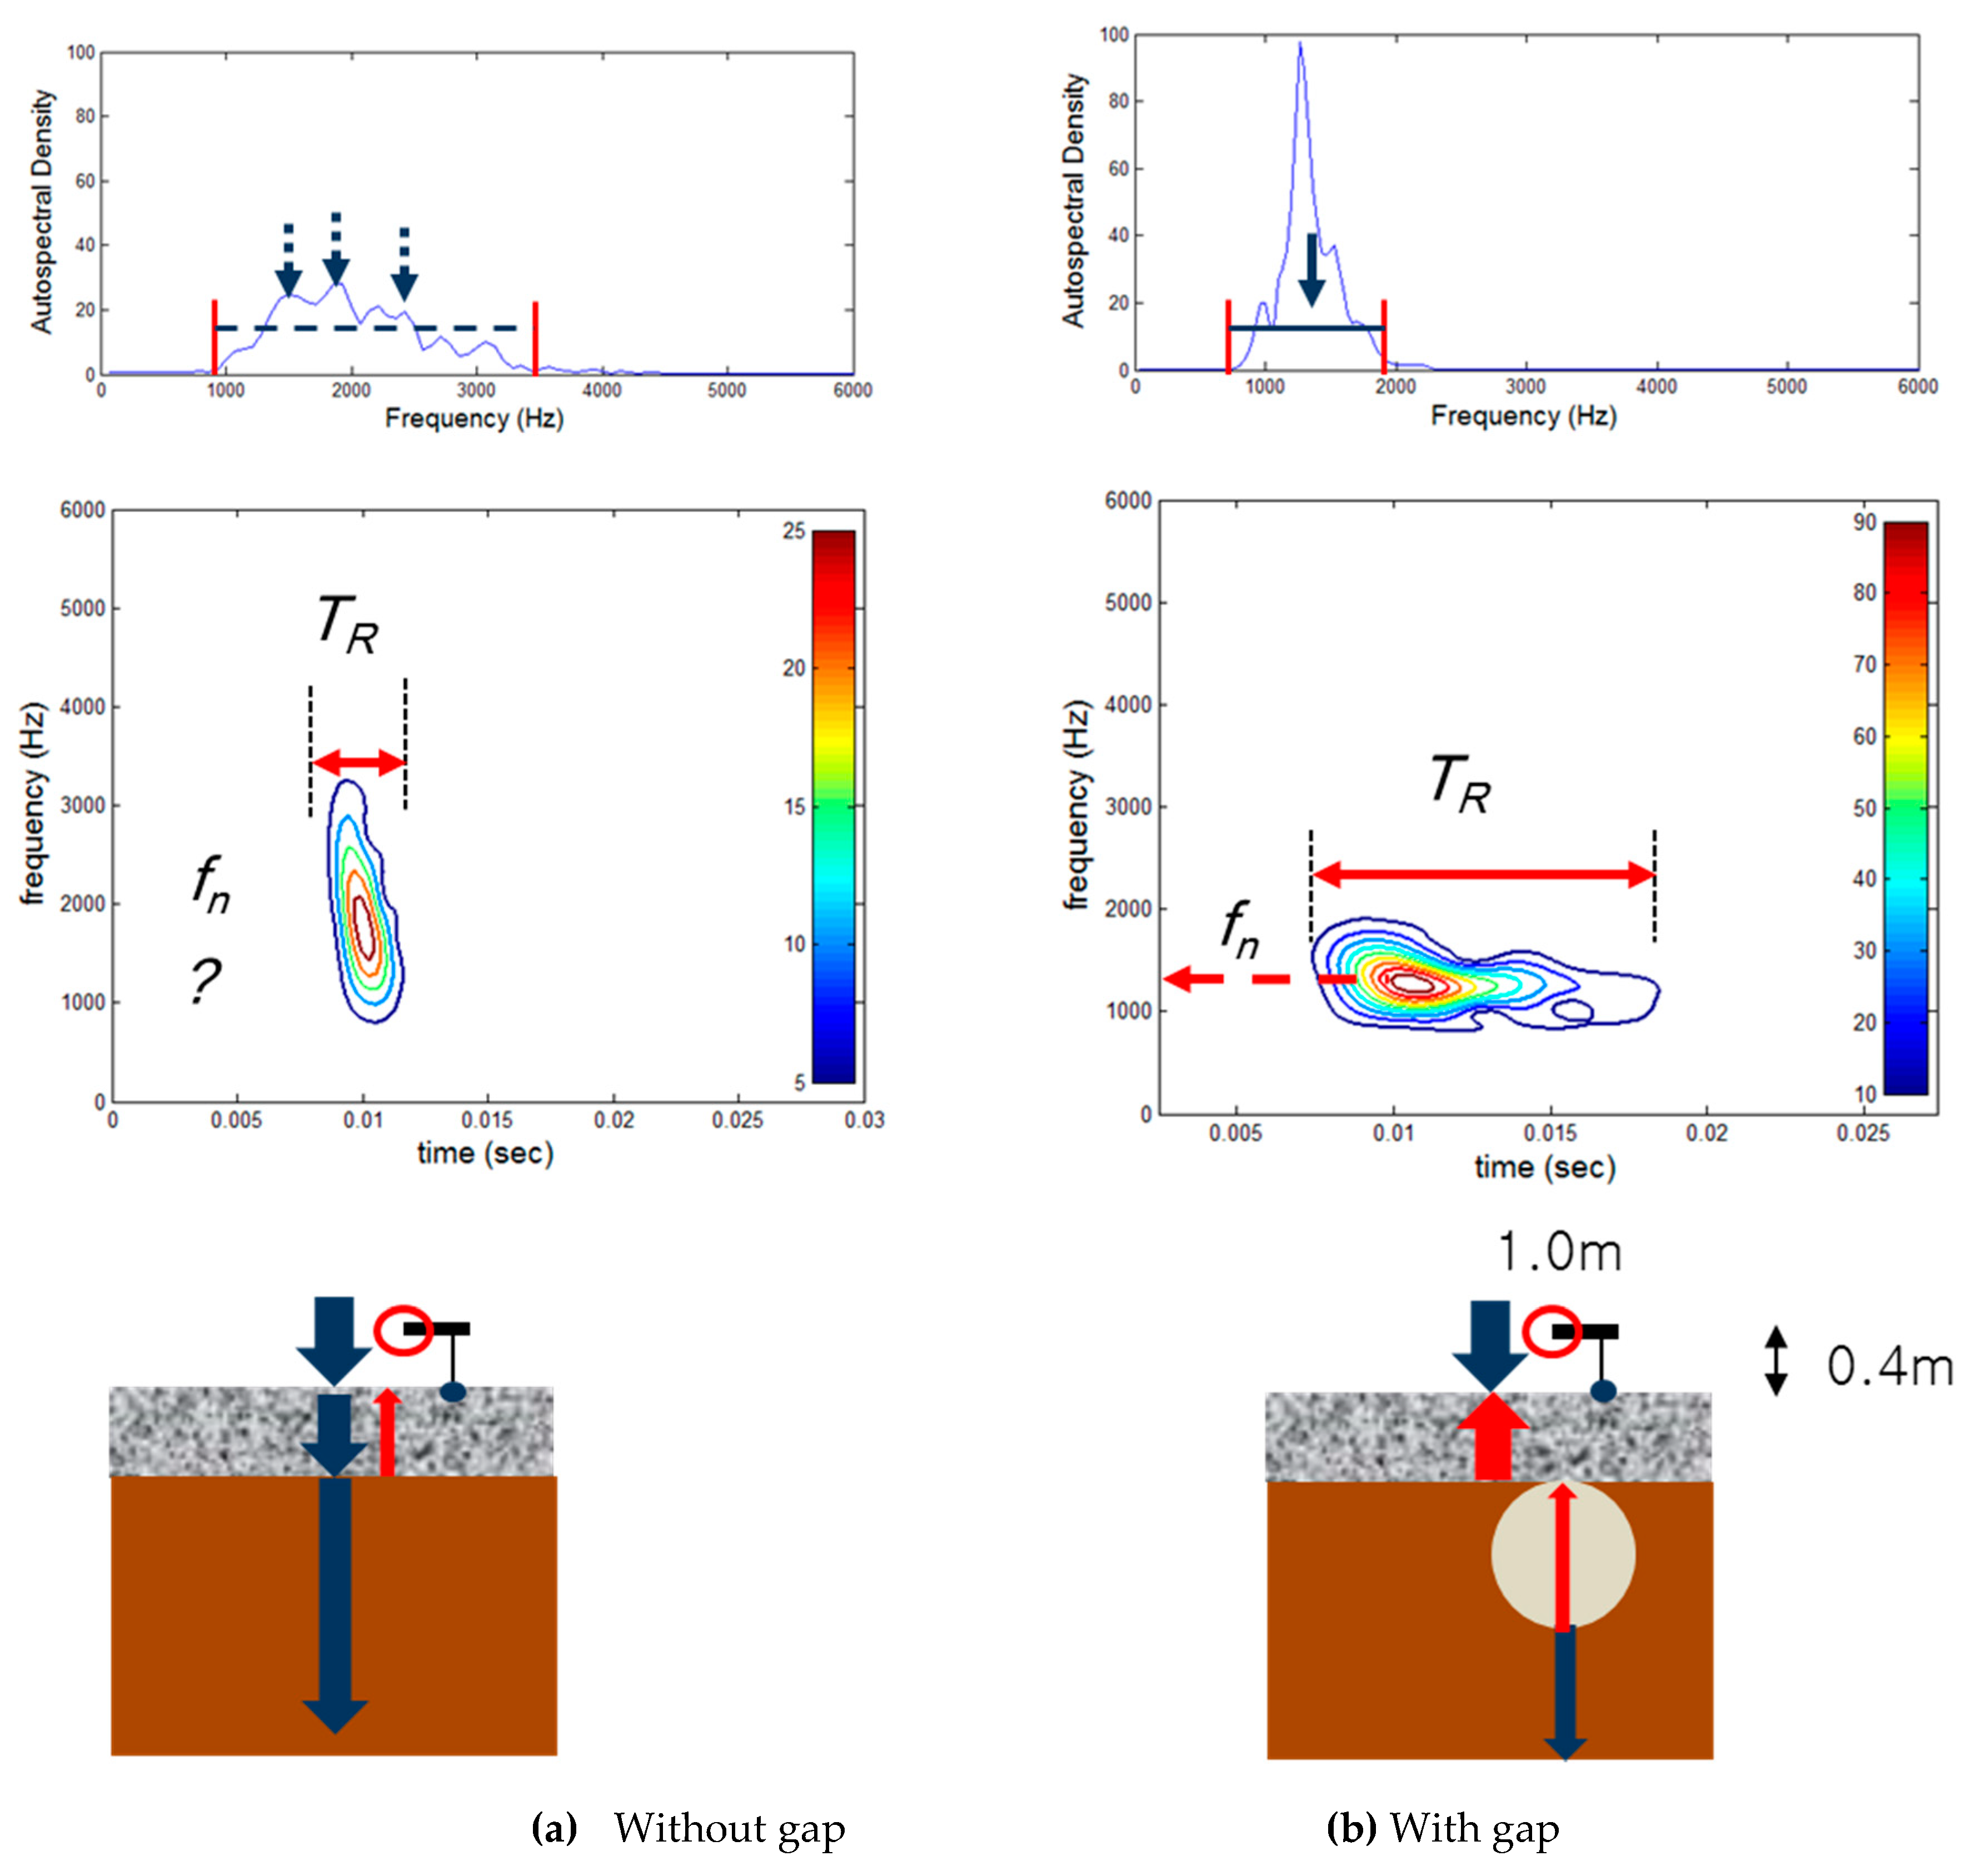
3.2.5. Comparison of Wavelets and Autospectrum of Acceleration in Slab

As can be seen in Figure 4 and Figure 5, even though we know the amplitude variation with time, it does not take into account the change of frequency content of response due to the presence of the gap. In addition, FFT does not provide proper information about the time location of the changes in the spectrum.
The obtained acceleration was transformed into wavelet forms and autospectral density. Figure 9 shows the autospectral density of the acceleration obtained on the concrete slab surface. It can be easily checked that in the case of a gap below the slab, several modes of resonance could be made due to several reflections of waves at boundaries or interfaces between different materials such as air and slab, soil and air, and slab and soil. This concept was already explained schematically in Figure 2. In addition, it was confirmed that a sharper and higher peak of autospectral density at a resonance frequency was observed in the case of with a gap below the slab. This was not observed in the case of without a gap. If there is no gap in the soil, only a specific resonance frequency was found, as shown in Figure 9.
Wavelets were also obtained and are shown in Figure 10. However, it is not clearly defined at first impression whether a gap exists underneath the concrete slab even though the time–frequency wavelets were extended for a longer time, and denser wavelets were located in a certain frequency range in both cases. As can be seen in Figure 10, even though in both cases the contours look similar externally, much denser and integrated contours are generated in the case of with a gap below the slab than the case of without a gap.

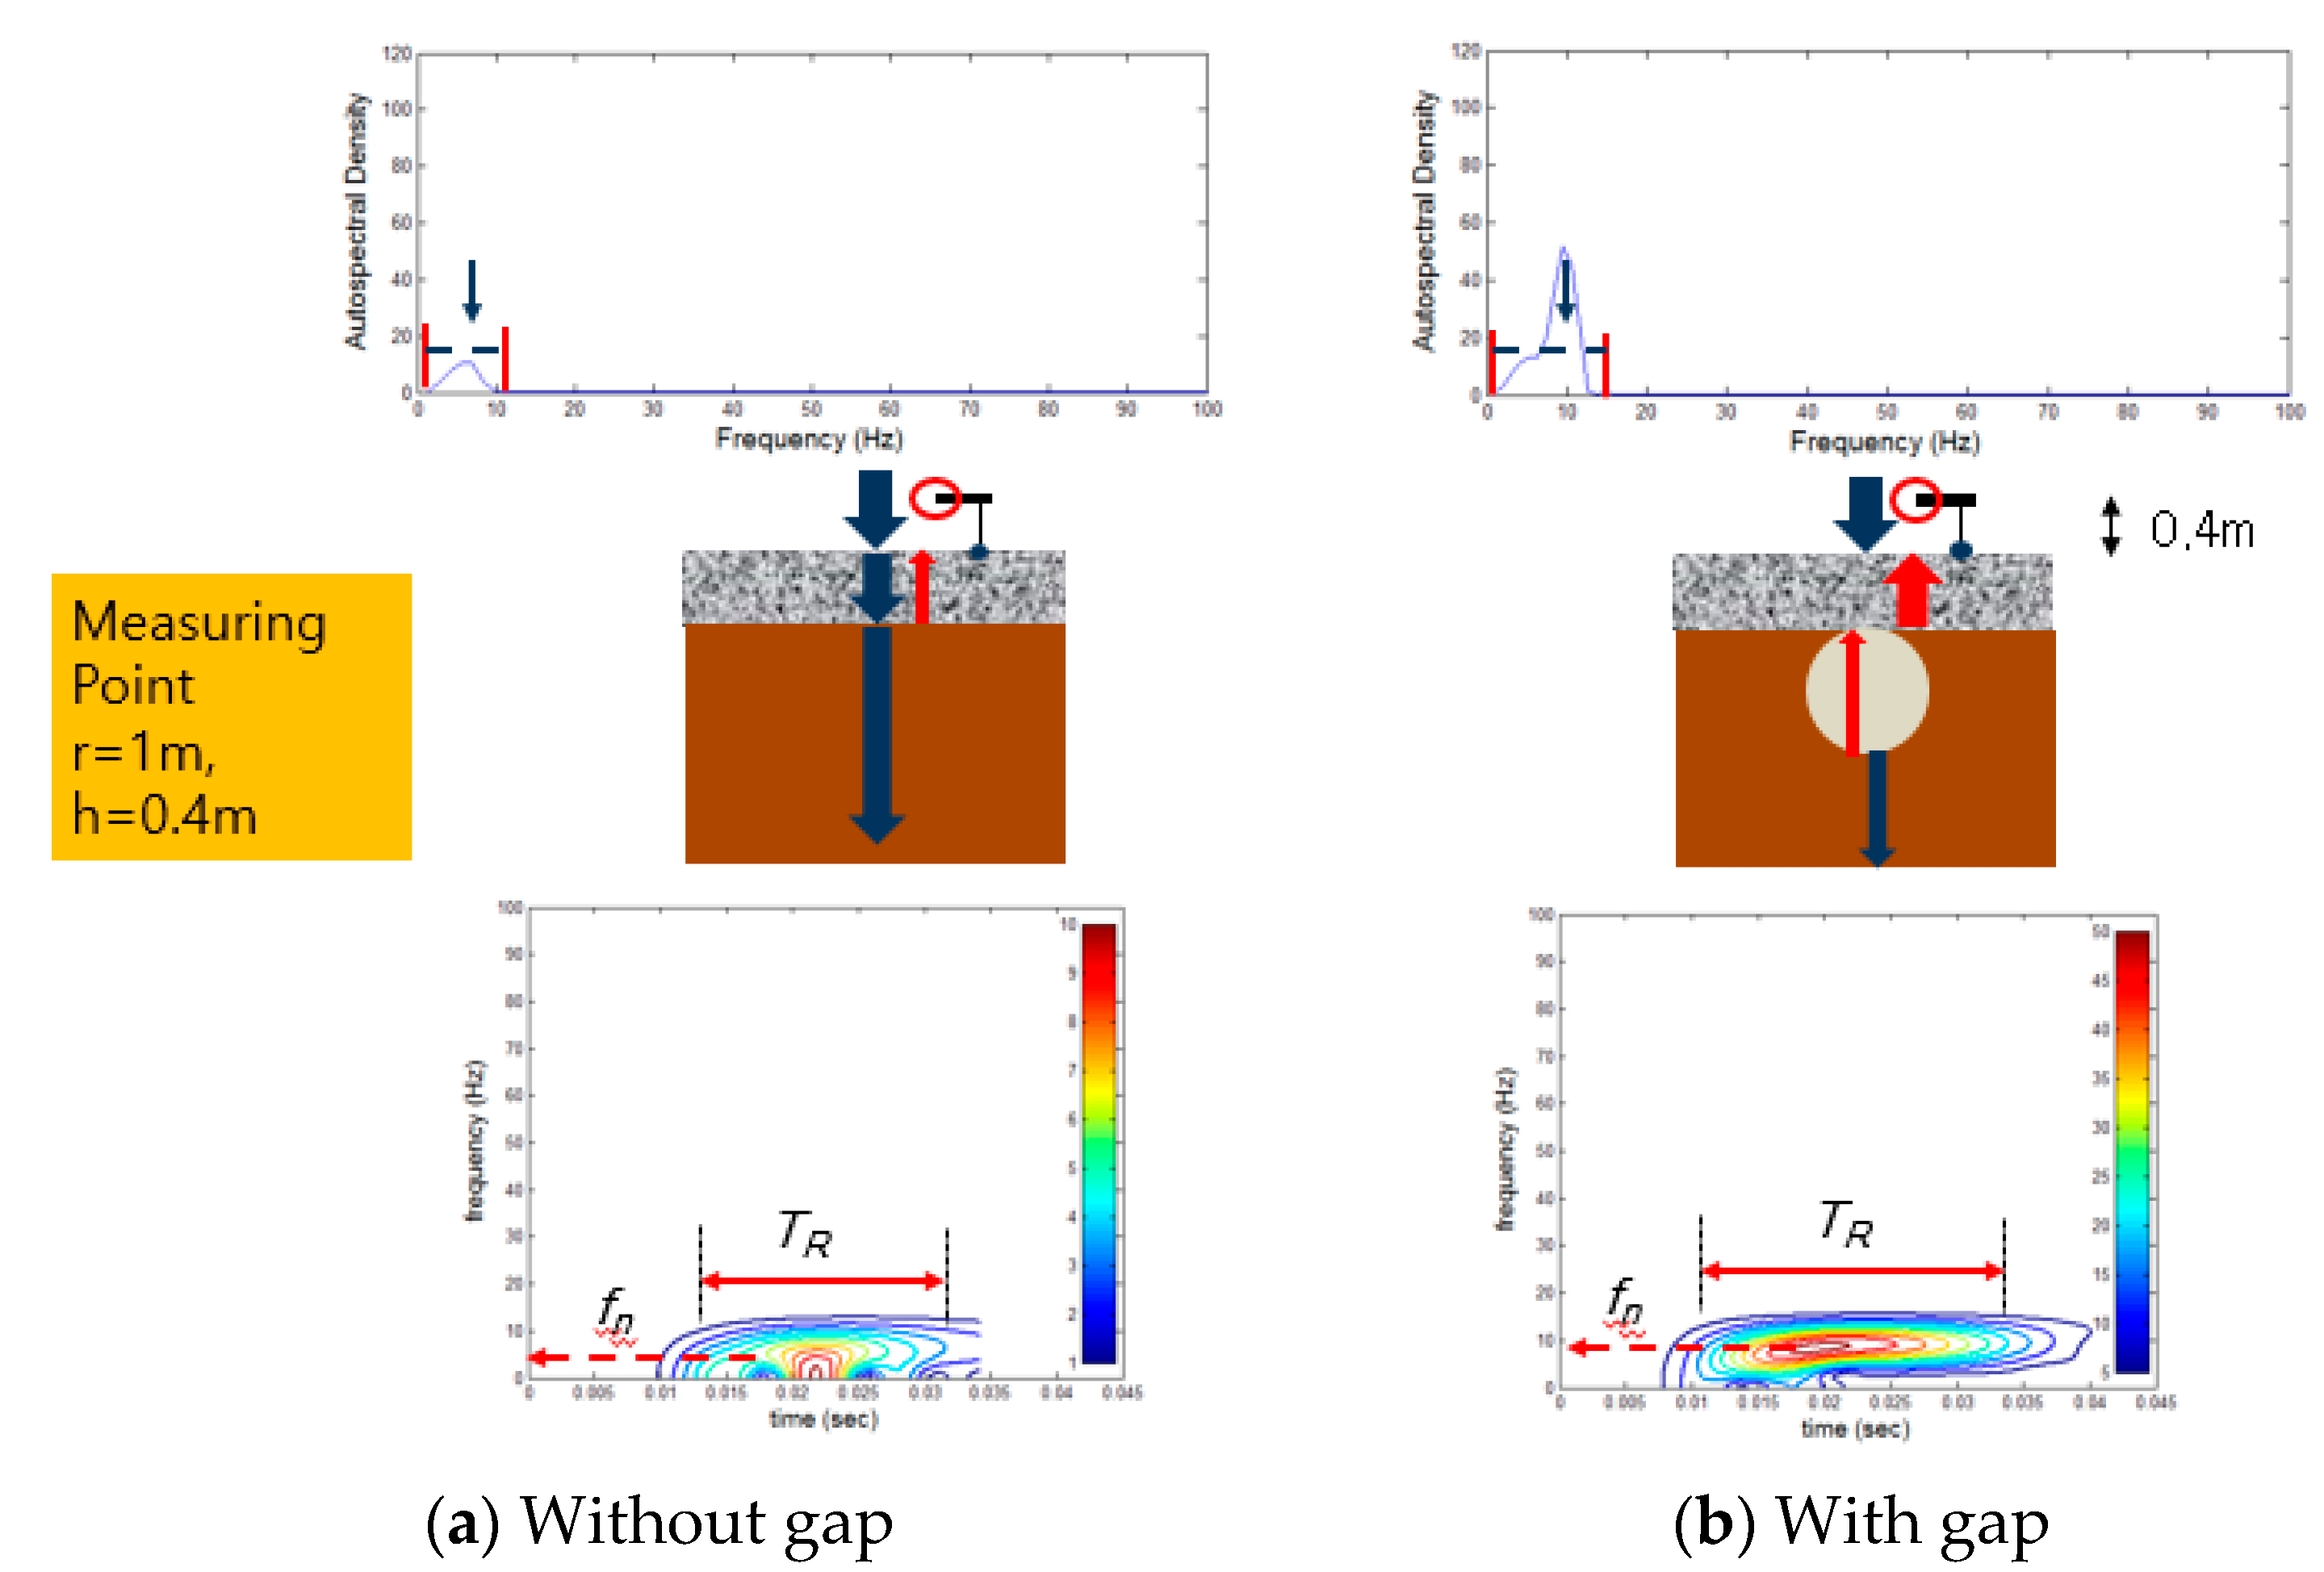
3.2.6. Comparison of Wavelets and Autospectrum of Acceleration in Air

Acoustic Rayleigh waves represented as autospectrum density obtained in the air, which are transmitted from the concrete slab surface, are displayed in Figure 11. In the case of with a gap, a higher autospectral density is obtained, as shown in the figure. In addition, a larger frequency range is observed in the case of with a gap.
Leaky Rayleigh acoustic waves represented as the wavelets of the acceleration detected in the air transmitted from the concrete slab surface, are shown in Figure 11. It can also be easily checked that in the case of with a gap below the slab, longer wavelets are obtained and observed than those of the case without a gap. Higher densities of wavelets are also observed in the case of with a gap. Resonance frequency is higher than that of the case without a gap. Thus, it can be confirmed from the analysis of the FEA for the railway track slab with and without a gap that the presence of a gap below the slab is more easily identified using the leaky Rayleigh acoustic waves (LRAW) method than using an accelerometer installed on the surface.

4. Field Test on a Model Railway Track Slab with a Gap

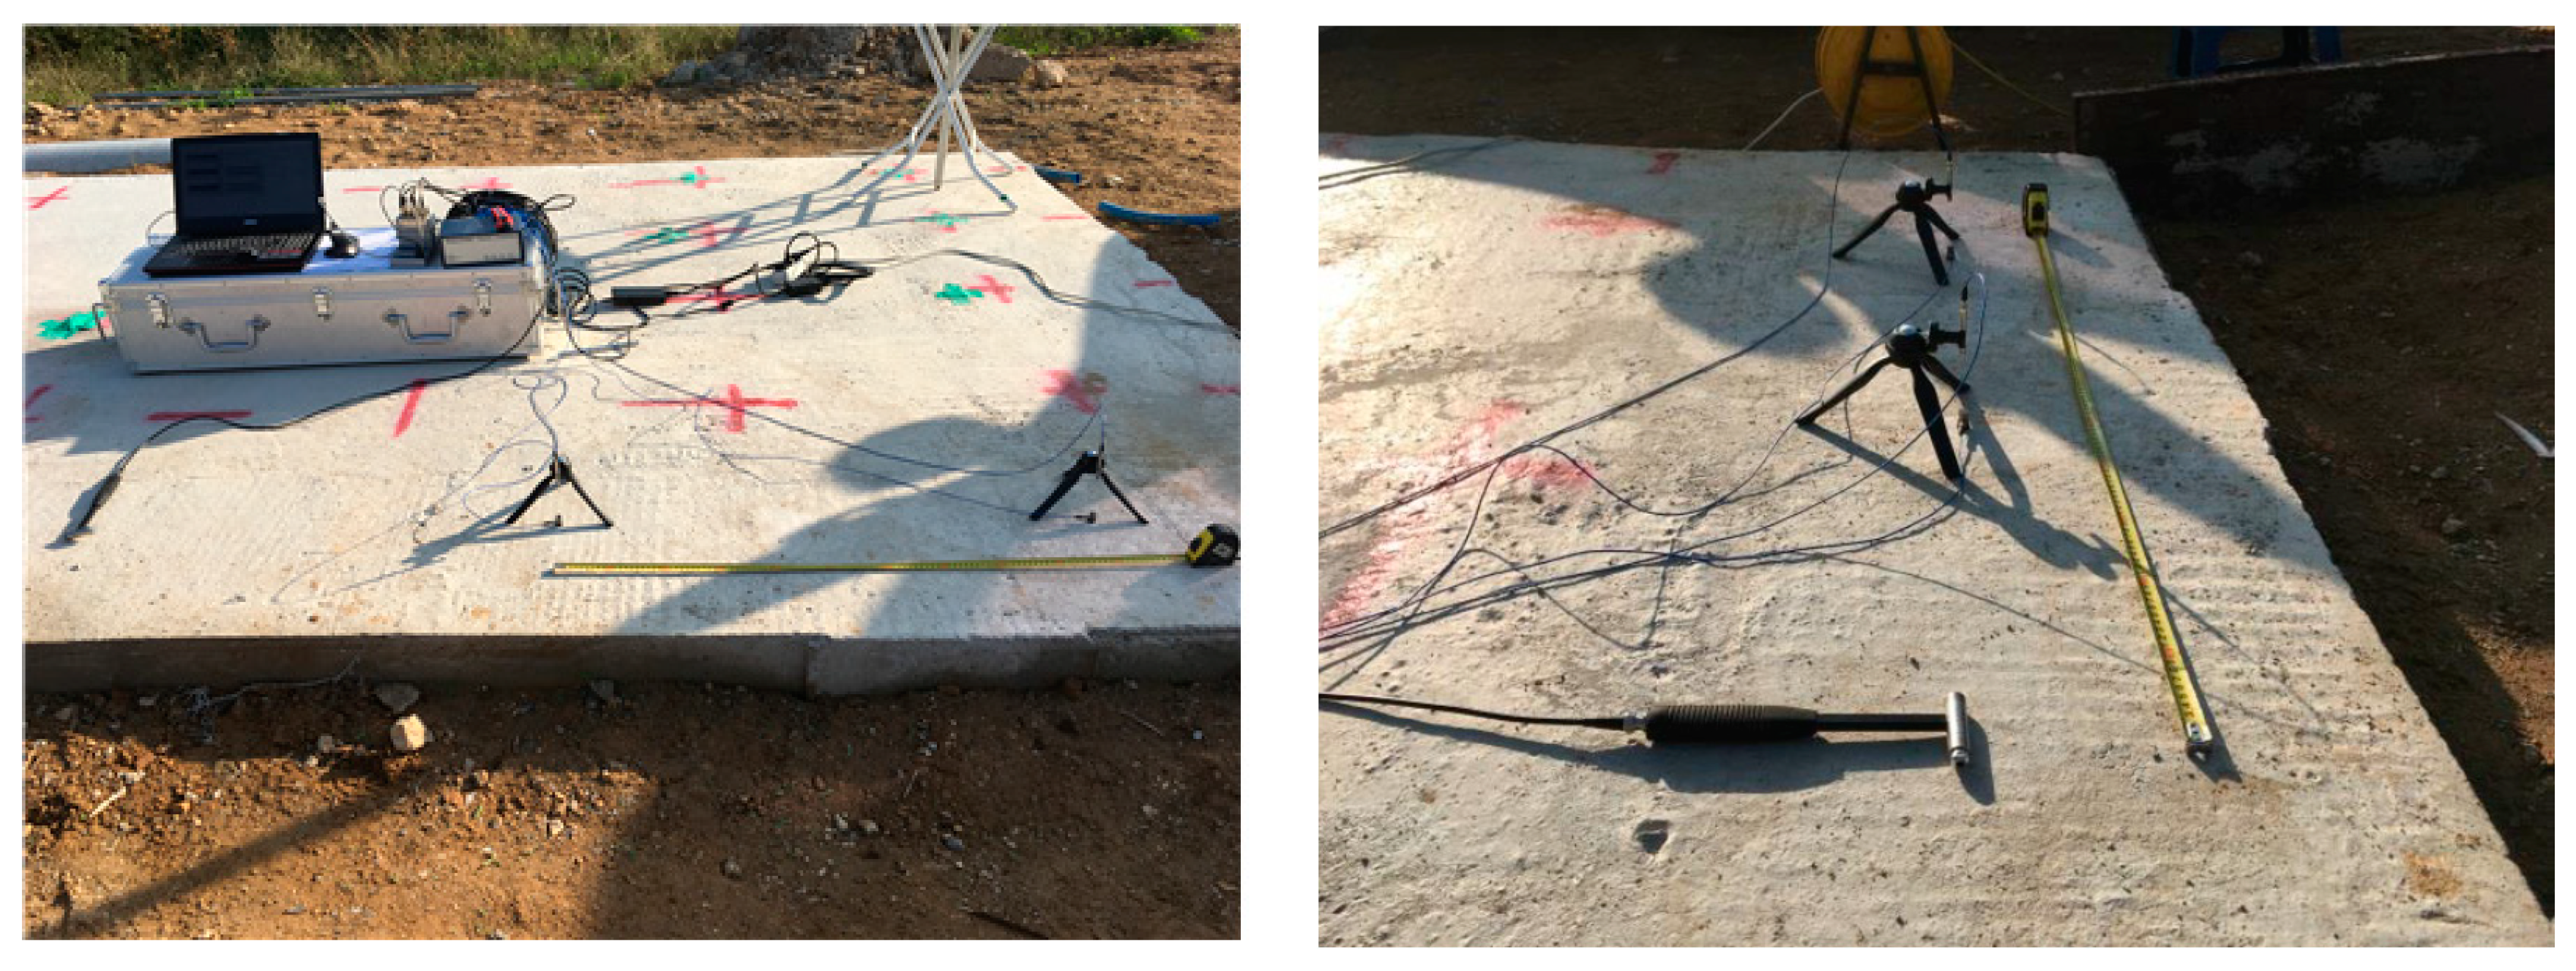
4.1. Model Track Slab and LRAW Pilot Test System

A test system module composed of a microphone (PCB-377C10) and an accelerometer (PCB-352C33), DAQ (NI model 9234 with cDAQ9174), PCB482C15 signal conditioner, and an analyzer program written by using Matlab® [28] was assembled for a small backyard pilot test as shown in Figure 12. The microphones were encapsulated with the preamplifier (PCB model 426B03). Small model railway track slabs with a gap and without a gap were constructed separately in field. A detailed description for construction of the small model railway track slabs was explained by Cho et al. [12]. The PCB-377C10 microphone was adapted to measure acoustic pressure in the field site without reflection environment. The microphone’s open circuit sensitivity is 1mV/Pa. Detecting frequency range at ±2 dB is from 4 to 70 kHz. Dynamic range of upper and lower limit is 174 and 35 dB, respectively. These broad dynamic and frequency ranges are helpful to detect gaps existing under the concrete track slab. The PCB-352CC accelerometer was adapted to measure acceleration in uniaxial (vertical) direction on the slab surface. Sensitivity was 100 mV/g, with a measurement range of 50± g peak. Frequency range at ±5% is from 0.5 to 10,000 Hz. These two PCB sensors were combined to be a sensing module and located at a position on top of the slab where a gap was prepared artificially.
Following the standard concrete mix and curing practice [29], a long rectangular concrete slab with three different sizes of gap was constructed alongside of bigger size slab in a rural field site. Table 2 summarizes the material properties of aggregate for concrete mix. The 28-day compressive strength of the cored sample of the concrete slab was 30 MPa. A mix design for the concrete slab is explained in Table 3.
Leaky Rayleigh waves and stress waves were generated by the impact load applied at a location of the top surface of the model concrete slab and sensed by the test system module (Figure 12). The model concrete slab was constructed on compacted natural ground. The size of the model slab was 5.8 m long, 0.625 m wide, and 0.64 m high. The model slab was constructed alongside a big slab that has bigger cavities placed deeply in the ground below the slab. Water content of the natural ground was 9.78%. From the standard Proctor compaction test, it was decided that maximum dry density of the soil obtained from the site was 20.05 kN/m3 at optimum moisture content (OMC) of 6.7%. The natural ground was compacted using a small compactor by following the results of the compaction test. The natural ground soil was classified as SP in Unified Soil Classification System (USCS).
Two impact loadings were carried out respectively to obtain and compare the FFT results and wavelet transforms as shown in Figure 13. Left wave source by impact #1 was detected by the first sensing module, which consisted of a microphone (MIC 1) and an accelerometer (Acc. 1) positioned d1 distance away from the excitation source. The gap was located exactly under the first sensing module. The second module consisted of a microphone (MIC 2) and an accelerometer (Acc. 2), which was positioned d1+d2 distance away from the excitation source. Right wave source by impact #2 was detected also by the first sensing module, which consisted of a microphone (MIC 1) and an accelerometer (Acc. 1) positioned d2 + d3 distance away from the right excitation source. The second module (MIC 2 + Acc. 2) was positioned d3 distance away from the excitation source. The distance d1 was 0.5 or 1.0 m. All dimensions for sensing position and gap size are explained in Figure 13 and Table 4.
The ambient noise in the field site where the model concrete slab was located was low enough to be neglected since the site was constructed in a wide open area of rural region and it was far away from the noisy environment of urban area.
Some of the stress waves generated in the concrete leaked and transmitted into the air. Thus, the transmitted leaked waves in the air and the stress waves generated in the concrete slab were obtained again in the time domain and were converted to the frequency domain by fast Fourier transform (FFT).

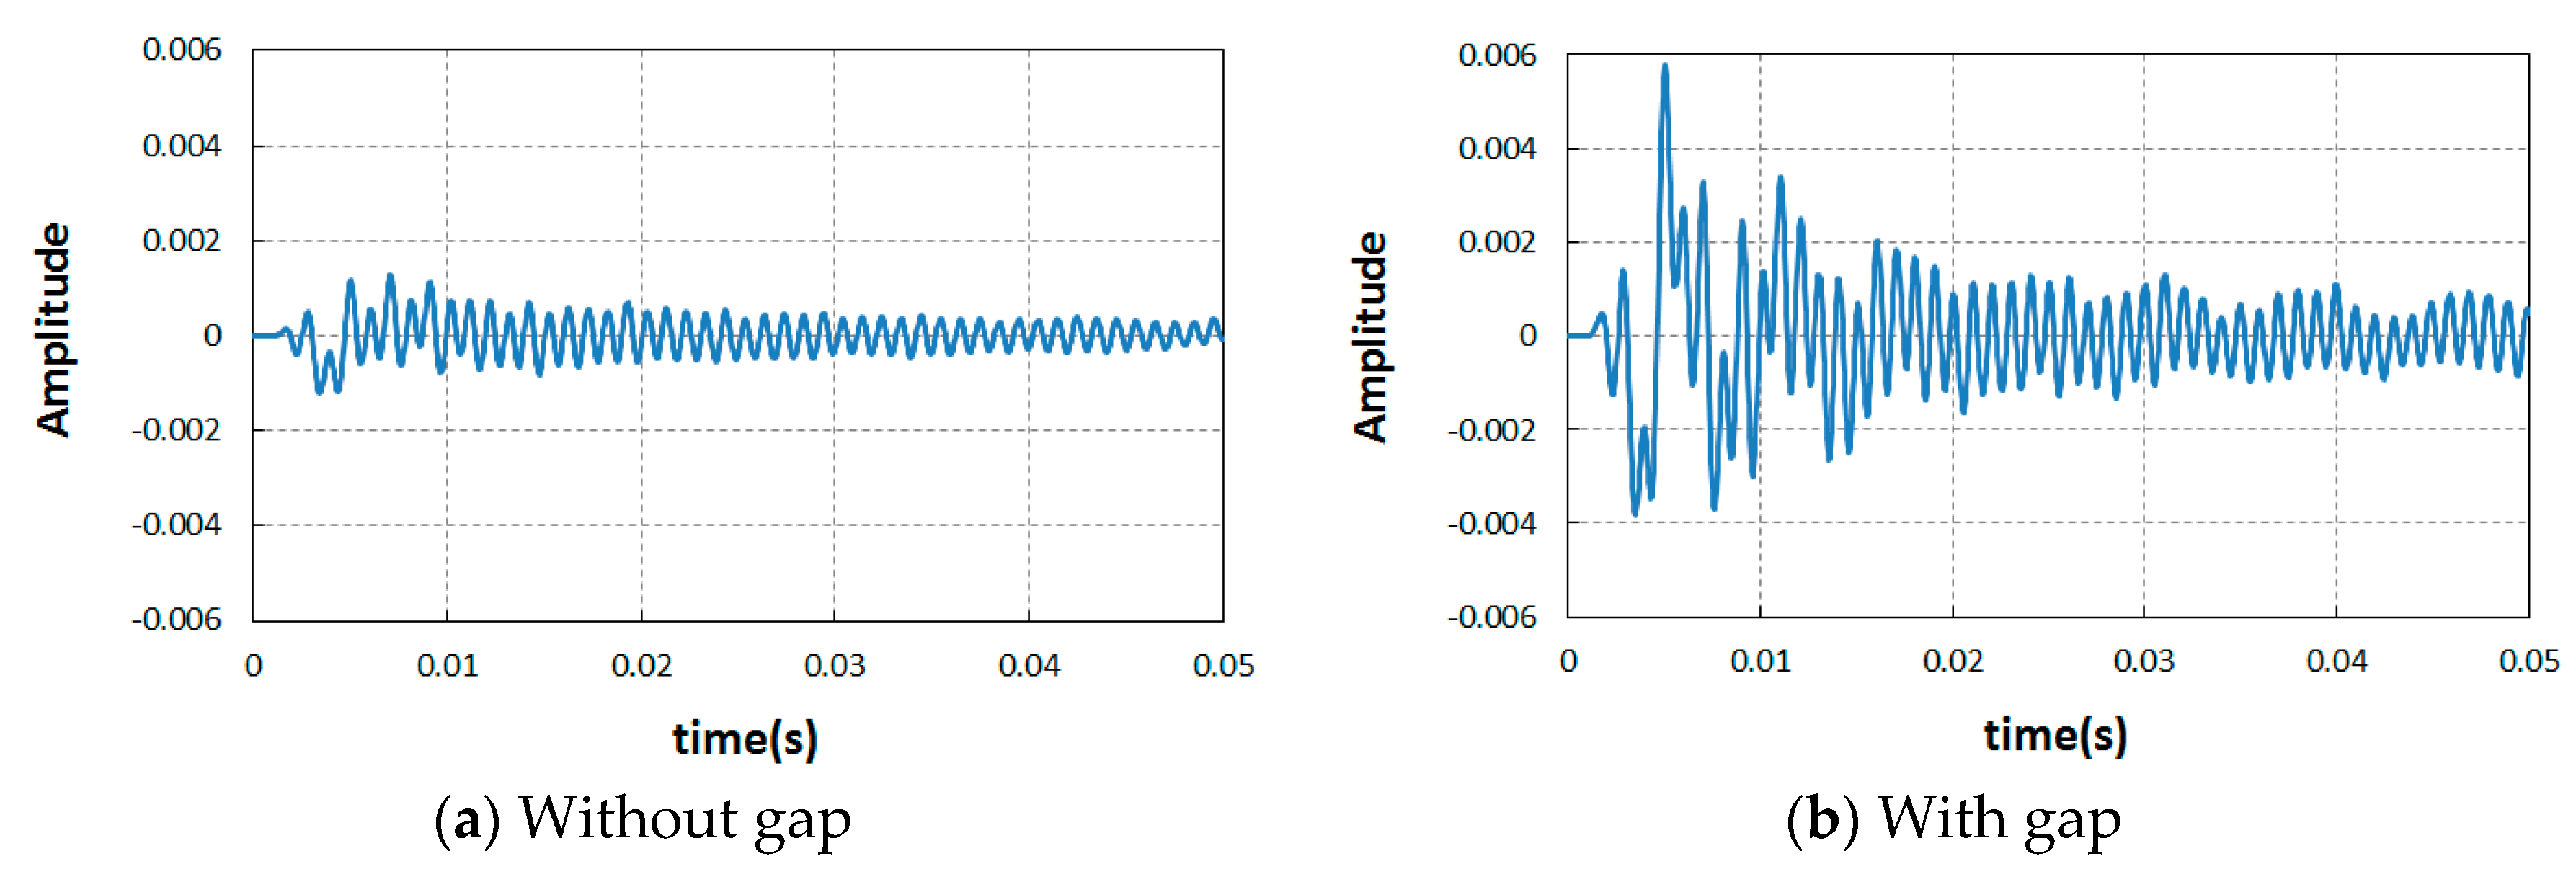
4.2. Comparison of Acceleration Amplitude

A typical example (L = 0.1 m, W = 0.1 m, and H = 0.1 m; (Left impact)) of amplitude of acceleration with frequency by performing FFT obtained on the surface of the model slab and in the air is displayed in Figure 14. As expected, in this case, higher amplitudes were clearly obtained by the first sensing module (location 1; d1 = 1.0 m) both by accelerometer and acoustic sensor, as shown in the figure. The second sensing module provided a much smaller amplitude than the first one.
The amplitude variation of Leaky Rayleigh acoustic waves detected in the air transmitted from the model concrete slab surface is shown in Figure 14b. The first sensing module provided eight times larger amplitude than the second one. However, resonance frequency was almost the same regardless of the location of the sensing module. Thus, it was confirmed from the analysis of the small field test for the model railway track slab with gap that the presence of a gap below the slab could be easily identified using the LRAW method.

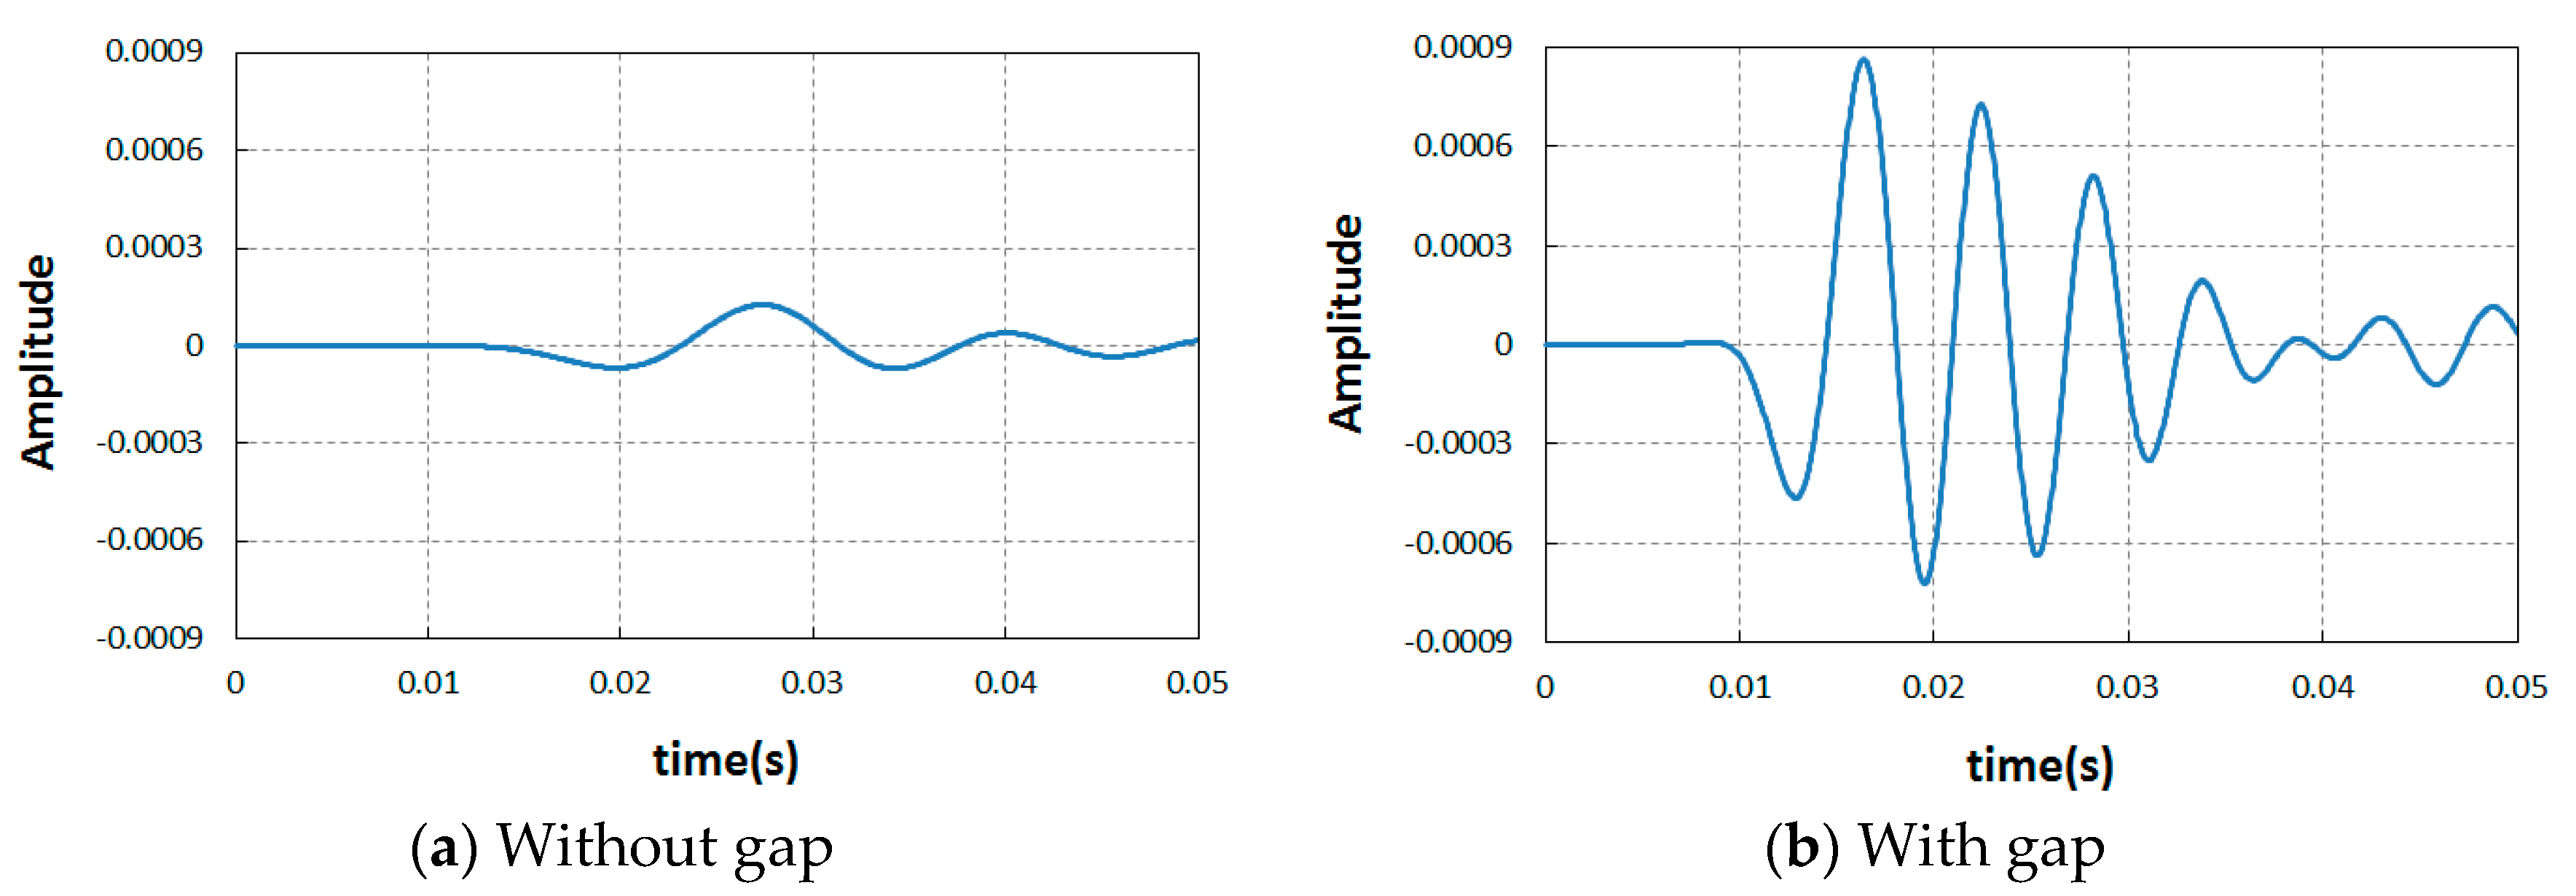
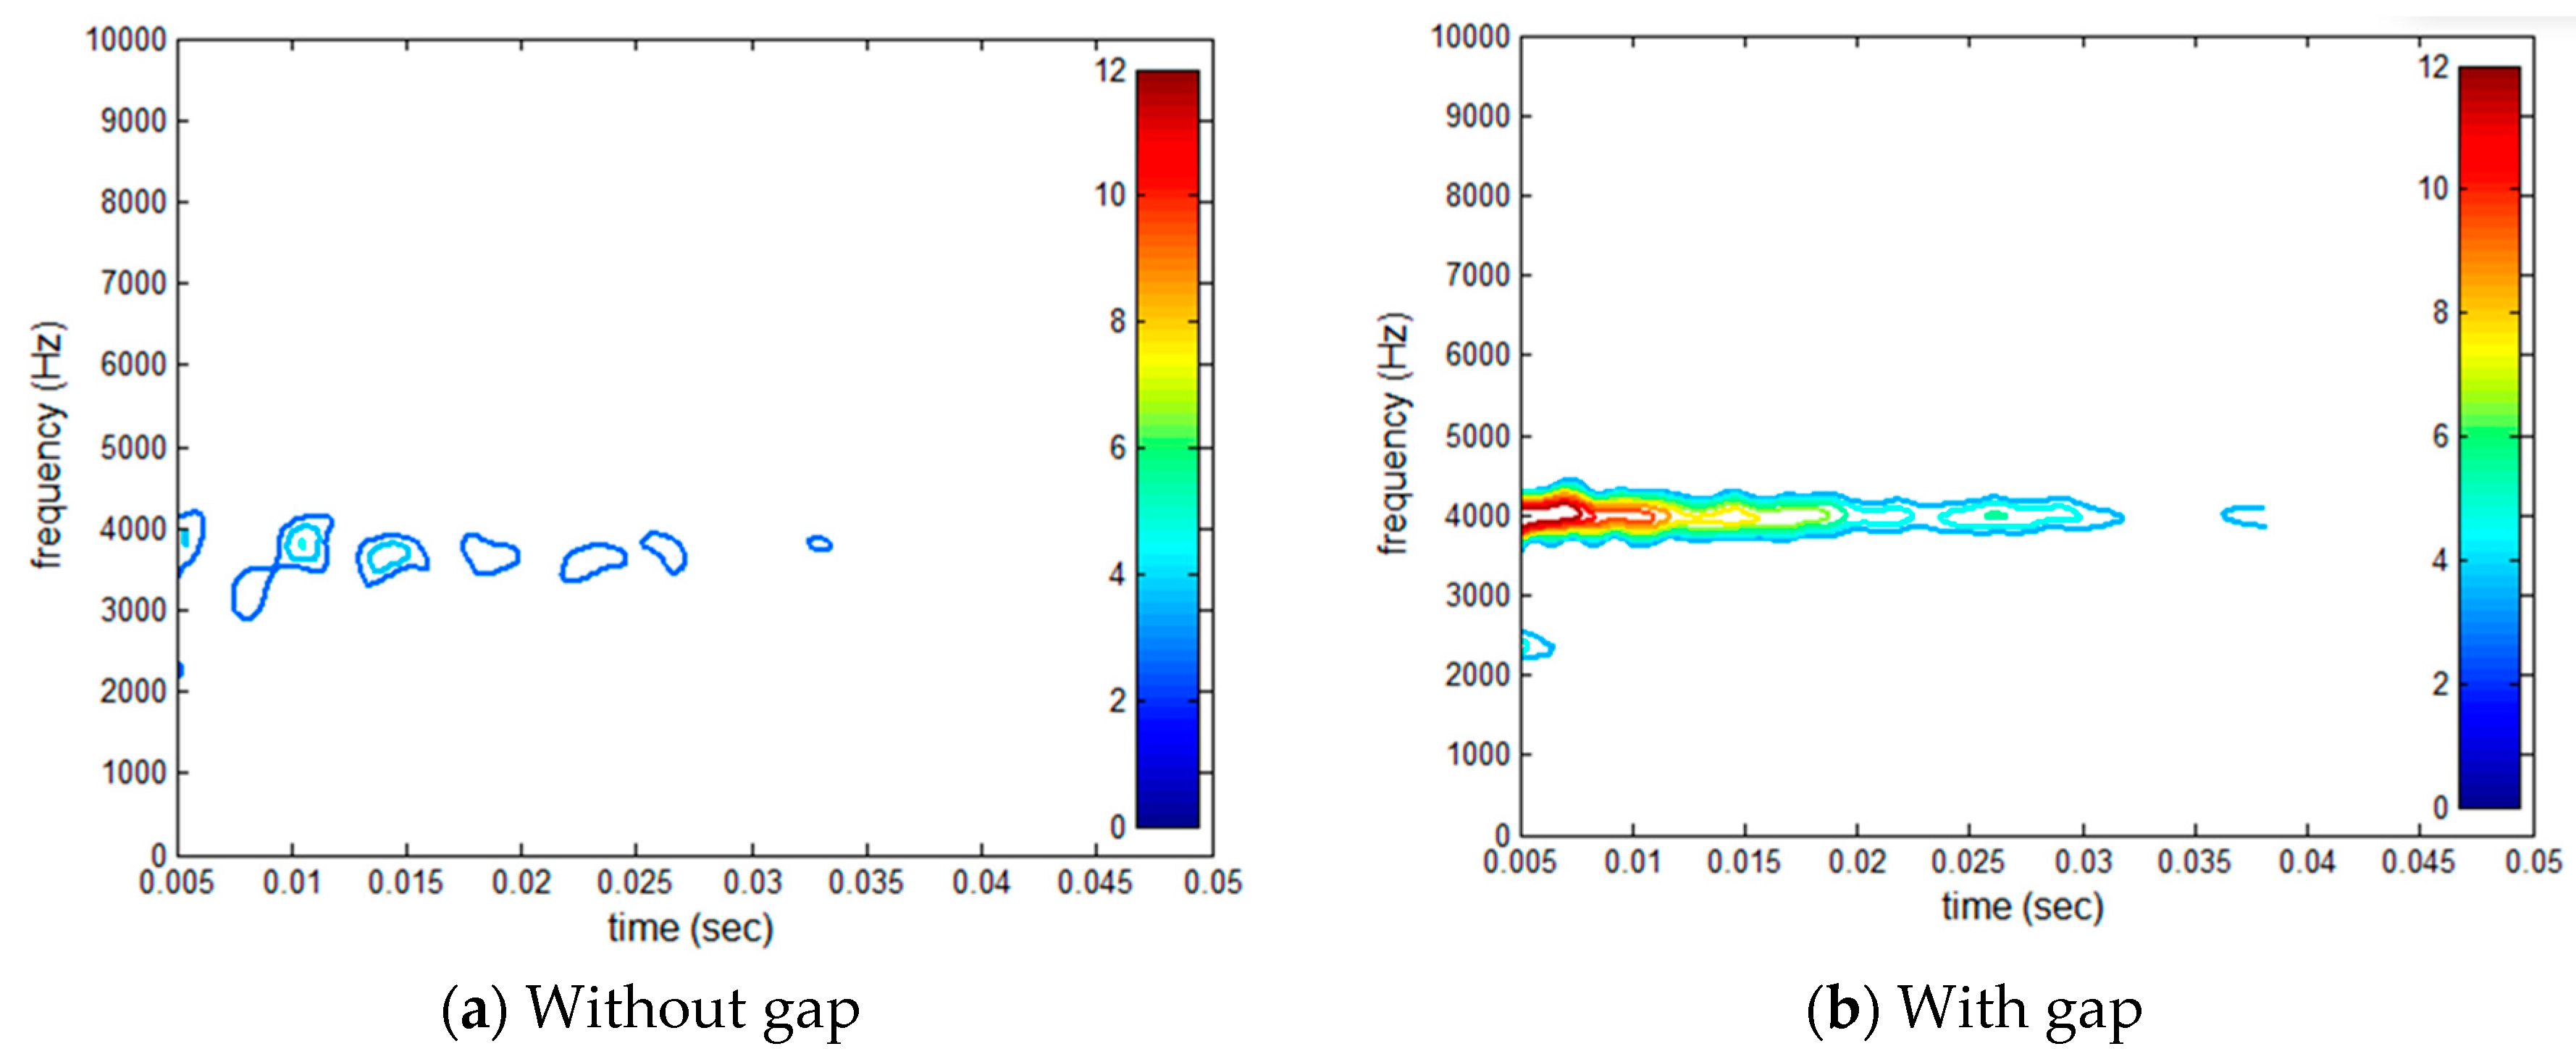
4.3. Comparison of Wavelets and Autospectrum of Acceleration in Air

Acoustic Rayleigh waves represented as autospectrum density obtained in the air, which are transmitted from the model concrete slab surface in the field, are displayed in Figure 15. In the case of with a gap, a higher autospectral density is clearly obtained, as shown in the figure. In addition, a smaller frequency range is observed in the case of with a gap.
Leaky Rayleigh acoustic waves represented as the wavelets of the acceleration detected in the air transmitted from the model concrete slab surface, are shown in Figure 15. It can also be easily checked that in the case of with a gap below the slab, much longer wavelets in horizontal time axis are obtained and observed than those of the case without a gap. Relatively higher densities of wavelets were also observed in the case of with a gap. Resonance frequency was focused in a shorter range than that of the case without a gap. Thus, it can be confirmed from the analysis of the field test for the model railway track slab with and without a gap that the presence of a gap below the slab is easily identified using the LRAW method.

5. Discussion

Track condition is important because it significantly affects track performance and maintenance requirements. Currently there is no proper NDT method to detect a gap between track slab and track foundation soil.
In this study, a nondestructive test method (NDT) named LRAW (leaky Rayleigh acoustic wave) method is proposed based on a wavelet time–frequency concept for the practical purpose of detecting gaps under track slabs. The LRAW method uses a microphone sensor to catch leaked Rayleigh acoustic waves in the air and an accelerometer to measure surface Rayleigh waves on the slab. In order to investigate the possibility of developing the test system to use leaky Rayleigh waves in the air to detect gaps between track slabs and track bed soil, a FEA using ABAQUS software was performed to simulate Rayleigh wave generation on the concrete surface and in the air. A test system module composed of a microphone and an accelerometer, DAQ, and an analyzer program was also assembled for a small backyard pilot test. From the performed LRAW test results and important findings of the FEA in this study, the following implications and conclusions can be made:
(1)
From computed results by FEA simulation of NDT in cases of with and without a gap, considerable waves were transmitted into the air to be detected after the waves were reflected at the boundaries around the gap in the soil ground. Characteristics of wave transmission were investigated in detail by analyzing wavelet distribution and autospectrum density.
(2)
At first, considering the computed results of FEA, based on comparison of acceleration level in frequency domain for two cases of with and without a gap, it was found that the leaked Rayleigh waves into air provided a much lower level than those captured on the concrete surface. However, in the case of gap existence, the peak values of the case with a cavity were two times larger than those of the case without a gap.
(3)
On the concrete surface, the predominant resonant frequency was generated around 170 Hz. On the other hand, the resonant frequency of the Rayleigh waves transmitted into air in the case of gap existence was generated at 7 to 12 Hz, which was much lower than the range at concrete surface. Compared to the concrete surface, relatively weak reflected waves were transmitted into the air in the cases of with or without the gap. However, a considerable number of waves were transmitted into the air to be detected after the waves were reflected at the boundaries around the gap in the soil ground. Wave amplitude generated in the gap case provided a more prominent peak and was distributed over a wider range of frequency than that in the non-gap case.
(4)
After applying an impact load on the concrete slab surface, the maximum acceleration amplitude generated in the air was investigated. Much higher maximum amplitudes were generated intensively near the impact loading point in the case of with a gap as opposed to without a gap. These phenomena were found also in contours of acceleration level in the slab and the air.
(5)
Based on the autospectral density of the acceleration, it was found that a few modes of resonance were generated due to reflections of waves at the boundaries around the gap in the soil ground. A sharper and higher peak of autospectral density at a resonance frequency is observed in the case of with a gap.
(6)
In case of gap existence, longer and higher wavelets of leaky Rayleigh acoustic waves were obtained than without case. Resonance frequency is higher also than without case. Thus, it could be confirmed from the analyzed results of the FEA for the model railway track slab that the presence of a gap below the slab is more easily identified using the LRAW method than using an accelerometer installed on the surface.
(7)
A long rectangular model concrete slab with three different sizes of gap was constructed in a rural field site. Impact load test was performed on the model concrete slab. The wavelets of leaky Rayleigh acoustic waves were extended in time axis direction much longer in the case of with a gap. Relatively higher densities of wavelets were also observed in the case of with a gap. Resonance frequency was focused in a shorter range than that of the case without a gap. Thus, it can be confirmed from the analysis of the field test for the model railway track slab with and without a gap that the presence of a gap below the slab is easily identified using the LRAW method.
(8)
It was verified form the FEA and NDT test in the field that the new NDT test system based on LRAW could be successfully adapted for detecting gaps underneath railway track slabs and trackbed soil.

Author Contributions

Conceptualization, Y.L.; methodology, Y.L.; software, H.C.; validation, S.P.; resources, S.P.; data curation, H.C.; writing—original draft preparation, Y.L.; writing—review and editing, Y.L. and H.C. visualization, H.C; supervision, Y.L. and S.P.; project administration, S.P.; funding acquisition, S.P. All authors have read and agreed to the published version of the manuscript.

Funding

This research was funded by Korea Railway Corporation, KORAIL, grant number RTRP-B137848-04.

Acknowledgments

This research was funded by Korea Railway Corporation, KORAIL, grant number 579 RTRP-B137848-04.

Conflicts of Interest

The authors declare no conflict of interest.

References

  1. Esveld, C. Recent developments in slab track. Eur. Railw. Rev. 2003, 2, 81–85. [Google Scholar]
  2. Park, S.B.; Lim, Y.; Lim, N. On-site applicability evaluation of concrete track defect measurement system for inspection of gaps and abnormalities of concrete slab in railway track. J. Korean Soc. Railw. 2019, 22, 719–729. [Google Scholar] [CrossRef]
  3. ACI. Committee 228. Non-Destructive Test Methods for Evaluation of Concrete in Structures Report ACI 228.2R-98; American Concrete Institute: Farmington Hills, MI, USA, 1998. [Google Scholar]
  4. Nazarian, S.; Baker, M.; Crain, K. Assessing quality of concrete with wave propagation techniques. ACI Mater. J. 1997, 94, 296–305. [Google Scholar]
  5. Sansalone, M.; Carino, N. Detecting delaminations in concrete slabs with and without overlays using the impact-echo method. ACI Mater. J. 1989, 86, 175–184. [Google Scholar]
  6. Zhang, J.-K.; Yan, W.; Cui, D.-M. Concrete condition assessment using impact-echo method and extreme learning machines. Sensors 2016, 16, 447. [Google Scholar] [CrossRef] [PubMed]
  7. Ozturk, T.; Rapoport, J.; Popovics, J.; Shah, S. Monitoring the setting and hardening of cement-based materials with ultrasound. RILEM Concr. Sci. Eng. 1999, 1, 83–91. [Google Scholar]
  8. Pessiki, S.; Carino, N. Setting time and strength of concrete using the impact-echo method. ACI Mater. J. 1988, 85, 389–399. [Google Scholar]
  9. Gucunski, N.; Maher, A.; Ghasemi, H. Extending Life of Concrete Bridge Decks through Early Deterioration Detection by NDE Methods. In Proceedings of the 2nd International Conference on Road and Rail Infrastructure (CETRA 2012), Dubrovnik, Croatia, 7–9 May 2012. [Google Scholar]
  10. Schabowicz, K. Non-Destructive Testing of Materials in Civil Engineering. Materials 2019, 12, 3237. [Google Scholar] [CrossRef] [PubMed] [Green Version]
  11. Wright, W.; Hutchins, D. Air-coupled ultrasonic testing of metals using broadband pulses in through-transmission. Ultrasonics 1999, 37, 19–22. [Google Scholar] [CrossRef]
  12. Cho, H.; Park, S.; Park, J.; Kwon, S.; Lim, Y. Inspection of gaps and abnormalities of concrete slab in railway track by using impact echo test and wavelet transform analysis. J. Korean Soc. Railw. 2017, 20, 795–808. [Google Scholar] [CrossRef]
  13. Ngo, V.; Park, J.; Park, S.; Lim, Y. Inspection of gaps and abnormalities of concrete slab in railway track by using impact echo test and wavelet transform analysis. Int. J. Railw. 2017, 10, 15–19. [Google Scholar] [CrossRef]
  14. Epp, T. Air-Coupled Impact-Echo Damage Detection in Reinforced Concrete Using Wavelet Transforms. Master’s Thesis, The University of Manitoba, Winnipeg, MB, Canada, 2017. [Google Scholar]
  15. Nikos, E.; Kritikakis, G. Attenuation analysis of real GPR wavelets: The equivalent amplitude spectrum (EAS). J. Appl. Geophys. 2016, 126, 13–26. [Google Scholar]
  16. Alsharahi, G.; Faize, A.; Louzazni, M.; Mostapha, A.; Bayjja, M.; Driouach, A. Detection of cavities and fragile areas by numerical methods and GPR application. J. Appl. Geophys. 2019, 164, 225–236. [Google Scholar] [CrossRef]
  17. Gabor, D. Theory of communication. J. IEEE 1946, 93, 429–457. [Google Scholar] [CrossRef]
  18. Cohen, L. Time-Frequency Analysis; Prentice-Hall: Englewood Cliffs, NJ, USA, 1995. [Google Scholar]
  19. Santamarina, J.C.; Fratta, D. Discrete Signals and Inverse Problems; John Wiley & Sons Ltd: West Sussex, UK, 2005. [Google Scholar]
  20. Song, K.I. Evaluation and Analysis Methods for Key Elements Affecting Tunnel Behaviour—Spatial Variability, Shotcrete Bonding State, Pre-Reinforcement. Ph.D. Thesis, KAIST, Daejeon, Korea, 2009. [Google Scholar]
  21. Simulia. User’s Manual for ABAQUS; Dassault Systems: Johnston, RI, USA, 2016. [Google Scholar]
  22. Ji, S.H. Analysis of Trackbed Foundation Stability Using Response Spectrum Generated by Railway Car in Subway. Master’s Thesis, Paichai University, Daejeon, Korea, 2017. (In Korean). [Google Scholar]
  23. Sansalone, M.; Streett, W. Impact-Echo: Non-Destructive Evaluation of Concrete and Masonry; Bullbrier Press: Jersey Shore, PA, USA, 1997. [Google Scholar]
  24. Villiappan, S.; Murti, V. Finite Element Constraints in the Analysis of Wave Propagation Problem UNICV Report NO. R-218; The University of New South Wales, The School of Civil Engineering: Kingsford, Australia, 1984. [Google Scholar]
  25. Saenger, E.H.; Gold, N.; Shapiro, S.A. Modeling the propagation of Elastic waves using a modified finite-difference grid. Wave Motion 2000, 31, 77–92. [Google Scholar] [CrossRef]
  26. Cho, H. Development of NDT Test Module of Detecting Gap under Railway Track Slab; Research Report to KORAIL; Total Geo Solution: Daejeon, Korea, 2016. (In Korean) [Google Scholar]
  27. Zerwer, A.; Cascante, G.; Hutchinson, J. Parameter estimation in finite element simulations of Rayleigh waves. J. Geotech. Geoenviron. Eng. 2002, 128, 250–261. [Google Scholar] [CrossRef]
  28. MATLAB, The Mathworks, Inc.: Natick, MA, USA, 2017.
  29. ASTM C127. Standard Test Method for Relative Density (Specific Gravity) and Absorption of Coarse Aggregate; ASTM International: West Conshohocken, PA, USA, 2015. [Google Scholar]
Figure 1. Finite element modeling of railway track slab. (a) Without gap. (b) With gap.
Applsci 10 03347 g001
Figure 2. Schematic of generating and measuring reflected waves by impact loading: (a) without gap, (b) with gap.
Applsci 10 03347 g002
Figure 3. Comparison of acceleration amplitudes on the concrete surface between without gap and with gap cases in time domain. (a) Without gap. (b) With gap.
Applsci 10 03347 g003
Figure 4. Variation of acceleration amplitude with time in the air 0.4 m above the concrete surface. (a) Without gap. (b) With gap.
Applsci 10 03347 g004
Figure 5. Comparison of acceleration amplitude in frequency domain in cases of with gap and without gap underneath the slab. (a) On concrete slab surface. (b) In the air.
Applsci 10 03347 g005
Figure 6. Comparison of maximum acceleration amplitudes on concrete surface in cases of with and without gap at different positions from impact loading point. (a) Without gap. (b) With gap.
Applsci 10 03347 g006
Figure 7. Comparison of maximum acceleration in the air above the concrete surface in cases of with and without cavities at different position from impact loading point. (a) Without gap. (b) With gap.
Applsci 10 03347 g007
Figure 8. Acceleration contours generated in the concrete slab and in the air. (a) Without gap. (b) With gap.
Applsci 10 03347 g008
Figure 9. Comparison of autospectral density on the concrete slab surface. (a) Without gap. (b) With gap.
Applsci 10 03347 g009
Figure 10. Acceleration contours generated on the concrete slab: (a) without gap, (b) with gap.
Applsci 10 03347 g010
Figure 11. Leaky Rayleigh acoustic waves detected in the air transmitted from the concrete surface. (a) Without gap. (b) With gap.
Applsci 10 03347 g011
Figure 12. Field test setup with test system module on a model concrete slab.
Applsci 10 03347 g012
Figure 13. Detailed description of sensor location with impact loading.
Applsci 10 03347 g013
Figure 14. Amplitude variation with frequency: (a) accelerometer and (b) microphone sensor.
Applsci 10 03347 g014
Figure 15. Leaky Rayleigh acoustic waves detected in the air transmitted from the model concrete surface in the field. (a) Without gap. (b) With gap.
Applsci 10 03347 g015
Table 1. Input parameters for finite element modeling of railway track section.
Modulus E (MN/m2)Poisson’s Ratio νDensity ρ (kg/m3)
Air0.10.41.130
Concrete Slab30,0000.22300
Soil400.32000
Table 2. Natural aggregate material properties.
Specific GravityAbsorption Ratio (%)LA Coefficient (%)
Fine aggregate2.561.10-
Coarse aggregate2.650.7018.8
Table 3. Concrete mixture design and material quantities.
W/CS/aMix Proportions (kg/m3)
WCSAggAdmixture
0.3945.31874807398944.8
Table 4. Detailed definitions of gap sizes and sensing positions.
D1 (m)D2 (m)D3 (m)
Sensing position0.50.50.5
1.01.01.0
L (m)W (m)H (m)
Gap size0.10.10.1
0.30.30.1
0.40.30.1

