Article

Multi-Energy Valley Scattering Characteristics for a SI-GaAs-Based Terahertz Photoconductive Antenna in Linear Mode

1
Department of Applied Physics, School of Science, Xi’an University of Technology, Xi’an 710048, China
2
Suzhou Nuclear Power Research Institute, Suzhou 215004, China
*
Author to whom correspondence should be addressed.
Appl. Sci. 2020, 10(1), 7; https://doi.org/10.3390/app10010007
Submission received: 28 October 2019 / Revised: 9 December 2019 / Accepted: 16 December 2019 / Published: 18 December 2019
(This article belongs to the Special Issue Optical and Optoelectronic Materials and Applications)

Abstract

:
In this paper, the relationship between the terahertz radiation and the spatial distribution of photogenerated carriers under different bias electric field is studied. Terahertz pulses and the photocurrent of SI-GaAs photoconductive antenna are measured by the terahertz time-domain spectroscopy system. The occupancy rate for photogenerated carriers for different energy valleys is obtained by comparing the photocurrent of terahertz field integrating with respect to time with the photocurrent measured by oscilloscope. Results indicate that 93.04% of all photogenerated carriers are located in the Γ valley when the bias electric field is 3.33 kV/cm, and 68.6% of all photogenerated carriers are transferred to the satellite valley when the bias electric field is 20.00 kV/cm. With the bias electric field increasing, the carrier occupancy rate for the satellite valley tends to saturate at 72.16%. In order to obtain the carrier occupancy rate for the satellite valley and saturate value at the high bias electric field, an ensemble Monte Carlo simulation based on the theory of photo-activated charge domain is developed.

1. Introduction

Terahertz (THz) radiation is generated by using various techniques such as ultrafast photoconductive antennas [1,2,3,4], rectification of optical pulses, second order nonlinear optical effect [5,6], quantum-cascade lasers [7], and coupled double quantum-well structure’s carrier oscillations [8,9]. Using of photoconductive antennas is one of the most common sources of THz radiation due to its high intensity efficiency and large bandwidth. Semi-insulating gallium arsenide (SI-GaAs) is widely applied to semiconductor material. It is often used to make ultrafast photoconductive devices because of its special material properties such as the short carrier-lifetime (~10 ps), the ultra-high dark resistivity, and ultra-high photogenerated carriers mobility [3,10].
Semi-insulating gallium-arsenide-based photoconductive antennas (SI-GaAs PCA) have two working modes: linear mode and avalanche multiplication mode. When the SI-GaAs PCA operates in the linear mode, each photon that is absorbed induces the formation of one electron-hole pair, which means that the photocurrent waveform is similar to laser waveform [11]. The avalanche multiplication mode is also known as the “nonlinear” or “high-multiplication” mode. Because it is mainly caused by the avalanche effect of photogenerated carriers [12], the rising edge of the photocurrent is much faster than the rising edge of the triggering laser. In addition, the rise-time decreases with increasing (external) bias voltage [13]. Due to the influence of negative differential mobility (NDM), an optimal time jitter is produced about 15 ps [14]. More importantly, under certain external conditions such as triggering laser energy and bias electric field, the characteristics of terahertz radiation (such as radiant power, frequency, waveform and spatial distribution) generated by SI-GaAs PCA are mainly determined by the spatial distribution and dynamic transmission of photogenerated carriers. A work has focused on the inter-valley scattering of photogenerated carriers with the increasing of bias electric field [15]. However, the relationship between the photocurrent and terahertz wave radiation caused by the carriers’ inter-valley scattering of SI-GaAs PCA is not studied in the experiment. In order to obtain the terahertz radiation characteristics of the photoconductive antenna, the relationship between the terahertz radiation and the spatial distribution of photogenerated carriers is very important.
Therefore, the experiments are carried out by comparing the photocurrent of terahertz field integrating with respect to time with the photocurrent measured by oscilloscope. The properties of multi-energy valley scattering for carriers in a SI-GaAs PCA are investigated. It provides a theoretical basis for generating high power terahertz radiation using GaAs PCA’s nonlinear working mode.

2. Experimental Setups

The terahertz photoconductive antenna has a strip lines configuration in our experiment, as shown in Figure 1. The photoconductive substrate material is SI-GaAs, which is a direct gap semiconductor with bandgap energy of 1.424 eV. The doping concentration is about 1.5 × 10 7   cm 3 , and the thickness is 0.6 mm. When there is no laser trigger, the average dark resistivity of SI-GaAs is much higher than 5 × 10 7   Ω cm , the electron mobility of Γ valley is 6000 8000   cm 2 / V s , and the electron mobility of satellite valley (L valley) is 920   cm 2 / V s . The ohmic-contact electrodes (Au/Ge/Ni alloy) are located on both sides of the substrate surface. The coplanar photoconductive strip lines are 30 µm wide with a 150 µm gap. A 900 nm Si3N4 material is plated on the surface of GaAs material, which mainly can be used as an insulating protective layer [16]. The PCA was placed onto an FR-4 glass-fiber woven reinforcing epoxy-laminate substrate with planar transmission lines. The photocurrent is then transmitted to the oscilloscope through the coaxial transmission lines.
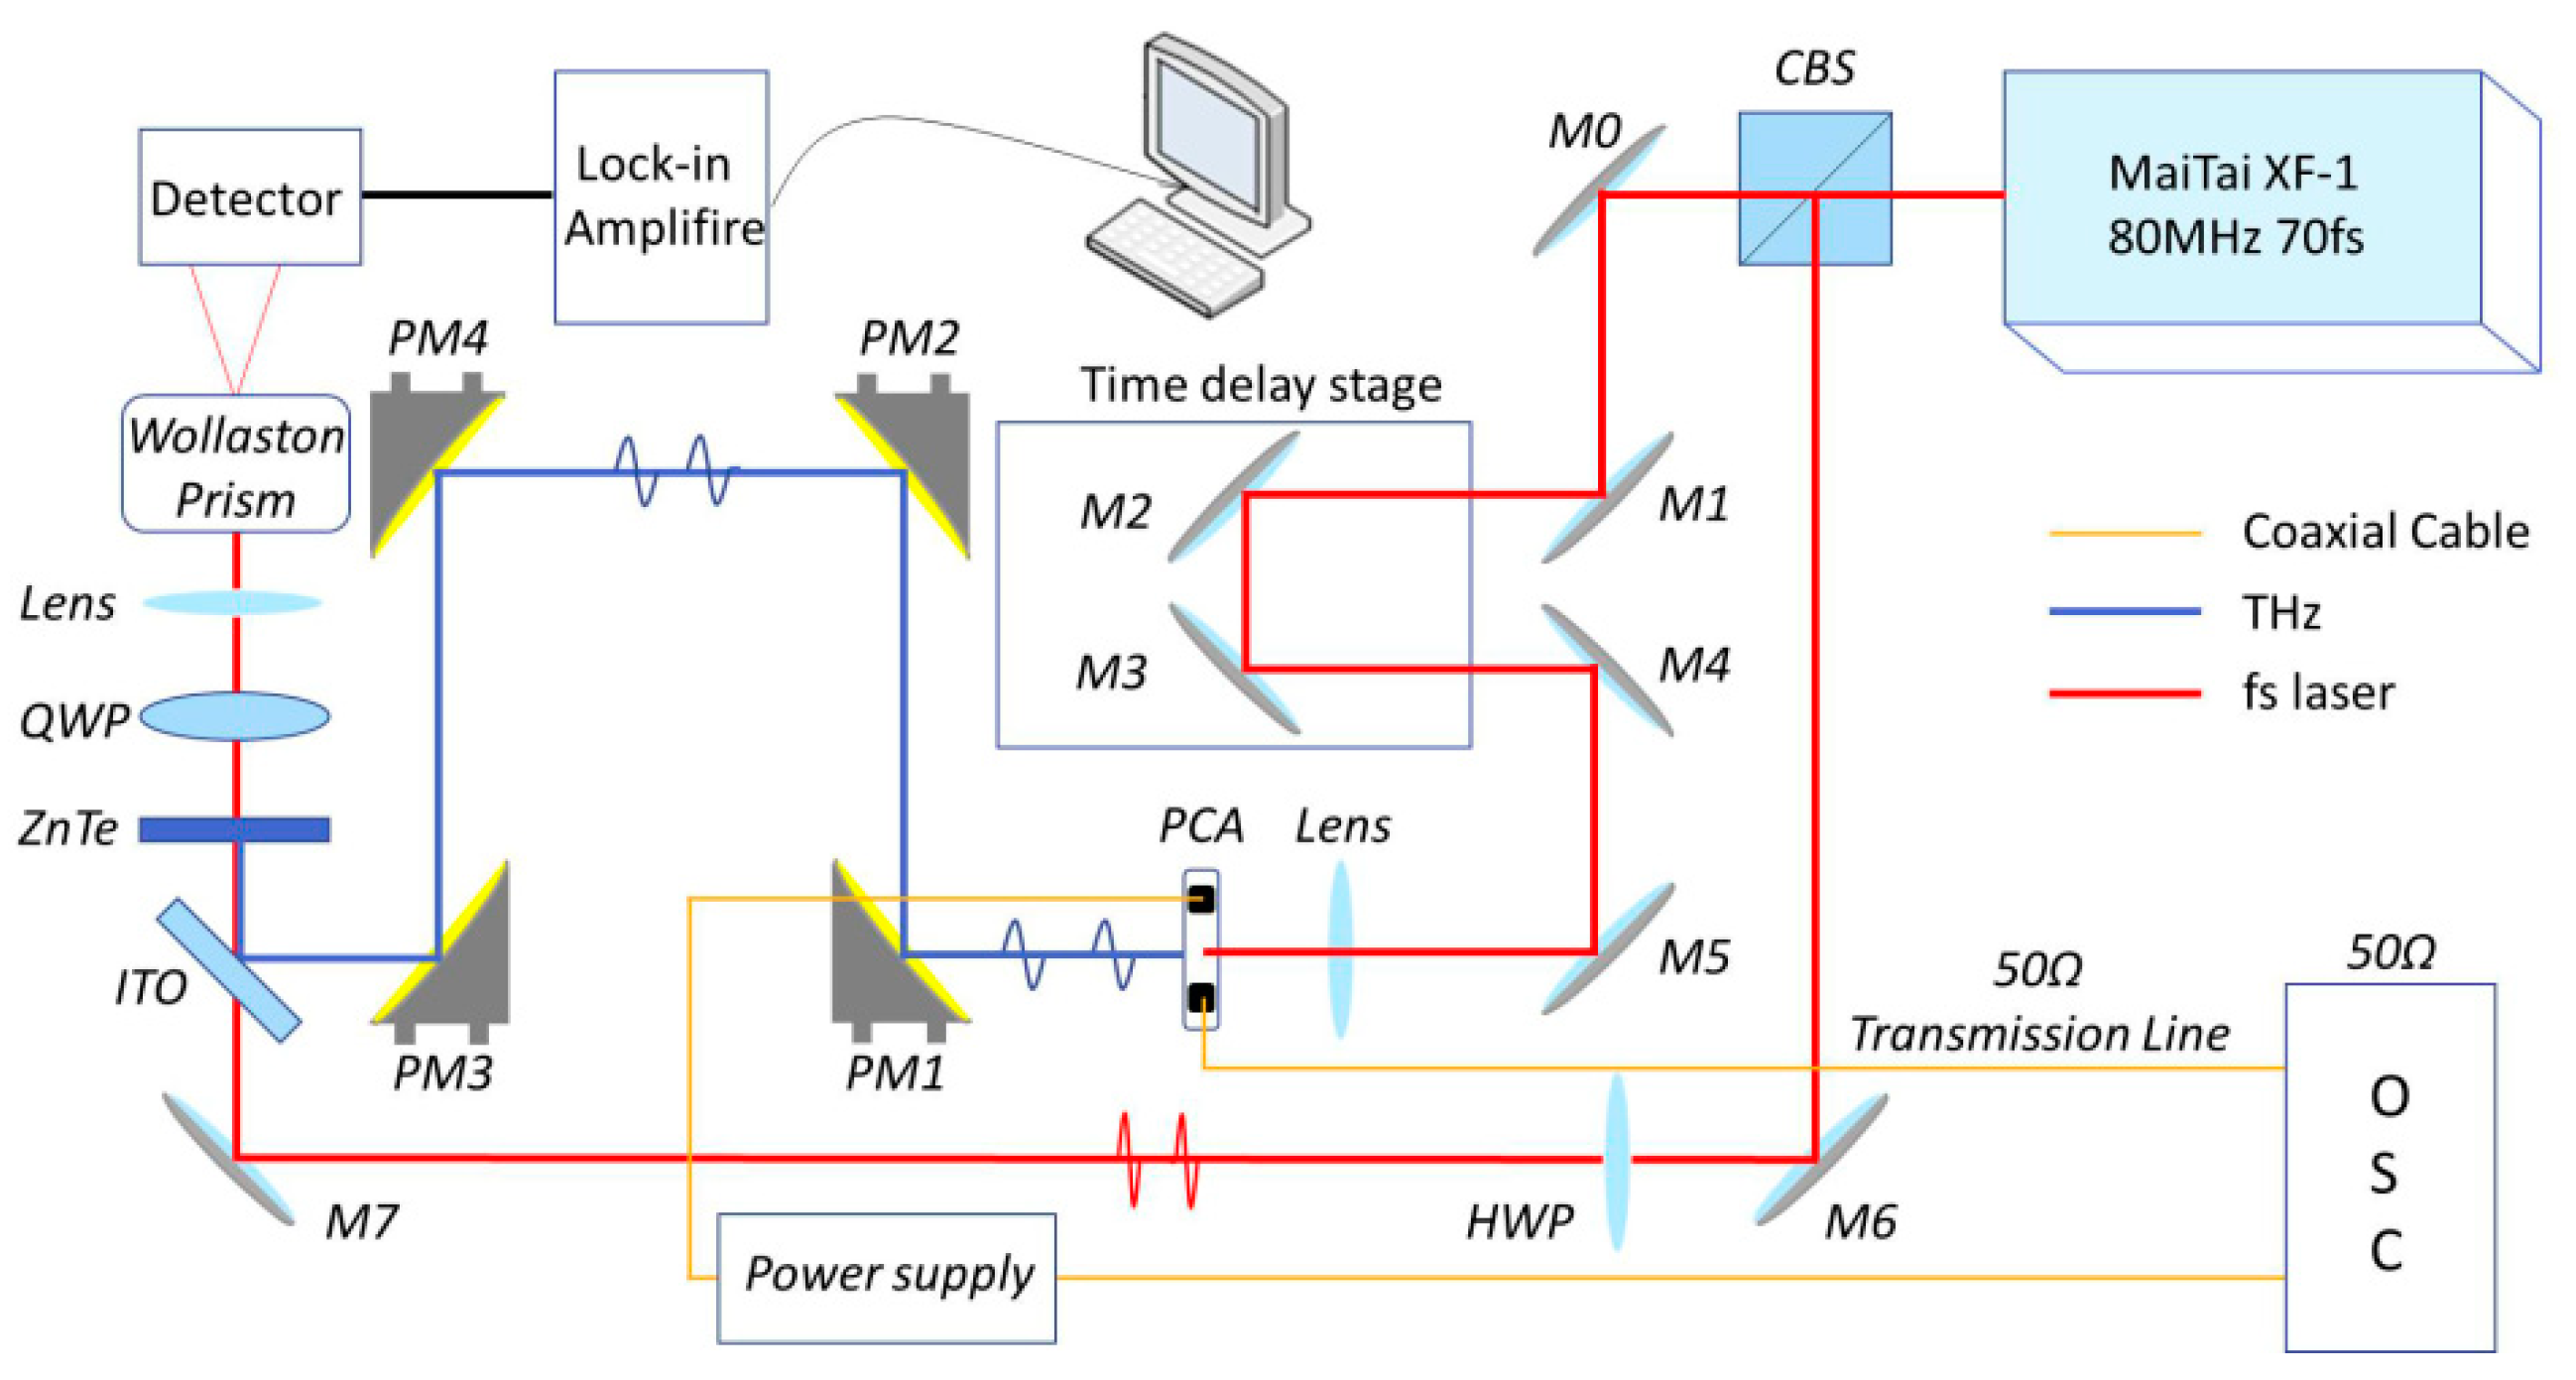
This setup is used to detect the THz time-domain waveform and the photocurrent of the SI-GaAs-based PCA—see Figure 2. The THz-TDS system mainly consists of a femtosecond laser, a time delay system, and a THz emitter source (SI-GaAs PCA), two groups of off-axis parabolic mirrors, a THz detector, a phase-locked amplifier, a pulsed power supply (Zemega Terahertz Crop. HVM-500USB High-Voltage Modulator) and an oscilloscope (Teledyne LeCroy HD4096) [17]. The laser is Ti:sapphire laser (Mai-Tai, Spectra-Physics, Santa Clara, USA), the laser pulse duration is 70 fs, the center wavelength is 800 nm, the average power is 900 mW, and the repetition rate is 80 MHz. The system was used to generate and detect THz time-domain waveform (the average power of pump laser and probe laser is 220 mW and 30 mW, respectively), the diameter of the pump laser spot is around 225 µm in the experiment). Once the SI-GaAs PCA is triggered by the femtosecond laser, the photocurrent pulse signal is reduced by a 20 dB attenuator, and finally detected and stored by an oscilloscope with a bandwidth of 1 GHz [18].
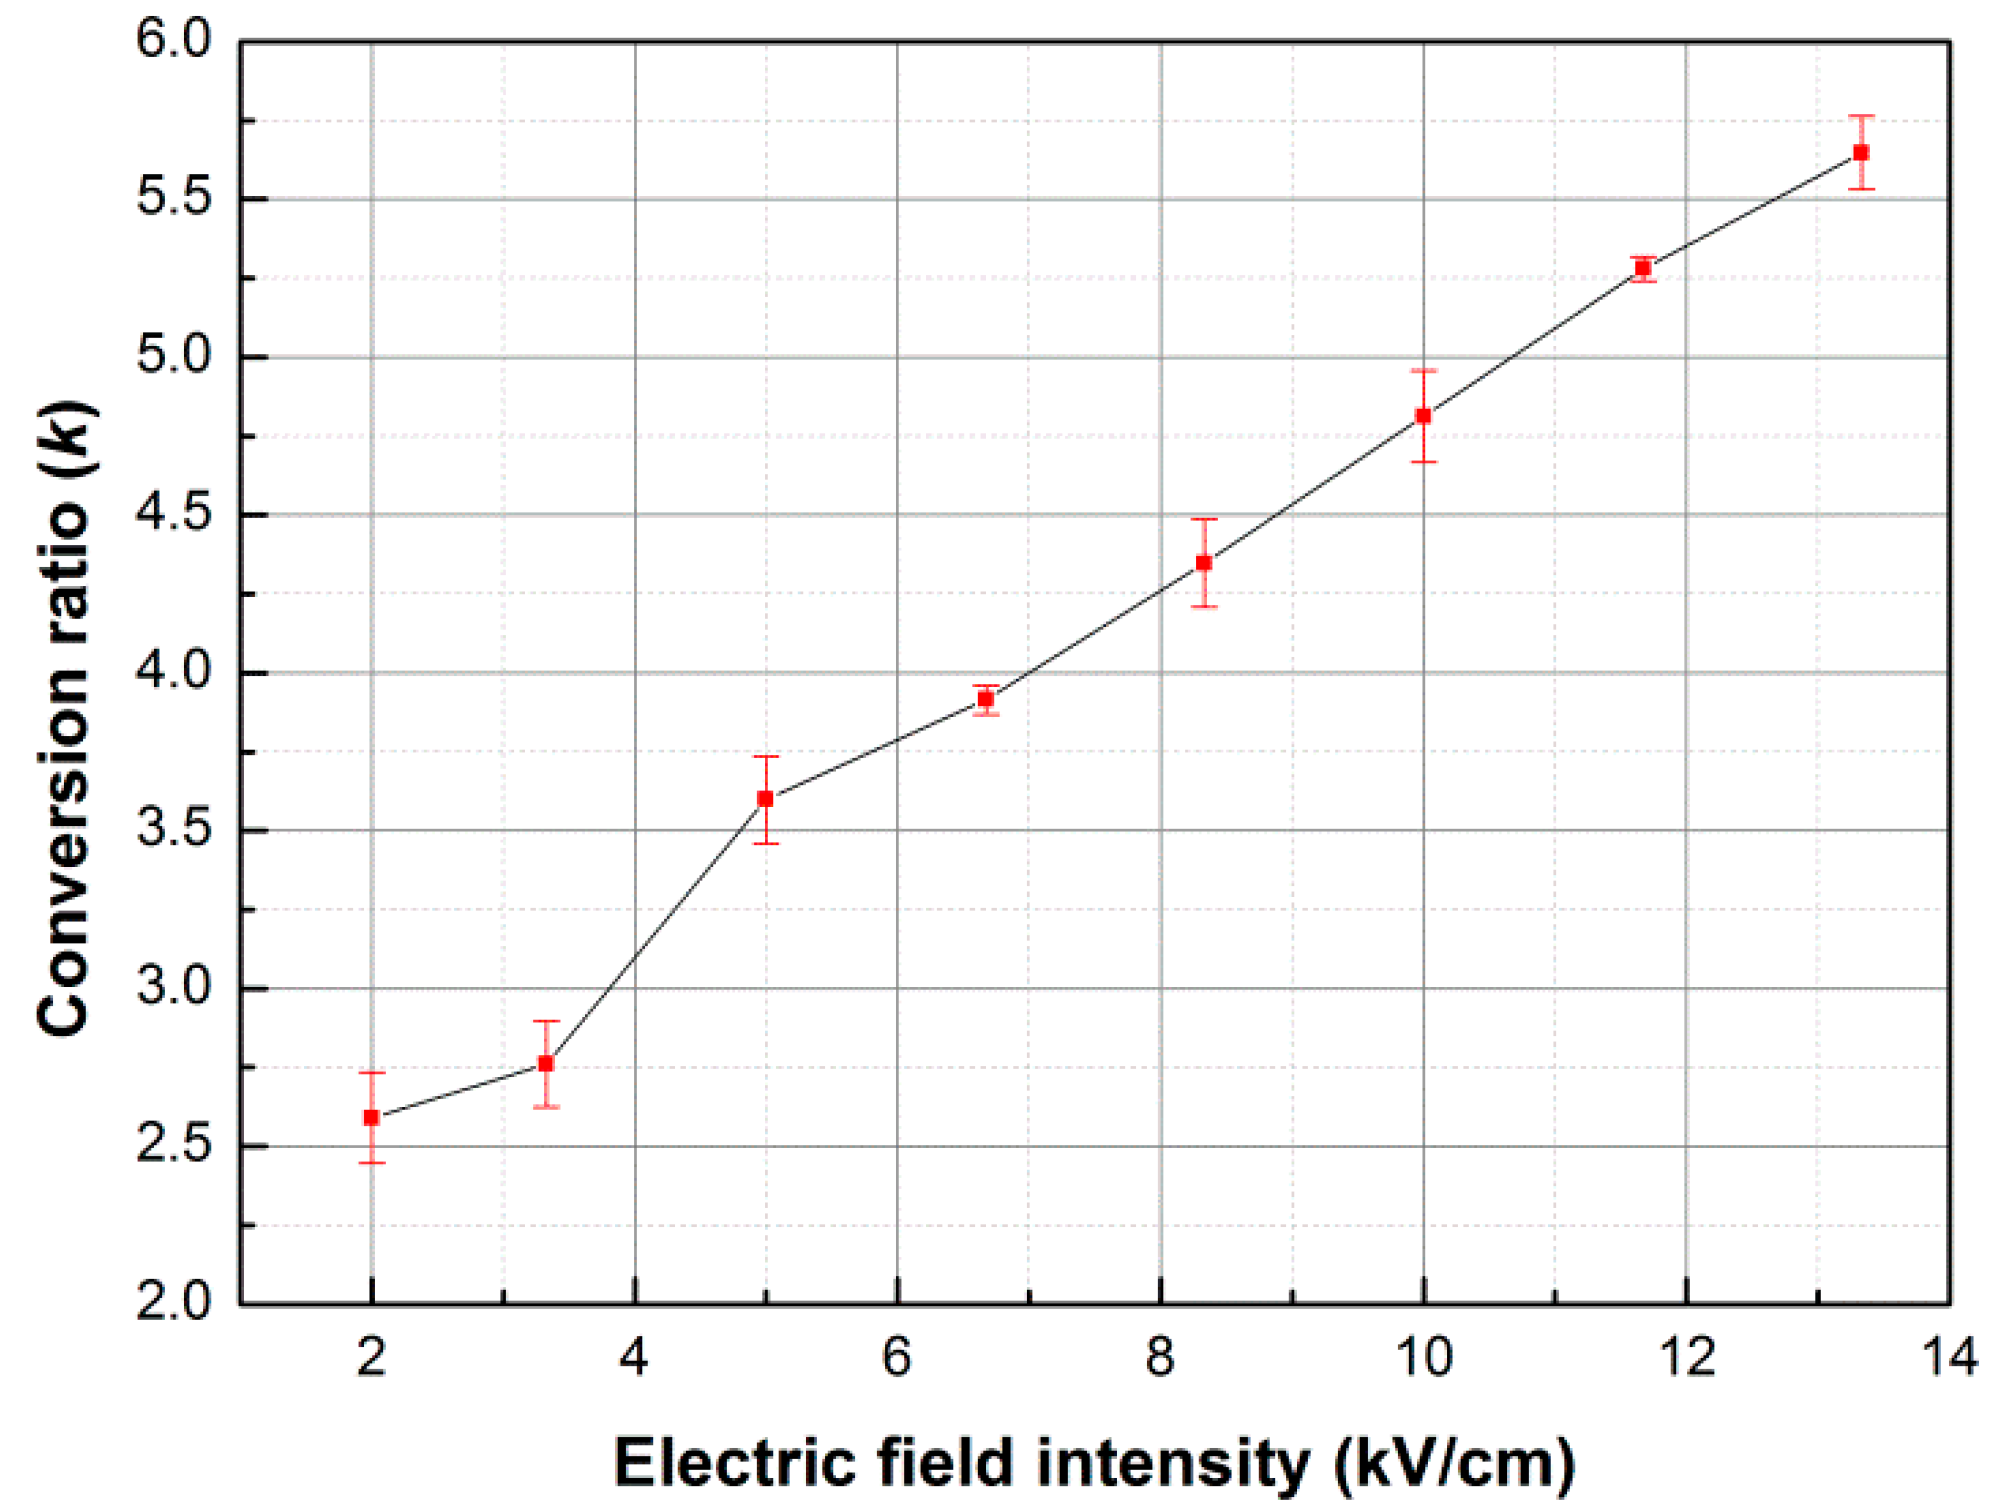
The bias voltage of the photoconductive antenna is 30, 50, 75, 100, 125, 150, 175 and 200 V, respectively, and the corresponding bias electric fields is 2.00, 3.33, 5.00, 6.67, 8.33, 10, 11.67 and 13.33 kV/cm.
In experiment, the average pump laser power remains constant and the spot is irradiated at the center of the SI-GaAs PCA. For each bias voltage, the conversion efficiency between photocurrent and THz time-domain waveform is measured. At the same time the occupancy for photogenerated carriers for the different energy valleys is obtained.

3. Results

3.1. Characteristics of the THz Time-Domain Waveform and Photocurrent for Different Bias Voltages

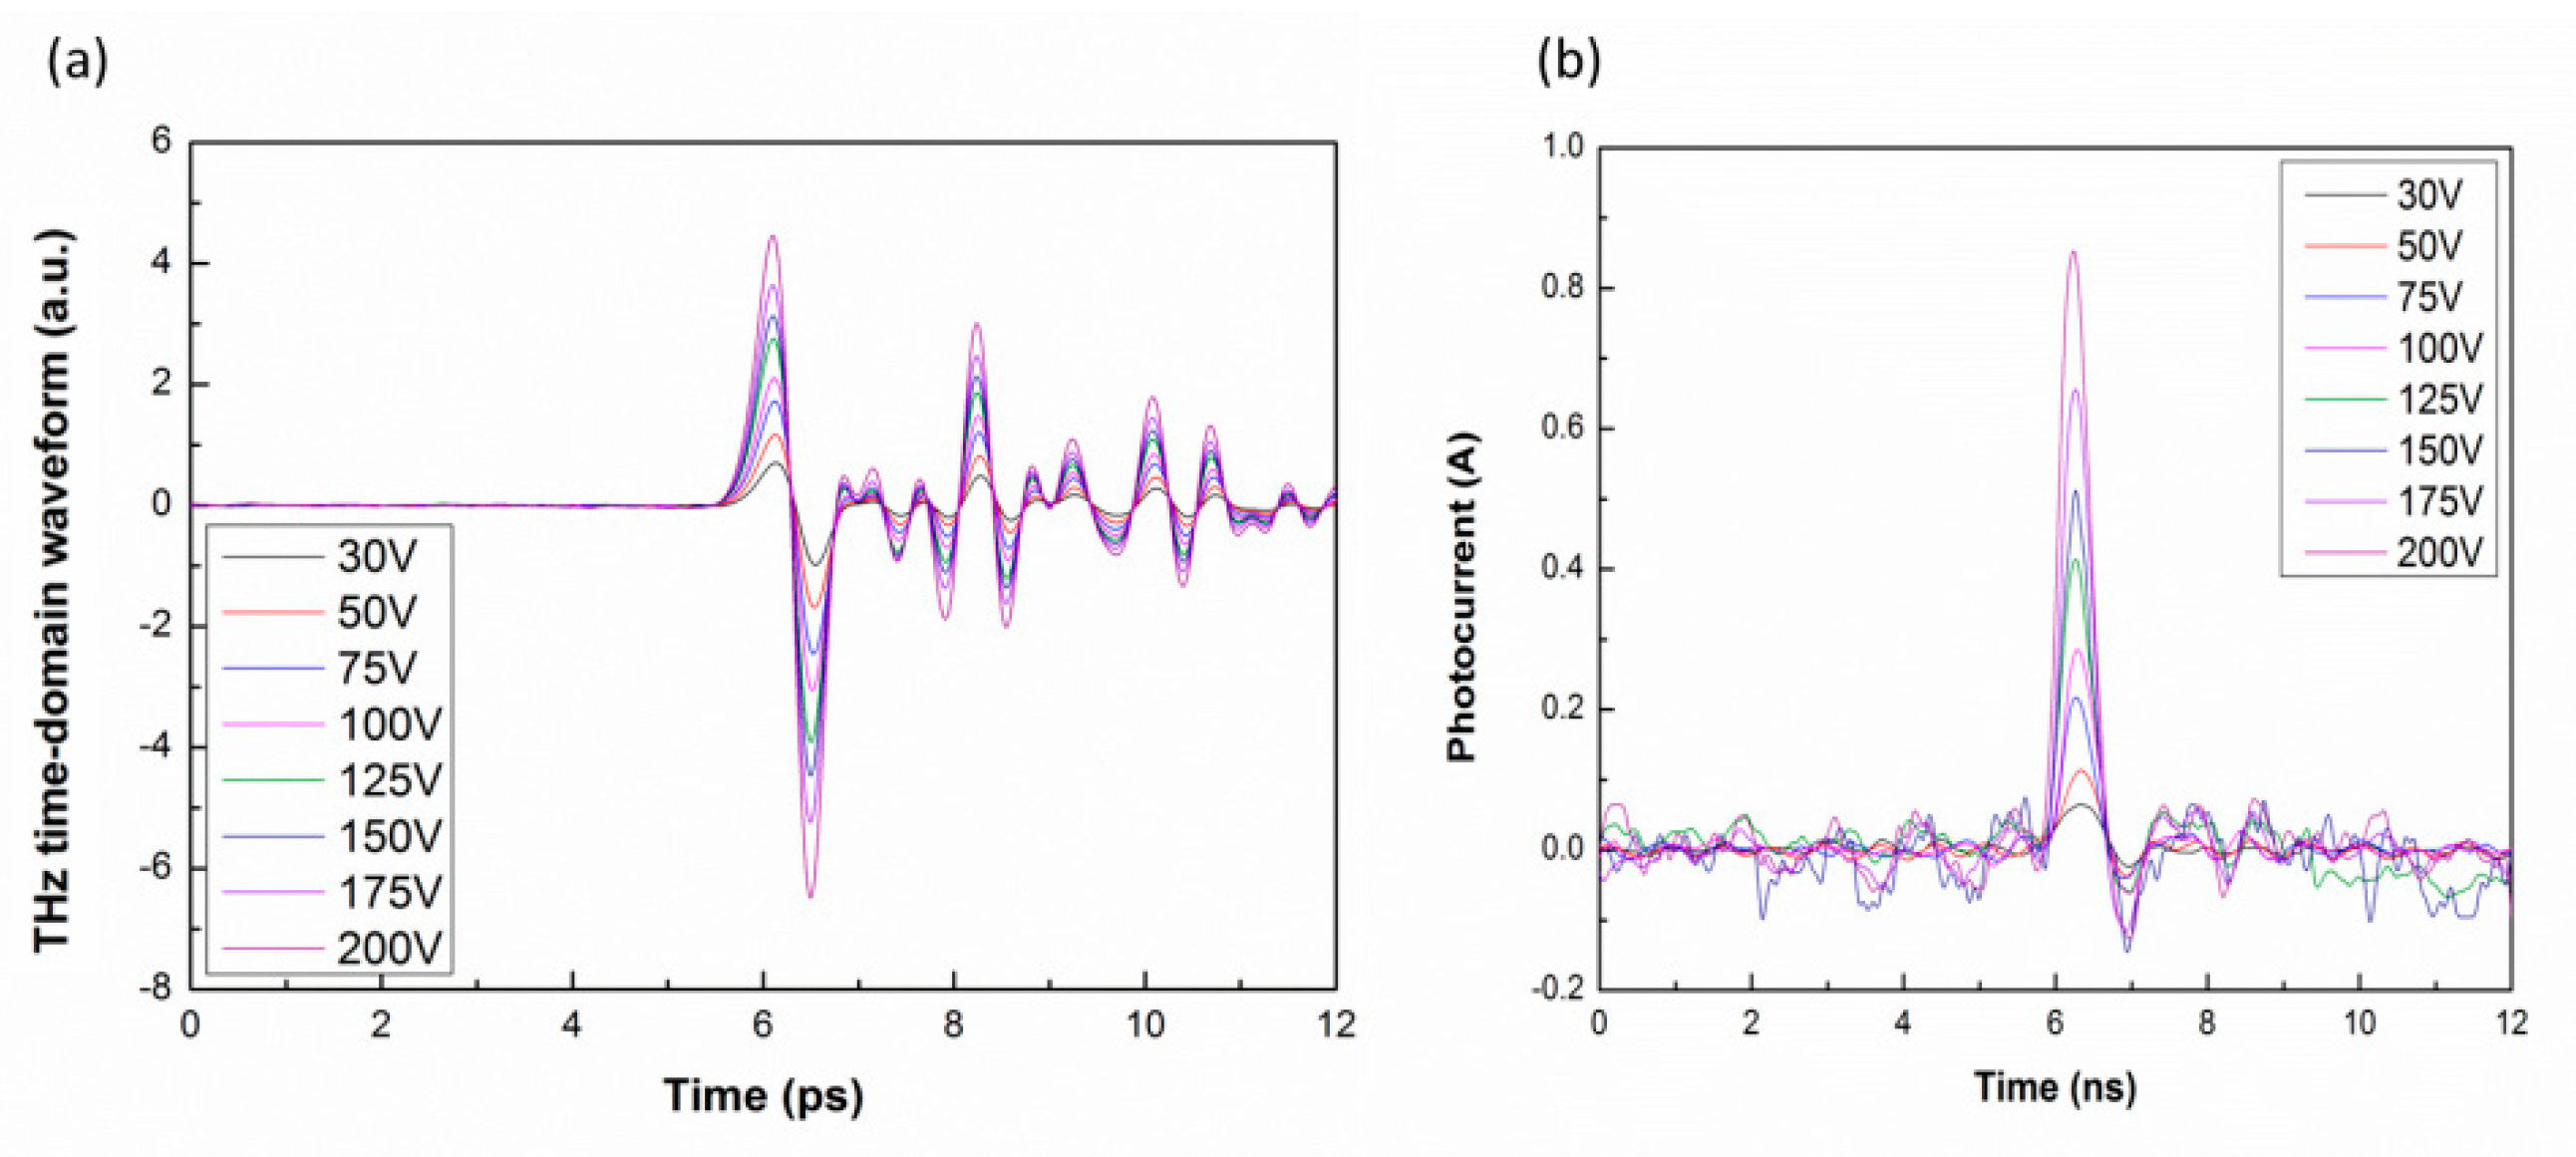
When the optical excitation energy of the femtosecond laser is constant, both THz time-domain waveform and photocurrent from the PCA for different bias voltages are obtained—as shown in Figure 3a,b.
Figure 3a,b shows that with the bias voltage increasing, the THz time-domain waveform and the photocurrent generated by the SI-GaAs PCA increase. Due to the optical excitation energy being constant, the numbers of photogenerated carriers also remain unchanged. In the case of without considering screening effect of the space charge, the change of the photocurrent will be mainly determined by the change of speed of the carriers.

3.2. Relationship between THz Time-Domain Waveform and Photocurrent

When the photon energy is higher than the band gap of the SI-GaAs materials, each photon that is absorbed induces the formation of one electron-hole pair. The external bias electric field drives the photogenerated carriers to form a transient photocurrent. The SI-GaAs PCA transient photocurrent is generated at the gap between the anode and cathode. Then, a THz wave is generated by transient photocurrent. For an elementary Hertzian dipole antenna in vacuum, the radiation field E T H z ( r , t ) , at a distance r and time t, can be described as [3,4,19].
E T H z ( r , t ) = μ 0 4 π sin θ r d d t [ I P C ( t ) ] θ = 1 k d d t [ I P C ( t ) ] ,
Here, I P C ( t ) is the photocurrent in the SI-GaAs PCA, μ 0 is the permeability in vacuum, θ is the angle representing the direction of the antenna, and k is the conversion ratio. Equation (1) indicates that the THz-radiation electric field intensity is mainly proportional to the first derivative of the photocurrent I P C ( t ) with respect to time [20]. The motion of the photogenerated electron-hole pairs can be described using the Drude–Lorentz model. Because the electron mobility is much larger than the hole mobility in GaAs photoconductive material, we consider photogenerated electrons are the main charge carriers. The time-varying photocurrent is expressed as a convolution of the optical pulse envelope and the photocurrent response [21]:
I P C ( t ) = I o p t ( t t ) [ e n ( t ) v ( t ) ] d t ,
In (2), I o p t is the intensity parameter of the optical pulse, e is the charge of a single electron, n ( t ) is the density of the photogenerated carriers, and v ( t ) is the average electron-drift velocity.
In the experiment, because the optical excitation energy of the femtosecond laser remains constant, the change of photocurrent is mainly determined by the change of the average electron drift speed. It means that with the increasing of bias electric field, the change of the average electron-drift speed is the main reason of photocurrent change. The effective mass increases, and the carrier mobility decreases when the carriers enter the satellite valley from the Γ valley.
In this paper, the relationship between THz time-domain waveform and the average electron drift velocity rate is detected by using THz-TDS. Then, the electron transfer rate at different bias voltage is obtained.
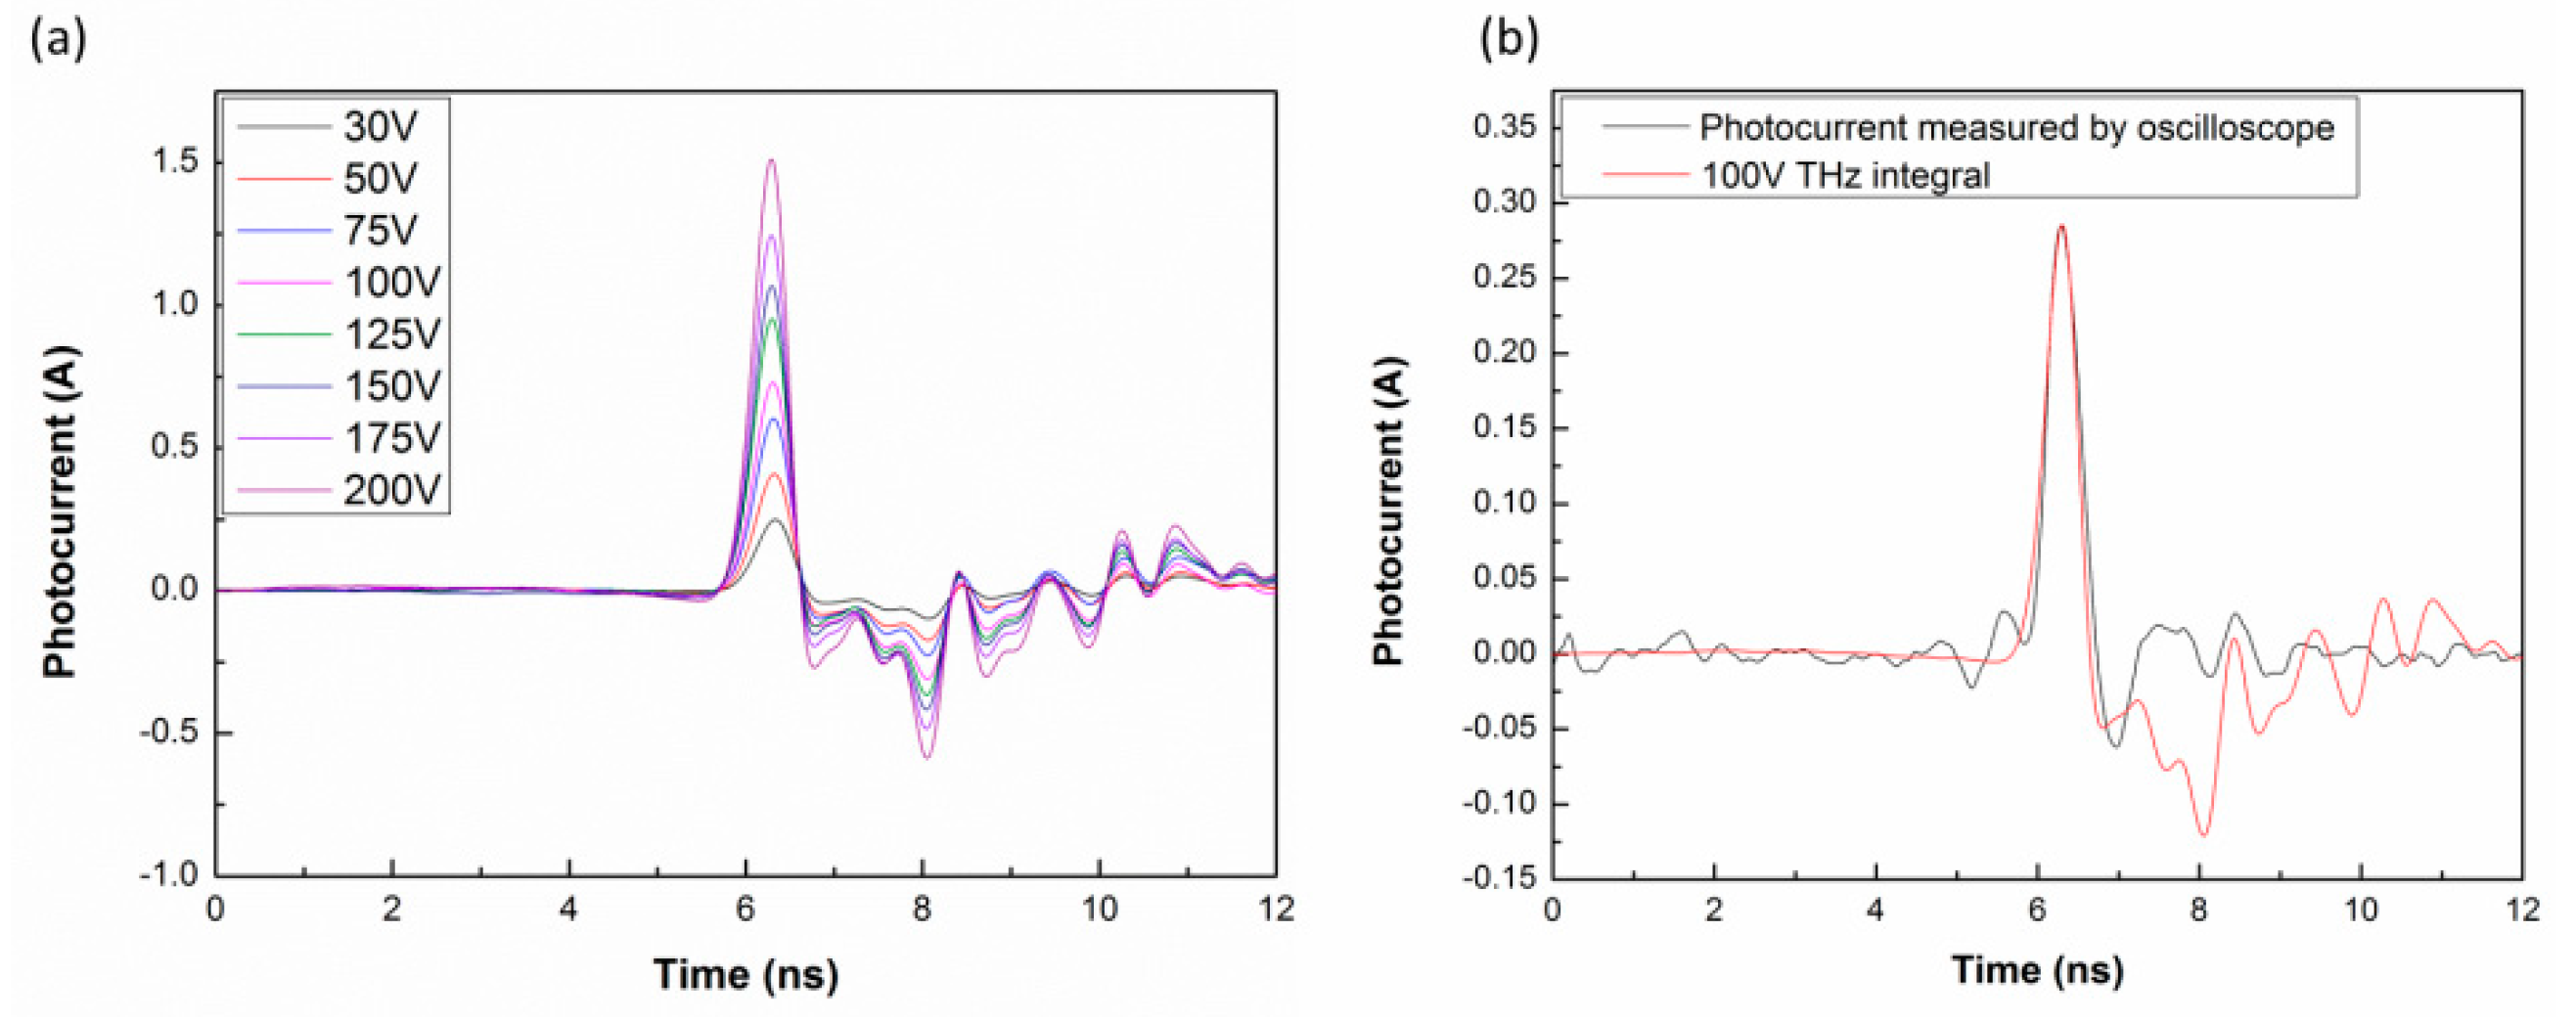
Based on the relationship between the electric field E T H z ( r , t ) of the terahertz time-domain waveform and the THz photocurrent I P C ( t ) , the corresponding photocurrent is obtained by integration (reverse derivation) of the terahertz time-domain waveform signal, as shown in Figure 4a. In the meantime, the change of GaAs-PCA photocurrent is measured by an oscilloscope. The THz photocurrent and GaAs-PCA photocurrent are equivalent, except that they are obtained in different ways. The integrated photocurrent curve with the GaAs PCA photocurrent curve as measured with an oscilloscope are compared as shown in Figure 4b. With the bias voltage increasing, the photocurrent amplitude increases, but the conversion ratio k of the THz electric field decreases. The mean value and standard deviation of conversion ratio k for repeated multiple measurements are shown in Figure 5.
In case the bias voltage is set to 30 V and the gap of the SI-GaAs PCA is 150 µm, the electric field bias is E =   2   kV / cm . Because the electric field is weak, there is not enough energy to make the photogenerated carrier produce valley scattering. It can be considered as all carriers in the Γ valley; therefore, a bias voltage of 30 V can be used as a starting point to determine the rate of carriers transferred to the satellite valley. The carrier occupancy for the Γ valley calculation can be described using Equation (3).
1 k 1 2.59 × 10 5 = ( n 1 μ 1 + n 2 μ 2 ) E ( n 1 + n 2 ) μ 1 E ,
Assuming the Γ valley mobility is 6000   cm 2 / V s and 8000   cm 2 / V s , respectively, the electron mobility of its satellite valley (L valley) is 920   cm 2 / V s . The calculated photogenerated carrier transfer rate is shown in Table 1.
The calculated results indicate that, with increasing electric field bias, the more photogenerated carriers in the Γ valley can receive extra enough energy from the bias electric field and finally transfer to the satellite valley, as shown in Figure 6.
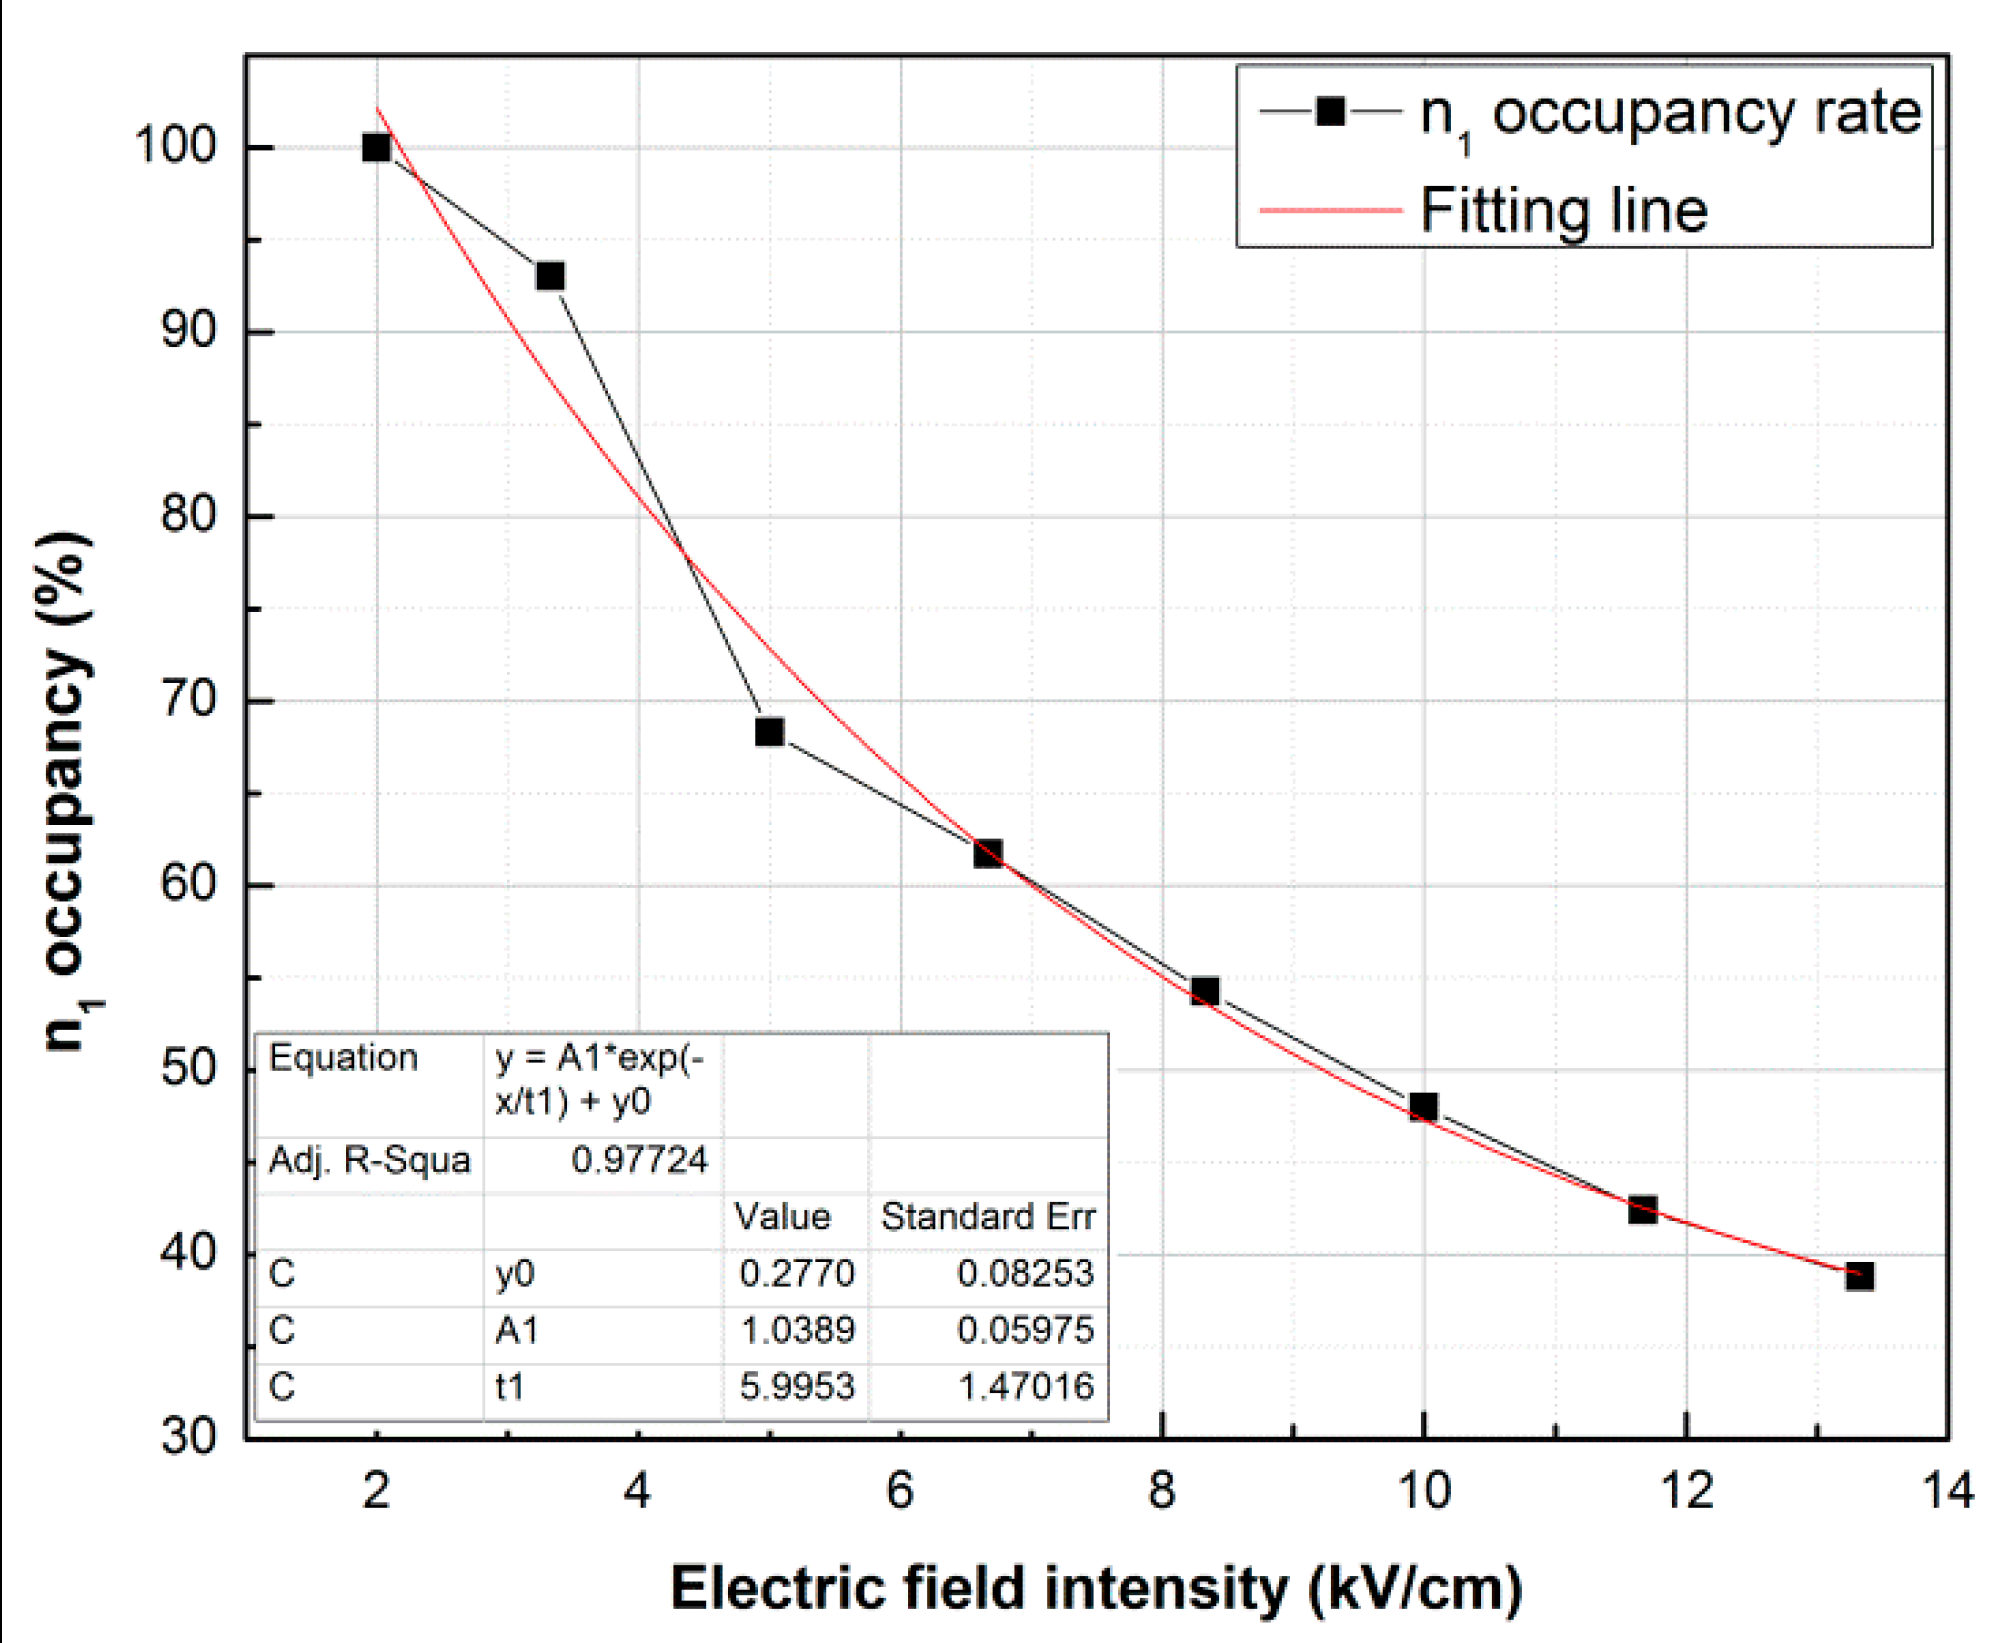
Figure 7 shows the carrier occupancy rate for the Γ valley when the Γ valley mobility is 8000   cm 2 / V s , fitted (using Origin 8.5) with the exponential function:
η = 1.0389 exp ( E 5.9953 ) + 0.277 ,
Here, η is the carrier occupancy rate for the Γ valley, and E is the electric field bias. In the same way, when the Γ valley mobility is 6000   cm 2 / V s , the fitting curve can be described using Equation (5).
η = 1.0867 exp ( E 6.0065 ) + 0.244 ,
In Equations (4) and (5), η is equal to 1. The initial electric field of inter-valley scattering of photogenerated carriers are 2.17 kV/cm and 2.18 kV/cm, respectively. In other words, when the electric field is less than 2.17 kV/cm and the Γ valley mobility is 8000   cm 2 / V s , all photogenerated carriers are located in the Γ valley. When the electric field is less than 2.18 kV/cm and the Γ valley mobility is 6000   cm 2 / V s , all photogenerated carriers are located in the Γ valley.

4. Discussion

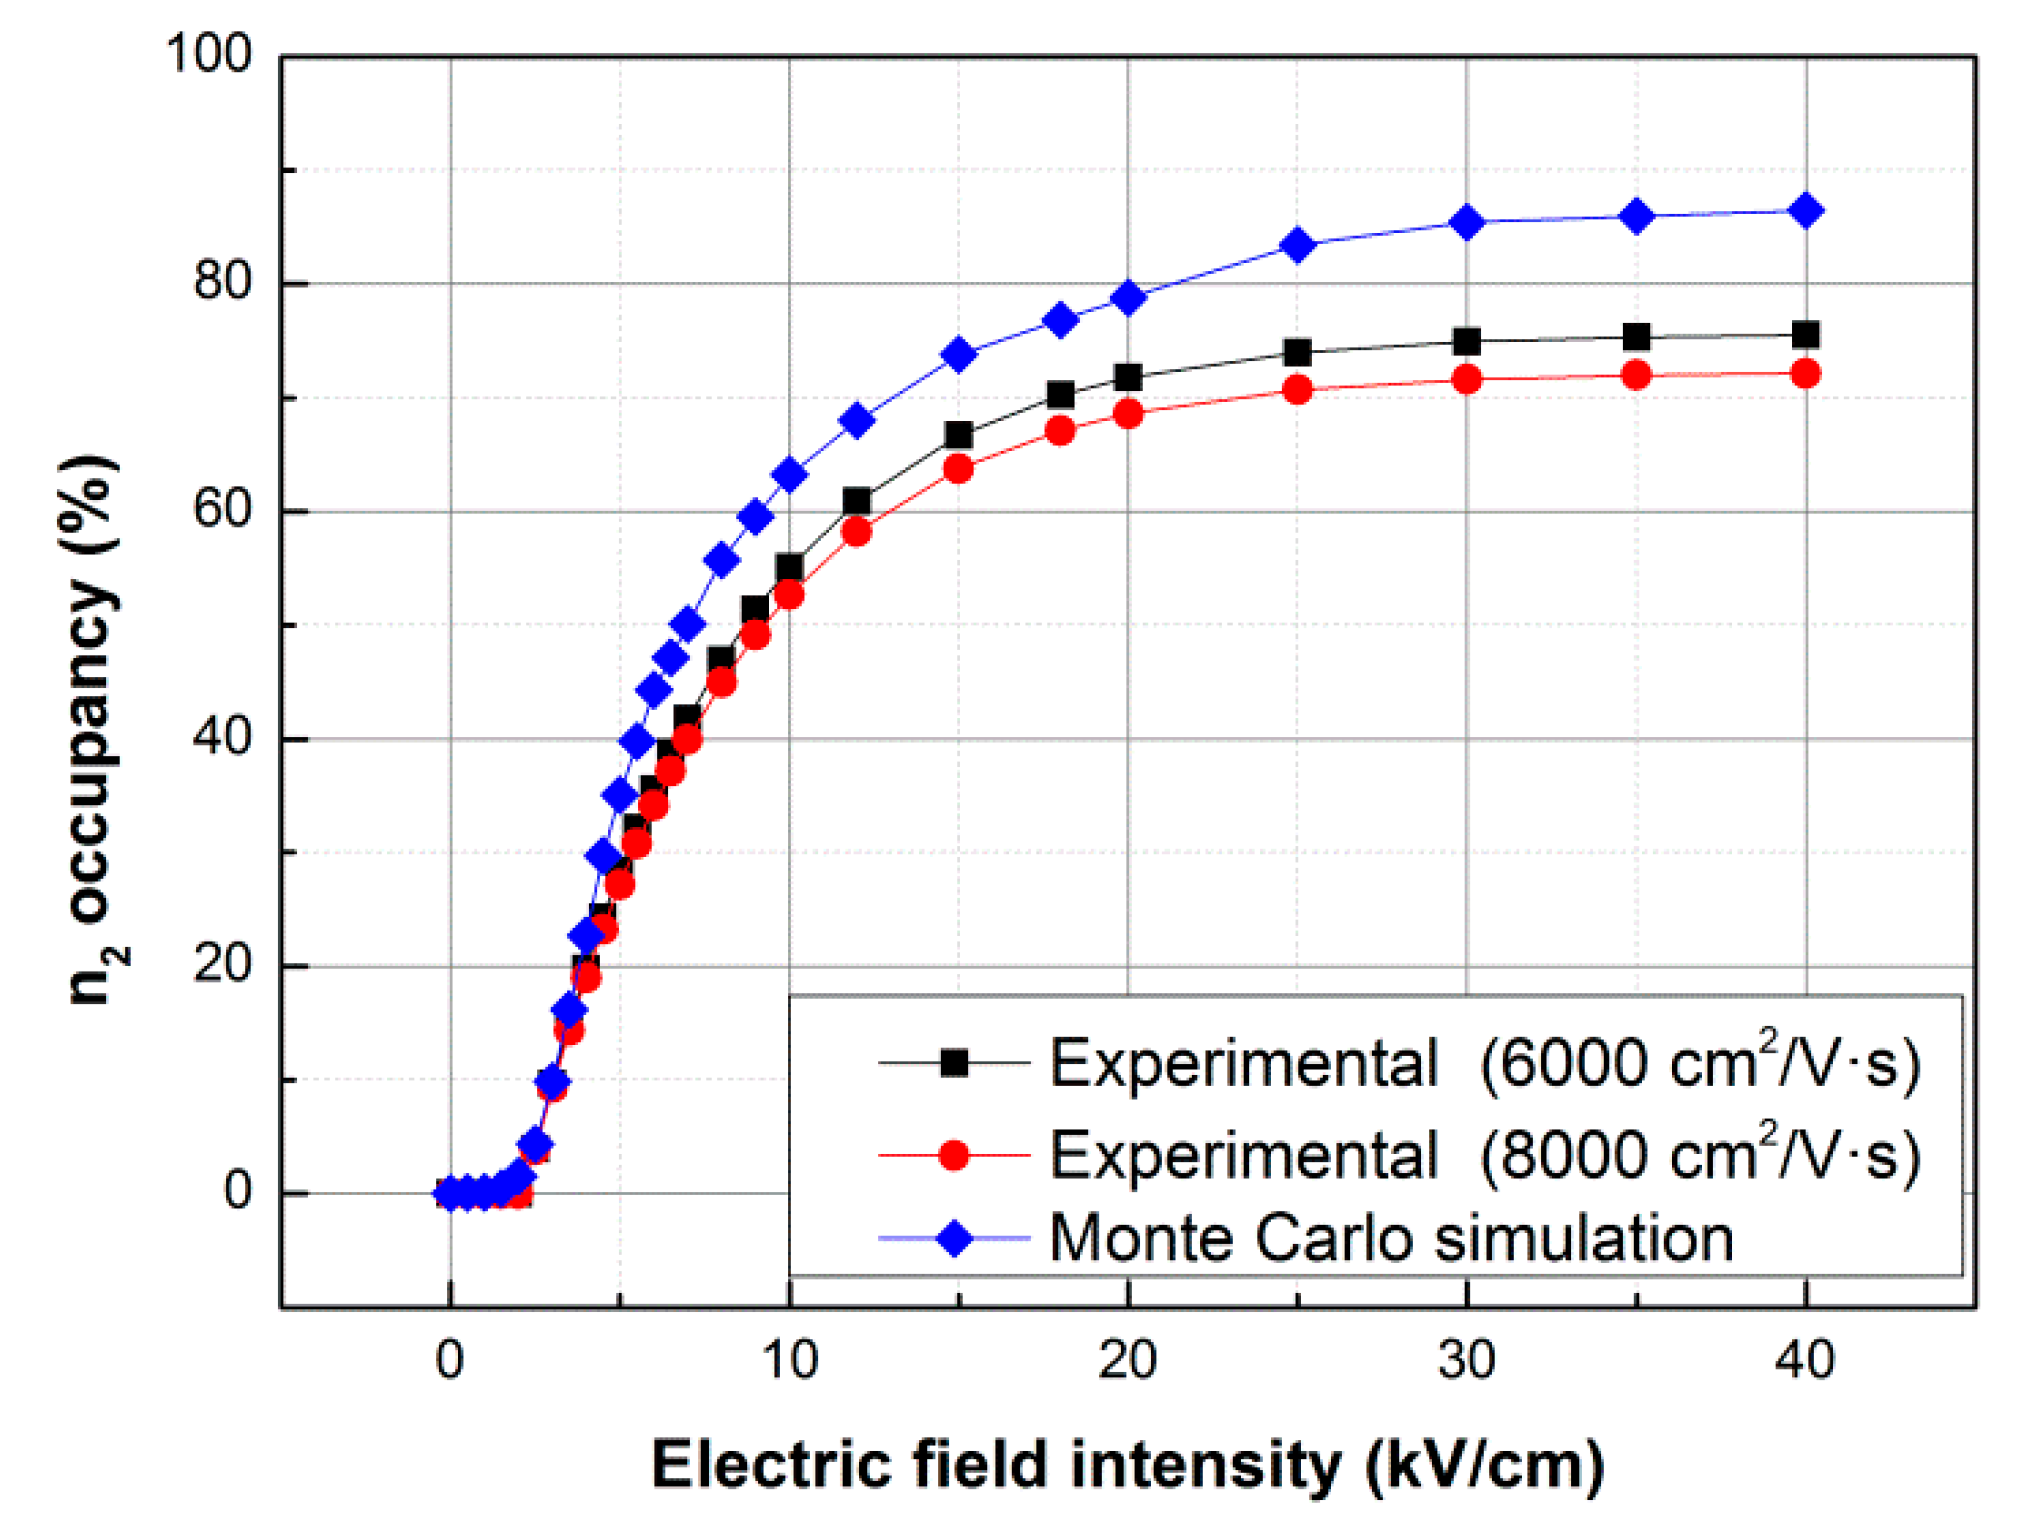
In order to investigate the carrier occupancy rate of the Γ valley and satellite valley (L valley) at the high bias electric field, an ensemble Monte Carlo simulation based on the theory of photo-activated charge domain (PACD) is developed. Considering the two cores of PACD theory, the impact ionization and recombination radiation process are simulated. In our simulation, the band structure of three valleys is Γ valley, L valley and X valley, respectively. The amount of particles is kept constant at 3.0 × 10 4 . The results of the fitted curve to the carrier occupancy rate and Monte Carlo simulation are plotted in Figure 8.
When the bias electric field E is less than 2.00 kV/cm, the majority of photogenerated carriers are located in the Γ valley, as shown in Figure 8. When the electric field is equal to 20.00 kV/cm, the majority of the photogenerated carriers transfer to the satellite valley. The data approximates the ending electric field for the negative differential mobility (NDM). Therefore, based on the PACD’s formation and transport, the available electric energy is not sufficient to make more carriers generate valley scattering. With increasing electric field bias, the carrier occupancy rate for the satellite valley saturates at 72.16% when the Γ valley mobility is 8000   cm 2 / V s .
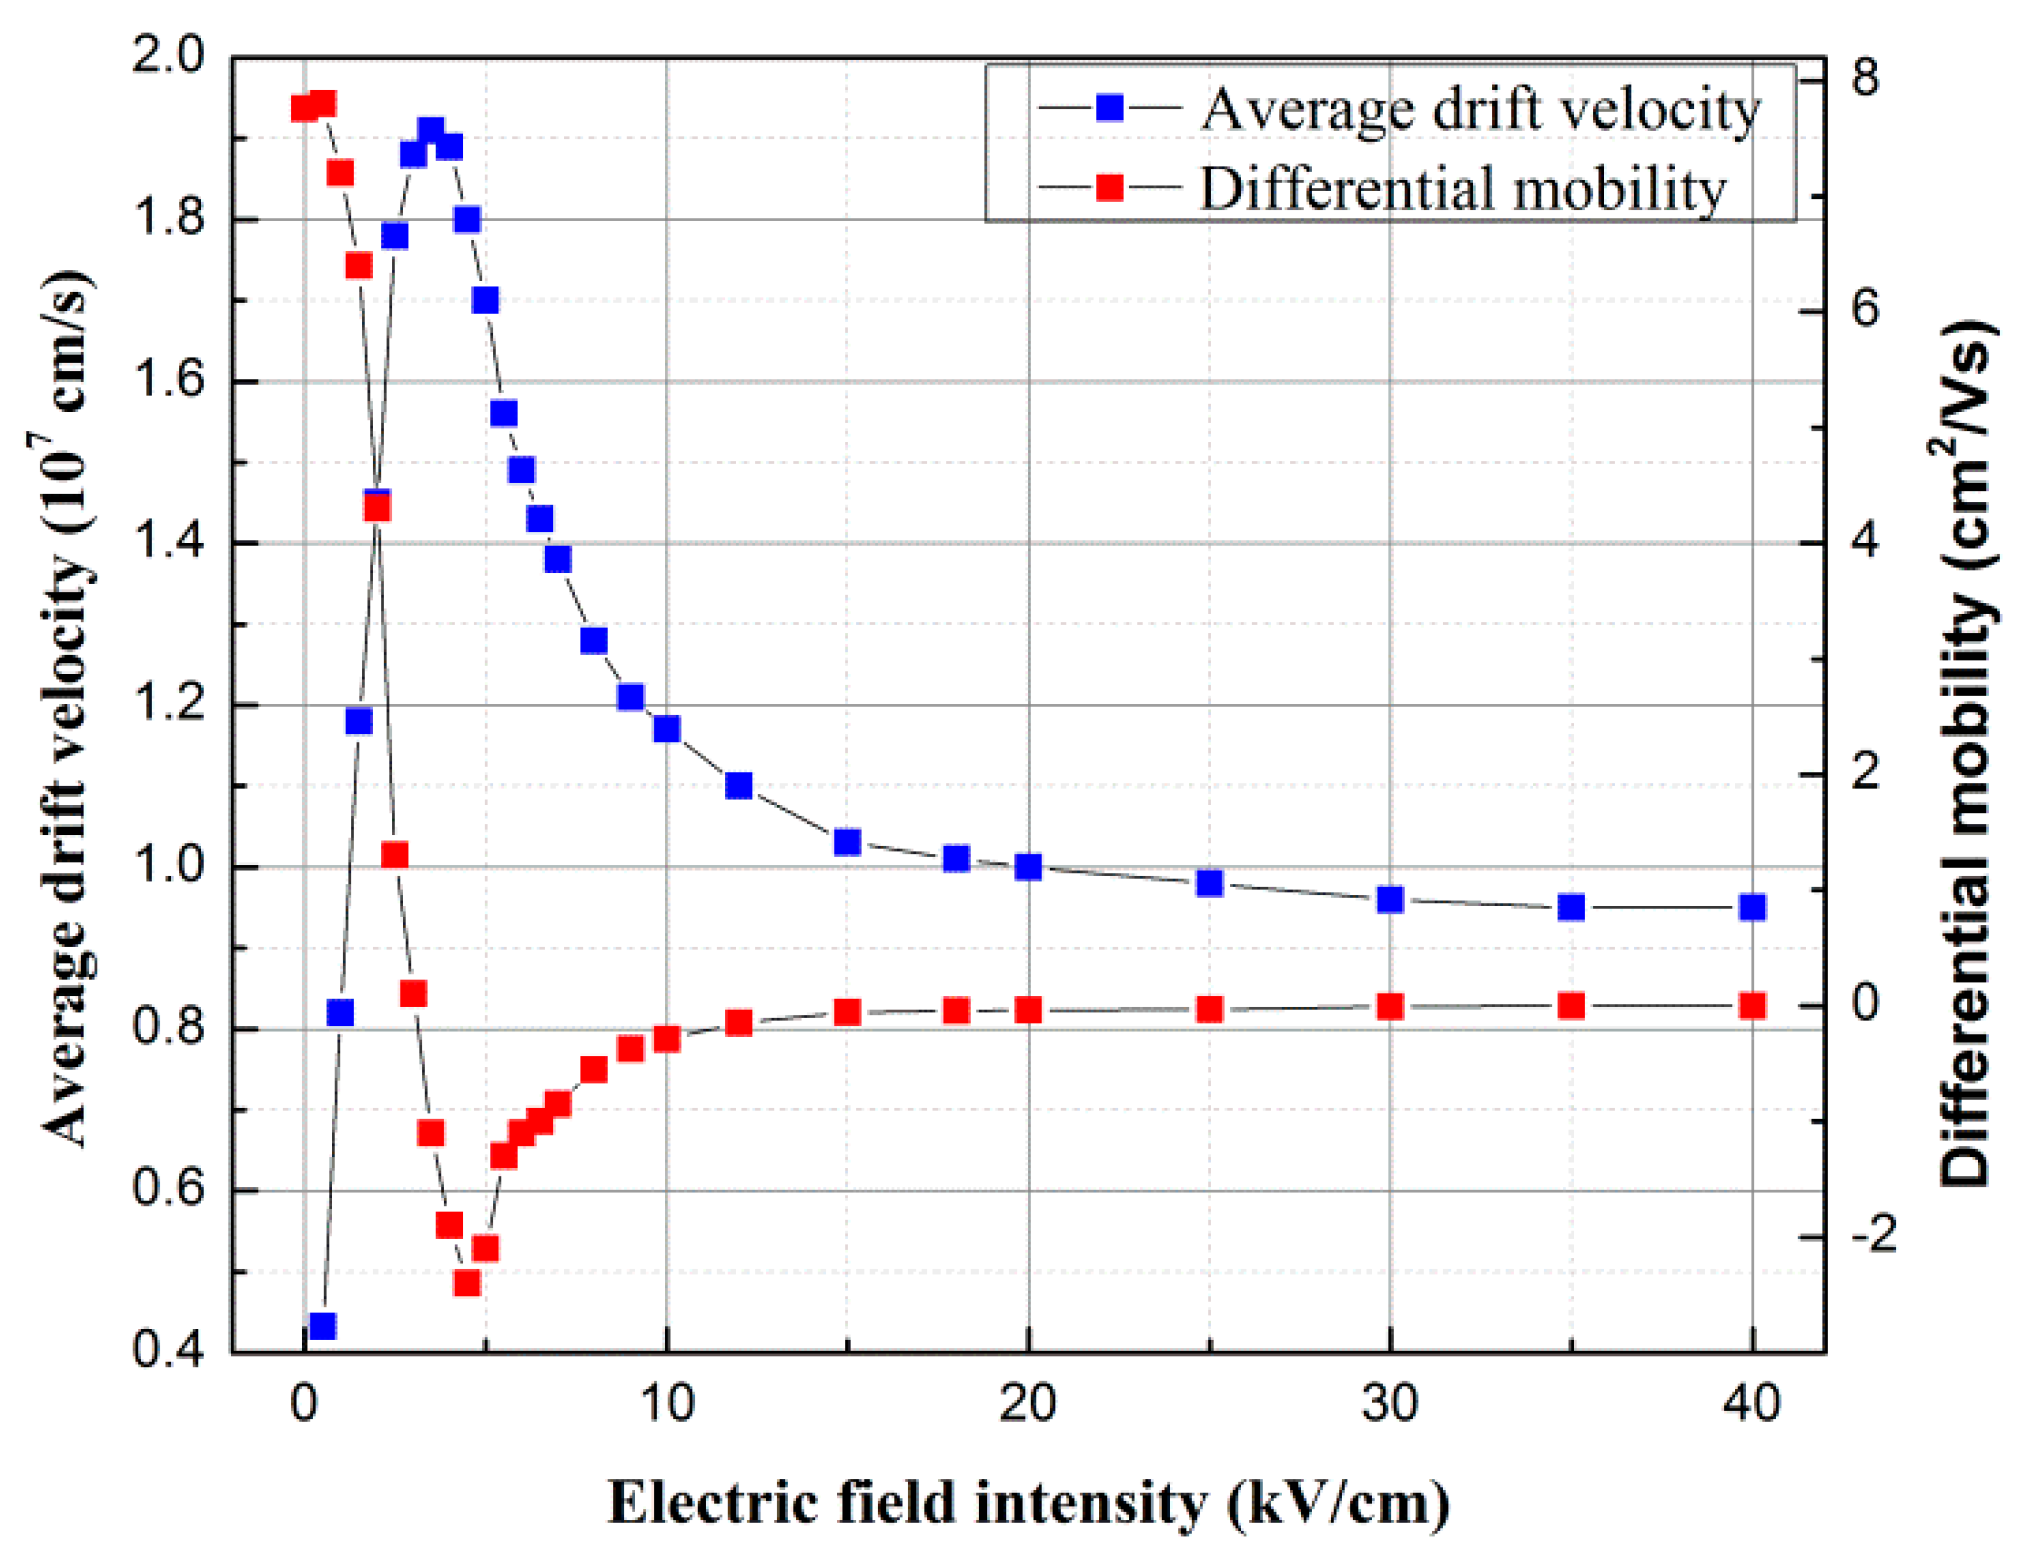
The result with Monte Carlo simulation of average drift velocity and differential mobility versus electric field are plotted in Figure 9. When the electric field is less than 2.00 kV/cm, the υ ¯ d increases with the increase of electric field, the μ ¯ is about 6400   cm 2 / V s , and the volt-ampere characteristics of SI-GaAs PCA basically conform to the ohmic contact. With the bias electric field continuing to increase, the velocity field gradually deviates from the linear relationship. When the electric field is 3.50 kV/cm, the υ ¯ d reaches the maximum value, about 1.9 × 10 7   cm / s . With the bias electric field increasing, the average drift velocity begins to decrease; the differential mobility becomes negative, and the minimum value is 2400   cm 2 / V s . Finally, when the bias electric field is 30.00 kV/cm, the υ ¯ d is saturated, and its value is about 0.96 × 10 7   cm / s .
Comparing the experimental result with simulation results, the essential difference is that the simulation process is completed under ideal conditions. When the bias electric field is less than 2.00 kV/cm, the inter-valley scattering phenomenon of photogenerated carriers has appeared. In the experiment, the bias electric field when the inter-valley scattering phenomenon occurs is about 2.17 kV/cm.

5. Conclusions

In conclusion, the occupancy rate of photogenerated carriers for different energy valleys is measured by comparing the photocurrent of terahertz field integrating with respect to time with the photocurrent measured by oscilloscope. The results indicate that 93.06% of all the photogenerated carriers are in the Γ valley when the electric field bias is 3.33 kV/cm, and 68.6% of all photogenerated carriers transfer to the satellite valley when the electric field bias is 20.00 kV/cm. With increasing electric field bias, the carrier occupancy rate for the satellite valley saturates at 72.16% when the Γ valley mobility is 8000   cm 2 / V s , and the satellite valley (L valley) mobility is 920   cm 2 / V s . Due to the impact of ionization and recombination radiation during the formation of the PACD, the available electric energy is not sufficient to make more carriers generate valley scattering; it provides a theoretical basis for generating high-power terahertz radiation using GaAs PCA’s nonlinear working mode.

Author Contributions

Conceptualization, W.S. and C.D.; methodology, W.S., F.X. and Y.H.; software, W.S.; validation and investigation, W.S., F.X., Y.H. and C.D.; writing—original draft preparation, C.D.; writing—review and editing, W.S., F.X. and Y.H. All authors have read and agreed to the published version of the manuscript.

Funding

This research was funded by the National Natural Science Foundation of China under Grant 61427814, in part by the National Key Research and Development Program of China under Grant 2017YFA0701005, in part by the State Key Laboratory of Intense Pulsed Radiation Simulation and Effect of China under Grant SKLIPR1812, in part by the Foundation Research Project of Jiangsu Province (The Natural Science Fund NO. BK20190187).

Conflicts of Interest

The authors declare no conflict of interest.

References

  1. Auston, D.H.; Cheung, K.P.; Smith, P.R. Picosecond photoconducting Hertzian dipoles. Appl. Phys. Lett. 1984, 45, 284–286. [Google Scholar] [CrossRef]
  2. Smith, P.R.; Auston, D.H.; Nuss, M.C. Subpicosecond photoconducting dipole antennas. IEEE J. Quantum Electron. 1988, 24, 255–260. [Google Scholar] [CrossRef]
  3. Zhang, J.; Hong, Y.; Braunstein, S.L.; Shore, K.A. Terahertz pulse generation and detection with LT-GaAs photoconductive antenna. IEE Proc. Optoelectron. 2004, 151, 98–101. [Google Scholar] [CrossRef]
  4. Tani, M.; Matsuura, S.; Sakai, K.; Nakashima, S. Emission characteristics of photoconductive antennas based on low-temperature-grown GaAs and semi-insulating GaAs. Appl. Opt. 1997, 36, 7853–7859. [Google Scholar] [CrossRef] [PubMed] [Green Version]
  5. Hirori, H.; Doi, A.; Blanchard, F.; Tanaka, K. Single-cycle terahertz pulses with amplitudes exceeding 1 MV/cm generated by optical rectification in LiNbO3. Appl. Phys. Lett. 2011, 98, 091106. [Google Scholar] [CrossRef]
  6. Blanchard, F.; Razzari, L.; Bandulet, H.C.; Sharma, G.; Morandotti, R.; Kieffer, J.C.; Ozaki, T.; Reid, M.; Tiedje, H.F.; Haugen, H.K.; et al. Generation of 1.5 µJ single-cycle terahertz pulses by optical rectification from a large aperture ZnTe crystal. Opt. Express. 2007, 15, 13212–13220. [Google Scholar] [CrossRef] [PubMed]
  7. Worrall, C.; Alton, J.; Houghton, M.; Barbieri, S.; Beere, H.E.; Ritchie, D.; Sirtori, C. Continuous wave operation of a superlattice quantum cascade laser emitting at 2 THz. Opt. Express. 2006, 14, 171–181. [Google Scholar] [CrossRef] [PubMed]
  8. Roskos, H.G.; Nuss, M.C.; Shah, J.; Leo, K.; Miller, D.A.; Fox, A.M.; Schmitt-Rink, S.; Köhler, K. Coherent submillimeter-wave emission from charge oscillations in a double-well potential. Phys. Rev. Lett. 1992, 68, 2216–2219. [Google Scholar] [CrossRef] [PubMed]
  9. Sun, Y. A promising diagnostic method: Terahertz pulsed imaging and spectroscopy. World J. Radiol. 2011, 3, 55–65. [Google Scholar] [CrossRef] [PubMed]
  10. Von Gabriel, C.L. Investigation of Low-Temperature-Grown GaAs Photoconductive Antennae for Continous-Wave and Pulsed Terahertz Generation. Ph.D. Thesis, Goethe University Frankfurt, Frankfurt, Germany, 2007. [Google Scholar]
  11. Ma, C.; Yang, L.; Wang, S.; Ji, Y.; Zhang, L.; Shi, W. Study of the Lifetime of High-Power GaAs PCSSs Under Different Energy Storage Modes. IEEE Trans. Power Electron. 2017, 32, 4644–4651. [Google Scholar] [CrossRef]
  12. Xu, M.; Dong, C.; Shi, W. 1-kHz Repetitive Operation of Quenched High-Gain GaAs Photoconductive Semiconductor Switches at 8-nJ Excitation. IEEE J. Sel. Top. Quantum Electron. 2017, 23, 1–6. [Google Scholar] [CrossRef]
  13. Shi, W.; Wang, S.; Ma, C.; Xu, M. Generation of an ultra-short electrical pulse with width shorter than the excitation laser. Sci. Rep. 2016, 6, 27577. [Google Scholar] [CrossRef] [PubMed]
  14. Zhang, L.; Shi, W.; Cao, J.; Wang, S.; Dong, C.; Yang, L. Research on Time Jitter of GaAs Photoconductive Semiconductor Switches in the Negative Differential Mobility Region. IEEE Electron Device Lett. 2019, 40, 291–294. [Google Scholar] [CrossRef]
  15. Požela, J.; Reklaitis, A. Electron transport properties in GaAs at high electric fields. Solid State Electron. 1980, 23, 927–933. [Google Scholar]
  16. Shi, W.; Jiang, H.; Li, M.; Ma, C.; Gui, H.; Wang, L.; Xue, P.; Fu, Z.; Cao, J. Investigation of electric field threshold of GaAs photoconductive semiconductor switch triggered by 1.6 μ J laser diode. Appl. Phys. Lett. 2014, 104, 042108. [Google Scholar] [CrossRef]
  17. Chen, S.; Shi, W.; Hou, L.; Dai, R. Effecting factor of peak frequency of THz wave from photoconductive antennas. In Proceedings of the Photonics and Optoelectronics Meetings (POEM) 2011: Laser and Terahertz Science and Technology, Wuhan, China, 2–5 November 2011; SPIE: Bellingham, DC, USA, 2012; 8330, p. 833016. [Google Scholar]
  18. Xu, M.; Li, R.; Ma, C.; Shi, W. 1.23-ns Pulsewidth of Quenched High Gain GaAs Photoconductive Semiconductor Switch at 8-nJ Excitation. IEEE Electron Device Lett. 2016, 37, 1147–1149. [Google Scholar] [CrossRef]
  19. Chen, G.; Cui, T.J.; Jiang, Z.J.; Zhang, J. Study on characteristics of terahertz radiation in the surface and far field generated by large-aperture photoconductive antennas. J. Phys. Conf. Ser. 2011, 276, 012202. [Google Scholar] [CrossRef]
  20. Sakai, K.; Tani, M. Introduction to Terahertz Pulses. In Terahertz Optoelectronics; Springer: Berlin/Heidelberg, Germany, 2005; Volume 31, pp. 1147–1149. [Google Scholar]
  21. Duvillaret, L.; Garet, F.; Roux, J.-F.; Coutaz, J.-L. Analytical modeling and optimization of terahertz time-domain spectroscopy experiments, using photoswitches as antennas. IEEE J. Sel. Top. Quantum Electron. 2001, 7, 615–623. [Google Scholar] [CrossRef]
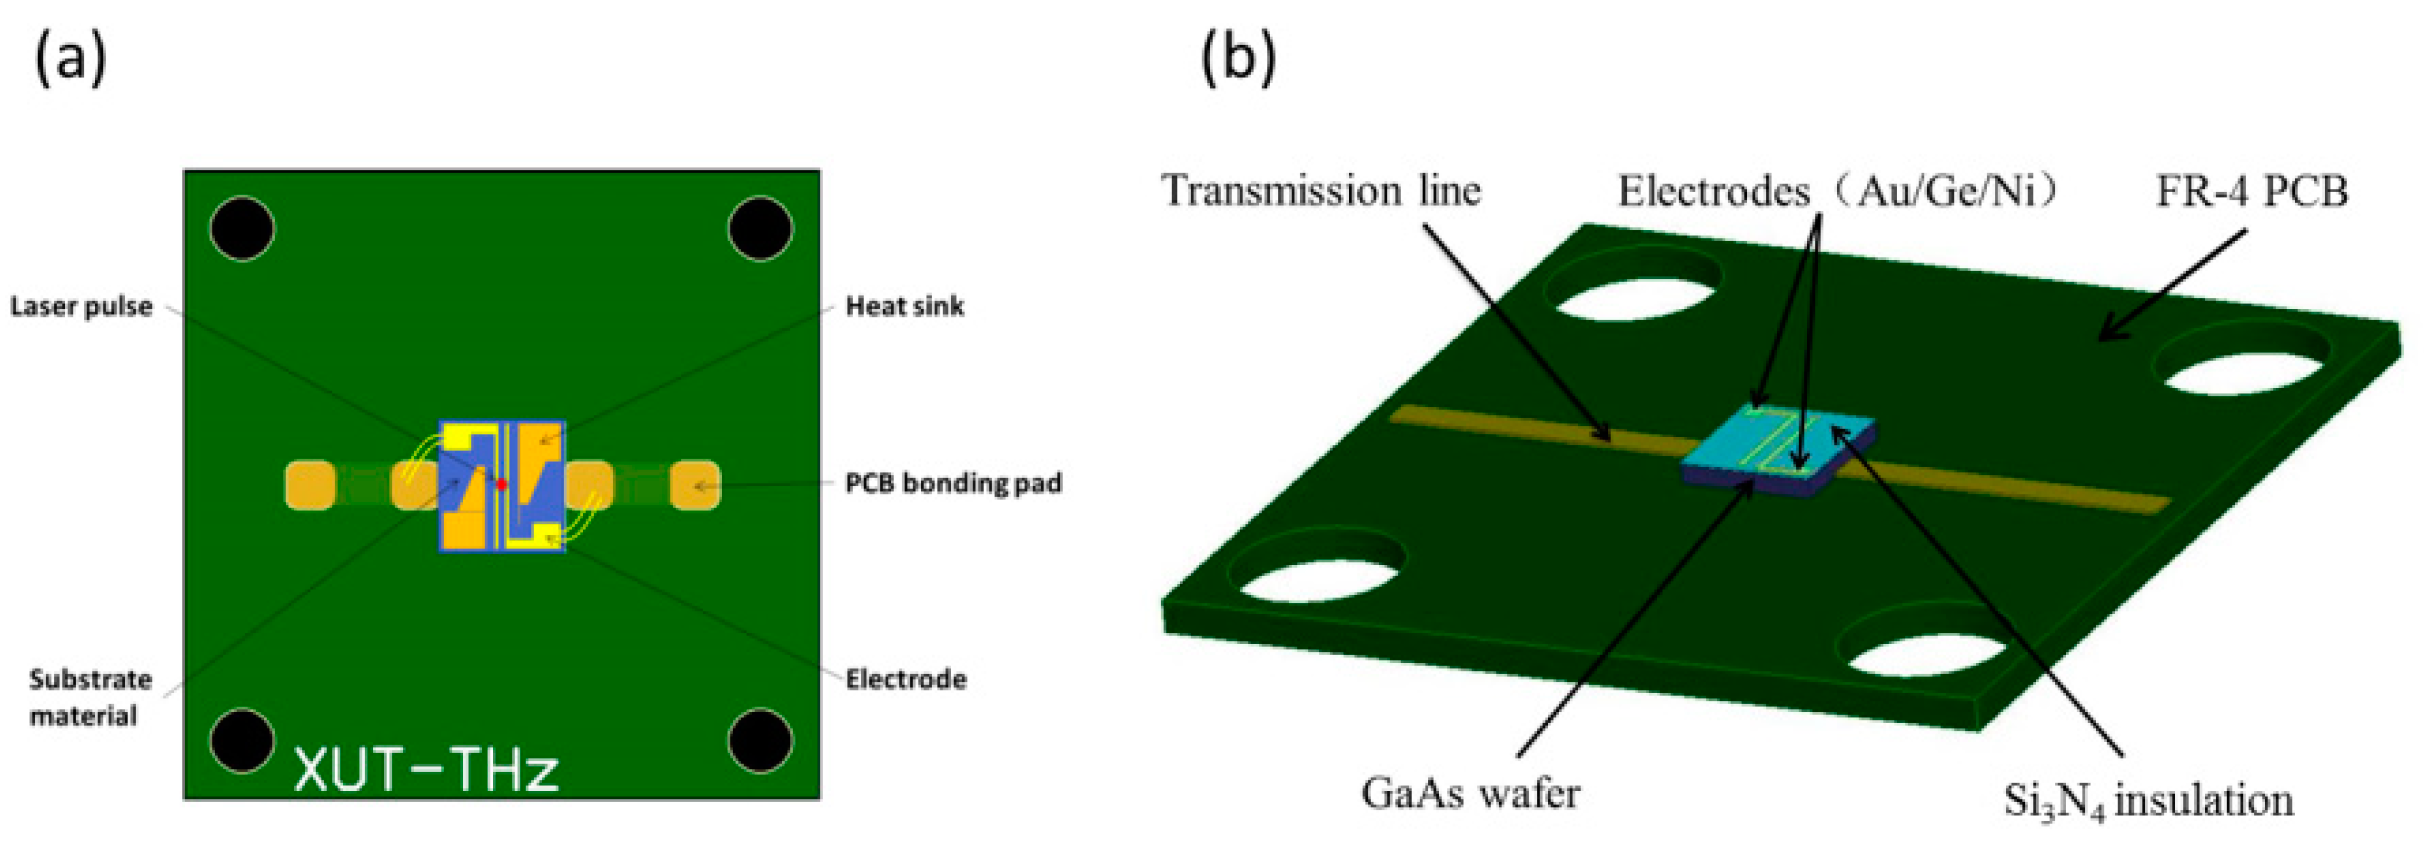
Figure 1. The structure schematic diagram of a SI-GaAs-based PCA in which the gap of the electrodes is 150 µm. (a) Top view of SI-GaAs PCA. (b) Side view of SI-GaAs PCA.
Applsci 10 00007 g001
Figure 2. The diagram of a THz-TDS with THz time-domain waveform and photocurrent detection.
Applsci 10 00007 g002
Figure 3. (a) THz-radiation pulses, which are generated by the SI-GaAs PCA, are detected using the THz-TDS. (b) The photocurrent generated by the SI-GaAs PCA is measured with a digital storage oscilloscope.
Applsci 10 00007 g003
Figure 4. (a) THz time-domain waveform electric field integral curve. (b) Comparison between the photocurrent of THz integral and the measured by oscilloscope for a bias voltage of 100 V.
Applsci 10 00007 g004
Figure 5. The mean value and standard deviation of conversion ratio k
Applsci 10 00007 g005
Figure 6. The carrier occupancy rate for the Γ valley when the Γ valley mobility is 6000   cm 2 / V s and 8000   cm 2 / V s , respectively.
Applsci 10 00007 g006
Figure 7. Fitted curve to the carrier occupancy rate for the Γ valley when the Γ valley mobility is 8000   cm 2 / V s .
Applsci 10 00007 g007
Figure 8. The carrier occupancy rate for the satellite valley (L valley) using the experiment fitted curve and Monte Carlo simulation.
Applsci 10 00007 g008
Figure 9. The average drifts velocity and differential mobility of photogenerated carrier using Monte Carlo simulation.
Applsci 10 00007 g009
Table 1. The calculated of photogenerated carrier transfer rate.
Biased Electric Field (kV/cm) Conversion   Ratio   ( k ) Γ   Valley   ( 6000   cm 2 / V s ) Γ   Valley   ( 8000   cm 2 / V s )
2.002.59 × 105~100%~100%
3.332.76 × 10592.73%93.04%
5.003.60 × 10566.93%68.30%
6.673.92 × 10560.04%61.74%
8.334.35 × 10552.25%54.28%
10.004.80 × 10545.46%47.98%
11.675.28 × 10539.83%42.43%
13.335.65 × 10536.06%38.83%