Quantitative Analysis of Melanosis Coli Colonic Mucosa Using Textural Patterns


Abstract
1. Introduction
2. Materials and Methods
2.1. Colonoscopy Database
- Cecem, image of the appendix and cecal mucosa (C), consisting of 181 images.
- Splenic flexure spleen images (S), consisting of 181 images.
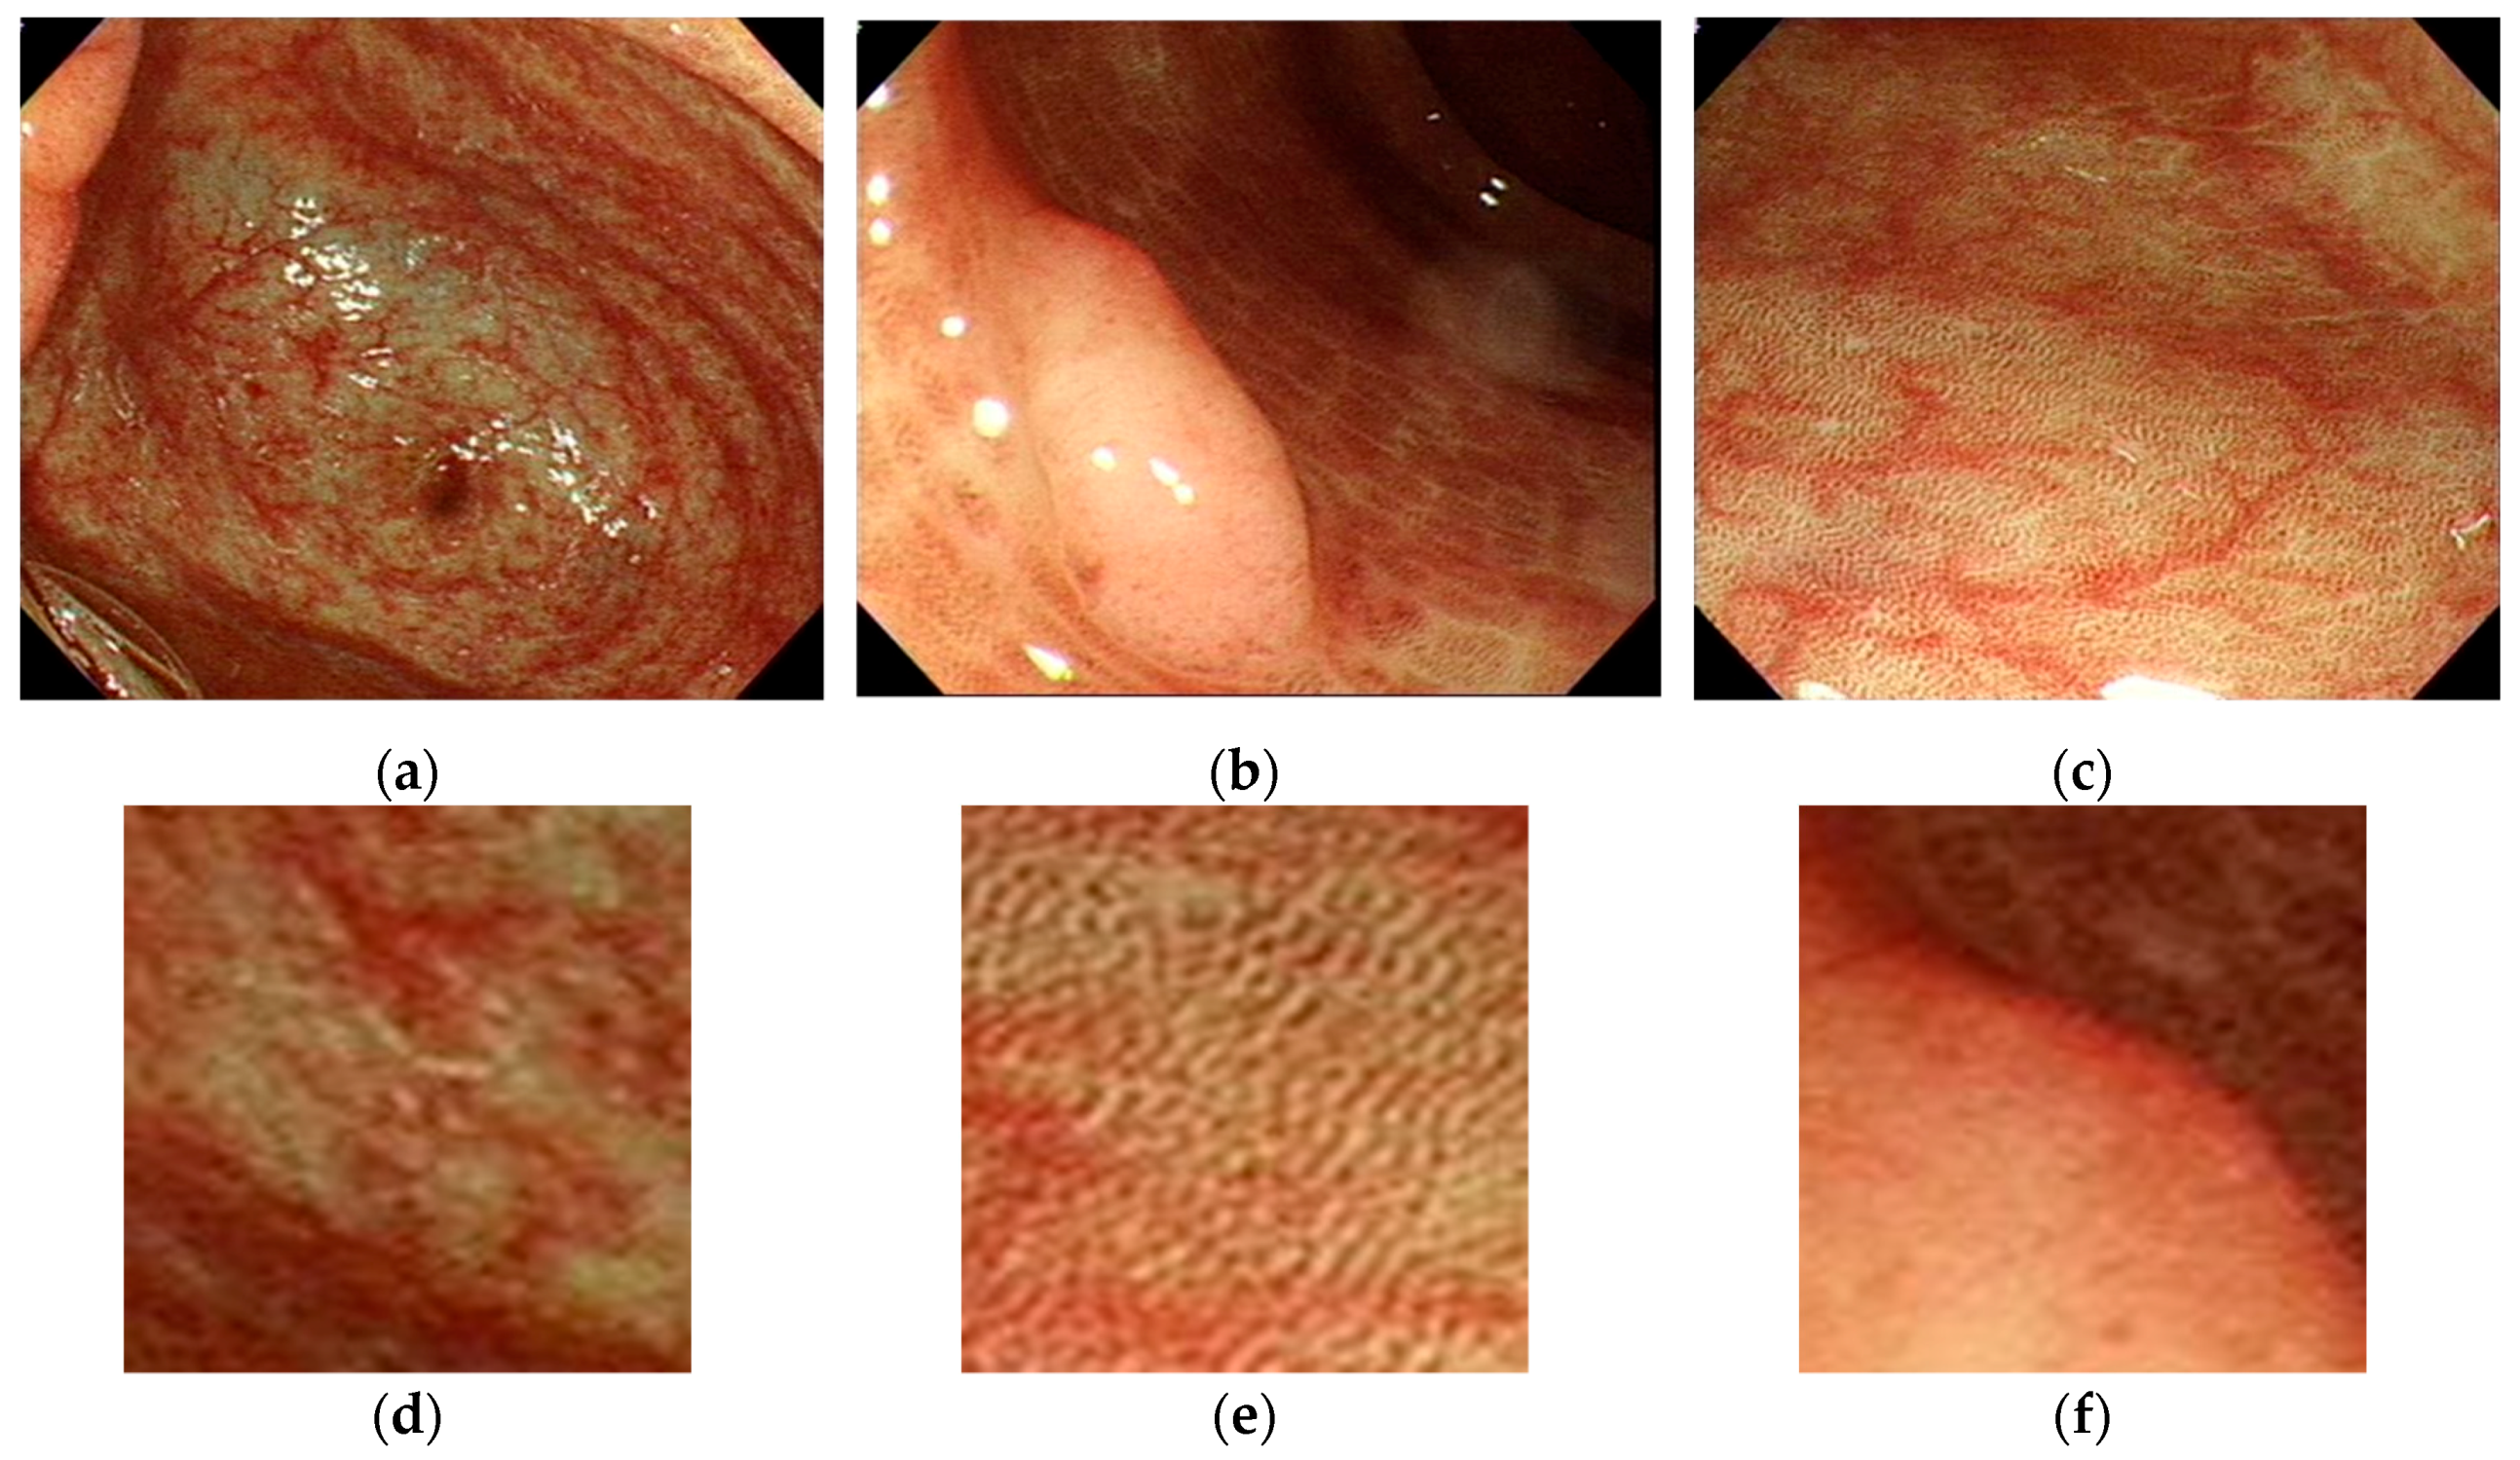
- Polyp (P), if the patient had a polyp or a tumor. If multiple polyps were present, we collected the largest and most prominent textured polyp. The gastroenterologist manually cut the image from central point of the polyp. This also resulted in 181 images. Figure 1a shows one melanosis coli patient’s cecal image and Figure 1b shows the same patient’s cecal image after stopping anthraquinone containing laxative agents for six months.
2.2. Image Texture Feature Analysis
3. Results
4. Discussion
5. Conclusions
Author Contributions
Funding
Acknowledgments
Conflicts of Interest
References
- Blackett, J.W.; Rosenberg, R.; Mahadev, S.; Green, P.H.R.; Lebwohl, B. Adenoma Detection is Increased in the Setting of Melanosis Coli. J. Clin. Gastroenterol. 2018, 52, 313–318. [Google Scholar] [CrossRef] [PubMed]
- Wang, S.; Wang, Z.; Peng, L.; Zhang, X.; Li, J.; Yang, Y.; Hu, B.; Ning, S.; Zhang, B.; Han, J.; et al. Gender, age, and concomitant diseases of melanosis coli in China: A multicenter study of 6,090 cases. PeerJ 2018, 6, e4483. [Google Scholar] [CrossRef] [PubMed]
- Cowley, K.; Jennings, H.W.; Passarella, M. Who Turned Out the Lights? An Impressive Case of Melanosis Coli. ACG Case Rep. J. 2015, 3, 13–14. [Google Scholar] [CrossRef] [PubMed]
- Zhou, X.; Wang, P.; Zhang, Y.J.; Xu, J.J.; Zhang, L.M.; Zhu, L.; Xu, L.P.; Liu, X.M.; Su, H.H. Comparative proteomic analysis of melanosis coli with colon cancer. Oncol. Rep. 2016, 36, 3700–3706. [Google Scholar] [CrossRef][Green Version]
- Yoshida, H.; Nappi, J.; MacEneaney, P.; Rubin, D.T.; Dachman, A.H. Computer-aided diagnosis scheme for detection of polyps at CT colonography. Radiographics 2002, 22, 963–979. [Google Scholar] [CrossRef]
- Karkanis, S.A.; Iakovidis, D.K.; Maroulis, D.E.; Karras, D.A.; Tzivras, M. Computer-aided tumor detection in endoscopic video using color wavelet features. IEEE Trans. Inf. Technol. Biomed. 2003, 7, 141–152. [Google Scholar] [CrossRef]
- Chang, C.C.; Chen, H.H.; Chang, Y.C.; Yang, M.Y.; Lo, C.M.; Ko, W.C.; Lee, Y.F.; Liu, K.L.; Chang, R.F. Computer-aided diagnosis of liver tumors on computed tomography images. Comput. Methods Programs Biomed. 2017, 145, 45–51. [Google Scholar] [CrossRef]
- Zauber, A.G.; Winawer, S.J.; O’Brien, M.J.; Lansdorp-Vogelaar, I.; van Ballegooijen, M.; Hankey, B.F.; Shi, W.; Bond, J.H.; Schapiro, M.; Panish, J.F.; et al. Colonoscopic polypectomy and long-term prevention of colorectal-cancer deaths. N. Engl. J. Med. 2012, 366, 687–696. [Google Scholar] [CrossRef]
- Walker, N.I.; Bennett, R.E.; Axelsen, R.A. Melanosis coli. A consequence of anthraquinone-induced apoptosis of colonic epithelial cells. Am. J. Pathol. 1988, 131, 465–476. [Google Scholar]
- Byers, R.J.; Marsh, P.; Parkinson, D.; Haboubi, N.Y. Melanosis coli is associated with an increase in colonic epithelial apoptosis and not with laxative use. Histopathology 1997, 30, 160–164. [Google Scholar] [CrossRef]
- Liu, Z.H.; Foo, D.C.C.; Law, W.L.; Chan, F.S.Y.; Fan, J.K.M.; Peng, J.S. Melanosis coli: Harmless pigmentation? A case-control retrospective study of 657 cases. PLoS ONE 2017, 12, e0186668. [Google Scholar] [CrossRef] [PubMed]
- Mellouki, I.; Meyiz, H. Melanosis coli: A rarity in digestive endoscopy. Pan Afr. Med. J. 2013, 16, 86. [Google Scholar] [CrossRef] [PubMed]
- Modi, R.M.; Hussan, H. Melanosis Coli After Long-Term Ingestion of Cape Aloe. ACG Case Rep. J. 2016, 3, e157. [Google Scholar] [CrossRef] [PubMed]
- The Paris endoscopic classification of superficial neoplastic lesions: Esophagus, stomach, and colon: November 30 to December 1, 2002. Gastrointest. Endosc. 2003, 58, S3–S43. [CrossRef]
- Biernacka-Wawrzonek, D.; Stepka, M.; Tomaszewska, A.; Ehrmann-Josko, A.; Chojnowska, N.; Zemlak, M.; Muszynski, J. Melanosis coli in patients with colon cancer. Prz. Gastroenterol. 2017, 12, 22–27. [Google Scholar] [CrossRef]
- Siegers, C.P.; von Hertzberg-Lottin, E.; Otte, M.; Schneider, B. Anthranoid laxative abuse-a risk for colorectal cancer? Gut 1993, 34, 1099–1101. [Google Scholar] [CrossRef]
- Chung-Ming Lo, P.-H.H.; Kevin Li-Chun, H. Computer-Aided Detection of Hyperacute Stroke Based on Relative Radiomic Patterns in Computed Tomography. Appl. Sci. 2019, 9, 1668. [Google Scholar] [CrossRef]
- Chang, R.F.; Lee, C.C.; Lo, C.M. Quantitative diagnosis of rotator cuff tears based on sonographic pattern recognition. PLoS ONE 2019, 14, e0212741. [Google Scholar] [CrossRef]
- Haralick, R.; Shanmugam, K.; Dinstein, I. Textural Features for Image Classification. IEEE Trans. Syst. Man Cybern. 1973, 3, 610–621. [Google Scholar] [CrossRef]
- Haralick, R. Statistical and structural approaches to texture. Proc. IEEE 1979, 67, 786–804. [Google Scholar] [CrossRef]
- Vadakkenveettil, B.S.; Unnikrishnan, A.; Balakrishnan, K. Grey Level Co-Occurrence Matrices: Generalisation and Some New Features. Int. J. Comput. Sci. Eng. Inf. Technol. 2012, 2, 151–157. [Google Scholar] [CrossRef]
- Alvarenga, A.V.; Pereira, W.C.; Infantosi, A.F.; Azevedo, C.M. Complexity curve and grey level co-occurrence matrix in the texture evaluation of breast tumor on ultrasound images. Med. Phys. 2007, 34, 379–387. [Google Scholar] [CrossRef] [PubMed]
- Rahebi, J.; Hardalac, F. Retinal blood vessel segmentation with neural network by using gray-level co-occurrence matrix-based features. J. Med. Syst. 2014, 38, 85. [Google Scholar] [CrossRef] [PubMed]
- Summers, R.M. Challenges for computer-aided diagnosis for CT colonography. Abdom Imaging 2002, 27, 268–274. [Google Scholar] [CrossRef] [PubMed]
- Stefanescu, D.; Streba, C.; Cartana, E.T.; Saftoiu, A.; Gruionu, G.; Gruionu, L.G. Computer Aided Diagnosis for Confocal Laser Endomicroscopy in Advanced Colorectal Adenocarcinoma. PLoS ONE 2016, 11, e0154863. [Google Scholar] [CrossRef] [PubMed]
- Dik, V.K.; Moons, L.M.; Siersema, P.D. Endoscopic innovations to increase the adenoma detection rate during colonoscopy. World J. Gastroenterol. 2014, 20, 2200–2211. [Google Scholar] [CrossRef] [PubMed]
- Tezuka, F.; Chiba, R.; Iwama, N.; Takahashi, T. Development of the human colonic adenocarcinoma from adenoma as a histopathologically continuous process. Tohoku J. Exp. Med. 1992, 168, 257–263. [Google Scholar] [CrossRef][Green Version]
- Kundu, A.K.; Fattah, S.A.; Rizve, M.N. An Automatic Bleeding Frame and Region Detection Scheme for Wireless Capsule Endoscopy Videos Based on Interplane Intensity Variation Profile in Normalized RGB Color Space. J. Healthc. Eng. 2018, 2018, 9423062. [Google Scholar] [CrossRef]
- Sun, X.; Dong, T.; Bi, Y.; Min, M.; Shen, W.; Xu, Y.; Liu, Y. Linked color imaging application for improving the endoscopic diagnosis accuracy: A pilot study. Sci. Rep. 2016, 6, 33473. [Google Scholar] [CrossRef]


| Correlation (Number = 181) | Correlation-M | Correlation | Dissimilarity | Energy | |
|---|---|---|---|---|---|
| CEAs | Pearson | 0.094 | 0.094 | −0.073 | 0.001 |
| Two-tailed significance | 0.210 | 0.210 | 0.331 | 0.991 | |
| Correlation (number = 181) | Entropy | Homogeneity-M | Homogeneity | - | |
| CEAs | Pearson | −0.068 | 0.088 | 0.087 | |
| Two-tailed significance | 0.361 | 0.237 | 0.244 | ||
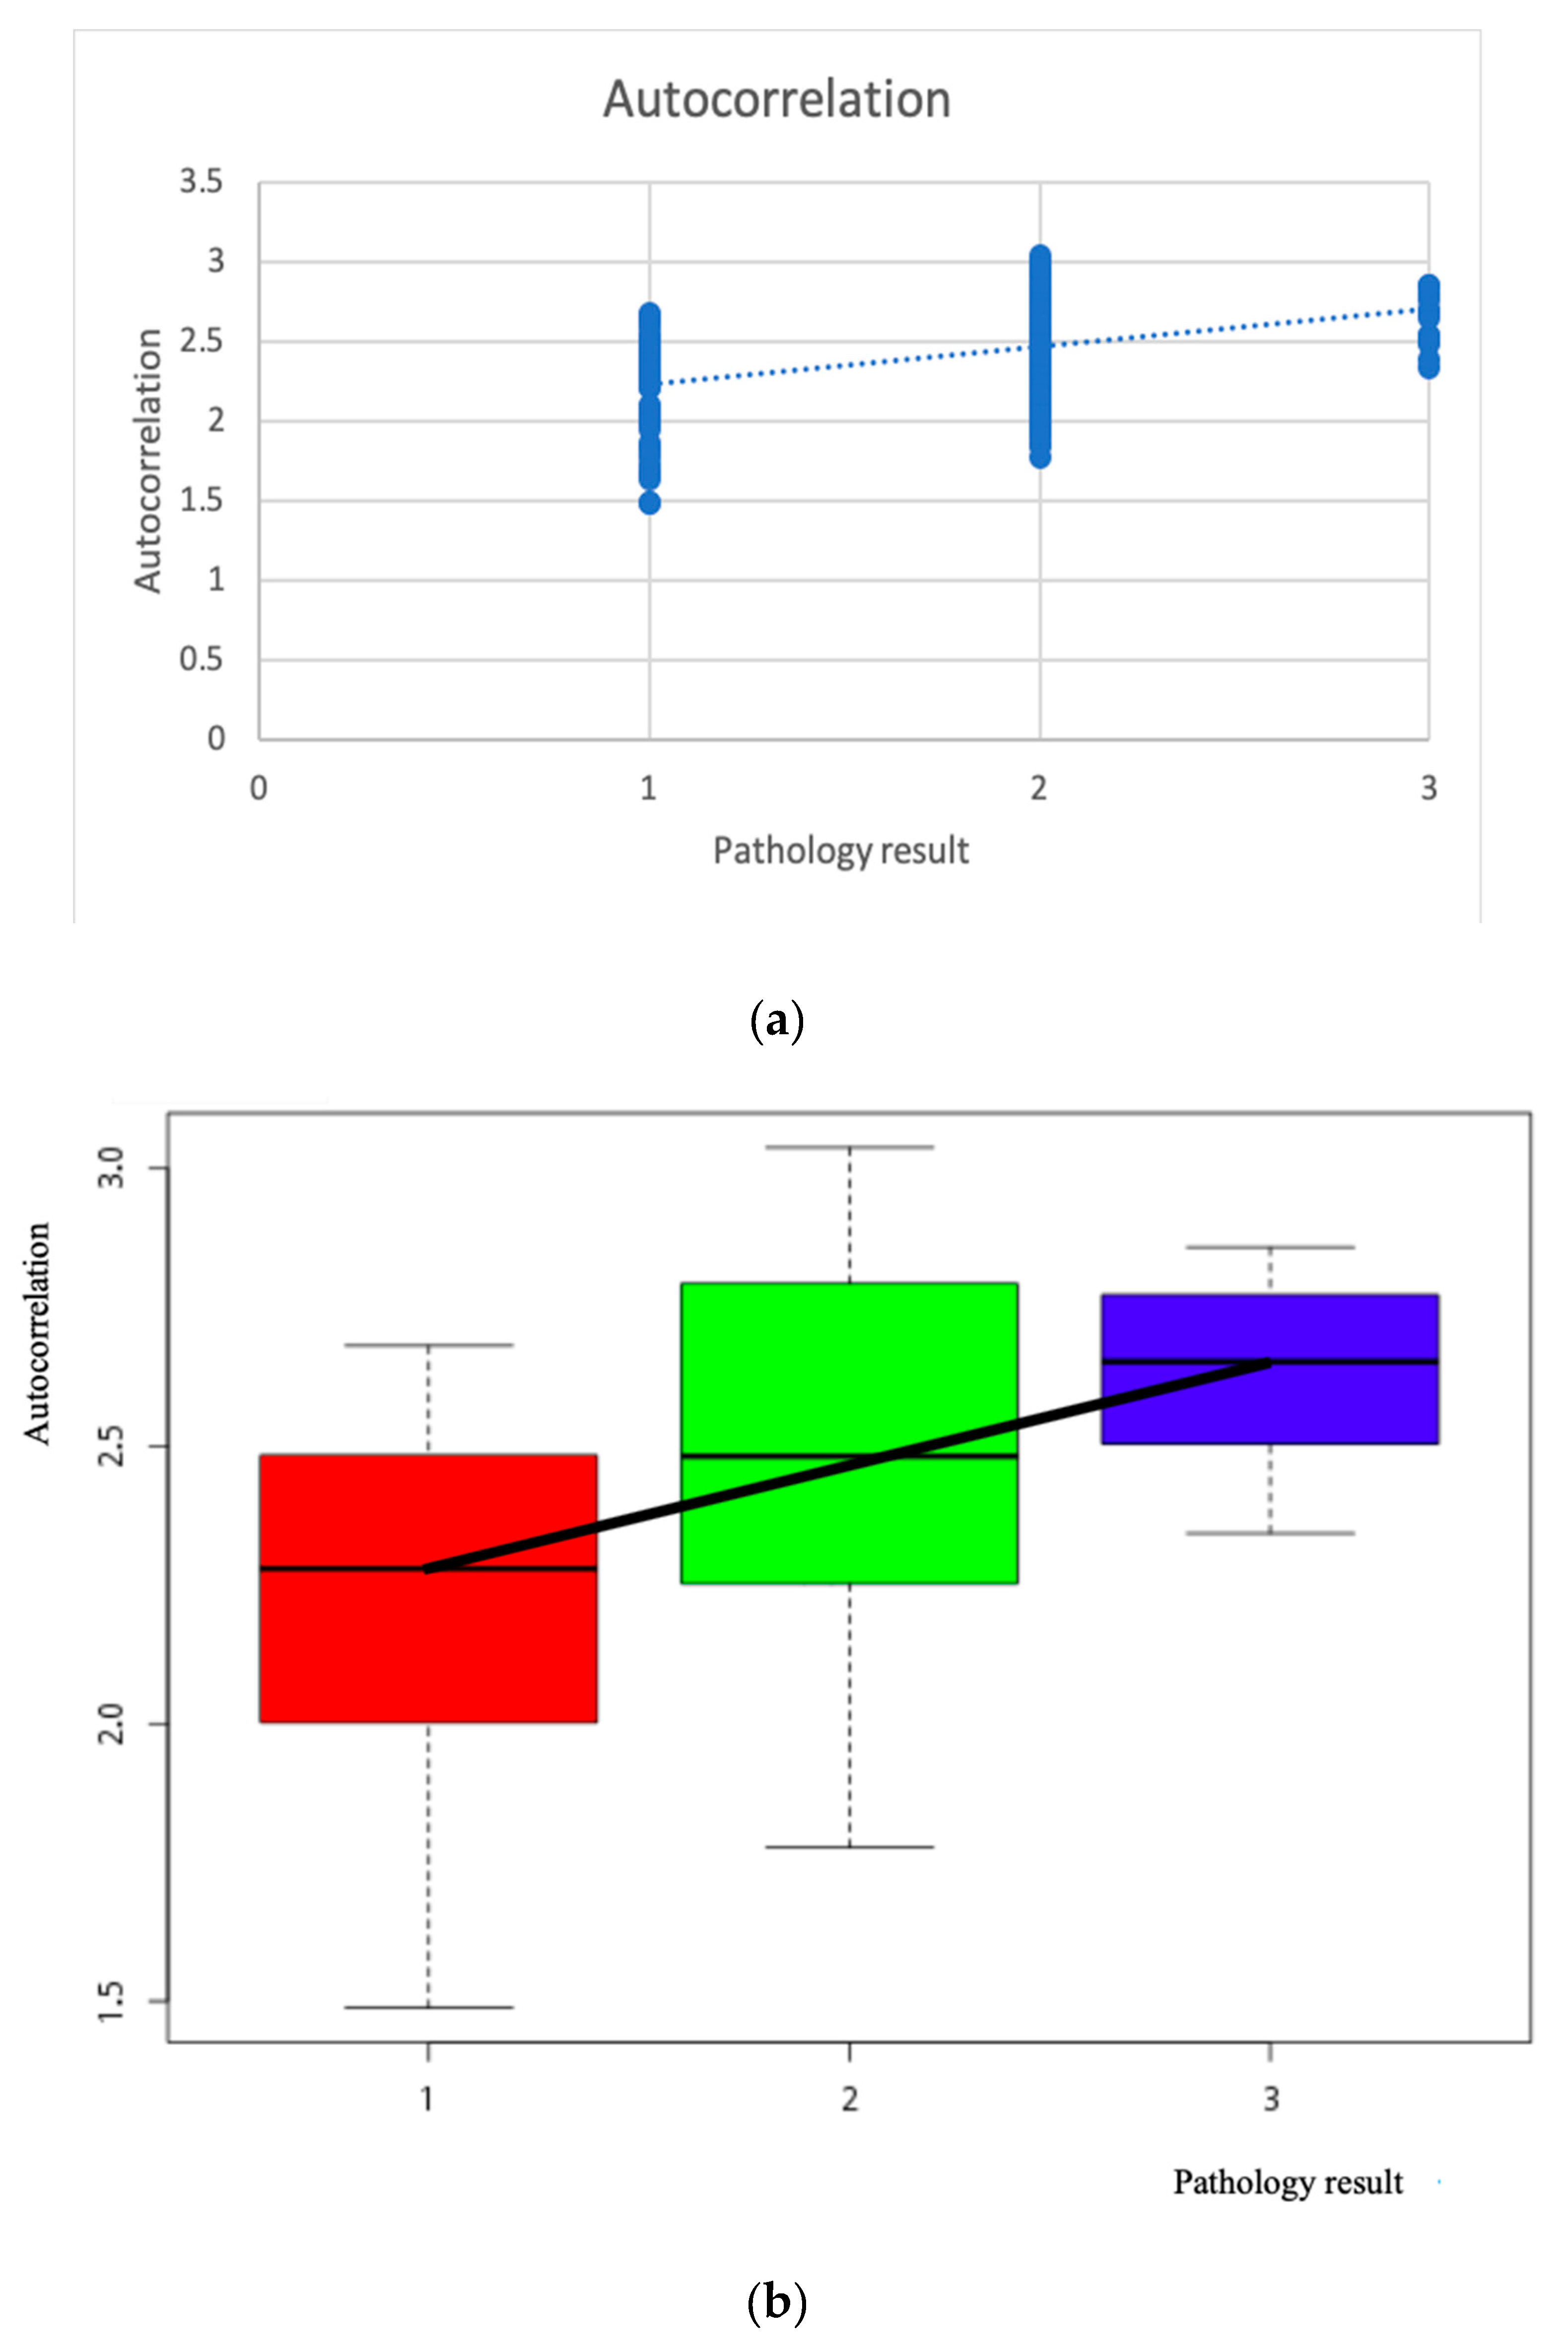
| Correlation | Autocorrelation | |
|---|---|---|
| Polyp pathological grade (1–3) | Pearson correlation | 0.390 |
| Two-tailed significance | p < 0.001 | |
| Number | 181 | |
| Correlation | Cluster_Prominence | |
|---|---|---|
| Polyp pathological grade (1–3) | Pearson correlation | 0.398 |
| Two-tailed significance | p < 0.001 | |
| Number | 181 | |
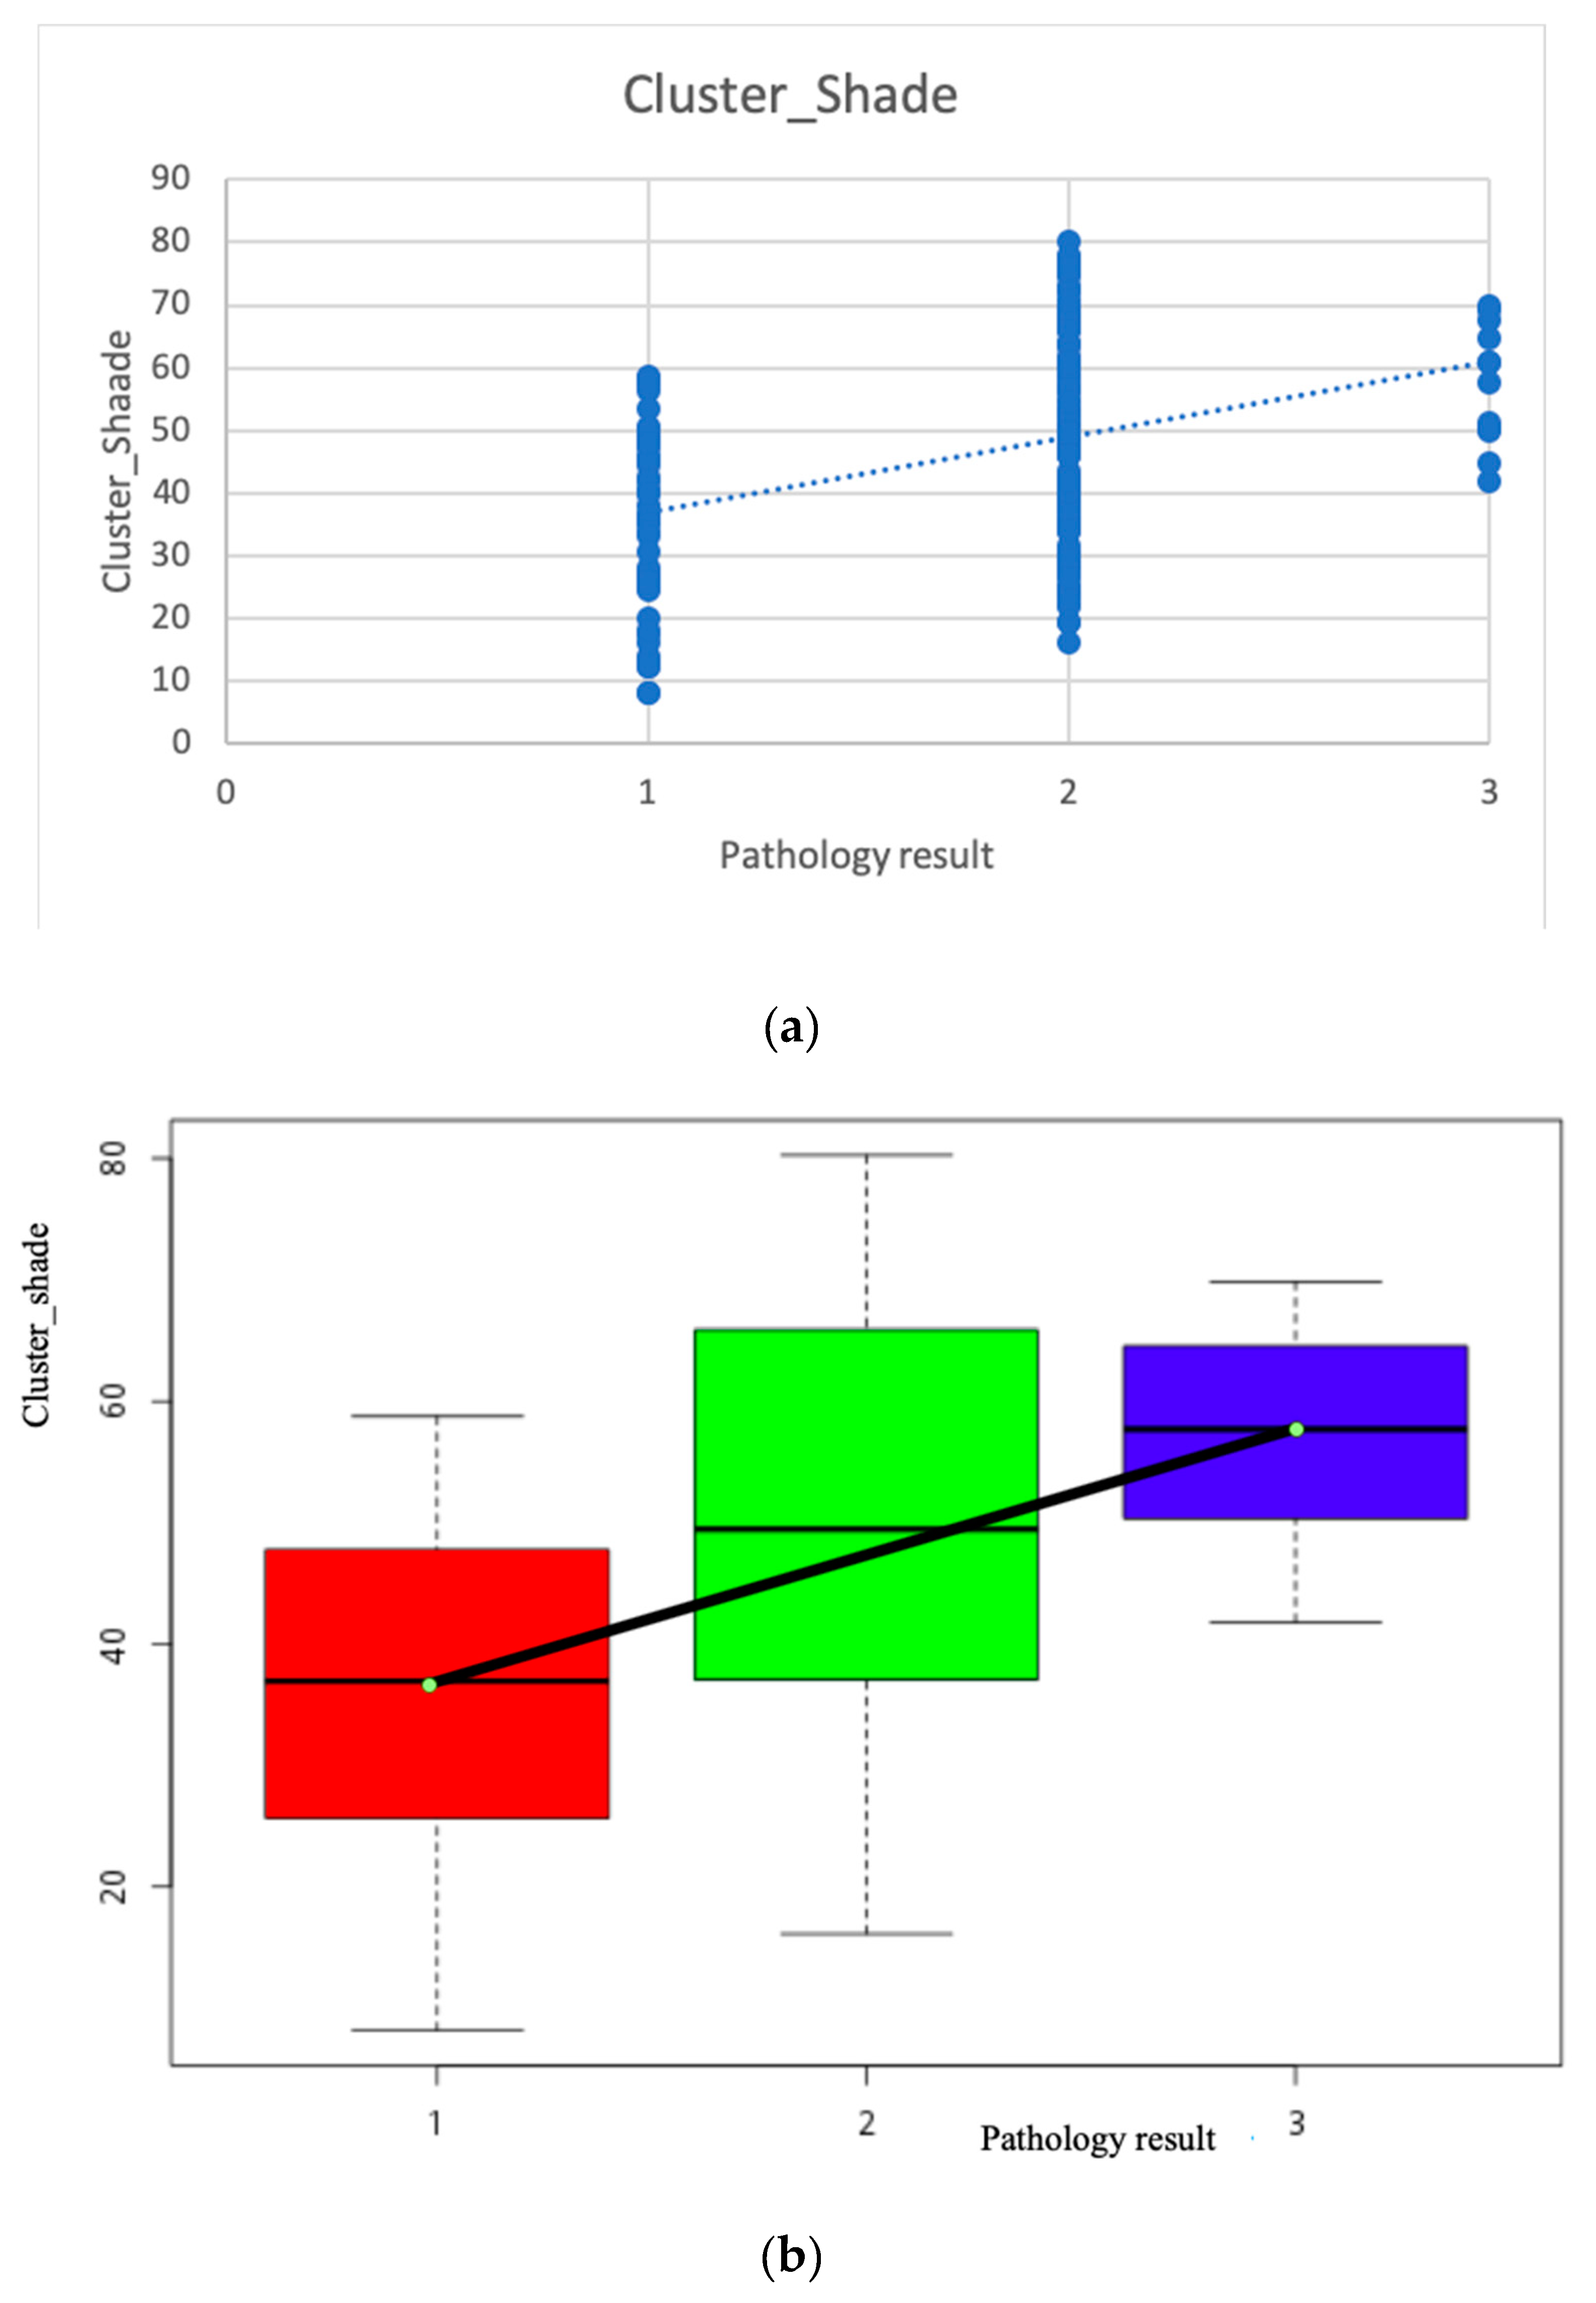
| Correlation | Cluster_Shade | |
|---|---|---|
| Polyp pathological grade (1–3) | Pearson correlation | 0.396 |
| Two-tailed significance | 0.000, p < 0.05 | |
| Number | 181 | |
| Correlation Number = 181 | Autocorrelation | Cluster_Prominence | Cluster_Shade | |
|---|---|---|---|---|
| Polyp pathological grade (1–3) | Pearson correlation | 0.390 | 0.398 | 0.396 |
| Two-tailed significance | p < 0.001 | p < 0.001 | p < 0.001 | |
| Correlation Number = 181 | Contrast | CorrelationM | Correlation | Difference_Variance | |
|---|---|---|---|---|---|
| Polyps pathological grade (1–3) | Pearson correlation | 0.266 | 0.235 | 0.235 | 0.266 |
| Two-tailed significance | p < 0.001 | p = 0.001 | p = 0.001 | p < 0.001 | |
© 2020 by the authors. Licensee MDPI, Basel, Switzerland. This article is an open access article distributed under the terms and conditions of the Creative Commons Attribution (CC BY) license (http://creativecommons.org/licenses/by/4.0/).
Share and Cite
Lo, C.-M.; Chen, C.-C.; Yeh, Y.-H.; Chang, C.-C.; Yeh, H.-J. Quantitative Analysis of Melanosis Coli Colonic Mucosa Using Textural Patterns. Appl. Sci. 2020, 10, 404. https://doi.org/10.3390/app10010404
Lo C-M, Chen C-C, Yeh Y-H, Chang C-C, Yeh H-J. Quantitative Analysis of Melanosis Coli Colonic Mucosa Using Textural Patterns. Applied Sciences. 2020; 10(1):404. https://doi.org/10.3390/app10010404
Chicago/Turabian StyleLo, Chung-Ming, Chun-Chang Chen, Yu-Hsuan Yeh, Chun-Chao Chang, and Hsing-Jung Yeh. 2020. "Quantitative Analysis of Melanosis Coli Colonic Mucosa Using Textural Patterns" Applied Sciences 10, no. 1: 404. https://doi.org/10.3390/app10010404
APA StyleLo, C.-M., Chen, C.-C., Yeh, Y.-H., Chang, C.-C., & Yeh, H.-J. (2020). Quantitative Analysis of Melanosis Coli Colonic Mucosa Using Textural Patterns. Applied Sciences, 10(1), 404. https://doi.org/10.3390/app10010404