1. Introduction
As the demands for high-speed and large bandwidth information processing are increasing, electro-optic (EO) devices such as modulators, sensors, deflectors, multipliers, switches, and spatial light modulators, which are developed using EO effect, are gaining important applications in data processing and signal transmission [
1,
2,
3,
4,
5,
6]. EO coefficients are quantitative parameters of the EO effect, their accurate measurements are the key for designing these EO devices, and a study on the dispersion of the EO coefficients is of great significance for designing the EO devices that are suitable for wide spectrum applications [
7,
8,
9,
10]. Furthermore, the accurate measurements of the EO coefficients and their dispersion are also very significant to develop new EO materials [
11,
12].
There are many measurement methods of the EO coefficients to be explored, such as Mach–Zehnder, Michelson, and Fabry-Perot interference methods for phase measurement, as well as half-wave voltage and Senarmont polarimetric methods for phase retardation measurement. Both the Mach–Zehnder and Michelson interference methods require a construction of a detection and reference beam [
13,
14]. The EO sample is inserted into the detection beam path, and the phase induced by applying a voltage is measured by comparing the interference fringes between the detection beam and the reference beam. The accuracy of the measurement is limited by environmental stability. The Fabry–Perot interference method helps to obtain a high measurement sensitivity via multiple reflection interferences of incident light in the EO sample [
15]. Half-wave voltage and Senarmont polarimetric methods determine the EO coefficients by measuring the phase retardation between two orthogonally polarized components that pass through the sample, and the intensity of light at the extreme value must be determined [
16,
17]. However, the variations of light intensity around the extreme value are small, but the fluctuations are evident in the light source intensity; the accuracy and sensitivity of the two methods are limited. Thus, none of the above methods are suitable for studying the dispersion of the EO coefficients for a wide wavelength range coverage. Further, all the aforementioned methods are time-consuming, generally in the order of minutes. Although N. Shota, M. Izdebski, and S. H. Lee et al. have done significant work on improving the measurement method of the EO coefficients, it is still necessary to study a new method for fast, highly accurate, and sensitive measurements of the dispersion of the EO coefficients [
11,
12,
18].
Photoelastic modulation has aroused great interests in applications in optical rotation measurement, circular dichroism measurement, and polarimetry [
19,
20,
21,
22]. A photoelastic modulator (PEM) is a dynamic retarder with variable retardation based on the photoelastic effect, whereby the piezoelectric actuator excites and maintains the mechanical vibration in the photoelastic crystal when a sinusoidal driving voltage is applied, which typically forms a stress standing wave and results in a periodic variation of birefringence, and thus the phase and polarization states of the incident light are modulated by the temporal modulation birefringence [
23]. The photoelastic modulation has a large modulation frequency, high modulation efficiency, and satisfactory modulation stability. Considering these excellent polarization modulation properties, we have realized a high-speed, accurate, and sensitive measurement for the EO coefficients by using a PEM in our previous work [
24]. This paper focuses on the study of the dispersion of the EO coefficients in a wide wavelength range based on the photoelastic modulation. A PEM and an automatic scanning monochromator are applied to build a simple spectroscopic polarimetry for determining the EO coefficients, and the PEM control and the data processing were based on a field programmable gate array (FPGA). Thus, a novel measurement method for the dispersion of the EO coefficients is developed.
2. Measurement Principle
EO effect is an intrinsic property of EO materials, where variations in the refractive index of the materials occur under an external electric field. When a light passes through, the light is decomposed into two polarization components along the refractive index principal axes, and thereby inducing phases. It is also the fundamental principle of the application of the EO effect. The difference of the phases between the two polarization components is generally recorded as phase retardation , where is the EO coefficient, is the wavelength of the incident light, and is the voltage of the external electric field. Therefore, the EO coefficients can be obtained by measuring the phase retardation of the EO sample, when the wavelength of the incident light and the electric field voltage are known. This gives a good inspiration to determine the EO coefficients and study their dispersion.
A fast, highly precise, and sensitive spectroscopic polarimetry for dispersion measurement of the EO coefficients through measuring the phase retardation
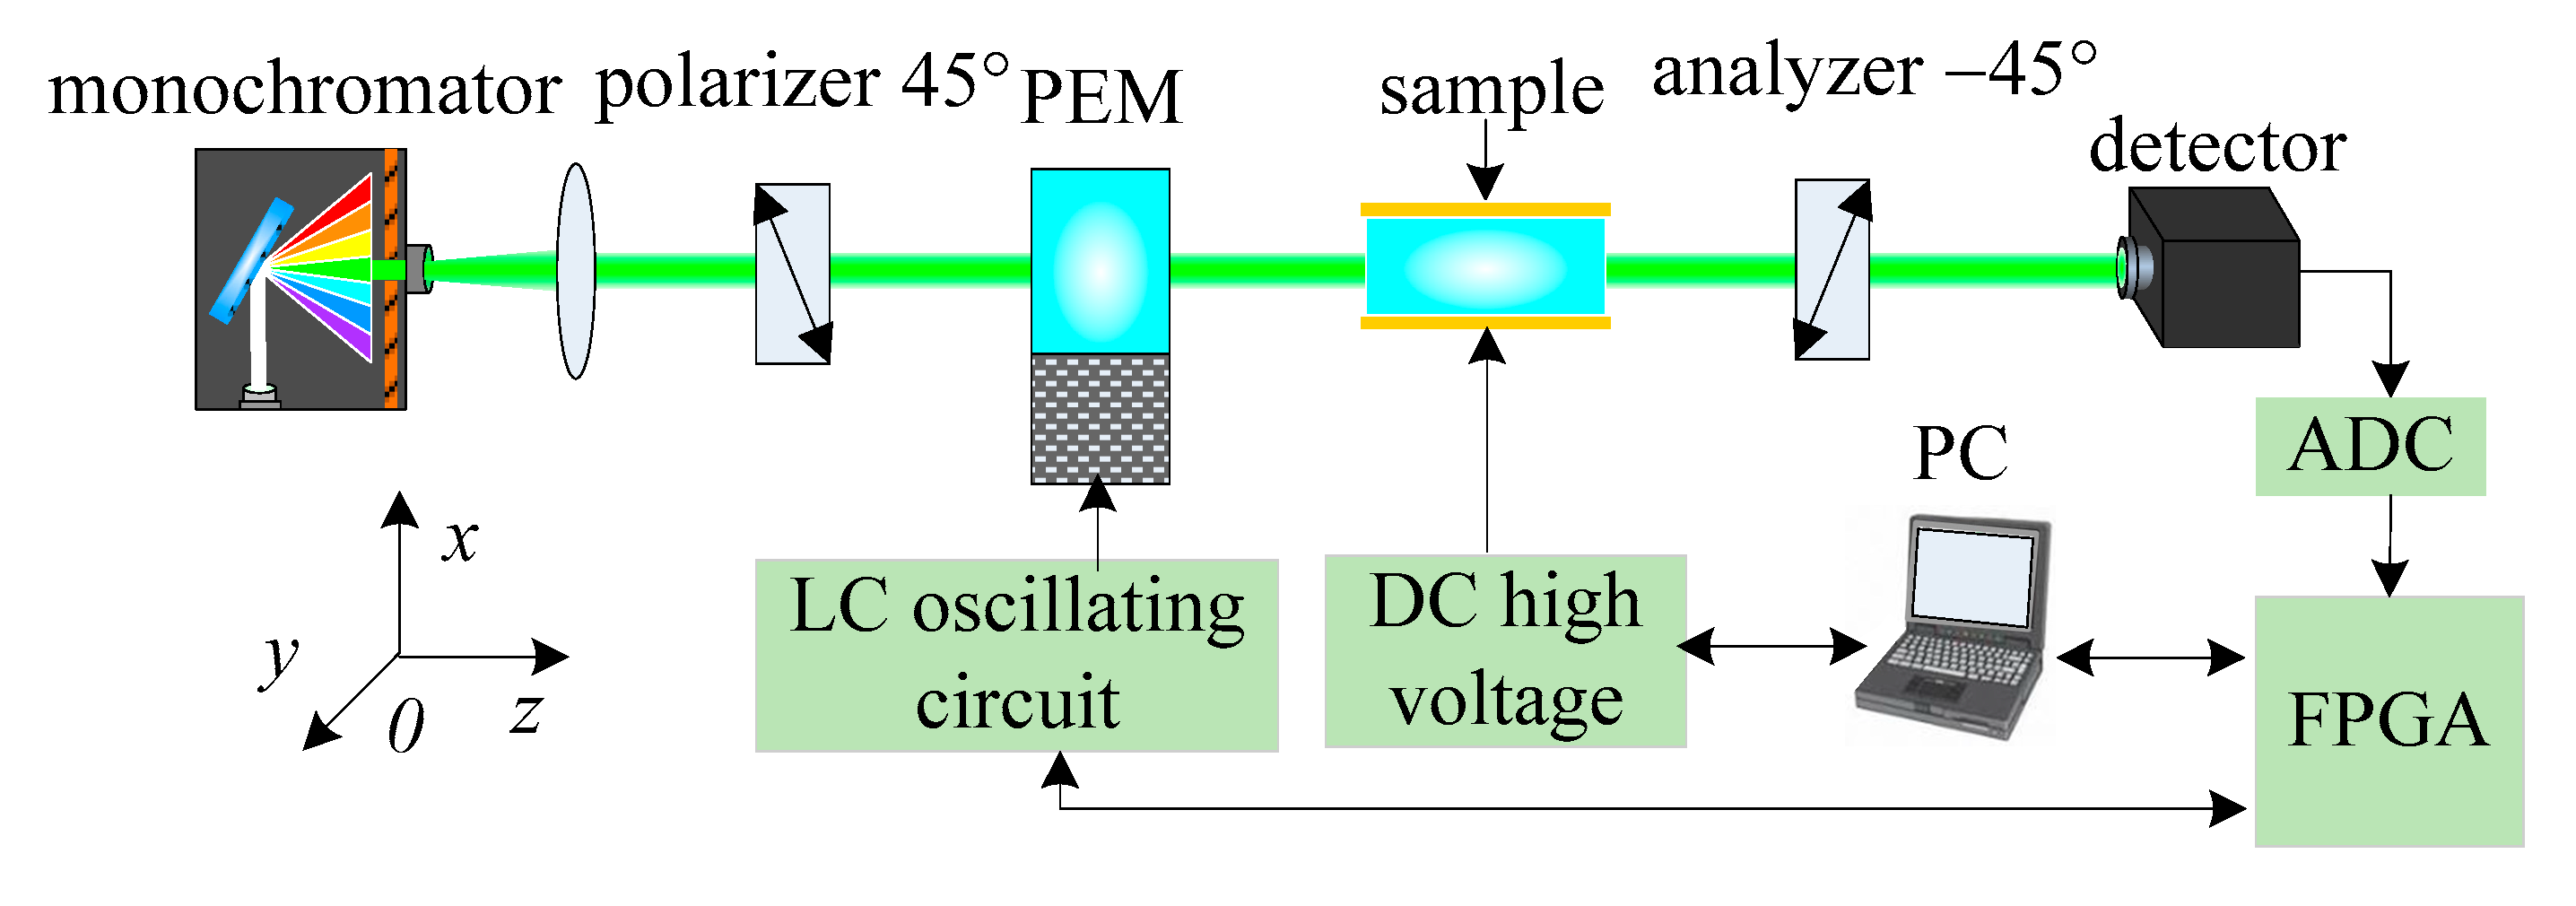
can be conducted using the advantages of photoelastic modulation, as shown in the schematic diagram of the experimental setup (
Figure 1). The detection light passes through a 45° polarizer and enters the PEM. The modulation axis of PEM is set to 0° direction. The polarization axes of the polarizer and analyzer are arranged at 45° and −45°, respectively, relative to the modulation axis direction of the PEM. As the PEM is working, the polarization of the incident light is temporally modulated. Subsequently, the phase retardation induced by the EO sample under the external electric field is loaded into the photoelastic modulation polarization signals, and the signals finally pass through the analyzer to be detected. The monochromator automatically scans the wavelength of the light source to change the incident light to quasi-monochromatic light. The phase retardations of the EO sample at different wavelengths are measured and the spectral dispersions of the EO coefficients are further studied.
As shown in
Figure 1, neglecting the loss of the detected light in the propagation process, the emitted light from the analyzer can be expressed using Stokes parameters as follows [
25].
where the polarization transmission characteristics of the analyzer, PEM, and EO sample can be described using the Muller matrices
,
, and
, respectively. The Stokes vectors of the incident light can be described as
after passing through the polarizer at the 45° direction, where
represents the total light intensity. The temporal photoelastic modulation is expressed as
, where
is the modulation phase retardation amplitude of the PEM, and
is the work frequency. All the Muller matrices and the Stokes vectors of the incident light are substituted in Equation (1), according to reference [
20] and considering that the detector can only detect the first component of Stokes vector, the light intensity detected by the detector can be expressed as:
In the measurement system, a FPGA is applied to generate the driving signal of the PEM, then the signal is amplified via the LC oscillating circuit to drive the PEM to work. Meanwhile, the sampling frequency of the analog-to-digital converter (ADC) is controlled via the FPGA. The digital signal sequence is obtained and input in the FPGA, and the data processing is also completed in the FPGA. According to references [
24,
26], the DC and harmonics terms are extracted by employing the digital phase-locked technology. The first and second harmonics terms
and
are used to calculate the ratio. Finally, the phase retardation of the EO sample can be concluded as follows.
From the measured phase retardation, the EO coefficients can be further estimated once the geometric size parameters of the EO sample, the wavelength of the incident light, and the value of the external electric field voltage are known.
3. Experiment
Lithium niobate (LiNbO
3, LN) crystals have excellent performances, which include large electro-optic (EO) coefficients, simple production of large crystal, good processability, excellent work stability, and relatively low cost. LN is one of the most widely used EO materials for storage, processing, and transmission of information [
27]. There have been many reports on the measurement of the EO coefficients of LN; however, the results of each method are moderately different. Therefore, an efficient and accurate measurement method for the EO coefficients and a study on its spectral dispersion are crucial for the development of the EO devices for wide spectral applications. To verify the feasibility of this method, a Y-cut type LN plate is selected as the sample, and the dispersion of the EO coefficient
is studied. Under the external electric field applied along the Y axis, the two principal axes of the refractive index, the crystal X axis and Y axis, are not rotated, but a change in their values occurs. When the incident light passes through the sample, the phase retardation of the polarization components along the components of the two refractive index principal axes is as follows:
where
is the wavelength of the incident light in vacuum,
is the refractive index of the ordinary light before applying the external electric field,
and
are the lengths of the LN plate in the direction of Y axis and Z axis, respectively, and
is the DC voltage applied to the LN plate. Combining Equations (3) and (4), the EO coefficient at each wavelength can be further calculated as follows:
To conduct an experimental research under this scheme, a dispersion measurement system for the EO coefficients was built according to the schematic shown in
Figure 1. The light source is a grating monochromator (Omni-λ200i, Zolix Instruments Co., Ltd., Beijing, China) equipped with a Xenon lamp source. The monochromator can achieve automatic scanning with flexible adjustment of wavelength step, with a full width at half maximum of spectrum of less than 1 nm. The polarizer and the analyzer were both Glan–Taylor calcite polarizers with an extinction ratio exceeding 10
5:1. The PEM was a symmetrical octagonal structure fused quartz PEM constructed by us, and its resonant frequency is 50.269 kHz. The detector is a Si avalanche photodetectors (APD410A, Thorlabs Inc., Newton, NJ, USA). An Altera EP3C FPGA was used to provide the driving signal of the PEM and to control the clock frequency of a fast and high-precision 12-bit ADC. The digital signal processing was also completed in the FPGA. By Compiling the Labview program in a computer and establishing communication with the FPGA, the PEM frequency can be adjusted, the driving sinusoidal voltage amplitude can be adjusted through computer visual input, the modulation phase retardation amplitude of the PEM can be adjusted, and the phase-locked data completed by the FPGA can be retrieved. The EO sample was a Y-cut LN crystal plate, with plate size (
Lx,
Ly,
Lz) of 11.20 mm × 7.66 mm × 17.00 mm. The incident light passed through the Z direction (optical axis) of the EO sample, and the electric field was applied in the Y direction.
To obtain the EO coefficients, the amplitude of modulation phase retardation
A0 of the PEM must be first calibrated at each wavelength. From the calibration method we previously reported [
23], the modulation phase retardation can be described as
, where
is the dispersion term described as
,
K is a simplification coefficient representing the driving efficiency of the PEM, and
is the amplitude of the driving voltage. The refractive index
of the photoelastic crystal depends on the selected crystal material that can be expressed using the Sellmeier formula. The photoelastic crystal of the PEM used in this current study was fused silica, whose dispersion characteristics can be described as
[
28].
Firstly, the LN plate sample to be measured is not put in, and the output wavelength of the monochrometer was set to 0.633 µm as a quasi-monochrome light to be incident. By applying different driving voltages to the PEM, the term
can be calibrated by measuring the phase retardation amplitude of the PEM. From references [
23,
26], we have already known that the harmonic components are proportional to the light intensity and the Bessel function. By using the ratio of the fourth harmonic term to the second harmonic term
, the amplitude
A0 can be precisely calibrated [
24]. The driving voltage
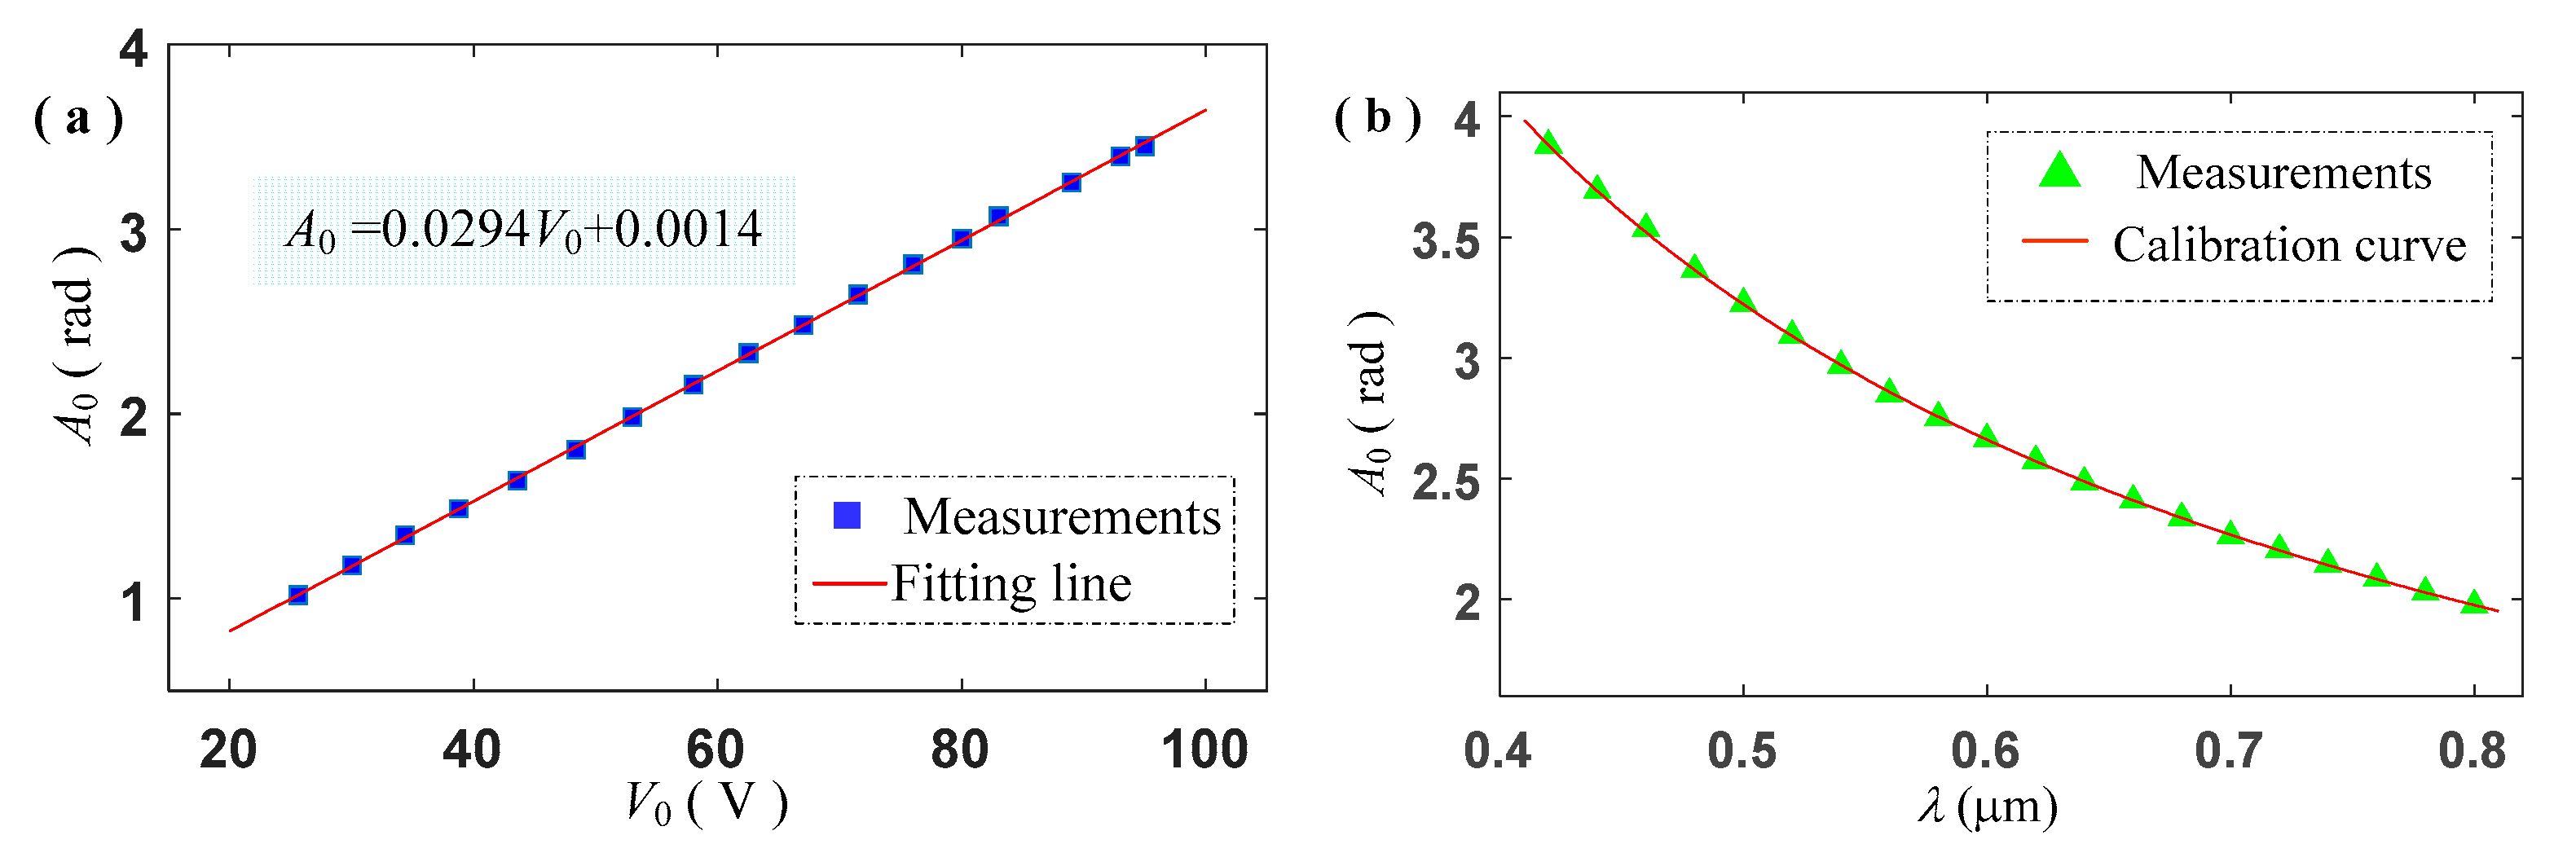
V0 was selected from 25 V to 95 V, and the phase retardation amplitude of the PEM
A0 was measured in approximately 5 V steps; the relationship between
A0 and
V0 are shown in
Figure 2a.
From the relationship between
A0 and
V0, which is
, as shown in
Figure 2a, we obtained the term
as
. The coefficient
can be solved by eliminating the dispersion term
. Therefore, the dispersion of phase retardation amplitude of the PEM at different wavelengths can be solved by combining the dispersion and driving terms,
. The amplitude of the driving voltage was set to 85 V, and the dispersion of
A0 at different wavelengths was obtained by letting the monochrometer scan from 0.42 to 0.8 µm with a step of 20 nm. The calibration and measurement of the phase retardation amplitude of the PEM are shown in
Figure 2b. The calibration results show that the maximal deviation between the calibration values and the measurement values is
when the wavelength of the incident light is 0.7 µm. The maximal deviation that corresponds to the relative deviation is
, which indicates the calibration values for the phase retardation amplitude of the PEM at various wavelengths are in good agreement with the measurement values.
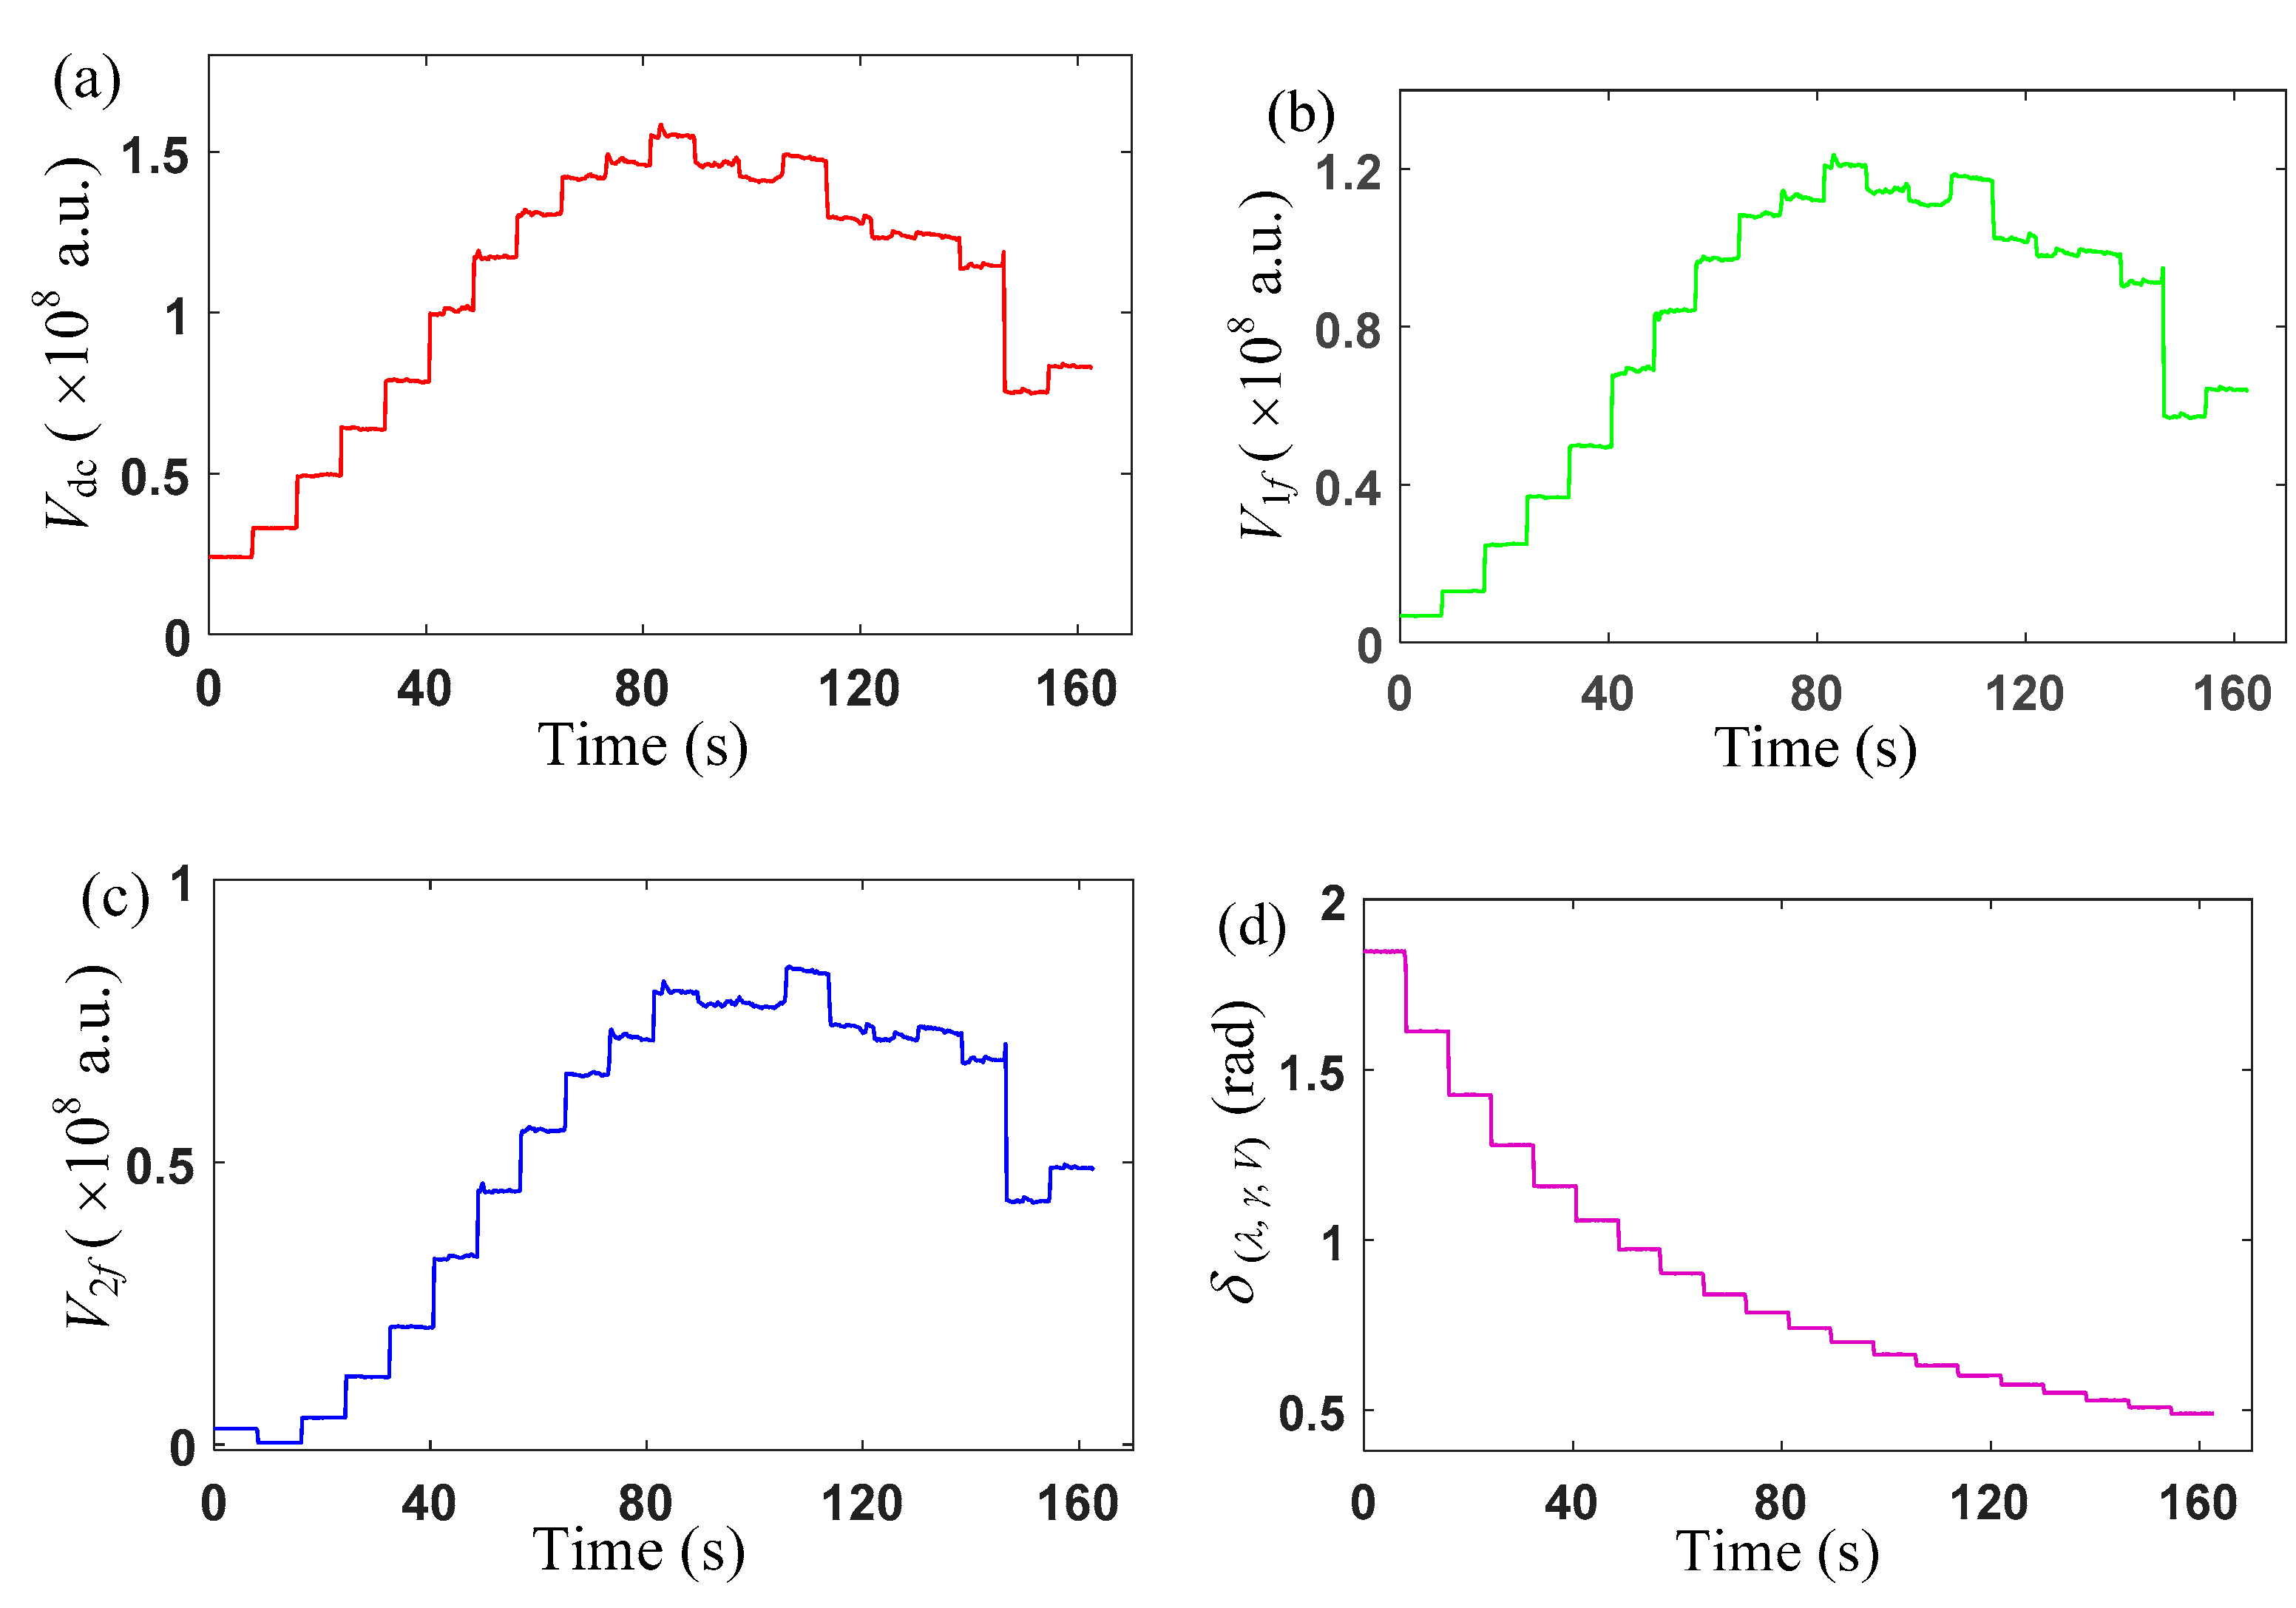
While keeping the PEM driving voltage setting at 85 V, the Y-cut LN plate sample was added to the system. The sampling frequency of the ADC was set to 3.2 MHz, and the sampling signal data set to every 1 × 10
4 cycle to acquire one phase-locked data for the phase-locked processing in FPGA, which corresponded to a sampling time of 198.9 ms. The values of the DC voltage applied the EO sample were 200 V, 400 V, 600 V, and 800 V, respectively. Under each DC voltage, the wavelength of the incident light was also set from 0.42 to 0.8 µm. The monochromator scanned at an interval of 20 nm approximately every 8 s. The DC signal data
and the harmonics
and
were obtained by the digital phase-locked processing. The recorded output phase-locked data of the 400 DC voltage, chosen as an example, are shown in
Figure 3a–c.
Figure 3a–c show that there are differences in the intensity of the incident light in the whole spectral range, and the intensity fluctuates at each wavelength. Submitting the first and second harmonics shown in
Figure 3b,c, and the PEM phase retardation amplitude calibrated in
Figure 2b into Equation (4), the phase retardation of the EO sample was calculated and shown in
Figure 3d. The phase retardation of the EO sample decreased gradually with increasing incident light wavelength. Evident dispersion was shown, however, there was almost no fluctuation in the phase retardation at each wavelength. Thus, fluctuation of light intensity can be effectively eliminated.
The refractive index of LN EO sample
can be described as
by using the Sellmeier formula [
29]. By submitting the size of the LN plate
,
, the phase retardation amplitude of the PEM at different wavelengths shown in
Figure 2b, and the harmonic terms shown in
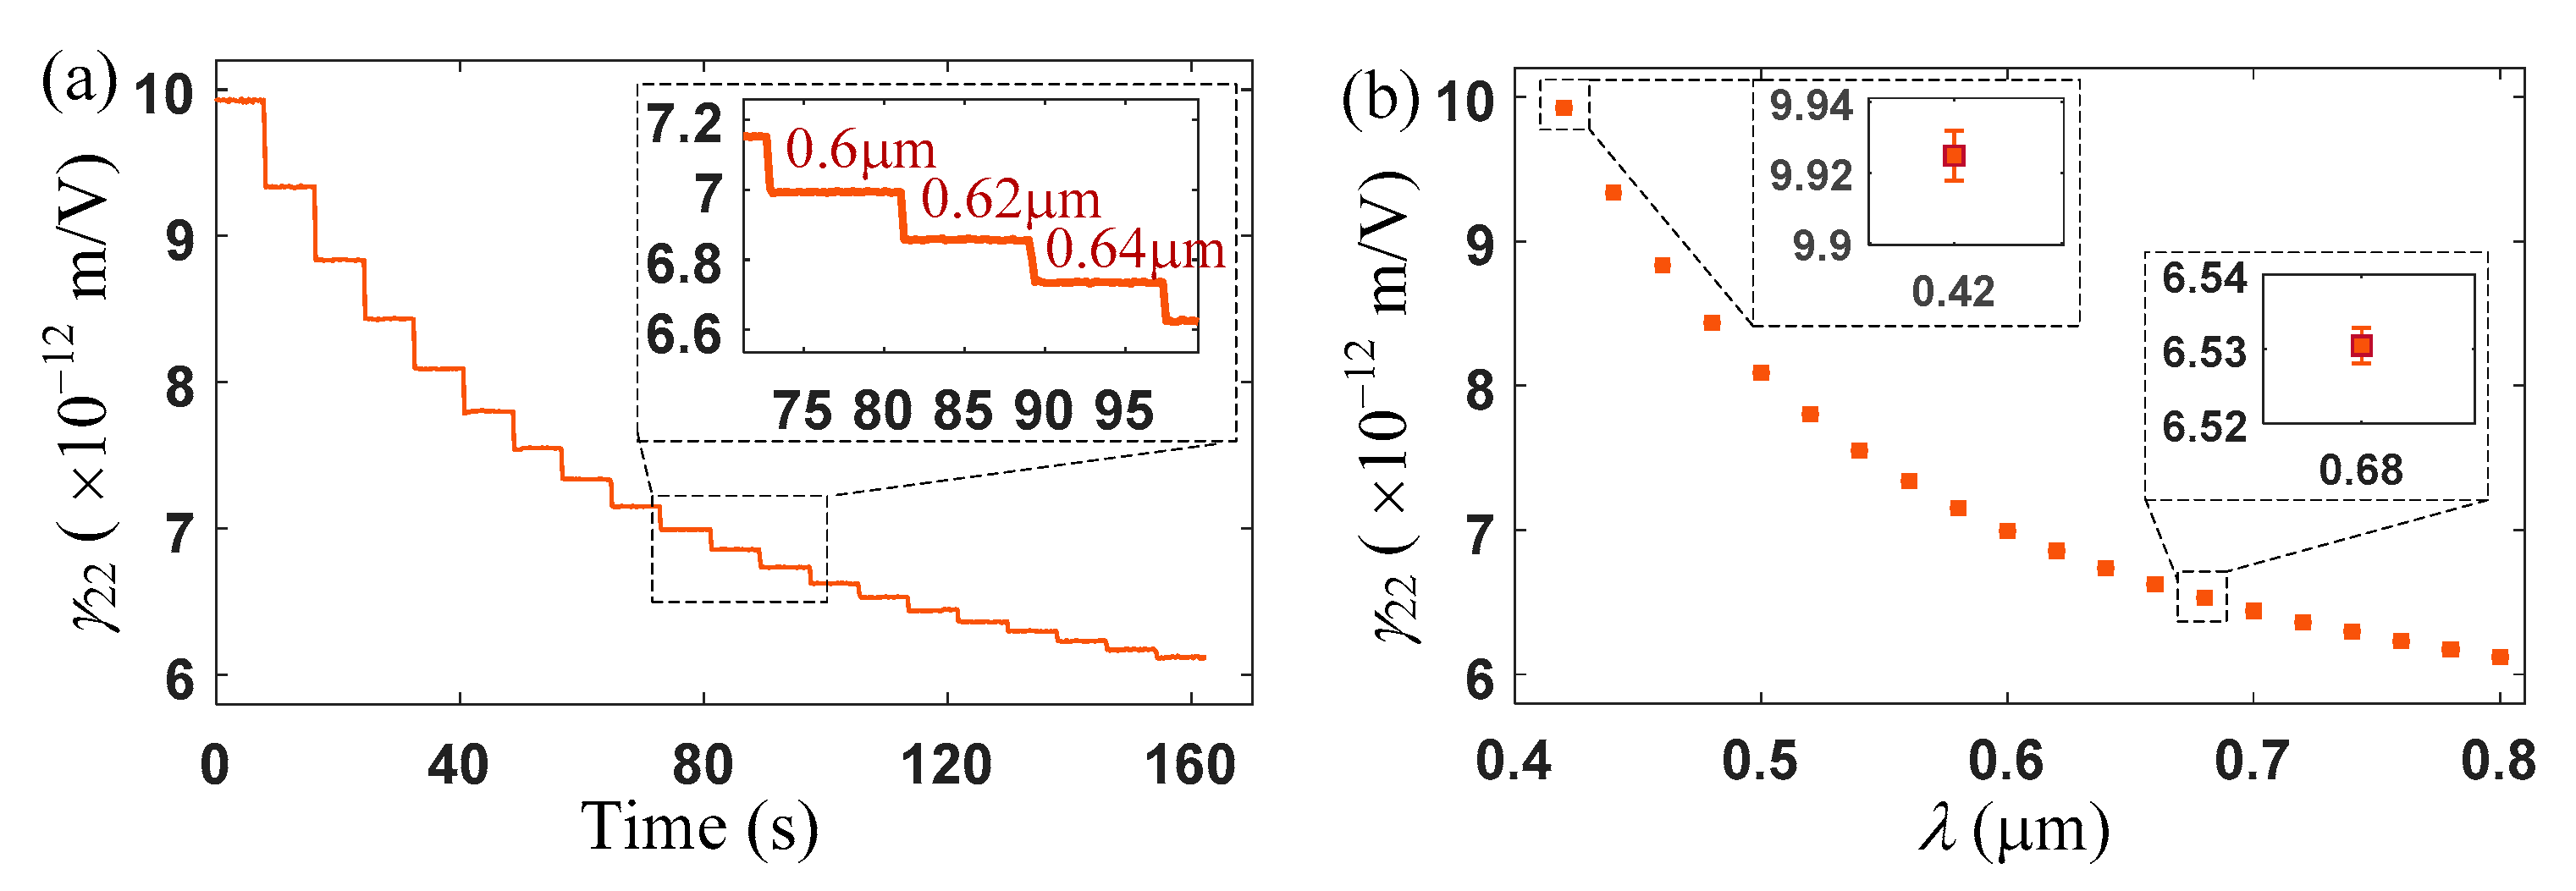
Figure 3b,c into Equation (5), the EO coefficients, recorded in
Figure 4a, could be solved.
From
Figure 4, where the incident light wavelength was increased from 0.42 to 0.8 µm at 20 nm increments for approximately 8 s, the EO coefficients decreased with increasing wavelength. The mean values and the standard deviations of the EO coefficients at various wavelengths shown in
Figure 4a are illustrated in
Figure 4b. The EO coefficients showed obvious dispersion characteristics over the wide wavelength range coverage. When the incident light was 0.42 µm, the standard deviation of the measurement coefficient attained the maximum value,
, which represented the measurement sensitivity of the system.
Following the EO coefficients calculation at 400 V DC voltage, the EO coefficients at 200 V, 600 V, and 800 V DC voltage were also calculated, and the measured results are shown in
Figure 5.
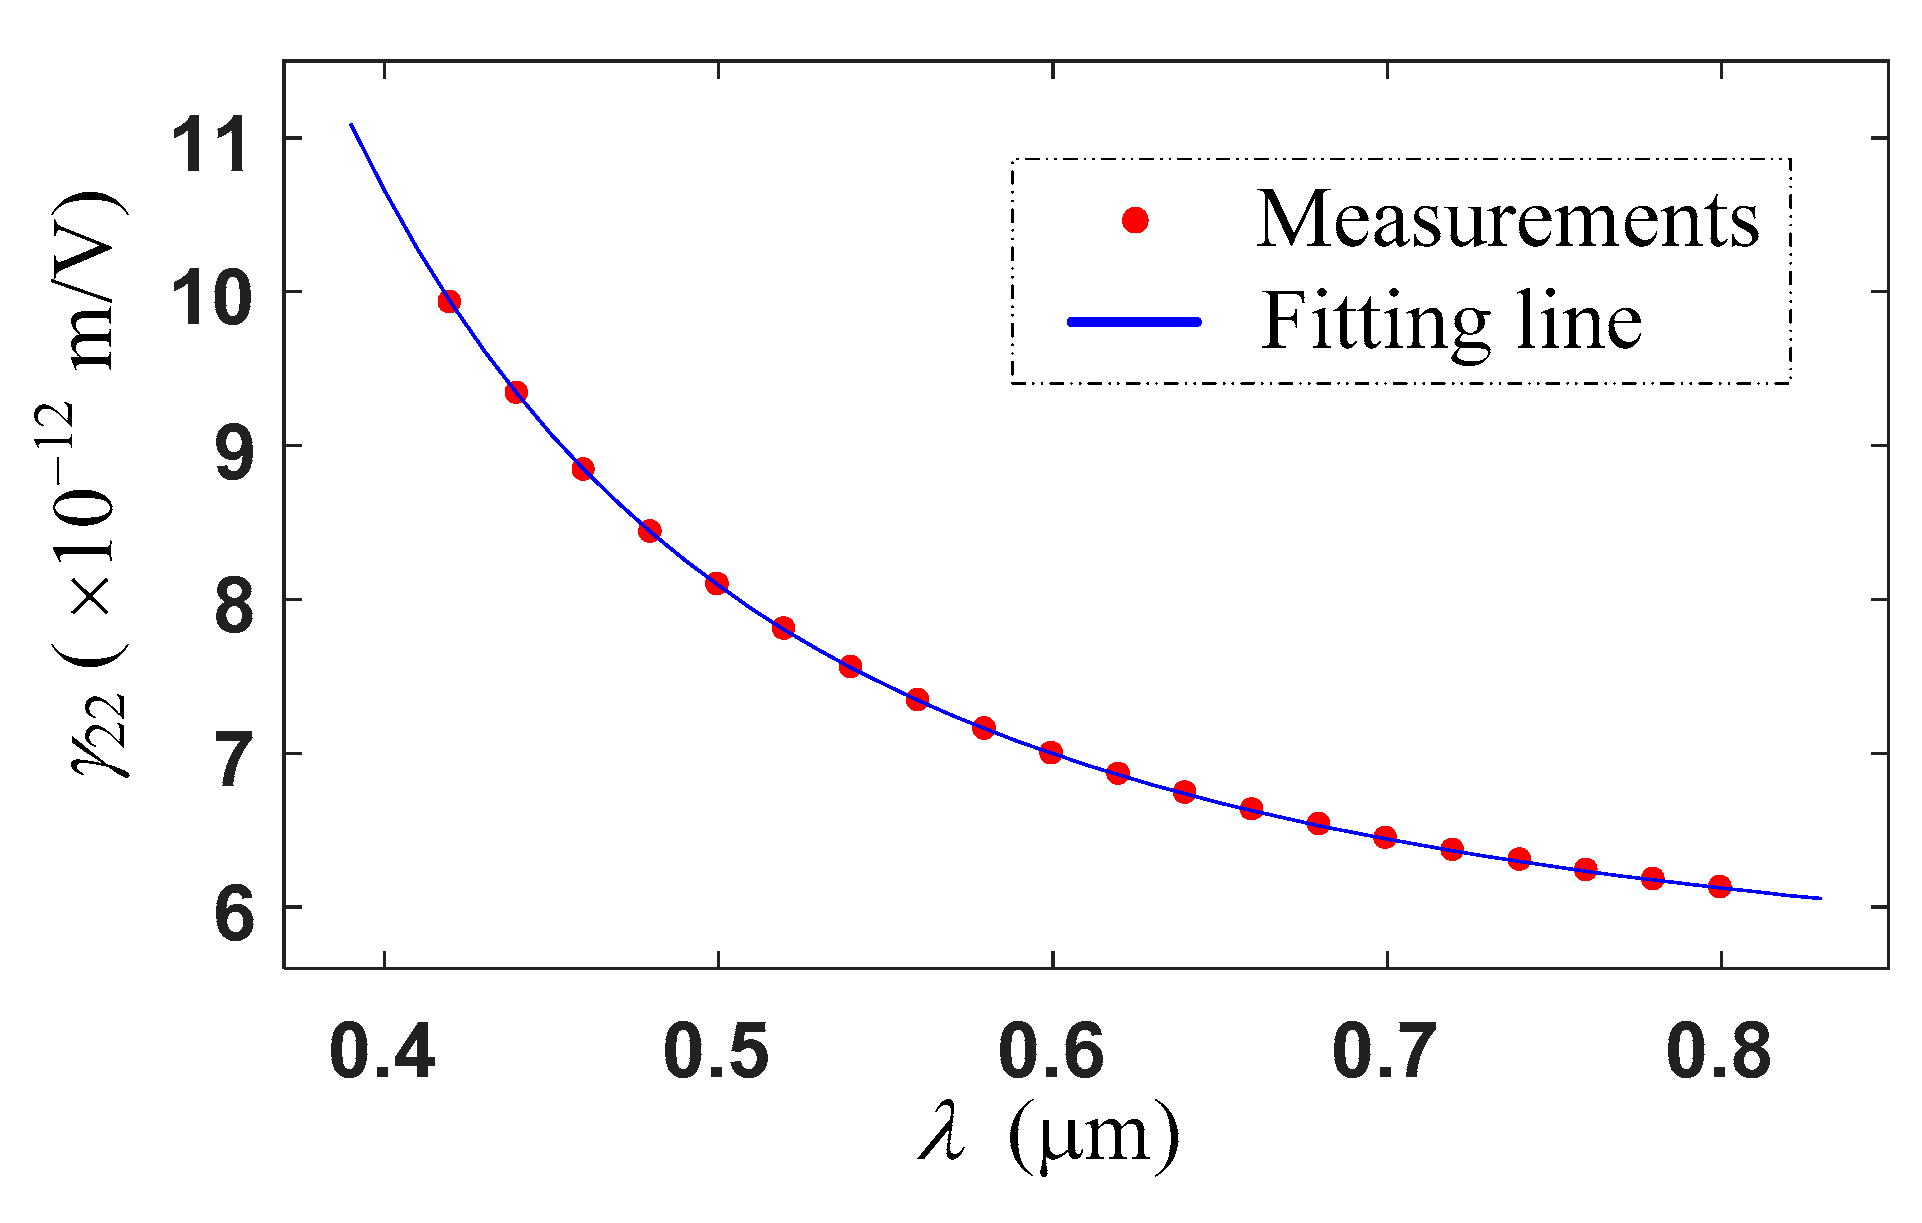
The trend of the EO coefficients at various wavelengths under different applied DC voltage were consistent. The EO coefficients for the same wavelength of the incident light were very close. The mean experimental values of the EO coefficients at each wavelength of the incident light at DC voltage of 200 V, 400 V, 600 V, and 800 V were calculated, and the relationship between the resulting mean EO coefficients and the wavelength of the incident light were fitted, as shown in
Figure 6.
The measurement results demonstrate that the EO coefficients decreased with increasing light wavelength, which decreased rapidly in shorter wavelength range and slowed down gradually in longer wavelength range. The measured EO coefficients were also fitted against the light wavelength, and the dispersion of the EO coefficients with wavelength was obtained as following formula.
The root mean square error (RMSE) between the measured and fitted results is
, which shows that the goodness of fit was very high, which is a benefit offered by the measuring method based on the precise and sensitive spectroscopic polarimetry by using the photoelastic modulation. The dispersion of the EO coefficients, as shown in
Figure 6, is consistent with that of LN crystal recorded in [
30]. According to dispersion Equation (6), the EO coefficients of
is
when the incident light is 632.8 nm, in agreement with the results of
, discussed in [
13,
31]. In addition, the fitted dispersion formula has the same form with the Cauchy formula. As for other physical parameters, such as the refractive index, the dispersion of the EO coefficients can be expressed by means of Cauchy formula in visible light.
4. Discussion
The maximum standard deviation of the system, , which can be regarded as the sensitivity of the system, suggests that the method presented in the current study has achieved high measurement sensitivity and repeatability. The measurement accuracy and sensitivity can be improved further, if the determinations of the LN plate lengths and the DC voltage are more precise. In addition, the measurement speed of the system in the experiments is set at 198.9 ms per data point, which can be further improved if appropriate reduction of the measurement sensitivity is allowed.
In this scheme, the LN EO coefficients were measured in the range of 0.42 to 0.8 µm in visible light. However, the PEM, the core device used in this scheme, can be used in a wide spectral range. Thus, the method can be used to measure the EO coefficients and to study their dispersion in other wavelength bands by simply choosing a suitable light source. The wavelength range of the grating of the monochromator can be extended, and the dispersion of the EO coefficient in near-infrared, mid-infrared and even far-infrared light bands can be further measured.
In addition, the measurement method for the EO coefficients proposed in this paper is based on a simple polarization analysis scheme using a PEM, which can be well applied to establish an ellipsometry device. Furthermore, this study provides a better method for measuring and studying the spectral dispersion of the EO coefficients of non-crystalline materials, such as thin films and two-dimensional materials.


