Article

Towards Portability of Models for Predicting Students’ Final Performance in University Courses Starting from Moodle Logs

by
Javier López-Zambrano
1,2,
Juan A. Lara
3 and
Cristóbal Romero
2,*
1
Escuela Superior Politécnica Agropecuaria de Manabí (ESPAM MFL), Faculty of Computing, SISCOM Group, 131205 Calceta, Ecuador
2
Department of Computer Science and Numerical Analysis, University of Córdoba (UCO), 14014 Córdoba, Andalucía, Spain
3
Department of Computer Science, Madrid Open University (UDIMA), 28400 Madrid, Spain
*
Author to whom correspondence should be addressed.
Appl. Sci. 2020, 10(1), 354; https://doi.org/10.3390/app10010354
Submission received: 27 November 2019 / Revised: 23 December 2019 / Accepted: 31 December 2019 / Published: 3 January 2020

Abstract

:

Featured Application

Authors are encouraged to provide a concise description of the specific application or a potential application of the work. This section is not mandatory.

Abstract

Predicting students’ academic performance is one of the older challenges faced by the educational scientific community. However, most of the research carried out in this area has focused on obtaining the best accuracy models for their specific single courses and only a few works have tried to discover under which circumstances a prediction model built on a source course can be used in other different but similar courses. Our motivation in this work is to study the portability of models obtained directly from Moodle logs of 24 university courses. The proposed method intends to check if grouping similar courses by the degree or the similar level of usage of activities provided by the Moodle logs, and if the use of numerical or categorical attributes affect in the portability of the prediction models. We have carried out two experiments by executing the well-known classification algorithm over all the datasets of the courses in order to obtain decision tree models and to test their portability to the other courses by comparing the obtained accuracy and loss of accuracy evaluation measures. The results obtained show that it is only feasible to directly transfer predictive models or apply them to different courses with an acceptable accuracy and without losing portability under some circumstances.

1. Introduction

The use of web-based education systems or e-learning systems has grown exponentially in the last years, spurred by the fact that neither students nor teachers are bound to any specific location and that this form of computer-based education is virtually independent of a specific hardware platform. Adopting these e-learning systems in higher educational institution can provide us with enormous quantities of data that describe the behavior of students. In particular, Learning Management Systems (LMSs) are becoming much more common in universities, community colleges, schools, and businesses, and are even used by individual instructors in order to add web technology to their courses and supplement traditional face-to-face courses. One of the most popular LMS is Moodle [1], a free and open-source learning management system that allows the creation of completely virtual courses (electronic learning, e-learning) or courses that are partially virtual (blended learning, b-learning). Moodle accumulate a vast amount of information, which is very valuable for analyzing students’ behavior and could create a gold mine of educational data. Moodle keeps detailed logs of all events that students perform and keeps track of what materials students have accessed. However, due to the huge quantities of log data that Moodle can generate daily, it is very difficult to analyze them, thus, it is necessary to use Educational Data Mining (EDM) and Learning Analytics (LA) tools [2]. EDM and LA techniques discover useful, new, valid, and comprehensible knowledge from educational data in order to resolve educational problems [3]. There is a wide range of EDM/LA tasks or applications, but one of the oldest and most important ones is to predict student performance [4]. The objective of prediction is to estimate the unknown value of a variable that describes the student. In education the values normally predicted are performance, knowledge, score, or mark [5]. This value can be numerical/continuous value (regression task) or categorical/discrete value (classification task). In fact, nowadays, there is a great interest in analyzing and mining students’ usage/interaction information gathered by Moodle for predicting students’ final mark in blended learning [6,7]. Blended learning combines the e-learning and the classical face-to-face learning environments. It has been termed as blended learning, hybrid, or mixed learning [8]. Since either pure e-learning or traditional learning hold some weaknesses and strengths, it is better to mix the strengths of both learning environments into a new method of instruction delivery called blended learning.
Most of the research about predicting students’ performance has focused on scenarios that assume that the training and test data are drawn from the same course [9]. As a matter of fact, the obtained/discovered models are mostly built on the samples that researchers have ready at hand, whether it is the current population of students at a university developing a model, the current user base of the adaptive learning system for which the model is being built, or just students who are relatively easy to survey or observe [10]. However, in real educational environments, we historical data are not always available from all the courses. Let us imagine, for example, the case of a new course that is taught for the first time in an institution. Here, we would not have data for training model for predicting student performance. Yet, it is fair that the tutors and students of this new subject have the chance to work with predictive models that notify them of possible unwanted at risk situations such as student drop out. Thus, model portability can be very useful to create and use transferable models of other similar course in which we have a prediction model.
The idea of Portability is that knowledge extracted from a specific environment can be applied directly to another different environment. Within the educational sphere, this idea has great applicability, as it permits to use a model discovered on a previous course (source) to an ongoing course (target) that does not have a model for any reason whatsoever, and to apply these models with certain guarantees to this new course [11]. Most of the previous works related with model portability use a Transfer Learning (TL) approach in which there is a tune-up process, usually based on deep learning approaches, so that the updated model is transferred from one course to another, as shown in [12,13]. Other different works use a Generalization approach that tries to discover one single general model that fit to all the exited courses [14,15]. This is the reason why, in this paper, we have used the term “portability” instead of the related terms “transferability” and “generalization”, since we think that it better describes the direct application of a model obtained with one dataset to a different dataset. In this regard, the goal of this research is to study the portability of predictive models between courses taught via blended-learning (b-learning) in formal university education. These predictive models try to predict whether a student will succeed or not in a certain course (pass or fail) starting to the log data generated from the student interactions with Moodle LMS. Specifically, the problem we want to resolve is: if we have available data for different university courses, could we use or apply the performance prediction model obtained in one specific course in other different course (in which we do not have enough data or we do not have a prediction model) without losing much accuracy. However, due to that the number of courses in a University can be large, and thus, the number of combinations will be huge, and it seems logical to think that good model portability only occurs between similar courses. This is why, in this paper, we propose to group courses in two different ways; our main objective in this paper is to answer the following two research questions:
Can the models obtained in one (source) course be used in other different similar (target) courses of the same degree, while maintaining an acceptable predictive quality?
Can the models obtained in one (source) course be used in other different (target) courses that make a similar level of usage of Moodle activities/resources?
The rest of the document is arranged in the following order: Section 2 reviews the literature related to this research. Section 3 describes the data and experiments. The results are shown in Section 4. Section 5 discusses the results obtained. Finally, Section 6 presents the conclusions and suggests future lines of research.

2. Background

Within the EDM and LA scientific community, several works have been published that discuss the difficulty of achieving generalizable and portable models. In [14], the authors suggested that it is imperative for learning analytics research to account for the diverse ways technology is adopted and applied in a course-specific context. The differences in technology use, especially those related to whether and how learners use the learning management system, require consideration before the log-data can be merged to create a generalized model for predicting academic success. In [16], the authors stated that the portability of the prediction models across courses is low. In addition, they show that for the purpose of early intervention or when in-between assessment grades are taken into account, LMS data are of little (additional) value.
Nevertheless, Baker [10] considered that one of the challenges for the future of EDM is what he called the “Generalizability” problem or “The New York City and Marfa” problem. In his words, Learning Analytics models are mostly built on the samples that we have ready at hand, whether it is the current population of students at a university developing a model, the current user base of the adaptive learning system we are building the model for, or just students who are relatively easy to survey or observe. However, what happens when the population changes? He defined this problem in three steps: (1) Build an automated detector for a commonly-seen outcome or measure; (2) Collect a new population distinct from the original population; and (3) Demonstrate that the detector works for the new population with degradation of quality under 0.1 in terms of AUC ROC (Area Under the ROC -Receiver Operating Characteristic- Curve) and remaining better than chance (AUC ROC > 0.5).
In this regard, there are works that have demonstrated the possibility of replicating EDM models. In [17], they presented an open-source software toolkit, the MOOC (Massive Open Online Course) Replication Framework (MORF), and show that it is useful for replication of machine learned models in the domain of the learning sciences, in spite of experimental, methodological, and data barriers. This work demonstrates an approach to end-to-end machine learning replication, which is relevant to any domain with large, complex, or multi-format, privacy-protected data with a consistent schema.
What Baker [10] defined as “Generalizability” is, in reality, closely related to the concept of Transfer Learning (TL). Boyer and Veeramachaneni [11] defined TL as the attempt to transfer information (training data samples or models) from a previous course to establish a predictive model for an ongoing course. According to Hunt et al. [18], TL enables us to transfer the knowledge from a related (source) task that has already been learned, to a new (target) task. This idea breaks with the traditional view of attempting to learn a predictive model from the data from the on-going course itself, known as in-situ learning.
As listed in [11], there are various types of TL, among which are: (a) Naive Transfer Learning, when using samples from a previous course to help predict students’ performance in a new course; (b) Inductive Transfer Learning, when certain class labels are available as attributes for the target course; and (c) Transductive Transfer Learning, where no labels are available for the target course data.
Transfer learning has been applied in the field of EDM and LA in different applications. In [18], they proposed an approach for predicting graduation rates in degree programs by leveraging data across multiple degree programs. There are also TL-based works for dropout prediction. In [12], they developed a framework to define classification problems across courses, provide proof that ensemble methods allow for the development of high-performing predictive models, and show that these techniques can be used across platforms, as well as across courses. Nevertheless, this study neither mentions each course topic nor does it analyze the transferability of the models. However, in [13] they proposed two alternative transfer methods based on representation learning with auto-encoders: a passive approach using transductive principal component analysis and an active approach that uses a correlation alignment loss term. With these methods, they investigate the transferability of dropout prediction across similar and dissimilar MOOCs and compare with known methods. Results show improved model transferability and suggest that the methods are capable of automatically learning a feature representation that expresses common predictive characteristics of MOOCs. A detailed description of the most relevant works in TL can be found in the survey presented in [9], and more recently, in the survey described in [19].
Domain Adaptation (DA) has gained ground in TL, being a particular case of TL that leverages labeled data in one or more related source domains, to learn a classifier for unseen or unlabeled data in a target domain [20]. In this regard, [21] propose an algorithm, called DiAd, which adapts a classifier trained on a course with labelled data by selectively choosing instances from a new course (with no label data) that are most dissimilar to the course with labelled data and on which the classifier is very confident of classification. A complete review of DA techniques can be found in [20] and [22].
Contextualizing our work in relation to the rest of the related research, we may affirm that our research is innovative and very interesting because it deals with one of the six challenges on EDM/LA community recently presented by Baker [10] named the “The New York City and Marfa Problem”. Our work focuses on traditional university courses that use blended learning, while most of the previous works focus on MOOCs [11,12,13,21]. Although our research is very related to TL, as it fits the definitions of [11,18], it is not our goal to propose or study a specific tune-technique, similar to the latest research on DA [21], but only to study the direct portability of prediction models. To do so, we will follow the idea demonstrated in [13], but instead of carrying out tests with two subjects to prove the reliability of the method, our goal is to carry out a complete study with a greater number of courses in order to study the degree of model portability between subjects. Given that our study does not focus on any concrete technique, rather it studies the degree of portability of models; we use a direct transfer, also called Naive in [11]. This type of transfer has innumerable benefits such as simplicity and immediacy, which can aid other researchers in easily replicating our study with their own data. Additionally, studies such as [13] have demonstrated that this type of direct approach obtains better results than other approaches such as instance-based learning and even in-situ learning approaches. Taking all of this into account, and based on the extent of the authors’ knowledge, this is the first study that measures the degree of model portability in blended learning university courses (not MOOCs), focusing on how portability of model is affected when using course of the same degrees and courses with similar level of usage of Moodle.
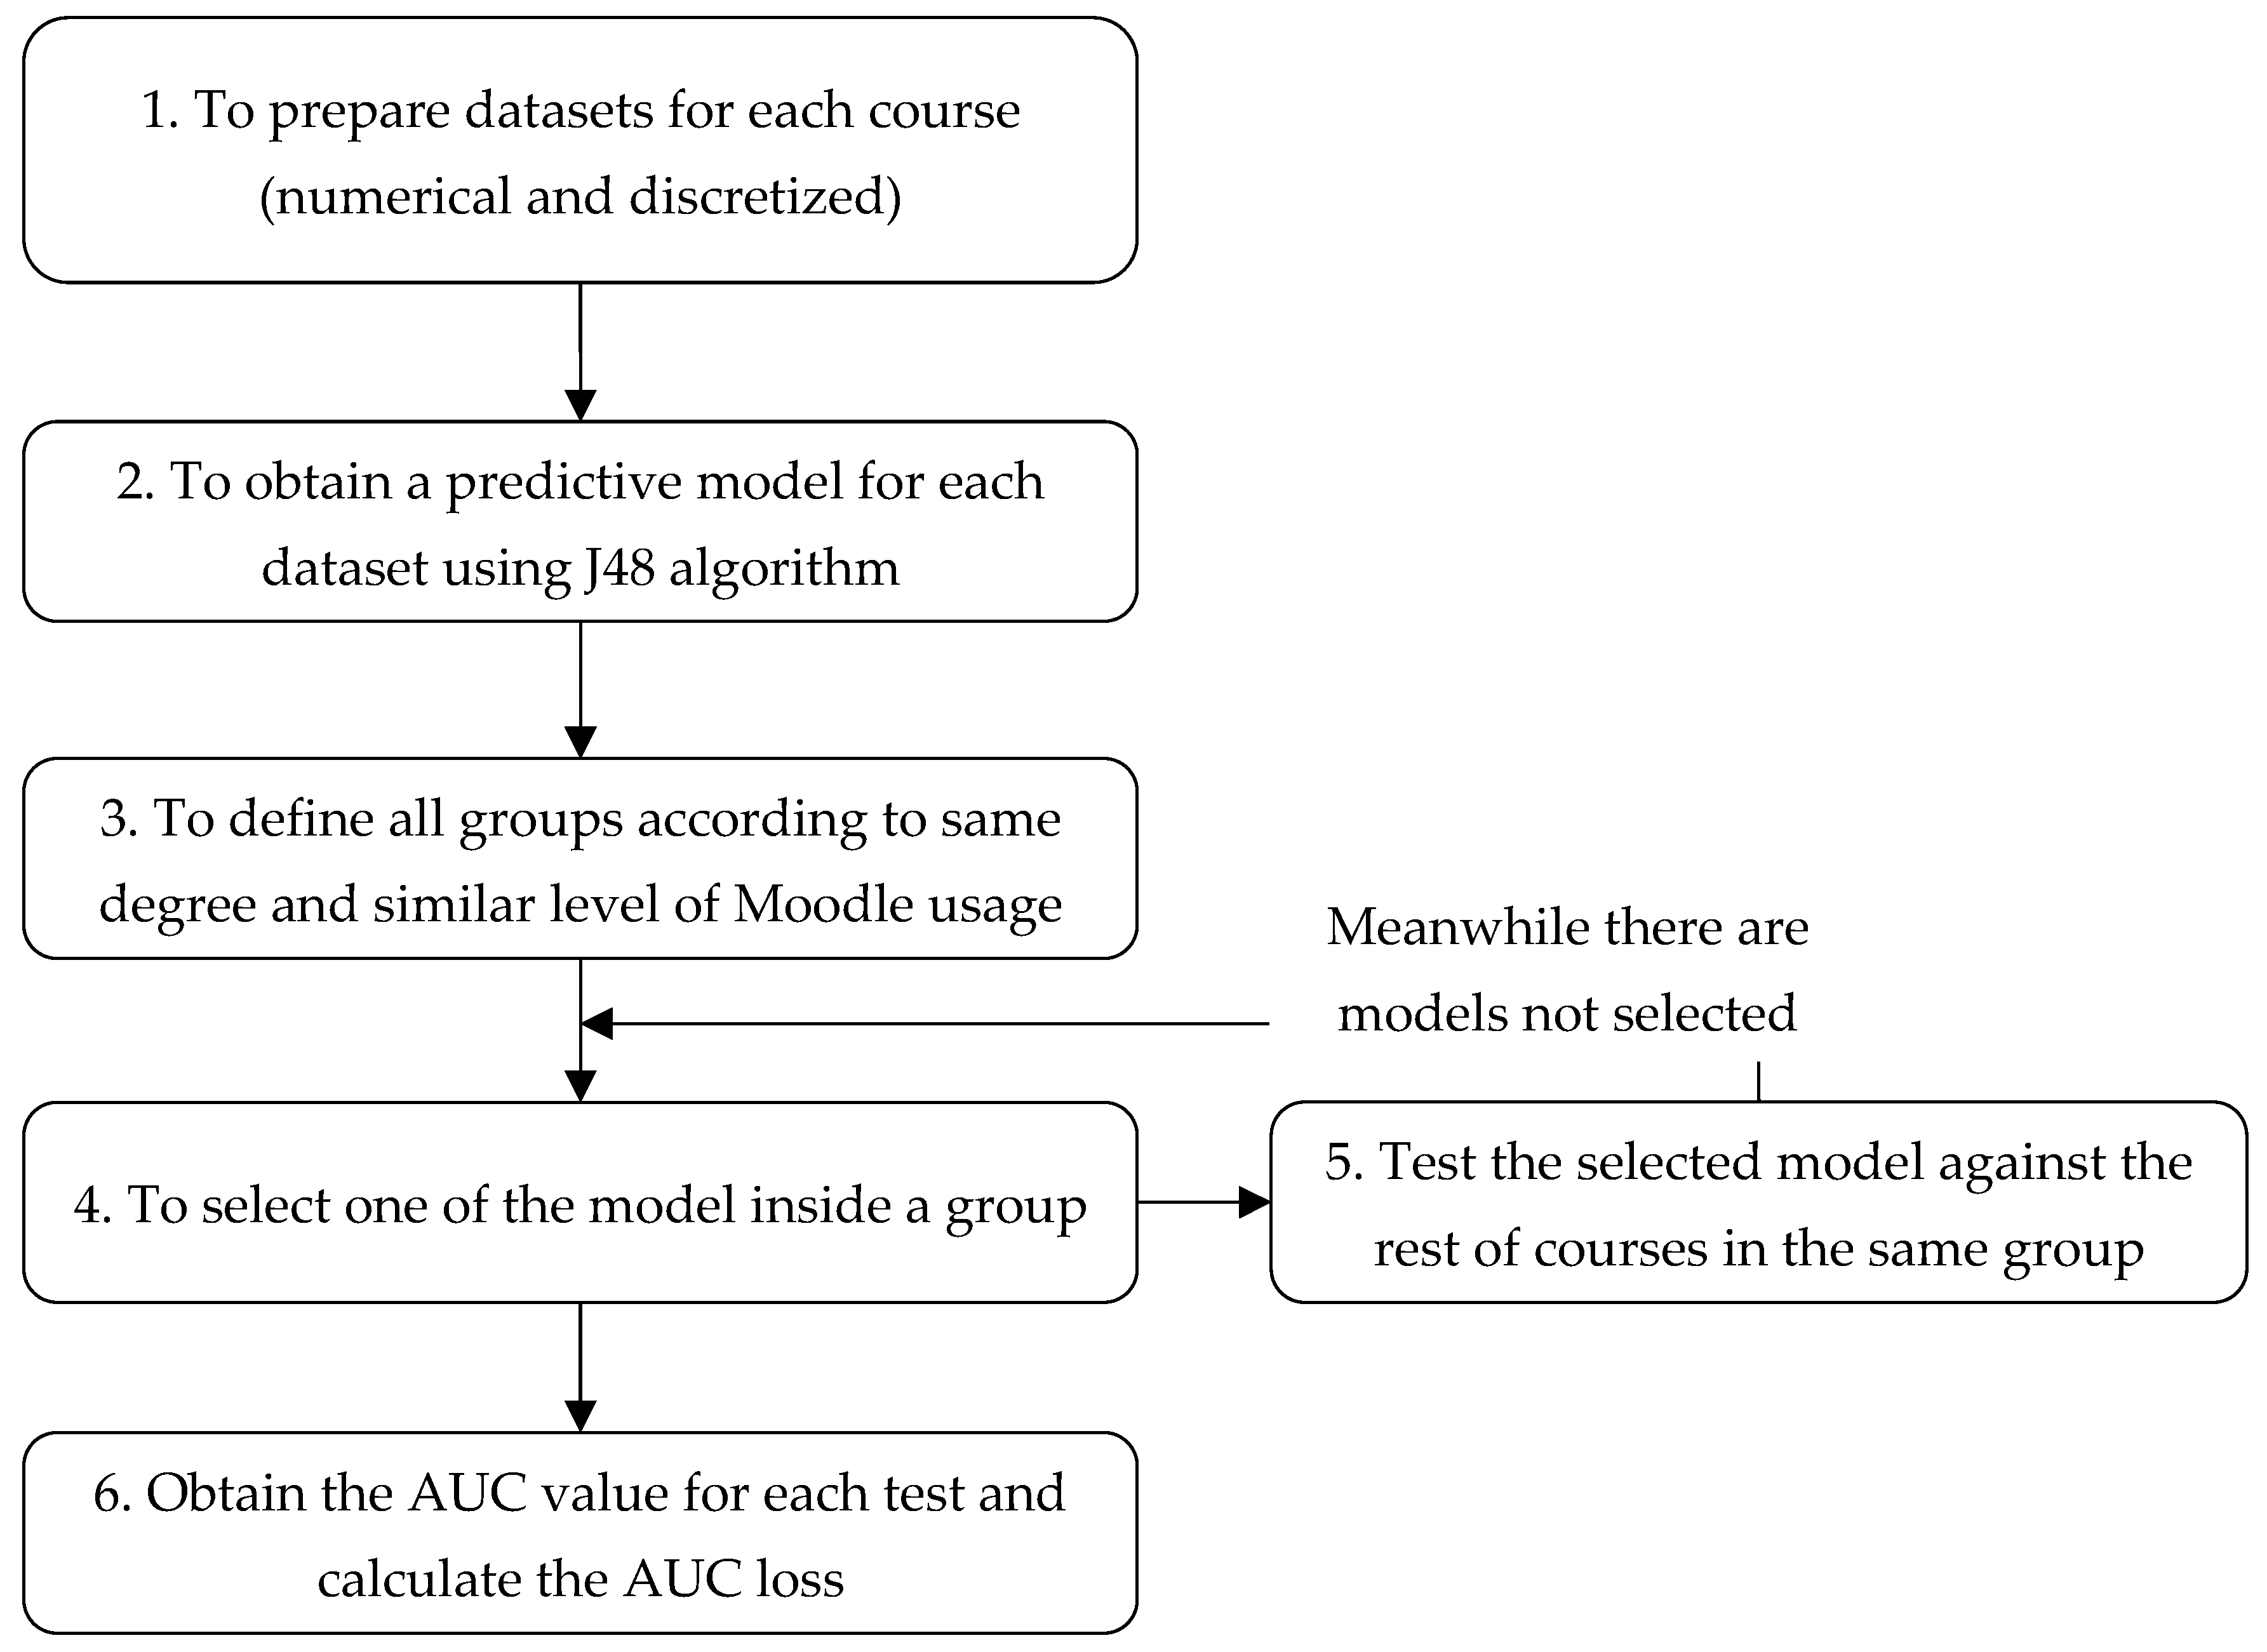
3. Materials and Methods

In this section, we describe the data used and the experiments we have conducted in order to answer the initial research questions.

3.1. Data Description and Preprocessing

We have downloaded the Moodle log files generated by 3235 students in 24 courses in different bachelor’s degrees of University of Cordoba (UCO) in Spain as shown in Table 1. These courses can be from year 1 to year 4 of the bachelor’s degree (most of them from year 1) and they have different numbers of students (#Stds in Table 1) ranging from 50 (minimum) to 302 (maximum). We have categorized each course depending on how many different Moodle’s activities are used in each course, having three different usage levels (Low, Medium, and High), denoted LMS Level in Table 1, having found a medium level in most courses. We have defined three levels of usage according to the number of activities used in the course:
  • Low level: The course only uses one type of activity or even none of them.
  • Medium level: The course uses two different types of activities.
  • High level: The course uses three or more different types of activities.
Finally, it is important to notice that the class (final marks) of the students in these courses is not unbalanced, that is, there are not many differences between the number of students who pass the course and the number of students who fail the course. In addition, although all courses have a little imbalance (between 50%–70% for each class), this is not a problem for most machine learning algorithms since standard performance evaluation measures remain effective in those scenarios with such a little imbalance rate [23].
In order to preprocess the Moodle’s log files and to add the course final marks, we have developed a specific Java GUI (Graphical User Interface) tool for preprocessing this type of files [24]. This is a visual and easy-to-use tool for preparing both the raw Excel students’ data files directly downloaded from Moodle’s courses interface and the Excel students mark files provided by instructors.
Firstly, it shows the content of the Excel files and allows selecting the specific columns where the required information is located: Name of the students, Date and Events (Moodle events) in the Log file and Name of student and Marks (final mark in the course that has a value between 0 and 10) in the Grades file. It joins the information about each student (events and mark) and it anonymizes the data by deleting the name of the students. Next, it allows the user to select what events (all of them or just a few) should be used as attributes in the final dataset. In our case, we have only selected 50 attributes (see Table 2) from all the events that appear in our logs files (we have removed all the instructor’s and administrator’s events). As can be seen from Table 2, we have considered attributes related to the interactions of students with assignments, choices, forums, pages, quizzes, wikis, and others.
Then, the specific starting and ending date of the course can be established in order to count only the number of events that occurred between these dates for each student. Next, it is possible to transform these values defined in a continuous domain/range into discrete or categorical values. This tool provides the option of performing a manual discretization (by specifying the cut points) as well as traditional techniques such as equal-width or equal-frequency. In our case, we are going to generate two different datasets for each course: one continuous dataset (with numerical values in all the attributes less the class attribute) and another discretized datasets (with categorical values in all the attributes). We have discretized all the Moodle’s attributes using the equal-width method (it divides the data into k intervals of equal size) with the two labels HIGH and LOW. Moreover, we have manually discretized the students’ final grade attribute, that is, the class to predict in our classification problem, to two values or labels: FAIL (if the mark is lower than 5) and PASS (if the mark is greater or equal than 5). Finally, this tool allows us to generate a preprocessed data file in. ARFF (Attribute-Relation File Format) format for doing data mining. It is important to notice that all the data used has been treated according to academic ethics. In fact, firstly we requested the instructors of each course to download the log files of their courses from Moodle together with an excel file with the final marks of the students. Then, we signed a declaration for each course stating that we would use the data only for researching purposes and would anonymize them after integrating the students’ events with their corresponding final marks as a previous step to the application of data mining algorithms.

3.2. Experimentation

For each of the mentioned 24 UCO courses, we have considered two datasets: one of them in which we have used continuous values of attributes (called Numerical Dataset); and the other one in which we have used discretized values of those attributes (called Discretized Dataset). This means we had 48 datasets in total. In order to answer the two research questions described in the Introduction section, we conducted two types of experiments that we will describe in detail later (denoted “Experiment 1” and “Experiment 2”) in which we categorize the courses into different groups. In those experiments, for each of the 48 datasets, we have measured the portability of each obtained model to the rest of the courses of the same group. We have used WEKA (Waikato Environment for Knowledge Analysis) [25] because it is a well-known open-source machine learning tool that provides a huge number of classification algorithms and evaluation measures. In fact, we have compared the portability of the models obtained by using the J48 classification algorithm, the AUC and the loss of AUC (difference in two AUC values) as evaluation performance measures. An explanation of the key points in which this choice is based can be found in the coming paragraphs.
We have used the well-known J48 classification algorithm, namely, the Weka version of the C4.5 algorithm [26]. J48 is a re-implementation in Java programming language of C4.5 release 8 (hence the name J48). We have selected this algorithm for two main reasons. The first one is that it is a popular white box classifier that provides a decision tree as model output. Decision trees are very interpretable or comprehensible models that explain the predictions in the form of IF-THEN rules in a decision tree [27] and it has been widely used in education for predicting student performance. The second one is that C4.5 became quite popular after ranking #1 in the Top 10 Algorithms in Data Mining pre-eminent paper published by Springer LNCS in 2008 [28].
We have used AUC and AUC loss as evaluation measures of the performance of the classifier because: (a) AUC is one of the evaluation measures most commonly used for assessing students’ performance predictive models [29,30,31]; and, (b) AUC loss is also proposed by Baker in his Learning Analytics Prizes [10] as the evaluation measure for testing whether or not his transfer challenge has been solved. The Area Under the ROC Curve (AUC) is a universal statistical indicator for describing the accuracy of a model regarding predicting a phenomenon [32]. It has been widely used in education research for comparing classification algorithms and models [33,34] instead of other well-known evaluation measures such as Accuracy, F-measure, Sensitivity, Precision, etc. AUC can be defined as the probability that a classifier will rank a randomly chosen positive instance higher than a randomly chosen negative one (assuming ‘positive’ ranks higher than ‘negative’). It is often used as a measure of the quality of the classification models. A random classifier has an area under the curve of 0.5, while AUC for a perfect classifier is equal to 1. In practice, most of the classification models have an AUC between 0.5 and 1. We have also calculated the AUC loss or difference between the two AUC values obtained when applying the model over the source dataset and when applying over the target dataset.
The general procedure of our experiments has been summarized in Figure 1, where we graphically show the main steps of the experiments by using a flow diagram.
An overall explanation of the main steps (see Figure 2) of our experiments is:
  • Firstly, Moodle logs have to be pre-processed (step 1) in order to obtain numerical and discretized datasets according to the format expected in the data mining tool to be used, Weka.
  • Then, for each course dataset (numerical and discretized), the algorithm J48 is run in order to obtain a general prediction model (step 2) to be used in portability experiments.
  • Next, courses are grouped according to 2 different criteria to conduct two types of experiments (step 3); for the first experiment (named “Experiment 1”), related courses are grouped by the area of knowledge (attribute “Degree” in Table 1); for the second experiment (“Experiment 2”), groups of courses are built according to the Moodle usage (“Moodle Usage” in Table 1).
  • In each experiment, each model is selected (step 4) and tested against the rest of the datasets of courses belonging to the same group (step 5), repeating this process for each course.
  • Finally, AUC values are obtained and AUC loss values are calculated when using the model against the rest of the courses of the same group (step 6).
In the next two subsections, we provide a more detailed explanation of how we have grouped similar courses in the two experiments.

3.2.1. Groups of Experiment 1

In this portability test, four groups of similar courses were used, according to the degree they belong to, as shown in Table 3. Our idea is that all courses of the same degree must be related and can be similar in the subjects.
It is noticeable in Table 3 that there are a higher number of courses in the Computer degree and in the Education degree, than in the Engineering and Physics degrees. In general, both Science and Humanities areas are considered in this study.

3.2.2. Groups of Experiment 2

In this portability experiment, three groups of similar courses were used, according to the respective Moodle usage level, as shown in Table 4. Moodle is an LMS that provides different types of activities (assignments, chat, choice, database, forum, glossary, lesson, quiz, survey, wiki, workshop, etc.). Our idea is that courses that use similar activities will have the same level of usage and these activities are related to the fact of passing or failing the course [2,6].
It is important to notice that the most popular activities in our 24 courses are assignments, forums, and quizzes. Normally, low level courses only use one of these three kinds of activities, medium level courses use two of them, and high level courses use all three mentioned types of activities or even more.

4. Results

In this section we show the results obtained from the two sets of experiments carried out. We present the AUC and the loss of AUC in four different matrixes (two for numerical datasets and two for discretized datasets) for each group of similar courses (see Figure 2). In the upper part, we show two matrixes containing the AUC metric values that we have obtained when testing each course model (row) against the rest of the courses datasets (columns) using the numerical and the discretized datasets. The matrix main diagonal values correspond to the tests carried out for each course model against its own dataset, which means those AUC values (the highest ones) constitute the reference value (in green color) when compared with the rest of the courses. We have also calculated the average AUC values for each course (column denoted as “avg” in the tables) and the overall mean value for the group (cell denoted as “avg mean” in the tables). In the lower part, we show two matrixes showing the difference values between the highest AUC (row), which is considered to be the reference value, and the AUC values obtained when applying the corresponding model to each of the rest of the courses in the same group (column) using the numerical and the discretized datasets. Finally, our analysis focused on finding the best or highest AUC values and the best or lowest rates of AUC loss in each group of similar courses. Thus, we highlighted (in bold) the highest AUC values (without considering the reference value) and the lowest AUC loss values, which will represent the lowest portability loss, and thus the best results.

4.1. Experiment 1

In this experiment we assess the portability of prediction models between courses belonging to the same degree, having considered four different groups (Computer, Education, Engineering, and Physics). Firstly, we have obtained 24 prediction models (one for each course) and then we have tested them with the other courses’ datasets of the same group, which in this case is a total of 174 numerical and 174 discretized datasets. Thus, we have carried out a total of 348 executions of J48 algorithm for obtaining each AUC value and then calculated the AUC loss versus the reference model.
For the Computer group, we can observe from Table 5 that the best AUC value (0.896) when transferring a prediction model to a different course corresponds to the PM (refer to Table 1 for course names abbreviations) course model when tested against the DB course numerical dataset. However, we can observe that the overall mean value for AUC measure with discretized datasets is 0.56, which means that the predictive ability of models when used in other subjects of this group is lightly above randomness. Something similar happens with numerical datasets, where the average value is 0.57. We can also observe that the lowest (best) AUC loss in discretized dataset is close to the perfect portability (0.006). This value is obtained when using the PM model against the RE subject. Overall, we can observe that AUC loss is better in the discretized dataset than in the numerical one (0.23 versus 0.33 in average). We can also highlight that the best average values in terms of portability loss are obtained for DB course in numerical dataset and PM course in discretized datasets (0.10 in both cases).
For the Education group, we can observe from Table 6 that the best AUC value (0.708) is obtained when using the prediction model of PESS course against the SSCM course discretized datasets. The overall average AUC for this group’s discretized dataset (0.56) is very similar to that for the numerical datasets (0.57). In addition, we noticed that portability loss (AUC loss) is near-perfect (0.003) when testing the PEPI model against HWA course dataset in the discretized datasets. The overall average portability loss for discretized dataset experiments is 0.29, much better than the mean value obtained for numerical dataset experiments (0.39). We can also highlight that the best average values in terms of portability loss correspond to PEPI course (0.30 for numerical datasets and 0.11 for discretized datasets).
For the Engineering group, we can observe from Table 7 that the best AUC value (0.636) is obtained for ICS2 course prediction model when tested against ICS1 course discretized dataset. In this experiment, we can observe that the overall average value of AUC is again better in the numerical dataset (0.59) than in the discretized one (0.56), with both values staying above randomness. In addition, we can observe that the best portability loss value of 0.126 is obtained for ICS2 course model when tested against ICS1 course dataset in discretized datasets. Again, we obtain better results in the discretized than in the numerical dataset (0.24 versus 0.30) in terms of portability loss. We can also highlight that the best course average portability loss values are obtained for ICS3 in numerical dataset (0.20) and for ICS1 subject in discretized dataset (0.22).
Finally, for the Physics group, we can see in Table 8 that the highest AUC value (0.641) corresponds to the MM course prediction model when tested against the MA2 course numerical dataset. This value is very close to the overall mean value for the numerical dataset (0.68), which outperforms the overall AUC mean value for the discretized dataset (0.60). If we look at the portability loss values, we notice that the best (the lowest) AUC loss value of 0.009 is obtained when testing the MM course model against MA1 course discretized dataset. In this group, again, the global mean values are better for the discretized dataset than for the numerical one (0.09 versus 0.28), which means that the portability loss rate is particularly lower in this experiment in the discretized dataset compared to the numerical one. We can also highlight that the best course portability loss values are obtained for MM course model in both the numerical (0.21) and discretized (0.04) datasets.

4.2. Experiment 2

In this experiment we assess the portability of prediction models between courses with a similar level of usage of Moodle activities. In fact, we have considered three different groups (High, Medium, and Low). Firstly, we have obtained 24 prediction models (one for each course), and then, we tested them with other courses datasets of the same group, in this case a total of 204 numerical and 204 discretized datasets. Thus, we have carried out a total of 400 executions of J48 algorithm for obtaining each AUC value and then calculating the AUC loss versus the reference model.
For the high level group, as we can see from Table 9, the best value for AUC measure (0.656) is obtained when testing the IS course prediction model against the PM course discretized dataset. In this experiment (and equal than in the previous ones), the overall AUC means values are very similar for numerical (0.58) and discretized datasets (0.57). If we have a look at portability loss values, we can see that the best AUC loss value (0.061) is obtained when testing the ICS2 model against IS discretized dataset. In general, the average mean of AUC loss is better for the discretized datasets than for the numerical datasets (0.24 versus 0.37). Finally, we highlighted the average values of AUC loss for the ICS2 course, which are the lowest both in numerical datasets (0.25) and in discretized datasets (0.10).
For the medium level group, we can observe from Table 10 that the best AUC value of 0.792 corresponds to the prediction model of SDC course when tested against the discretized dataset of the SSCM course. The global average AUC value for this discretized category (0.53) is very similar to the global AUC value for numerical datasets (0.55). Regarding portability loss, we can see that the best value (0.009) belongs to DB prediction model when tested against PEPI discretized dataset. Moreover, again, the portability loss is better in the discretized datasets (0.25) than in the numerical datasets (0.38). Finally, we would also like to highlight the good average AUC loss results obtained by the InS course prediction model with the numerical datasets (0.12) and DB course prediction model in the discretized datasets (0.14).
Finally, for the low level group, we can see from Table 11 that the best AUC measure value (0.758) is obtained when testing the ICS3 prediction model against the HWA numerical dataset. The global average value for the numerical dataset (0.57) is a bit better than the obtained value by the discretized dataset (0.54). We can also notice that the best portability loss value is obtained when testing the MM model against HWA discretized dataset (0.028). The overall mean value for portability loss measure is also better for discretized than for numerical datasets (0.22 versus 0.34). Additionally, the best course prediction model on average values in terms of portability loss correspond to KSCE for numerical dataset (0.16) and MM for the discretized dataset (0.12).

5. Discussion

About the obtained accuracy of the student performance prediction models, as we can see in previous section tables for Experiments 1 and 2, it is noticeable that average AUC values are always a little better in the case of the numerical datasets than the discretized datasets. It is logical and expected that the models’ predictive power is higher when we use numerical values. In Experiment 1, the average AUC highest values are obtained for the Physics group, having 0.68 for the numerical dataset and 0.60 for the discretized one. In Experiment 2 the highest values are found in the High group, obtaining values of 0.58 for the numerical dataset and 0.57 for the discretized dataset. Thus, in general the average AUC values are not high and only a little higher than a change (0.5). If we have a look at the maximum values for AUC, there is not a clear rule that we can obtain since we have found similar good values in both experiments: 0.89 in Computer group of experiment 1 with numerical datasets and 0.79 in medium level group of experiment 2 with discretized datasets. We can conclude that the accuracy of the prediction models when we transfer them to other different courses are not very high (but higher than a chance, AUC > 0.5), it is a little higher when using numerical values (but only slightly) and similar results are obtained in both experiments. We think that this can be in part due to the number of students vary a lot of from one course to another, ranging from 50 (minimum) to 302 (maximum) and the number of attributes vary from one dataset to another.
When assessing the models’ portability, we have also used the AUC loss as an indicator of portability loss. According to Baker [10], prediction models are portable as long as their portability loss values stay around 0.1 (and AUC is kept above randomness). In general, in our two experiments, we have only obtained these good values in one group, namely, the Physics group with discrete datasets with 0.60 AUC average value and 0.09 AUC loss average. Thus, this group of courses fit the Baker’s rule for model portability. However, if we look at specific cases, we also found that some specific models that applied to specific courses datasets obtain good results and fit the Baker’s rule. For instance, in Experiment 1, the minimum values of portability loss was 0.008 for the numerical dataset (Computer group; DB transfer to SE) and 0.006 for discretized dataset (Computer group; PM transfer to RE). In Experiment 2, the minimum value of portability loss was 0.021 for numerical dataset (Medium group; InS transfer to PESS) and 0.009 for discretized dataset (Medium group; DB transfer to PEPI). These results indicate that some particular prediction models are applicable to some other different courses. However, we are more interested in finding if a model can be correctly transferred to all the rest of the courses in its group, and thus, we have a look at portability loss average values (“avg” loss column). In this regard, we have also found some good results, and the best four prediction models are described below. In Experiment 1, we have obtained good average results for the DB prediction model in the numerical dataset (average loss of 0.10) and the MM prediction model in the discretized dataset (0.04). Some similar results were obtained in Experiment 2 with InS prediction model in the numerical case (0.12) and ICS2 prediction model in the case of discretized dataset (0.10). It is important to highlight that those best four models not only present average portability loss values close to 0.10, but they all also keep average values of AUC above randomness. Thus, it indicates that those models are portables and they can be used to correctly predict in the rest of the courses in their group and we can conclude that they meet the conditions established in the portability challenge defined by Baker in The Baker Learning Analytics Prizes [10]. We also checked if these courses are very similar (number of students, number of types of activity, teachers in charge of the course, etc.), having only found some similarities in the group of Physics (which obtained the best average mean AUC Loss). In particular, we noticed that the instructors in charge of the three Mathematics courses in the Physics group were the same and they used the same methodology and evaluation approach in all their courses.
Next, we will show and comment those best four decision trees prediction models. The discovered knowledge from a decision tree can be extracted and presented in the form of classification IF-THEN rules. One rule is created for each path from the root to a leaf node. Each attribute-value pair along a given path forms a conjunction in the rule antecedent (IF part). The leaf node holds the class prediction, forming the rule consequent (THEN) part. In our case, we will show the J48 pruned tree that Weka provides when training a classification prediction model. We have added the word “THEN” to the output of Weka in order to make easier the reading of each rule.

5.1. Best Models of Experiment 1

In Figure 3 we can see the best decision tree for Computer group with numerical datasets that is the prediction model of DB course. It is a big tree (27 nodes in total) that consists of eight leaf nodes or rules for the Pass class and six rules for the Fail class. We can see that all the attributes or Moodle events counts are about assignment, choice, forum, page, and resource. In most of the branches that lead to Pass leaf nodes, we can see “greater than” conditions over attributes and “less or equal than” condition in the attributes of branches that lead to Fail classification. Thus, we can conclude that in this prediction model to have a minimum threshold number of events in these activities seem to be much related with students’ success in the course.
Figure 4 shows the best decision tree in the Physic group with discretized dataset, that is, the prediction model of the MM course. It is a small decision tree (11 nodes in total) with five leaf nodes labeled with the Pass value and only one leaf node with the label Fail. The attributes or events that appear in the tree are about page, resource, and forum. Thus, thanks to the little number or rules and the high comprehensibility of the two labels (HIGH and LOW) the tree is very interpretable and usable by an instructor. For example, if we analyze the branch leading to that Fail leaf node, we can see that students that showed a low number of events with pages, resources, and forums are quite likely to fail the course.

5.2. Best Models of Experiment 2

In Figure 5, we show the best decision tree in the medium level group with numerical datasets, that is, the prediction model of the Ins course. It is a medium size tree (15 nodes in total) that has three rules or leaf nodes for Pass class and five rules for Fail. The attributes or events that appear in this tree are about forum, page, and choice. Most of the branches that lead to Pass show that students must have a greater number of events in these attributes than a specific threshold. The rest of paths lead to students’ fail.
Figure 6 show the best decision tree obtained in the high level group with discretized dataset, which is the prediction model of ICS2 course. It is a small tree (only nine nodes in total) that has three leaf nodes or rules for predicting when the students Pass and two rules for Fail. In this model, the attributes or Moodle events that appear in the rules are about forum, resource, and choice activities. Again, most of the branches that lead to Pass show that student must have a greater number of events in these attributes than a specific threshold. The rest of paths lead to students’ fail.

6. Conclusions and Future Research

This paper presents a detailed study about the portability of predictive models between universities courses. To our knowledge, this work is one of the first exhaustive studies about portability of performance prediction models with blended university courses, and thus, we hope that it can be of help to other researchers who are also interested in developing models for portability solutions in their educational institutions.
In order to answer to our two research questions, we have carried out two experiments executing the J48 classification algorithms over 24 courses in order to obtain the AUC and AUC loss of the models when applying to different courses of the same group by using numerical and discretized datasets. Starting of the results obtained in our experiments, the answers to our two research questions are:
  • How feasible it is to directly apply predictive models between courses belonging to the same degree. By analyzing the results shown in Table 5, Table 6, Table 7 and Table 8, we can see that the average AUC values are not very high (both in numerical and discretized datasets), but when we used discretized datasets, the obtained models are better in terms of AUC loss or portability loss, in spite of the fact that numerical datasets present the best AUC values, which is something that we expected in advance. In fact, portability loss values are inside the interval from 0.09 to 0.28 for the discretized datasets and we obtained good portability loss results in the Computer group and in the Physics group.
  • How feasible it is to directly apply predictive models between courses that make a similar level of usage of Moodle. By analyzing the results shown in Table 9, Table 10 and Table 11, we can see that again, the best AUC values are obtained with the numerical datasets but they are not very high. However, the best lowest portability loss values are obtained with the discretized datasets in the range from 0.22 to 0.25. In this experiment, we did not find results as good as in the first one, but nevertheless, the results obtained are inside an acceptable range.
In conclusion, the results obtained in our experiments with our 24 university courses show that it is only feasible to directly transfer predictive models or apply them to different courses with an acceptable accuracy and without losing portability under some circumstances. In our case, only when we have used discretized datasets and the transfer is between courses of the same degree, although only in two specific degrees of the four degrees tested, the loss portability is feasible. Additionally, we have shown the four best prediction models obtained in each experiment (1 and 2) and type of dataset (numerical and discretized). We have obtained that the most important attributes or Moodle events that appear in the decision trees are about forums, assignments, choices, resource, and page. However, it is important to remark that prediction models when using discretized datasets not only provide the lowest AUC loss values, that is, the best portability, but they also provide smaller decision trees than numerical ones and they only use two comprehensible values (HIGH and LOW) in their attributes (instead of continues values with threshold) that make them much easier to interpret and transfer to other courses.
A limitation of this work is the fact that the best obtained models (decision trees) might not be directly actionable by the teachers of the other courses since those models may include activities or actions that their courses do not have. We have technically solved this problem by executing J48 as Wrapper classifier that addresses incompatible training and test data by building a mapping between the training data that a classifier has been built with and the incoming test instances’ structure. Model attributes that are not found in the incoming instances receive missing values. We have to do it because there are some cases when the source course and the target course do not exactly use the same attributes (they do not have the same events in their logs). We also think that this issue can be one of the reasons why we have obtained low accuracy values when applying a model to other courses that use different activities.
Finally, this work is a first step in our research. The experimental results obtained show that new strategies must be explored in order to get more conclusive results. In the future, we want to carry out new experiments by using much more additional courses and other degrees in order to check how generalizable our results can be. We are also very interested in the next potential lines or future research lines:
  • To use a low number of higher-level attributes proposed by pedagogues and instructors (such as ontology-based attributes) in order to analyze whether using only few high level semantic sets that remain same in all the course datasets has a positive influence on portability results.
  • To use other factors (apart from the degree and the level of Moodle usage) that can be used to group different courses and analyze how portable the models are inside those groups, for example, the number of students, the number of assessment tasks, the methodology used by the instructor, etc. Furthermore, if we have a higher number of different courses, we can do groups inside groups, for example, for each degree, to group the course by the level of Moodle usage and the same used activities.

Author Contributions

Conceptualization, C.R., J.A.L., and J.L.-Z.; methodology, C.R. and J.A.L.; software, J.L.-Z.; validation, C.R., J.A.L. and J.L.-Z.; formal analysis, C.R.; investigation, J.L.-Z.; resources, C.R., and J.L.-Z.; data curation, J.L.-Z.; writing—original draft preparation, J.A.L. and J.L.-Z.; writing—review and editing, C.R., and J.A.L.; visualization, J.L.-Z.; supervision, C.R. and J.A.L.; project administration, C.R.; funding acquisition, C.R. All authors have read and agreed to the published version of the manuscript.

Funding

This research is supported by projects of the Spanish Ministry of Science and Technology TIN2017-83445-P.

Conflicts of Interest

The authors declare no conflict of interest.

References

  1. Dougiamas, M.; Taylor, P. Moodle: Using learning communities to create an open source course management system. In EdMedia: World Conference on Educational Media and Technology; The LearnTechLib: Waynesville, NC, USA, 2003; pp. 171–178. [Google Scholar]
  2. Romero, C.; Ventura, S.; García, E. Data mining in course management systems: Moodle case study and tutorial. Comput. Educ. 2008, 51, 368–384. [Google Scholar] [CrossRef]
  3. Romero, C.; Ventura, S. 2020. Educational Data mining and Learning Analytics: An updated survey. In Wiley Interdisciplinary Reviews: Data Mining and Knowledge Discovery; John Wiley and Sons: Hoboken, NJ, USA, 2011. [Google Scholar]
  4. Romero, C.; Ventura, S. Data mining in education. Wiley Interdiscip. Rev. Data Min. Knowl. Dis. 2013, 3, 12–27. [Google Scholar] [CrossRef]
  5. Romero, C.; Ventura, S. Educational data mining: A review of the state of the art. IEEE Trans. Syst. Man Cybern. Part C (Appl. Rev.) 2010, 40, 601–618. [Google Scholar] [CrossRef]
  6. Romero, C.; Espejo, P.G.; Zafra, A.; Romero, J.R.; Ventura, S. Web usage mining for predicting final marks of students that use Moodle courses. Comput. Appl. Eng. Educ. 2013, 21, 135–146. [Google Scholar] [CrossRef]
  7. Luna, J.M.; Castro, C.; Romero, C. MDM tool: A data mining framework integrated into Moodle. Comput. Appl. Eng. Educ. 2017, 25, 90–102. [Google Scholar] [CrossRef]
  8. Tayebinik, M.; Puteh, M. Blended Learning or E-learning? Int. Mag. Adv. Comput. Sci. Telecommun. 2013, 3, 103–110. [Google Scholar]
  9. Pan, S.J.; Yang, Q. A Survey on Transfer Learning. IEEE Trans. Knowl. Data Eng. 2010, 22, 1345–1359. [Google Scholar] [CrossRef]
  10. Baker, R.S. Challenges for the Future of Educational Data Mining: The Baker Learning Analytics Prizes. J. Educ. Data Min. 2019, 11, 1–17. [Google Scholar]
  11. Boyer, S.; Veeramachaneni, K. Transfer learning for predictive models in massive open online courses. In Artificial Intelligence in Education. AIED 2015. Lecture Notes in Computer Science; Conati, C., Heffernan, N., Mitrovic, A., Verdejo, M., Eds.; Springer: Cham, Switzerland, 2015; Volume 9112. [Google Scholar]
  12. Boyer, S.; Veeramachaneni, K. Robust predictive models on MOOCs: Transferring knowledge across courses. In Proceedings of the 9th International Conference on Educational Data Mining, Raleigh, NC, USA, 29 June–2 July 2016; pp. 298–305. [Google Scholar]
  13. Ding, M.; Wang, Y.; Hemberg, E.; O’Reilly, U.-M. Transfer learning using representation learning in massive open online courses. In Proceedings of the 9th International Conference on Learning Analytics & Knowledge (LAK19), Empe, AZ, USA, 4–8 March 2019; ACM: New York, NY, USA, 2019; pp. 145–154. [Google Scholar]
  14. Gašević, D.; Dawson, S.; Rogers, T.; Gasevic, D. Learning Analytics should not promote one size fits all: The effects of instructional conditions in predicting academic success. Int. High. Educ. 2016, 28, 68–84. [Google Scholar] [CrossRef] [Green Version]
  15. Kidzinsk, L.; Sharma, K.; Boroujeni, M.S.; Dillenbourg, P. On generalizability of MOOC models. In Proceedings of the 9th International Conference on Educational Data Mining (EDM), Raleigh, NC, USA, 29 June–2 July 2016; International Educational Data Mining Society: Buffalo, NY, USA, 2016. [Google Scholar]
  16. Conijn, R.; Snijders, C.; Kleingeld, A.; Matzat, U. Predicting Student Performance from LMS Data: A Comparison of 17 Blended Courses Using Moodle LMS. IEEE Trans. Learn. Technol. 2017, 10, 10–29. [Google Scholar] [CrossRef]
  17. Gardner, J.; Yang, Y.; Baker, R.S.; Brooks, C. Enabling end-to-end machine learning replicability: A case study in educational data mining. In Proceedings of the 1st Enabling Reproducibility in Machine Learning Workshop, Stockholmsmässan, Sweden, 25 June 2018. [Google Scholar]
  18. Hunt, X.J.; Kabul, I.K.; Silva, J. Transfer learning for education data. In Proceedings of the ACM SIGKDD Conference, El Halifax, NS, Canada, 17 August 2017. [Google Scholar]
  19. Weiss, K.; Khoshgoftaar, T.M.; Wang, D. A survey on transfer learning. J. Big Data 2016, 3, 9. [Google Scholar] [CrossRef] [Green Version]
  20. Csurka, G.A. Comprehensive survey on domain adaptation for visual applications. A comprehensive survey on domain adaptation for visual applications. In Domain Adaptation in Computer Vision Applications. Advances in Computer Vision and Pattern Recognition; Csurka, G., Ed.; Springer: Cham, Switzerland, 2017. [Google Scholar]
  21. Zeng, Z.; Chaturvedi, S.; Bhat, S.; Roth, D. DiAd: Domain adaptation for learning at scale. In Proceedings of the 9th International Conference on Learning Analytics & Knowledge (LAK19), Empe, AZ, USA, 4–8 March 2019; ACM: New York, NY, USA, 2019; pp. 185–194. [Google Scholar]
  22. Sun, S.; Shi, H.; Wu, Y. A survey of multi-source domain adaptation. Inform. Fusion 2015, 24, 84–92. [Google Scholar] [CrossRef]
  23. Japkowicz, N.; Stephen, S. The class imbalance problem: A systematic study. Intell. Data Anal. 2002, 6, 429–449. [Google Scholar] [CrossRef]
  24. López-Zambrano, J.; Martinez, J.A.; Rojas, J.; Romero, C. A tool for preprocessing moodle data sets. In Proceedings of the 11th International Conference on Educational Data Mining, Buffalo, NY, USA, 15–18 July 2018; pp. 488–489. [Google Scholar]
  25. Witten, I.H.; Frank, E.; Hall, M.A.; Pal, C.J. Data Mining: Practical Machine Learning Tools and Techniques; Morgan Kaufmann Publishers: San Francisco, CA, USA, 2016. [Google Scholar]
  26. Quinlan, R. C4.5: Programs for Machine Learning; Morgan Kaufmann Publishers: San Mateo, CA, USA, 1993. [Google Scholar]
  27. Hamoud, A.; Hashim, A.S.; Awadh, W.A. Predicting Student Performance in Higher Education Institutions Using Decision Tree Analysis. Int. J. Interact. Multimed. Artif. Intell. 2018, 5, 26–31. [Google Scholar] [CrossRef] [Green Version]
  28. Wu, X.; Kumar, V.; Quinlan, J.R.; Ghosh, J.; Yang, Q.; Motoda, H.; McLachlan, G.J.; Ng, A.; Liu, B.; Philip, S.Y.; et al. Top 10 algorithms in data mining. Knowl. Inform. Syst. 2008, 14, 1–37. [Google Scholar] [CrossRef] [Green Version]
  29. Thai-Nghe, N.; Busche, A.; Schmidt-Thieme, L. Improving academic performance prediction by dealing with class imbalance. In Proceedings of the 9th International Conference on Intelligent Systems Design and Applications, Pisa, Italy, 30 November–2 December 2009; pp. 878–883. [Google Scholar]
  30. Käser, T.; Hallinen, N.R.; Schwartz, D.L. Modeling exploration strategies to predict student performance within a learning environment and beyond. In Proceedings of the 7th International Learning Analytics & Knowledge Conference, Vancouver, BC, Canada, 13–17 March 2017; pp. 31–40. [Google Scholar]
  31. Santoso, L.W. The analysis of student performance using data mining. In Advances in Computer Communication and Computational Sciences; Springer: Berlin/Heidelberg, Germany, 2019; pp. 559–573. [Google Scholar]
  32. Fawcett, T. An introduction to ROC analysis. Pattern Recognit. Lett. 2006, 27, 861–874. [Google Scholar] [CrossRef]
  33. Gamulin, J.; Gamulin, O.; Kermek, D. Comparing classification models in the final exam performance prediction. In Proceedings of the 37th IEEE International Convention on Information and Communication Technology, Electronics and Microelectronics (MIPRO), Opatija, Croatia, 26–30 May 2014; pp. 663–668. [Google Scholar]
  34. Whitehill, J.; Mohan, K.; Seaton, D.; Rosen, Y.; Tingley, D. MOOC Dropout Prediction: How to Measure Accuracy? In Proceedings of the Fourth Association for Computing Machinery on Learning @ Scale, Cambridge, MA, USA, 20–21 April 2017. [Google Scholar]
Figure 1. Experiments procedure steps.
Applsci 10 00354 g001
Figure 2. Visual description of the results in four tables.
Applsci 10 00354 g002
Figure 3. Best model of the Computer group with numerical dataset—Subject DB.
Applsci 10 00354 g003
Figure 4. Best Model of the Physics group with discretized dataset—Subject MM.
Applsci 10 00354 g004
Figure 5. Best model of the Medium group with numerical dataset—Subject InS.
Applsci 10 00354 g005
Figure 6. Best Model of the High group with discretized dataset—Subject ICS2.
Applsci 10 00354 g006
Table 1. Information about the courses.
Course NameCodeDegreeYear#StdsLMS Level
Introduction to programmingIPComputer1289High
Programming methodologyPMComputer1233High
Professional computer toolsPCTComputer1124Medium
DataBasesDBComputer258Medium
Human Computer Interfaces HCIComputer2260High
Information SystemsInSComputer2188Medium
Software EngineeringSEComputer258Medium
Interactive SystemsISComputer384High
Requirement engineeringREComputer386Medium
Software Design and ConstructionSDCComputer350Medium
Primary Education in the School SystemPESSEducation1205Medium
Knowledge of the Social and Cultural EnvironmentKSCEEducation1302Low
Primary Education Planning and InnovationPEPIEducation2117Medium
Psychoeducational Care for the Cultural Diversity of Early Childhood EducationPECEEducation455Medium
Hermeneutics of the Work of ArtHWAEducation483Low
Spanish Social and Cultural MediaSSCMEducation458Medium
Introduction to PsychologyIPsEducation491High
Introduction to Computer Science ICS1Electrical Engineering1100Low
Introduction to Computer ScienceICS2Electronic Engineering1198High
Introduction to Computer ScienceICS3Civil Engineering185Low
Introduction to Computer ScienceICS4Mining Engineering177Low
Mathematics Analysis IMA1Physics1155Low
Mathematical Analysis IIMA2Physics1160Low
Mathematical MethodsMMPhysics1119Low
Table 2. List of Moodle logs attributes/events used.
Assignments
1.
assign submit
2.
assign submit for grading
3.
assign view
4.
assign view all
5.
assignment upload
6.
assignment view
7.
assignment view all
Choices
8.
choice choose
9.
choice choose again
10.
choice report
11.
choice view
12.
choice view all
Courses
13.
course enroll
14.
course user report
15.
course view
16.
course view section
Folders
17.
folder view
18.
folder view all
Forums
19.
forum add discussion
20.
forum add post
21.
forum mark read
22.
forum search
23.
forum subscribe
24.
forum subscribe all
25.
forum unsubscribe
26.
forum view discussion
27.
forum view forum
28.
forum view forums
Pages
29.
page view
30.
page view all
Questionnaires
31.
questionnaire submit
32.
questionnaire view
33.
questionnaire view all
Quizzes
34.
quiz attempt
35.
quiz close attempt
36.
quiz continue attempt
37.
quiz review
38.
quiz view
39.
quiz view all
40.
quiz view summary
Resources
41.
resource view
42.
resource view all
Urls
43.
url view
44.
url view all
Wikis
45.
wiki edit
46.
wiki info
47.
wiki links
48.
wiki update
49.
wiki view
50.
wiki view all
Table 3. List of groups by degree.
N.GroupN. of Subjects
1Computer10
2Education 7
3Engineering4
4Physics3
Table 4. List of groups by Moodle usage.
N.GroupNumber of Subjects
1High6
2Medium10
3Low8
Table 5. AUC Results and Loss in Portability in Computer degree group.
AUC (Numerical Datasets)AUC (Discretized Datasets)
CourseHCIISIPPMDBSDCPCTRESEInSavgHCIISIPPMDBSDCPCTRESEInSavg
HCI0.9430.5100.5550.5240.5050.5070.5760.5000.4910.4600.560.7690.6210.4960.5700.5900.5410.5430.5100.5610.5250.57
IS0.5220.9660.5260.5220.5210.6040.4830.6910.4910.4820.580.5570.8540.6430.5510.5130.5730.5450.5340.4600.6870.59
IP0.5240.6160.9310.6520.6080.5620.4950.4930.4420.5900.590.4960.5010.8270.6740.6210.4780.5000.5000.4340.5410.56
PM0.5140.5000.6870.9150.8960.5500.5540.5180.5300.5440.620.5500.6220.5980.7150.6460.6820.5620.7100.5420.5970.62
DB0.5270.2490.5130.5640.6010.5740.4250.5440.5930.4770.510.4690.4900.4500.5930.6020.5080.4710.5750.4440.4660.51
SDC0.5100.6600.4920.5230.5720.8440.5990.5580.4670.5140.570.4750.6260.5230.4840.4840.7830.5440.6050.4810.5790.56
PCT0.5100.6600.4920.5230.5720.5990.8440.5580.4670.5140.570.4750.6260.5230.4840.4840.5440.7830.6050.4810.5790.56
RE0.4900.5630.4910.5210.5150.5250.5610.9920.4910.5510.570.4990.5490.4440.5160.5470.6200.5140.8450.5820.5080.56
SE0.5150.4080.6030.5040.5080.5570.4750.6230.9780.4290.560.4410.5580.4620.4460.4710.4770.5110.5690.7290.4630.51
InS0.4790.4810.5330.5510.5440.5720.5010.6100.5250.6730.550.4920.6340.5460.6060.5700.5780.5330.5650.5100.7920.58
avg mean 0.57avg mean0.56
AUC LOSS (Numerical Datasets)AUC LOSS (Discretized Datasets)
CourseHCIISIPPMDBSDCPCTRESEInSavgHCIISIPPMDBSDCPCTRESEInSavg
HCI-0.4320.3880.4180.4370.4360.3670.4430.4520.4830.43-0.1480.2730.2000.1790.2280.2260.2600.2080.2450.22
IS0.444-0.4400.4440.4450.3630.4830.2760.4750.4840.430.297-0.2110.3030.3410.2810.3090.3210.3940.1670.29
IP0.4080.315-0.2790.3230.3700.4360.4390.4890.3410.380.3310.326-0.1530.2060.3490.3270.3270.3930.2860.30
PM0.4010.4150.228-0.0190.3650.3610.3970.3850.3700.330.1650.0940.118-0.0690.0340.1530.0060.1730.1190.10
DB0.0740.3520.0870.037-0.0270.1760.0570.0080.1240.100.1340.1120.1520.009-0.0940.1310.0270.1580.1360.11
SDC0.3350.1840.3520.3210.272-0.2450.2870.3770.3300.300.3080.1570.2600.2980.299-0.2390.1780.3020.2040.25
PCT0.3350.1840.3520.3210.2720.245-0.2870.3770.3300.300.3080.1570.2600.2980.2990.239-0.1780.3020.2040.25
RE0.5010.4290.5010.4700.4760.4670.431-0.5010.4410.470.3460.2960.4000.3290.2970.2250.331-0.2630.3370.31
SE0.4640.5700.3750.4740.4700.4220.5030.356-0.5490.460.2880.1710.2670.2830.2580.2520.2180.160-0.2660.24
InS0.1930.1920.1400.1220.1280.1010.1720.0630.148-0.140.3000.1580.2460.1860.2220.2150.2590.2270.282-0.23
avg mean0.33avg mean0.23
Table 6. AUC Results and Loss in Portability in Education degree group.
AUC (Numerical Datasets)AUC (Discretized Datasets)
CoursePESSSSCMPEPIPECEHWAKSCEIPsavgPESSSSCMPEPIPECEHWAKSCEIPsavg
PESS0.9380.5540.5530.5480.6670.5580.5350.620.8050.7080.5260.3310.5000.5250.6110.57
SSCM0.6290.8430.5740.3950.6670.5300.5220.590.5600.8390.4660.3660.5000.5000.5150.54
PEPI0.4900.5870.8390.5620.5560.4990.5520.580.4830.5720.6700.5680.6670.4600.5970.57
PECE0.4470.2650.4630.9720.3330.4670.5410.500.3080.3420.5150.7490.5000.5000.4650.48
HWA0.4930.5330.4410.5741.0000.5430.5340.590.5490.5690.5490.4880.7780.5320.5150.57
KSCE0.5310.5750.4590.5160.3540.8170.5000.540.5500.6790.5230.4720.6080.9310.5830.62
IPs0.5860.3220.6430.5190.5280.6250.9210.590.5560.5000.5050.4980.6180.5420.8840.59
avg mean0.57avg mean0.56
AUC LOSS (Numerical Datasets)AUC LOSS (Discretized Datasets)
CoursePESSSSCMPEPIPECEHWAKSCEIPsavgPESSSSCMPEPIPECEHWAKSCEIPsavg
PESS-0.3840.3850.3900.2710.3800.4030.37-0.0970.2790.4740.3050.2800.1950.27
SSCM0.214-0.2690.4480.1760.3130.3210.290.279-0.3730.4730.3390.3390.3240.35
PEPI0.3490.253-0.2770.2830.3400.2880.300.1870.099-0.1020.0030.2100.0730.11
PECE0.5260.7070.509-0.6390.5050.4310.550.4420.4080.234-0.2490.2490.2850.31
HWA0.5070.4680.5590.426-0.4570.4660.480.2290.2100.2290.290-0.2460.2630.24
KSCE0.2860.2430.3580.3010.463-0.3170.330.3810.2530.4080.4590.323-0.3480.36
IPs0.3360.6000.2780.4020.3930.296-0.380.3290.3850.3790.3860.2660.342-0.35
avg mean0.39avg mean0.29
Table 7. AUC Results and Loss in Portability in Engineering degree group.
AUC (Numerical Datasets)AUC (Discretized Datasets)
CourseICS1ICS2ICS3ICS4avgICS1ICS2ICS3ICS4avg
ICS10.9580.4770.4640.5690.620.7420.5350.5540.4740.58
ICS20.5760.7890.5040.5570.610.6360.7610.5230.4020.58
ICS30.5440.5470.7390.5250.590.4460.5060.7390.5140.55
ICS40.4100.4770.5420.7900.550.4280.4550.4830.6850.51
avg mean0.59avg mean0.56
AUC LOSS (Numerical Datasets)AUC LOSS (Discretized Datasets)
CourseICS1ICS2ICS3ICS4avgICS1ICS2ICS3ICS4avg
ICS1-0.4800.4940.3890.45-0.2060.1870.2680.22
ICS20.213-0.2850.2310.240.126-0.2380.3590.24
ICS30.1950.192-0.2140.200.2930.233-0.2250.25
ICS40.3800.3140.248-0.310.2570.2300.202-0.23
avg mean0.30avg mean0.24
Table 8. AUC Results and Loss in Portability in Physics degree group.
AUC (Numerical Datasets)AUC (Discretized Datasets)
CourseMMMA1MA2avgMMMA1MA2avg
MM0.8070.5590.6410.670.6390.6300.5630.61
MA10.5420.8800.5910.670.5780.6970.6030.63
MA20.5740.5920.9050.690.5460.5250.6420.57
avg mean 0.68 avg mean0.60
AUC LOSS (Numerical Datasets)AUC LOSS (Discretized Datasets)
CourseMMMA1MA2avgMMMA1MA2avg
MM-0.2490.1660.21-0.0090.0760.04
MA10.337-0.2880.310.119-0.0940.11
MA20.3310.313-0.320.0960.117-0.11
avg mean0.28 avg mean0.09
Table 9. AUC Results and Loss in Portability in high level of usage of Moodle group.
AUC (Numerical Datasets)AUC (Discretized Datasets)
CourseHCIISICS2IPPMIPsavgHCIISICS2IPPMIPsavg
HCI0.9430.5100.5220.5380.5240.4570.580.7690.6210.5690.4170.5700.5500.58
IS0.4850.9270.4940.4700.6060.5200.580.4790.8160.5770.5550.6560.5960.61
ICS20.5140.5900.7830.5000.5690.5130.580.5030.5580.6190.4850.5160.5520.54
IP0.4840.4200.4720.8620.4900.6270.560.5190.5760.5350.7610.4910.4090.55
PM0.5140.4890.5300.6180.8990.6100.610.5740.4880.5220.5920.7930.4800.57
IPs0.5160.5290.5140.4270.5970.9210.580.5070.6380.4850.5140.4600.8840.58
avg mean0.58avg mean0.57
AUC LOSS (Numerical Datasets)AUC LOSS (Discretized Datasets)
CourseHCIISICS2IPPMIPsavgHCIISICS2IPPMIPsavg
HCI-0.4320.4210.4040.4180.4860.43-0.1480.2010.3520.2000.2200.22
IS0.442-0.4330.4570.3210.4070.410.337-0.2380.2600.1600.2190.24
ICS20.2700.193-0.2830.2150.2710.250.1160.061-0.1340.1030.0670.10
IP0.3780.4410.390-0.3710.2350.360.2420.1840.225-0.2690.3520.25
PM0.3850.4100.3690.281-0.2900.350.2190.3050.2710.200-0.3130.26
IPs0.4050.3920.4070.4950.324-0.400.3770.2460.4000.3700.424-0.36
avg mean0.37avg mean0.24
Table 10. AUC Results and Loss in Portability in medium level of usage of Moodle group.
AUC (Numerical Datasets)AUC (Discretized Datasets)
CourseSSCMDBSDCPCTRESEInSPECEPESSPEPIavgSSCMDBSDCPCTRESEInSPECEPESSPEPIavg
SSCM0.8390.5210.5490.4640.5000.4890.5460.3660.5600.4660.530.8430.4920.6980.5140.6350.5130.5830.3950.6290.5740.59
DB0.2230.9760.5350.4570.6700.5810.5170.4560.5440.5390.550.4220.6520.5510.4760.5000.5100.4990.5000.5000.6430.53
SDC0.6100.4670.8090.5040.5580.4960.4560.5710.5140.4670.550.7920.4300.9240.5310.6100.4840.6220.2680.6640.5060.58
PCT0.4950.3370.5850.8910.6120.3820.4920.4220.3240.4310.500.6830.4470.5670.7120.5530.4700.5510.2860.5690.5000.53
RE0.4560.3290.5530.5790.9560.4730.5770.4650.6070.4870.550.4910.5290.6140.5080.7560.5450.5690.5210.5970.5420.57
SE0.4170.6110.5590.4860.6140.9640.4940.5170.6650.5420.590.4250.5000.3750.4730.4310.7180.4510.0000.2720.5560.42
InS0.6050.6710.5830.4860.6100.5330.7040.5640.6840.4940.590.5120.4290.6250.5280.4540.5000.7610.6100.4320.5020.54
PECE0.2650.5200.3710.5050.2810.4710.5480.9720.4470.4630.480.3420.5530.5500.4680.5590.5300.4630.7490.3080.5150.50
PESS0.5540.4710.5470.5090.5790.5790.5820.5480.9380.5530.590.7080.4610.6180.5190.5180.4650.6060.3310.8050.5260.56
PEPI0.5870.3230.5740.5400.4990.4810.5420.5620.4900.8390.540.5720.5000.4350.5050.4540.5040.5900.5680.4830.7120.53
avg mean0.55avg mean0.53
AUC LOSS (Numerical Datasets)AUC LOSS (Discretized Datasets)
CourseSSCMDBSDCPCTRESEInSPECEPESSPEPIavgSSCMDBSDCPCTRESEInSPECEPESSPEPIavg
SSCM-0.3180.2900.3750.3390.3500.2930.4730.2790.3730.34-0.3510.1450.3290.2080.3300.2600.4480.2140.2690.28
DB0.754-0.4410.5190.3070.3950.4590.5200.4320.4370.470.230-0.1010.1760.1520.1420.1530.1520.1520.0090.14
SDC0.1990.342-0.3050.2520.3130.3530.2380.2960.3420.290.1320.494-0.3930.3140.4400.3020.6560.2610.4180.38
PCT0.3970.5540.306-0.2790.5090.3990.4690.5680.4600.440.0290.2650.145-0.1590.2420.1610.4260.1430.2120.20
RE0.5000.6270.4030.377-0.4830.3790.4910.3500.4690.450.2650.2270.1420.248-0.2110.1870.2350.1600.2140.21
SE0.5480.3530.4050.4780.351-0.4700.4470.2990.4220.420.2940.2180.3430.2450.287-0.2670.7180.4470.1620.33
InS0.1000.0330.1210.2180.0940.171-0.1400.0210.2100.120.2490.3320.1360.2330.3070.261-0.1510.3300.2590.25
PECE0.7070.4520.6020.4670.6910.5010.424-0.5260.5090.540.4080.1960.2000.2810.1910.2190.286-0.4420.2340.27
PESS0.3840.4670.3910.4290.3590.3590.3560.390-0.3850.390.0970.3440.1870.2860.2870.3400.1990.474-0.2790.28
PEPI0.2530.5160.2650.2990.3410.3580.2970.2770.349-0.330.1410.2120.2780.2070.2580.2080.1220.1440.229-0.20
avg mean0.38avg mean0.25
Table 11. AUC Results and Loss in Portability in low level of usage of Moodle group.
AUC (Numerical Datasets)AUC (Discretized Datasets)
CourseICS1MMMA1MA2KSCEHWAICS3ICS4avgICS1MMMA1MA2KSCEHWAICS3ICS4avg
ICS10.9170.5240.5230.5120.6530.4980.4910.4040.570.7610.4800.4850.4480.5310.5970.4700.5910.55
MM0.5010.8070.5590.6830.3470.4750.5190.4610.540.6390.6880.6300.5300.5590.6600.5380.4440.59
MA10.6760.5420.8800.4470.6740.5190.5050.4810.590.6440.5780.6970.5560.5680.3330.4720.4850.54
MA20.5190.6070.5740.9050.4860.4960.5210.4890.570.4570.5260.5320.6420.4840.4510.5180.5190.52
KSCE0.5940.5540.5630.3540.7050.6630.5450.5220.560.6740.5600.5740.4220.9310.6080.5700.4450.60
HWA0.4900.4340.4890.4280.5901.0000.5220.5120.560.6280.5160.5470.4920.5320.7780.5220.5160.57
ICS30.5540.5620.4570.4260.6530.7580.9380.5270.610.3750.4280.4540.5100.4560.5280.7070.5020.49
ICS40.4140.5630.5390.5500.4720.5210.4950.7710.540.4100.4430.3900.4750.4520.5000.4600.6820.48
avg mean0.57avg mean0.54
AUC LOSS (Numerical Datasets)AUC LOSS (Discretized Datasets)
CourseICS1MMMA1MA2KSCEHWAICS3ICS4avgICS1MMMA1MA2KSCEHWAICS3ICS4avg
ICS1-0.3930.3940.4060.2640.4190.4260.5130.40-0.2810.2760.3130.2300.1640.2910.1700.25
MM0.307-0.2490.1250.4600.3320.2880.3470.300.048-0.0570.1580.1290.0280.1500.2440.12
MA10.2040.337-0.4330.2060.3610.3740.3990.330.0530.119-0.1420.1290.3640.2250.2120.18
MA20.3860.2980.331-0.4190.4090.3840.4160.380.1850.1160.110-0.1580.1910.1240.1230.14
KSCE0.1120.1510.1420.351-0.0420.1600.1830.160.2580.3710.3570.510-0.3230.3610.4860.38
HWA0.5110.5660.5110.5730.410-0.4780.4880.510.1500.2620.2310.2870.246-0.2560.2620.24
ICS30.3840.3760.4810.5130.2850.180-0.4110.380.3330.2800.2530.1970.2510.179-0.2050.24
ICS40.3570.2080.2320.2220.2990.2500.277-0.260.2730.2390.2920.2070.2300.1820.222-0.23
avg mean0.34avg mean0.22

